

Abstract
Couples’ marital satisfaction is thought to decline over the newlywed years, but recent research indicates that the majority of spouses have high, stable trajectories during this period and significant declines occur only among initially dissatisfied spouses. These findings are drawn from predominantly White, middle-class samples, however, which may over-estimate marital stability compared to samples with higher levels of sociodemographic risk. Accordingly, the current study tested the generalizability of newlyweds’ marital stability by examining satisfaction trajectories among 431 ethnically diverse newlywed couples living in low-income neighborhoods. Consistent with previous work, most spouses had high levels of satisfaction, substantial declines were limited to spouses with lower initial levels of satisfaction, and divorce significantly differed between groups. Wives with higher levels of sociodemographic risk started marriage less satisfied and declined more in satisfaction. Overall, these findings reveal risky and resilient relationships among disadvantaged couples, with considerable stability during the newlywed years.
Keywords: couples, low-income, marital satisfaction, socioeconomic status, longitudinal
Longstanding research indicates that newlyweds perceive their marriages as less satisfying over time (e.g., Karney & Bradbury, 1997; Kurdek, 1998; VanLaningham, Johnson, & Amato, 2001), a phenomenon termed the “honeymoon-is-over” effect (Huston, McHale, & Crouter, 1986; Kurdek, 1998) or the “honeymoon then years of blandness” pattern (Aron, Norman, Aron, & Lewandowski, 2002, p. 182). In recent years, however, new research has challenged this long-held view. Advances in longitudinal methods such as group-based trajectory modeling (Nagin, 1999) have allowed scholars to move beyond describing the mean marital trajectory to instead identify distinct sets of trajectory patterns over time (for a review of group-based trajectory modeling of marital quality, see Proulx, Ermer, & Kanter, 2017). Results from several studies using group-based trajectory modeling to examine newlyweds’ marital satisfaction trajectories now show that the majority of spouses actually exhibit high levels of satisfaction and minimal (if any) declines; just a small subset of couples experience moderate-to-large declines in satisfaction, and only after beginning their marriages with relatively low levels of initial satisfaction (Birditt, Hope, Brown, & Orbuch, 2012; Lavner & Bradbury, 2010; Lavner, Bradbury, & Karney, 2012; Lorber, Erlanger, Heyman, & O’Leary, 2015). These findings challenge the notion that declines in marital satisfaction are inevitable, instead suggesting that the newlywed period is indeed one of considerable stability and happiness for the majority of couples and that substantial declines in satisfaction are limited to couples who started off with poorer marital quality.
These recent group-based studies represent a significant advance and fundamental shift in conceptual understanding of changes in newlywed marriage, but critical questions remain about the generalizability of these patterns. Most of these samples - like marital research in general (Karney & Bradbury, 2005) - include predominantly White, middle-class couples, thereby underrepresenting the experiences of racial/ethnic minority couples and/or couples living with low incomes. Risk for marital distress and dissolution is elevated among these groups (e.g., Bramlett & Mosher, 2002; Raley, Sweeney, & Wondra, 2015), likely due to the increased stress resulting from disadvantage (e.g., Conger, Conger, & Martin, 2010). These well-documented disparities suggest that sampling could have especially important implications for group-based trajectories studies: failing to include a diverse sample of couples may lead to overestimates of the degree to which most couples maintain high satisfaction over the newlywed years and underestimates of those who experience declines. Indeed, the one group-based study that included couples with a wider range of education and income levels and had roughly equal percentages of Black and White couples found that couples with lower levels of education, couples with lower incomes, and Black couples were overrepresented in the lowest satisfaction groups (Birditt et al., 2012). Additional research among a more diverse sample of couples can determine whether these marriages are also generally characterized by stability in marital satisfaction and provide a test of the generalizability of recent group-based trajectory findings.
Examining different patterns of change in marital satisfaction among a more diverse sample of newlywed couples can also shed light on how marriage changes within this group. The experiences of racial and ethnic minority couples living with low incomes are generally considered only in comparison to White couples, despite calls to examine within-group variability among this population (e.g., Bryant et al., 2010). Doing so is especially important in light of the findings described above—it is increasingly clear that mean patterns do not characterize all couples’ experiences, yet our understanding of disadvantaged couples’ marriages largely relies on mean trends. Applying group-based modeling approaches to these couples’ satisfaction trajectories can therefore provide much-needed information about within-group heterogeneity, offering a more nuanced portrayal of marital development that is likely to highlight patterns of risk and patterns of resilience among this population and potentially challenge assumptions about their relationships.
The current study aims to address these gaps and test the generalizability of recent group-based trajectory findings by examining marital trajectories over the first 4.5 years of marriage among a sample of ethnically diverse, first-married newlywed couples (76% Hispanic, 12% Black, 12% White) sampled from low-income neighborhoods.1 Specifically, we addressed the following research questions:
Are there distinct patterns of change in marital satisfaction among this higher-risk group of newlywed couples? Consistent with previous research, we predicted that there would be meaningful variability in spouses’ developmental patterns, with some spouses starting with high satisfaction that is stable or undergoes only slight declines and others starting with moderate or low levels of initial satisfaction that subsequently undergoes substantial declines. In examining these patterns, we were particularly interested in the relative percentage of couples falling within these groups and whether the majority of couples would fall in the highest trajectory groups, as in previous research.
Do rates of divorce differ between trajectory groups? Previous research indicates that couples in the lowest satisfaction groups had divorce rates that ranged from 2–6 times higher than those in the highest satisfaction groups (Birditt et al., 2012; Lavner & Bradbury, 2010; Lavner et al., 2012). Accordingly, we predicted that rates of divorce would be highest among couples with lower initial levels of satisfaction and/or faster rates of decline, but expected that divorce would also occur among higher-satisfaction marriages, consistent with prior research (e.g., Amato & Hohmann-Marriott, 2007; Lavner & Bradbury, 2012).
Does sociodemographic risk differ between trajectory groups? To better understand how social and economic disadvantage is associated with observed trajectory patterns, we compared trajectory groups on a cumulative index of sociodemographic risk that included information about partners’ age, education, income, use of public assistance, and availability of social support (Amato, 2014). We predicted that the lowest satisfaction group(s) would have the highest levels of sociodemographic risk.
Method
Sampling
The sampling procedure was designed to yield first-married newlywed couples in which both partners were of the same ethnicity (Hispanic, Black, or White), living in neighborhoods with a high proportion of low-income residents in Los Angeles County. Recently married couples were identified through names and addresses on marriage license applications. Addresses were matched with census data to identify applicants living in low-income communities, defined as census block groups wherein the median household income was no more than 160% of the 1999 federal poverty level for a 4-person family. Next, names on the licenses were weighted using data from a Bayesian Census Surname Combination, which integrates census and surname information to produce a multinomial probability of membership in each of four racial/ethnic categories (Hispanic, Black, Asian, and White/other). Couples were chosen using probabilities proportionate to the ratio of target prevalences to the population prevalences, weighted by the couple’s average estimated probability of being Hispanic, Black, or White, which are the three largest groups of people living in poverty in Los Angeles County (U.S. Census Bureau, 2002). A total of 3,793 couples were contacted through the addresses they listed on their marriage licenses, and offered the opportunity to participate in a longitudinal study of newlywed development. Of the 3,793 couples contacted, 2,049 could not be reached and 1,522 responded to the mailing and agreed to be screened for eligibility. Of those, 824 couples were screened as eligible (eligibility criteria included: the couple had actually married, neither partner had been previously married, and both spouses identified as Hispanic, African American, or Caucasian), and 658 of the eligible couples agreed to participate in the study, with 431 couples actually completing the study.
Participants
The sample comprised 431 couples who enrolled and completed the baseline assessment within the pre-specified sampling period. At baseline, marriages averaged 4.8 months in duration (SD = 2.5). Mean ages were 26.3 (SD = 5.0) for women and 27.9 (SD = 5.8) for men. Median household income was $45,000. For husbands, 21% had less than a HS degree, 27% had a HS degree, 33% had some college, and 20% had graduated college. For wives, 15% had less than a HS degree, 25% had a HS degree, 32% had some college, and 28% had graduated college. Twelve percent of couples were Black, 12% were Caucasian, and 76% were Hispanic.
Procedure
For the first four assessments, couples were visited in their homes by two trained interviewers who described the IRB-approved study and obtained written informed consent from each participant. Participants completed self-report measures orally with the interviewer and also completed other procedures not relevant to the current manuscript. Interviewers returned at 9 months (T2), 18 months (T3), and 27 months after baseline (T4) and administered the same protocol. Couples who reported that they had divorced or separated did not complete the interview. Couples were debriefed following each interview. Couples were paid $75 for T1, $100 for T2, $125 for T3, and $150 for T4. Data collection for T1 through T4 took place between 2009 and 2013.
The T5 assessment was designed as a more limited follow-up and thus procedures for this assessment differed from the previous four assessments in two respects. First, this assessment did not include a home visit. Instead, all couples were contacted via telephone and administered self-report questionnaires. Second, all data collection occurred within a two-month calendar window (February and March 2014), resulting in unequal spacing of visits between the Time 4 and Time 5 visits across the sample (whereas the previous visits occurred at similar intervals for all couples). On average, Time 5 occurred 23 months after T4 (SD = 5.0), which was 50 months after baseline and an average of 55 months into marriage. Each individual was compensated $25 for the T5 interview.
Measures
Marital satisfaction.
Marital satisfaction was assessed at all five time points using an eight-item questionnaire. Five items asked how satisfied the respondent was with certain areas of their marriage (e.g., “satisfaction with the amount of time spent together”) and were scored on a 5-point scale (1 = very dissatisfied, 2 = somewhat dissatisfied, 3 = neutral, 4 = somewhat satisfied, 5 = very satisfied). Three items asked to what degree the participant agreed with a statement about their marriage (e.g., “how much do you trust your partner”) and were scored on a 4-point scale (1 = not at all, 2 = not that much, 3 = somewhat, 4 = completely). Composite scores were created by summing all items; scores could range from 8 to 37. Descriptive statistics and alpha coefficients are shown in Table 1.
Table 1.
Descriptive statistics for marital satisfaction over time
| Husbands | Wives | |||||||
|---|---|---|---|---|---|---|---|---|
| Time Point | n | Mean | SD | Alpha | n | Mean | SD | Alpha |
| T1 | 431 | 33.90 | 3.05 | .70 | 431 | 33.15 | 3.39 | .70 |
| T2 | 374 | 33.43 | 3.71 | .78 | 375 | 32.83 | 3.69 | .75 |
| T3 | 359 | 33.44 | 3.50 | .76 | 359 | 32.38 | 4.08 | .77 |
| T4 | 335 | 33.02 | 4.05 | .83 | 336 | 32.30 | 4.15 | .79 |
| T5 | 262 | 32.44 | 3.99 | .78 | 269 | 31.38 | 4.71 | .81 |
Sociodemographic risk.
A couple-level sociodemographic risk index capturing each couple’s overall level of social and economic disadvantage was assessed at baseline using a 10-item index modeled after Amato (2014). Couples were given 1 point for the presence of each of the following: (a) either partner was under the age of 23, (b) husband had less than a high school education, (c) wife had less than a high school education, (d) husband was unemployed, (e) wife was unemployed, (f) couple’s income was below the poverty line, (g) husband was receiving public assistance, (h) wife was receiving public assistance, (i) husband reported no one to help in an emergency, and (j) wife reported no one to help in an emergency. The mean score was 2.47 (SD = 2.12), with a range of 0 – 9.
Results
Analytic Plan
Consistent with previous studies, we used group-based trajectory modeling to examine trajectories of marital satisfaction for husbands and wives. This analytic approach identifies latent clusters of individuals following similar trajectories over time for the outcome of interest (Nagin, 1999). To better capture the dyadic nature of the data, trajectories were estimated jointly for husbands and wives using dual trajectory analysis (Nagin, 2005). We determined the number of groups that best fit the data by estimating models with more groups and evaluating fit using the Bayesian Information Criterion (BIC). In this analytic approach, BIC is always negative, and greater values (i.e., less negative) indicate better fit (Nagin, 1999). We established a priori that we would choose the number of groups at which the BIC value was the greatest, provided that the smallest group constituted at least 6% of the sample (approximately 25 individuals) to be consistent with previous research which allowed for groups no smaller than this size (e.g., Kanter, Proulx, & Monk, 2018; Lavner et al., 2012).
Parameters defining the shape of the trajectory were left free to vary across groups, and these coefficients were then used to calculate each individual’s probability of group membership (posterior probability). Individuals were assigned to the trajectory group with which their posterior probability was greatest (Nagin, 1999). Once individuals were categorized as belonging to a certain trajectory group, they were assumed to have a similar pattern as all other individuals in that group. However, individuals in a trajectory group might have trajectories that do not exactly match the overall group trajectory, even if they followed approximately the same developmental course (Nagin & Tremblay, 2005). Models were initially estimated with intercept, linear, and quadratic coefficients, which were removed when analyses indicated they were not significant for particular groups, starting with the highest order parameters and refitting the model until all parameters in all groups were significant.
We estimated models using the Stata traj plugin (Jones & Nagin, 2013). As this procedure accommodates missing data, we estimated trajectories using all available observations. Because group-based trajectory modeling identifies naturally occurring trajectories in the data rather than testing a priori hypotheses, it produces no test statistics or effect sizes and is not subject to power analysis. However, the sample does need to be large enough to capture naturally occurring groups without over-fitting the data to small, idiosyncratic groups. Our sample of 431 couples is the largest sample of couples to be used in group-based trajectory modeling of relationship outcomes (Proulx et al., 2017) and is similar to sample sizes used in other domains (Nagin, 1999).
Marital Satisfaction Trajectories for Husbands and Wives
Trajectory Group Estimation.
We began by estimating models with one trajectory group to identify the common trajectory across the sample. Results indicated that, on average, relationship satisfaction significantly declined over time (husbands: linear slope = −.030, p < .001, wives: linear slope = −.036, p < .001). We then calculated BIC values for two groups to determine whether a multi-group approach was justified by providing a better fit to the data. The BIC values increased from one-group (BIC = −9302.57) to two-group (BIC = −8750.60) models, which indicates that a single group did not provide the best fit to the data. We increased group number until best fit was achieved. The BIC values continued to increase for the three-group (BIC = −8654.90) and four-group (BIC = −8608.38) models, but the smallest group fell below the 6% threshold for the four-group model at 4%. Accordingly, we adopted the three-group model. Final parameter estimates are shown in Table 2 and observed trajectories are shown in Figure 1.
Table 2.
Marital satisfaction trajectory parameter estimates
| Husbands | Wives | |||||||||
|---|---|---|---|---|---|---|---|---|---|---|
| Trajectory group | n | % | Intercept | Linear | Quadratic | n | % | Intercept | Linear | Quadratic |
| High | 238 | 55 | 36.26*** | −0.02*** | -- | 271 | 63 | 35.17*** | −0.02*** | -- |
| Moderate | 162 | 38 | 32.64*** | −0.05*** | -- | 112 | 26 | 31.68*** | −0.05*** | -- |
| Low | 31 | 7 | 27.90*** | −0.26*** | 0.01*** | 48 | 11 | 27.67*** | −0.11*** | -- |
Notes. N = 431 Couples.
p < .01,
p < .001.
Figure 1.
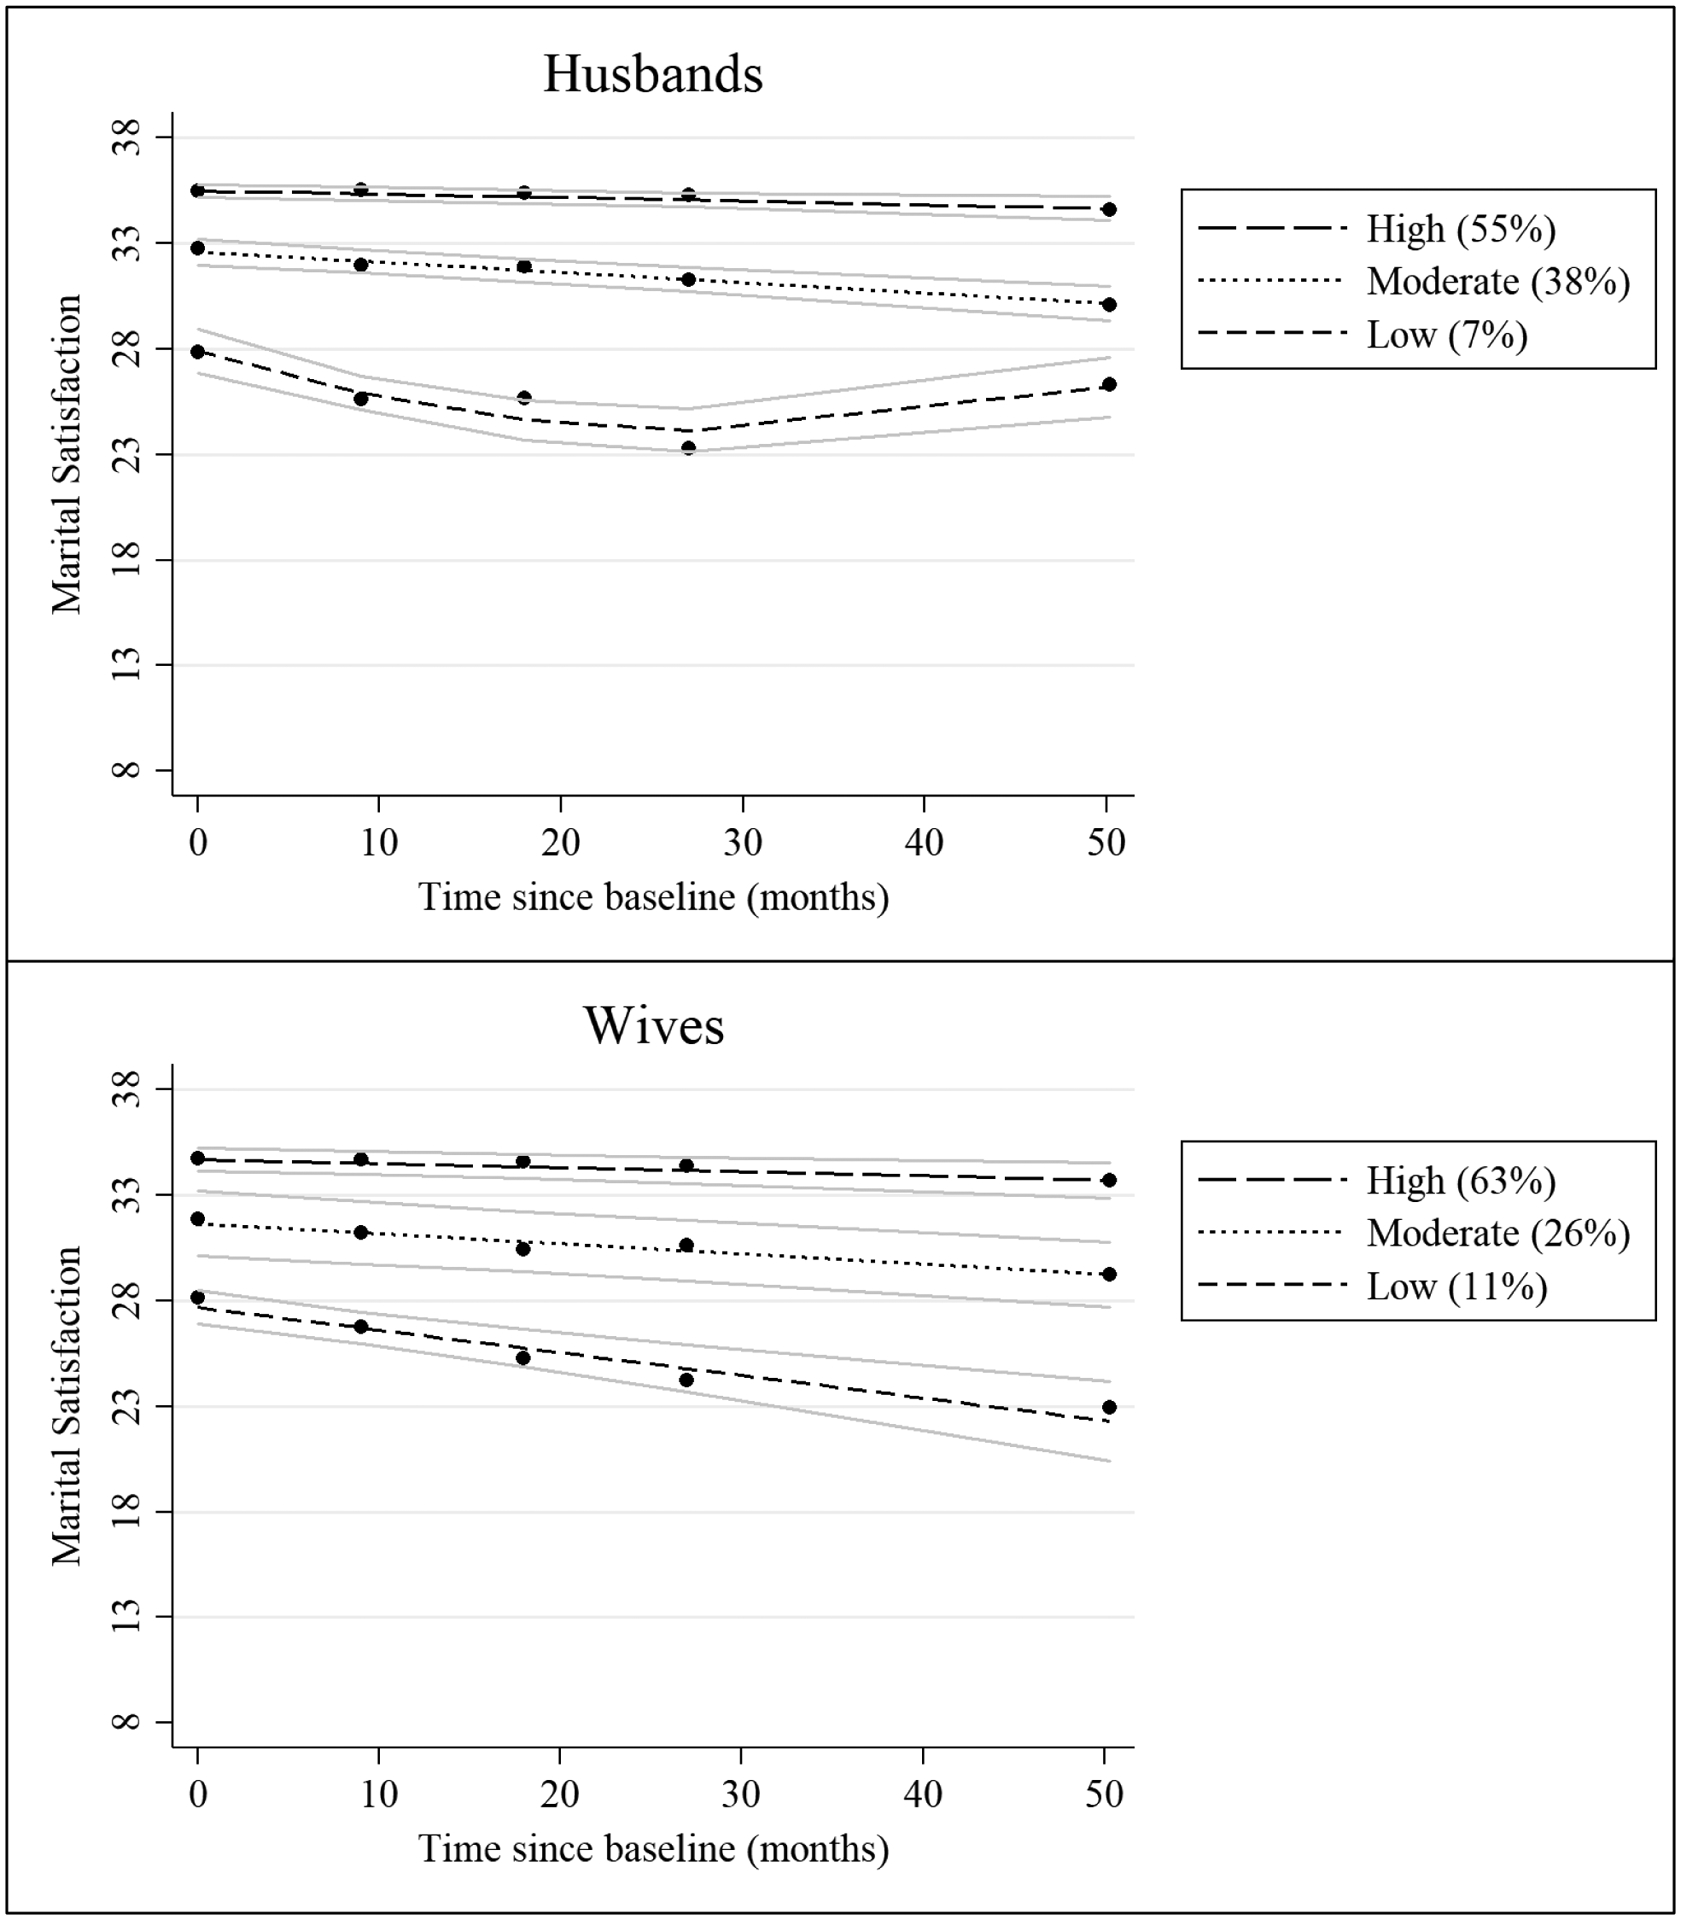
Husbands’ and wives’ marital satisfaction trajectory groups. Observed data are represented by black dots, estimated trajectories are represented by black lines, and 95% confidence intervals around estimated trajectories are represented by gray lines.
Results for Husbands.
The largest group of husbands (“High Satisfaction”; 55%) had significant intercepts and very small, but significant, negative slopes, indicating that their satisfaction started high and declined slightly over time. The second-largest group of husbands (“Moderate Satisfaction”; 38%) began with moderately high initial satisfaction before experiencing a modest linear decline in satisfaction. Lastly, there was a small group of husbands (“Low Satisfaction”; 7%) who began with relatively low levels of initial satisfaction and then experienced a substantial decline in satisfaction, along with a small but significant quadratic effect in which their satisfaction recovered slightly over time.2 All intercept and slope parameters differed significantly between all three groups, such that the High Satisfaction group had the highest initial level of satisfaction and the smallest decline in satisfaction, the Low Satisfaction group had the lowest initial level of satisfaction and the greatest decline in satisfaction, with the Moderate Satisfaction group falling between the two.
Results for Wives.
The three groups yielded by the model for wives were very similar, although not identical, to the husbands’ groups. Again, the largest group of wives (“High Satisfaction”; 63%) had significant intercepts and very small, but significant, negative slopes, indicating that their satisfaction started high and declined slightly over time. The second-largest group of wives (“Moderate Satisfaction”; 26%) began with a moderately high initial level of satisfaction and then experienced modest declines over time. The third group of wives (“Low Satisfaction”; 11%) began with low levels of satisfaction and then experienced large linear declines in satisfaction.3 All intercept and slope parameters differed significantly between all three groups, such that the High Satisfaction group had the highest initial level of satisfaction and the smallest decline in satisfaction, the Low Satisfaction group had the lowest initial level of satisfaction and the greatest decline in satisfaction, with the Moderate Satisfaction group falling between the two.
Comparison of Husbands’ and Wives’ Trajectory Groups.
Joint trajectory modeling allows for the comparison of parameters between husbands and wives because they are estimated within the same model. Husbands and wives in the High Satisfaction group differed significantly in their intercept (χ2(1, N = 431) = 12.36, p < .001, r = .17), indicating that the High Satisfaction husbands began their marriage more satisfied than the High Satisfaction wives. There were no significant differences in intercepts between husbands and wives in the Low and Moderate Satisfaction groups. Husbands and wives in the Low Satisfaction group differed significantly in their slope (χ2(1, N = 431) = 7.93, p = .005, r = .14), indicating that wives in the Low Satisfaction group declined more in satisfaction than husbands in the Low Satisfaction group. There were no significant differences in slopes between husbands and wives in the Moderate and High Satisfaction groups.
We also compared group membership between husbands and wives. Table 3 shows the complete 3 × 3 cross-tabulation of husband and wife trajectory groups. Husband and wife group membership was significantly associated (χ2 (4, N = 431) = 170.98, p < .001, Cramer’s V = .45). To simplify interpretation of Table 3, we computed the percentage of couples in which husbands and wives were in the same trajectory group, couples in which husbands were in a lower trajectory group than their wives, and couples in which wives were in a lower trajectory group than their husbands. In the majority of couples (285 of 431 couples or 66%), husbands and wives were in the same trajectory group; in 62 of 431 couples (14%), wives were in a lower trajectory group than their husbands; and in 84 of 431 couples (19%), husbands were in a lower trajectory group than their wives.
Table 3.
Husband - Wife Cross-Tabulations and Divorce Rates
| Husband’s Group | ||||
|---|---|---|---|---|
| Wife’s Group | Low | Moderate | High | Total |
| Low | 21 (33%) | 20 (25%) | 7 (14%) | 27% |
| Moderate | 9 (22%) | 68 (9%) | 35 (9%) | 10% |
| High | 1 (100%) | 74 (11%) | 196 (11%) | 11% |
| Total | 32% | 12% | 11% | |
Note. Cell numbers represent the number of cross-tabulated group members. Numbers in parentheses represent the percent of cross-tabulated group members who divorced. Bolded numbers represent the total divorce rate by trajectory group
Marital Dissolution by Trajectory Grouping
Our second aim was to examine whether trajectory groups differed in rates of marital dissolution. Overall, 12.7% of the sample (n = 55 couples) divorced over the 4.5 years of the study. Divorce rates for husbands’ groups, wives’ groups, and each cross-tabulated husband-wife group are shown in Table 3. Rates of marital dissolution differed significantly between husbands’ trajectory groups, χ2 (2, N = 431) = 11.46, p = .003, φ = .16, ranging from 11% in the High Satisfaction and 12% in the Moderate Satisfaction groups to 32% in the Low Satisfaction group. Rates of marital dissolution also differed significantly between wives’ trajectory groups, χ2 (2, N = 431) = 10.14, p = .006, φ = .15, ranging from 11% in the High Satisfaction group and 10% in the Moderate Satisfaction Group to 27% in the Low Satisfaction group. Marital dissolution rates among the cross-tabulated husband-wife trajectory groupings also indicated that rates were highest when one or both spouses were in a Low Satisfaction group: couples in which one or both partners were in a Low Satisfaction group had a marital dissolution rate of 28%, whereas couples in which both partners were in either the Moderate or High Satisfaction groups had a marital dissolution rate of 10% (χ2 (1, N = 431) = 13.23, p < .001, φ = .18).
Sociodemographic Risk by Trajectory Grouping
The final aim of the study was to examine whether sociodemographic risk was associated with trajectory group membership. For husbands there were no significant differences in level of risk across the three groups [Low mean = 3.10, SD = 2.39; Moderate mean = 2.44, SD = 2.20; High mean = 2.41, SD = 2.02; F(2, 430) = 1.47, p = .231, f = .08]. For wives, the level of sociodemographic risk differed significantly across the three groups (F(2, 430) = 4.76, p = .009, f = .14). Post hoc comparisons indicated that the Low Satisfaction group (mean = 3.35, SD = 2.44) had a significantly higher level of risk than the Moderate Satisfaction (mean = 2.35, SD = 1.99, p = .016, f = .13) and High Satisfaction (mean = 2.37, SD = 2.37, p = .008, f = .14) groups, which did not significantly differ from each other (p = .997, f = .01). Lastly, we tested whether the trajectory groups differed in their racial/ethnic composition. There were no differences in the proportion of White vs. Black vs. Hispanic couples in the husband or wife trajectory groups (husbands: χ2(4) = 1.57, p = .815, φ = .06; wives: χ2(4) = 6.39, p = .172, φ = .12).
Discussion
Overall, results were largely consistent with our hypotheses and with previous work examining trajectories of marital satisfaction. Consistent with our first hypothesis, there were distinct patterns of change in marital satisfaction among this sample of ethnically diverse, first-married newlywed couples living in low-income neighborhoods. Trajectory patterns were generally similar for husbands and wives and included one group with high initial levels of satisfaction that underwent only slight declines, one group with moderately high levels of satisfaction that underwent modest declines, and a third group with lower initial levels of satisfaction that underwent more substantial declines. The observed patterns extend previous research with predominantly White and middle-class samples (for a review, see Proulx et al., 2017) and offer further support for several emerging insights into how newlywed marriage changes. First, the majority of husbands (55%) and wives (63%) were in the highest satisfaction group, and the most common couple-level pattern was one in which both partners were in the highest satisfaction groups (45% of the sample). These patterns are consistent with the idea that the newlywed period is marked by sustained high levels of satisfaction for most couples and in sharp contrast to the long-discussed “honeymoon-is-over” effect (e.g., Huston et al., 1986). Our findings also indicated that substantial declines in satisfaction were limited to the small subset of newlyweds who started their marriage with low levels of satisfaction. Although husbands in the lowest group had an increase in satisfaction over the final wave of the study, their satisfaction remained significantly lower than that of other husbands and below that of their initial starting point, reflecting the notion of “honeymoon-as-ceiling” whereby spouses do not improve on marital quality from where they started at marital baseline (Proulx et al., 2017, p. 322). More generally, the fact that spouses were robustly distinguished by their intercepts (which were subsequently related to their slopes) underscores how newlyweds’ initial levels of functioning are a potent predictor of how their marriages unfold (e.g., Lavner et al., 2012). Indeed, consistent with our second hypothesis, divorce rates were nearly three times higher among individuals in the lowest satisfaction groups than for individuals in the moderate and high satisfaction groups, with similar disparities found based on couple-level groupings as well. These findings indicate that risk for marital dissolution can be differentially parsed among subgroups, such that couples at greatest risk for divorce are those in which one or both partners have low initial levels of satisfaction that undergo significant declines over time.
We also examined the role of sociodemographic risk in predicting these patterns, finding partial evidence for our third hypothesis that couples with higher levels of sociodemographic risk would be disproportionately represented among the lowest trajectory groups. This was true for wives but not husbands, such that wives in the lowest trajectory grouping averaged one additional couple-level risk factor compared to wives in the middle and highest groups. These results extend previous work by Birditt and colleagues (2012) with a diverse sample of newlyweds in which couples with lower levels of education, couples with lower incomes, and Black couples were overrepresented in the lowest satisfaction groups, though contrast with other work indicating that demographics did not distinguish among trajectory groups (e.g., Lavner et al., 2012). These discrepant findings are likely due to the fact that sample demographics may matter more when there is a greater degree of variability and/or risk in the sample, as was the case here. Accordingly, although the current findings largely replicate prior patterns, it will continue to be important for marital researchers to consider the level of sociodemographic risk in their samples, as the relative percentage of couples with different trajectory patterns may vary - at least in part - as a function of this risk.
Overall, the current study represents an important test of the generalizability of emerging findings regarding the degree of stability in newlywed marriage, showing that these findings remain robust in a sample with more sociodemographic risk while also highlighting the potential for risk to affect these patterns. At the same time, we acknowledge several limitations as well. First, we did not sample all forms of diversity - these were all different-sex couples recruited from Los Angeles County, and only couples who were Hispanic, Black, or White were included. It will be important for future work to consider other underrepresented couples (e.g., same-sex couples, Asian and Pacific/Islander couples, mixed race couples) and how their marriages change. Second, although the 50-month study window represents a notable strength of the study, longer follow-up assessments will provide additional insight into how these marriages continue to evolve and change over time (see Birditt et al., 2012). Finally, these were all newlywed couples in their first marriages. Results may not generalize to remarriages and cannot speak to how relationships change among unmarried couples.
Notwithstanding these limitations, the current study of ethnically diverse couples living in low-income neighborhoods provides evidence for the generalizability of recent findings among predominantly White, middle class samples (see Proulx et al., 2017, for review) by indicating that the majority of newlyweds are highly satisfied over time, with only slight declines in satisfaction, whereas substantial declines are isolated among the smaller subset of newlyweds who start their marriages with lower levels of satisfaction. These findings are also important in highlighting meaningful heterogeneity in newlyweds’ marital trajectories among demographically high-risk couples. Couples with these demographic profiles are typically considered only in comparison to other groups (e.g., more financially stable couples, White couples), whose risk for marital distress and dissolution is lower (e.g., Bramlett & Mosher, 2002; Raley, Sweeney, & Wondra, 2015). The current findings reveal risky and resilient relationships among this relatively disadvantaged group, however, underscoring the importance of considering within-group variability to provide a more accurate, complete, and non-stigmatizing picture of these relationships (e.g., Bryant et al., 2010).
Going forward, it will be important to examine the factors characterizing individuals in different trajectory groups. For example, previous work has indicated that spouses with different trajectories can be distinguished on the basis of a broad set of individual (e.g., personality, self-esteem), relational (communication, relationship attributions), and external (e.g., acute and chronic stress) factors (e.g., Lavner & Bradbury, 2010), consistent with theoretical perspectives on relationship functioning emphasizing the importance of couples’ enduring vulnerabilities, adaptive processes, and external circumstances (Karney & Bradbury, 1995). Additionally, it will be important to consider stressors and supports that are particularly relevant to this population, including financial strain, racial discrimination, protective racial identity, social networks, religiosity, and coping strategies, and how these factors serve to hinder or promote relationship functioning. Doing so can advance understanding of marital development and inform interventions and policy to enhance couple and family well-being among disadvantaged populations.
Acknowledgments
Collection of data reported in this manuscript was supported by Research Grants HD053825 and HD061366 from the National Institute of Child Health and Human Development awarded to Benjamin R. Karney. The authors gratefully acknowledge Thomas N. Bradbury and Benjamin R. Karney for providing resources and feedback on this project.
Author Biographies
Hannah C. Williamson is an Assistant Professor of Human Development and Family Sciences and a faculty affiliate of the Population Research Center at The University of Texas at Austin.
Justin A. Lavner is an Assistant Professor of Psychology at the University of Georgia.
Footnotes
Other papers have been published using data from this sample to investigate other research questions (e.g., how a history of child abuse predicts marital satisfaction, Nguyen, Karney, & Bradbury, 2017; how marital satisfaction is reciprocally associated with couple communication over time, Lavner, Karney, & Bradbury, 2016), but this is the first to use five waves of data and the first to use group-based trajectory modeling.
To test whether the significant quadratic parameter was an artifact of divorced individuals leaving the sample, leading to an increase in satisfaction at T5 when only continuously married individuals contributed data to the trajectory estimation, the same trajectory specification was modeled with all divorced individuals removed from the sample (continuously married n = 376). The pattern of results within the three trajectory groups did not change, and in particular the quadratic parameter of the Low Satisfaction group remained significant, indicating that the small increase in husbands’ marital satisfaction over time was not an artifact of attrition due to divorce.
The pattern of results for the wives’ three trajectory groups did not change when divorced individuals were removed from the sample.
This paper is not the copy of record and may not exactly replicate the final, authoritative version of the article. The final article is available at https://doi.org/10.1177/1948550619865056
Contributor Information
Hannah C. Williamson, The University of Texas at Austin
Justin A. Lavner, University of Georgia
References
- Amato PR (2014). Does social and economic disadvantage moderate the effects of relation education on unwed couples? An analysis of data from the 15-month Building Strong Families evaluation. Family Relations, 63, 343–355. doi: 10.1111/fare.12069 [DOI] [Google Scholar]
- Amato PR, & Hohmann-Marriott B (2007). A comparison of high-and low-distress marriages that end in divorce. Journal of Marriage and Family, 69, 621–638. doi: 10.1111/j.1741-3737.2007.00396.x [DOI] [Google Scholar]
- Aron A, Aron E (1986). Love and the expansion of self: Understanding attraction and satisfaction. New York: Hemisphere. [Google Scholar]
- Aron A, Norman C, Aron E, & Lewandowski G (2002). Shared participation in self-expanding activities. In Feeney J & Noller P(Eds.), Understanding marriage: Developments in the study of couple interaction (pp. 177–194). New York: Cambridge University Press. [Google Scholar]
- Birditt KS, Hope S, Brown E, & Orbuch T (2012). Developmental trajectories of marital happiness over 16 years. Research in Human Development, 9, 126–144. doi: 10.1080/15427609.2012.680844 [DOI] [Google Scholar]
- Bramlett MD, & Mosher WD (2002). Cohabitation, marriage, divorce, and remarriage in the United States. Hyattsville, MD: National Center for Health Statistics. [PubMed] [Google Scholar]
- Bryant CM, Wickrama KAS, Bolland J, Bryant BM, Cutrona CE, & Stanik CE (2010). Race matters, even in marriage: Identifying factors linked to marital outcomes for African Americans. Journal of Family Theory & Review, 2, 157–174. doi: 10.1111/j.1756-2589.2010.00051.x [DOI] [Google Scholar]
- Copen CE, Daniels K, Vespa J, & Mosher WD (2012). First marriages in the United States: Data from the 2006–2010 National Survey of Family Growth. Hyattsville, MD: National Center for Health Statistics. [PubMed] [Google Scholar]
- Fincham FD, & Bradbury TN (1987). The assessment of marital quality: A reevaluation. Journal of Marriage and the Family, 49, 797–809. doi: 10.2307/351973 [DOI] [Google Scholar]
- Huston TL, McHale SM, & Crouter AC (1986). When the honeymoon’s over: Changes in the marriage relationship over the first year. In Gilmour R& Duck S(Eds.), The emerging field of personal relationships (pp. 109–132). Hillsdale, NJ: Erlbaum. [Google Scholar]
- Jones BL, & Nagin DS (2013). A note on a Stata plugin for estimating group-based trajectory models. Sociological Methods & Research, 42, 608–613. doi: 10.1177/0049124113503141 [DOI] [Google Scholar]
- Kanter JB, Proulx CM, & Monk JK (2018). Accounting for divorce in marital research: An application to growth mixture modeling. Journal of Marriage and Family. Advance online publication. 10.1111/jomf.12547 [DOI] [Google Scholar]
- Karney BR, & Bradbury TN (1995). The longitudinal course of marital quality and stability: A review of theory, method, and research. Psychological Bulletin, 118, 3–34. doi: 10.1037/0033-2909.118.1.3 [DOI] [PubMed] [Google Scholar]
- Karney BR, & Bradbury TN (1997). Neuroticism, marital interaction, and the trajectory of marital satisfaction. Journal of Personality and Social Psychology, 72, 1075–1092. doi: 10.1037/0022-3514.72.5.1075 [DOI] [PubMed] [Google Scholar]
- Karney BR, & Bradbury TN (2005). Contextual influences on marriage: Implications for policy and intervention. Current Directions in Psychological Science, 14, 171–174. doi: 10.1111/j.0963-7214.2005.00358.x [DOI] [Google Scholar]
- Kurdek LA (1998). The nature and predictors of the trajectory of change in marital quality over the first 4 years of marriage for first-married husbands and wives. Journal of Family Psychology, 12, 494–510. doi: 10.1037/0893-3200.12.4.494 [DOI] [PubMed] [Google Scholar]
- Lavner JA, & Bradbury TN (2010). Patterns of change in marital satisfaction over the newlywed years. Journal of Marriage and Family, 72, 1171–1187. doi: 10.1111/j.1741-3737.2010.00757.x [DOI] [PMC free article] [PubMed] [Google Scholar]
- Lavner JA, & Bradbury TN (2012). Why do even satisfied newlyweds eventually go on to divorce? Journal of Family Psychology, 26, 1–10. doi: 10.1037/a0025966 [DOI] [PMC free article] [PubMed] [Google Scholar]
- Lavner JA, Bradbury TN, & Karney BR (2012). Incremental change or initial differences? Testing two models of marital deterioration. Journal of Family Psychology, 26, 606–616. doi: 10.1037/a0029052 [DOI] [PMC free article] [PubMed] [Google Scholar]
- Lavner JA, Karney BR, & Bradbury TN (2016). Does couples’ communication predict marital satisfaction, or does marital satisfaction predict communication? Journal of Marriage and Family, 78, 680–694. doi: 10.1111/jomf.12301 [DOI] [PMC free article] [PubMed] [Google Scholar]
- Lavner JA, Weiss B, Miller JD, & Karney BR (2018). Personality change among newlyweds: Patterns, predictors, and associations with marital satisfaction over time. Developmental Psychology, 54, 1172–1185. doi: 10.1037/dev0000491 [DOI] [PMC free article] [PubMed] [Google Scholar]
- Lorber MF, Erlanger ACE, Heyman RE, & O’Leary KD (2015). The honeymoon effect: Does it exist and can it be predicted? Prevention Science, 16, 550–559. doi: 10.1007/s11121-014-0480-4 [DOI] [PubMed] [Google Scholar]
- Markman HJ, Whitton SW, Kline GH, Stanley SM, Thompson H, St. Peters M, … & Gilbert K (2004). Use of an empirically based marriage education program by religious organizations: Results of a dissemination trial. Family Relations, 53, 504–512. doi: 10.1111/j.0197-6664.2004.00059.x [DOI] [Google Scholar]
- Nagin DS (1999). Analyzing developmental trajectories: A semiparametric, group-based approach. Psychological Methods, 4, 139–157. doi: 10.1037/1082-989X.4.2.139 [DOI] [PubMed] [Google Scholar]
- Nagin DS (2005). Group-Based Modeling of Development. Cambridge, MA: Harvard University Press. [Google Scholar]
- Nagin DS, & Tremblay RE (2005). Developmental trajectory groups: Facts or a useful statistical fiction? Criminology: An Interdisciplinary Journal, 43, 873–904. doi: 10.1111/j.1745-9125.2005.00026.x [DOI] [Google Scholar]
- Nguyen TP, Karney BR, & Bradbury TN (2016). Childhood abuse and later marital outcomes: Do partner characteristics moderate the association? Journal of Family Psychology, 31, 82–92. doi: 10.1037/fam0000208 [DOI] [PMC free article] [PubMed] [Google Scholar]
- Proulx CM, Ermer AE, & Kanter JB (2017). Group-based trajectory modeling of marital quality: A critical review. Journal of Family Theory & Review, 9, 307–327. doi: 10.1111/jftr.12201 [DOI] [Google Scholar]
- Raley RK, Sweeney MM, & Wondra D (2015). The growing racial and ethnic divide in US marriage patterns. The Future of Children, 25, 89–109. [DOI] [PMC free article] [PubMed] [Google Scholar]
- U.S. Census Bureau. (2002). Summary population and housing characteristics: California. Washington, DC: Government Printing Office. [Google Scholar]
- VanLaningham J, Johnson DR, & Amato PR (2001). Marital happiness, marital duration, and the U-shaped curve: Evidence from a five-wave panel study. Social Forces, 79, 1313–1341. doi: 10.1353/sof.2001.0055 [DOI] [Google Scholar]
- Williamson HC, Altman N, Hsueh J, & Bradbury TN (2016). Effects of relationship education on couple communication and satisfaction: A randomized controlled trial with low-income couples. Journal of Consulting and Clinical Psychology, 84, 156–166. doi: 10.1037/ccp0000056 [DOI] [PubMed] [Google Scholar]