

Abstract
Divorced individuals offer explanations for why their relationship ended, yet little is known about the development of these problems during the relationship. Problems that lead to divorce may exist at the beginning of the marriage (enduring dynamics model) or may develop over time (emergent distress model). We asked 40 divorced individuals about the reasons for their divorce and compared the development of problems that did and did not contribute to their divorce over the first few years of their marriage. Results support an emergent distress model for wives; they saw problems that lead to divorce increasing over time, whereas results for husbands indicated that they were less attuned to problems overall, suggesting that wives are the bellwether for relationship problems.
Keywords: Divorce, Marriage, Relationship Problems
Roughly half of all first marriages end in divorce, elevating rates of economic, physical, and psychological difficulties for all family members (e.g., Sbarra, Law, & Portley, 2011). To understand the causes of divorce, retrospective reports from former spouses provide valuable insights (e.g., Amato & Previti, 2003; Bodenmann et al., 2007), yet they are incapable of illuminating how problems that lead to divorce developed over the course of the marriage. Two models of relationship deterioration – the enduring dynamics model and the emergent distress model – make opposing predictions about how this development might occur (Huston et al., 2001): Problems that lead to divorce could be apparent from the beginning of the relationship (enduring dynamics model), or they could arise and then worsen over the course of the relationship (emergent distress model). Distinguishing between these possibilities would further our understanding of the early relationship dynamics that lead to divorce.
A robust literature has identified the common problems to which formerly-married individuals attribute their divorce. For example, an analysis of retrospective reports from a national sample of divorced individuals highlights infidelity, incompatibility, drinking or drug use, and growing apart as leading reasons for dissolution (Amato & Previti, 2003). Similarly, when divorced individuals were asked to name problems that were major contributors to their divorce, top responses included lack of commitment, infidelity, and conflict/arguing (Scott, Rhoades, Stanley, Ellen, & Markman, 2013). While this information helps characterize how divorced individuals understand their experience, its practical utility would be greater if we understood how these problems were experienced during the relationship.
To our knowledge, no study has yet combined data obtained from the same individuals before and after their divorce to examine how problems develop over time in marriages that dissolve. Existing studies of relationship problems provide descriptive information about the problems married couples face, with communication difficulties, time spent together, sex, money, and household management being rated as most common (e.g., Boisvert, Wright, Tremblay & McDuff, 2011; Storaasli & Markman, 1990). One study used aggregate indices of problems, including total number of problems, sum of severity of all problems, and most severe problem, to examine how problems develop longitudinally in continually married couples (Lavner, Karney, & Bradbury, 2014.) These aggregate indices were found to stay stable across the newlywed years, but when specific problems were considered four of nineteen problems for husbands and three of nineteen problems for wives changed, either positively or negatively.
Despite evidence that problems are stable on average among couples who remain married, it is possible that this is not the experience for couples who go on to divorce. Specifically, we would expect that couples who divorce experience worse or worsening problems, and there are two ways in which this could occur: the enduring dynamics model in which the problems that contribute to divorce are elevated from the beginning, or the emergent distress model in which problems arise and worsen during the relationship. There is intuitive logic to the emergent distress model: couples get married because they are relatively happy, and presumably perceive few serious problems at the start of their marriage. Divorce may be the result of problems arising over time, eroding what was once a happy and problem-free relationship. Yet Lavner and colleagues’ (2014) longitudinal study of problems found support for the enduring dynamics model, calling in to question the assumption that specific problems must worsen in order for relationships to deteriorate and dissolve. Lavner and colleagues did not examine divorce as a moderator, however, leaving open the possibility that problems are only stable for couples who remain married while they may worsen for the subsample of couples who go on to divorce.
Thus, the current study seeks to test the enduring dynamics and emergent distress models, using an ethnically and socioeconomically diverse sample. Based on Lavner and colleagues’ finding that relationship problems do not worsen on average, and the fact that our sample consists of couples who divorced within four years of marriage, we expect to see support for the enduring dynamics model, i.e., initial elevations in the problems that partners later report as contributing to their divorce. Additionally, we predict that women will be more likely than men to perceive problems in their relationship that lead to divorce, as a number of studies suggest that wives track relationship functioning more closely than do their husbands (e.g., Heaton & Blake, 1999; Hewitt, Western, & Baxter, 2006), and divorcing husbands are more likely than their wives to say they do not know why their relationship ended (Kitson & Holmes, 1992). To evaluate these two hypotheses, we draw upon a five-wave longitudinal design that includes data from individuals and couples provided before and after their divorce.
Method
Sampling
The sampling procedure was designed to yield first-married newlywed couples in which both partners were of the same ethnicity (Hispanic, African American, or Caucasian), living in neighborhoods with a high proportion of low-income residents in Los Angeles County. Recently married couples were identified through names and addresses on marriage license applications. Addresses were matched with census data to identify applicants living in low-income communities, defined as census block groups wherein the median household income was no more than 160% of the 1999 federal poverty level for a 4-person family. Next, names on the licenses were weighted using data from a Bayesian Census Surname Combination, which integrates census and surname information to produce a multinomial probability of membership in each of four racial/ethnic categories (Hispanic, African American, Asian, and Caucasian/other). Couples were chosen using probabilities proportionate to the ratio of target prevalences to the population prevalences, weighted by the couple’s average estimated probability of being Hispanic, African American, or Caucasian, which are the three largest groups of people living in poverty in Los Angeles County (U.S. Census Bureau, 2002).
Participants
The 431 identified couples participated in data collection five times over the following 58 months. By the final time point (T5) 55 couples had divorced (n = 20) or separated (n = 35). Partners from these 55 couples were contacted and asked to participate in a short interview about their divorce/separation. For 30 couples, one (n = 20) or both (n = 10) spouses participated in the phone interview. For 25 couples both spouses could not be reached or refused to participate. In total, 23 women and 17 men provided data for the current analysis1
The average duration of marriage before dissolution was 2.6 years (SD = 1.3) and couples had been divorced/separated for 1.6 years (SD = 1.2) on average, with a range of 1 month to 4 years. At T5 women’s mean age was 30.0 (SD = 4.8), and men’s mean age was 30.7 (SD = 5.6). Participants were predominantly Hispanic (57%), with the rest of the sample comprised of African American (27%) and Caucasian (16%) individuals. At T1 18% of men and 17% of women had children; by T5 this had increased to 41% of men and 61% of women. At T5 women had a mean monthly income of $3,100 (SD = $2,526), and a median monthly income of $2,200 over the past 30 days. Men had a mean monthly income of $3,376 (SD = $3,593) and a median monthly income of $2,500 over the past 30 days.
Procedure
At baseline (T1), couples were visited in their homes by two interviewers who took spouses to separate areas to ensure privacy and orally administered self-report measures. Interviewers returned at 9 months (T2), 18 months (T3), and 27 months after baseline (T4) and administered the same interview protocol. Couples who reported that they had divorced or separated did not complete the interview. Following each interview couples were debriefed and paid $75 for T1, $100 for T2, $125 for T3 and $150 for T4. At Time 5 (T5), which occurred an average of 22 months after T4, all intact couples and spouses from dissolved couples were contacted via telephone. Participants who were known to be divorced/separated, and those who indicated that they had divorced/separated since T4 were administered a short self-report interview about their divorce/separation. Each individual was compensated $25 for the T5 interview. Data collection took place between 2009 and 2013 for T1 through T4. Collection of T5 data occurred in February and March 2014.
Measures
Relationship Problems.
At T1-T4, participants were read a list of 28 potential problems in a relationship (adapted from the Relationship Problem Inventory; Geiss & O’Leary, 1981) and asked to “rate how much that issue is a source of difficulty or disagreement for you and your spouse, on a scale from 0 to 10. At the low end of the scale (0–2) are issues that rarely if ever raise conflict or disagreement, and at the high end (8–10) are issues that raise frequent or intense conflict or disagreements between you.” See Table 1 for a list of all 28 problems. Participants stopped providing data on this measure once their relationship ended, resulting in between one and four time points of repeated measures for each participant. Sample size at T1-T4 was 17, 12, 8, and 5 for men and 23, 16, 11, and 7 for women.
Table 1.
Descriptive statistics of all problem topics
| Mean (SD) | T5 Frequency of ‘Yes’ Response | |||||
|---|---|---|---|---|---|---|
| T1 | T2 | T3 | T4 | |||
| Communication | Husband | 4.6 (3.5) | 5.8 (2.9) | 4.5 (2.4) | 5.6 (2.9) | 59% |
| Wife | 4.3 (3.3) | 5.5 (3.1) | 3.8 (3.3) | 4.4 (3.0) | 70% | |
| Willingness to work on relationship | Husband | 3.4 (3.5) | 4.4 (3.1) | 3.3 (3.0) | 6.0 (3.7) | 35% |
| Wife | 2.4 (2.9) | 3.8 (3.1) | 2.3 (2.7) | 4.3 (4.4) | 70% | |
| Moods and tempers | Husband | 5.7 (2.9) | 5.8 (2.3) | 5.0 (3.0) | 6.2 (3.6) | 65% |
| Wife | 5.4 (3.2) | 4.9 (2.7) | 4.9 (2.8) | 6.7 (2.6) | 56% | |
| Trust | Husband | 2.5 (2.8) | 4.8 (3.4) | 3.4 (3.6) | 3.8 (3.6) | 53% |
| Wife | 1.9 (2.3) | 3.0 (3.7) | 2.6 (2.9) | 3.1 (4.1) | 61% | |
| Jealousy/infidelity | Husband | 2.7 (2.6) | 3.3 (3.0) | 2.3 (3.3) | 4.2 (4.0) | 18% |
| Wife | 1.9 (3.1) | 2.6 (3.7) | 2.1 (3.9) | 1.7 (3.0) | 56% | |
| Unrealistic expectations | Husband | 3.4 (3.0) | 3.8 (3.1) | 1.9 (2.3) | 5.4 (2.9) | 35% |
| Wife | 2.3 (2.8) | 3.4 (3.2) | 1.9 (2.7) | 5.1 (3.8) | 52% | |
| Making decisions/solving problems | Husband | 3.4 (2.6) | 4.4 (2.6) | 2.8 (2.1) | 5.6 (2.5) | 41% |
| Wife | 2.8 (3.1) | 4.6 (2.7) | 3.6 (2.1) | 5.3 (3.5) | 48% | |
| Plans for the future | Husband | 3.7 (3.4) | 3.3 (2.8) | 3.9 (2.9) | 5.4 (3.6) | 29% |
| Wife | 2.3 (3.1) | 3.4 (3.3) | 1.8 (2.6) | 3.3 (4.1) | 48% | |
| Quality of time spent together | Husband | 4.4 (3.4) | 4.3 (2.9) | 4.5 (2.6) | 5.2 (3.0) | 47% |
| Wife | 3.4 (3.4) | 3.5 (3.6) | 3.5 (3.0) | 4.3 (4.4) | 43% | |
| Personal habits | Husband | 3.9 (3.0) | 4.4 (3.0) | 3.5 (2.9) | 3.6 (3.1) | 23% |
| Wife | 3.2 (2.8) | 3.1 (3.0) | 3.8 (2.4) | 4.7 (3.6) | 43% | |
| Your or partner’s personality characteristics | Husband | 3.4 (3.1) | 4.2 (2.6) | 3.5 (3.0) | 4.0 (3.5) | 29% |
| Wife | 3.7 (3.3) | 3.4 (2.8) | 4.3 (3.2) | 4.6 (3.6) | 43% | |
| Management of money | Husband | 5.5 (3.2) | 6.2 (3.6) | 6.4 (3.9) | 7.6 (1.8) | 41% |
| Wife | 4.2 (3.4) | 4.6 (3.6) | 3.6 (3.4) | 5.3 (3.8) | 30% | |
| Household chores | Husband | 4.1 (3.1) | 5.8 (3.2) | 5.0 (3.3) | 5.6 (2.6) | 17% |
| Wife | 3.8 (3.6) | 3.6 (2.4) | 3.2 (3.2) | 3.9 (3.0) | 39% | |
| Career decisions | Husband | 2.9 (3.4) | 4.0 (3.0) | 2.8 (2.9) | 2.8 (2.8) | 23% |
| Wife | 2.1 (3.1) | 2.8 (3.4) | 1.7 (3.1) | 2.6 (2.8) | 36% | |
| Decisions about free time | Husband | 3.2 (3.0) | 3.8 (3.1) | 2.1 (2.3) | 6.8 (2.5) | 29% |
| Wife | 2.9 (3.1) | 3.3 (3.2) | 2.3 (1.4) | 4.6 (4.2) | 35% | |
| Division of workload | Husband | 4.5 (3.3) | 4.6 (3.0) | 4.9 (3.8) | 6.4 (3.2) | 23% |
| Wife | 3.2 (2.9) | 3.4 (3.5) | 3.0 (3.2) | 3.3 (2.4) | 35% | |
| Either your or spouse’s work | Husband | 3.8 (3.8) | 4.4 (3.1) | 4.1 (4.0) | 2.8 (2.4) | 12% |
| Wife | 2.9 (3.4) | 2.1 (3.3) | 3.0 (3.6) | 2.4 (3.1) | 35% | |
| Independence | Husband | 3.0 (3.2) | 3.0 (2.7) | 2.1 (2.7) | 3.6 (3.3) | 18% |
| Wife | 2.2 (3.2) | 2.4 (3.1) | 3.0 (2.0) | 3.3 (3.8) | 35% | |
| Relationship with in-laws | Husband | 4.0 (3.1) | 3.6 (2.7) | 4.9 (3.1) | 5.6 (3.2) | 29% |
| Wife | 5.2 (3.5) | 5.5 (2.7) | 4.3 (2.9) | 5.6 (1.7) | 35% | |
| Amount of time spent together | Husband | 4.4 (3.3) | 4.1 (2.9) | 4.1 (2.2) | 4.6 (3.3) | 18% |
| Wife | 3.1 (3.6) | 3.5 (3.1) | 3.0 (2.6) | 4.4 (4.2) | 30% | |
| Friends | Husband | 3.7 (2.8) | 4.7 (2.0) | 5.3 (2.9) | 6.6 (2.2) | 29% |
| Wife | 2.3 (2.6) | 2.1 (3.2) | 3.2 (3.0) | 2.9 (4.3) | 26% | |
| Showing affection/intimacy | Husband | 3.7 (3.1) | 4.6 (3.0) | 3.4 (2.9) | 5.6 (3.0) | 29% |
| Wife | 2.9 (3.1) | 2.8 (3.2) | 2.6 (2.8) | 5.3 (3.8) | 26% | |
| Children | Husband | 2.5 (2.8) | 2.6 (3.0) | 1.0 (1.5) | 1.0 (1.0) | 18% |
| Wife | 1.0 (2.1) | 2.8 (3.5) | 1.6 (1.8) | 3.0 (3.7) | 22% | |
| Drug/alcohol use or abuse | Husband | 1.7 (2.4) | 3.0 (3.1) | 1.5 (1.9) | 0.2 (0.4) | 12% |
| Wife | 2.2 (3.7) | 2.4 (3.8) | 0.4 (0.9) | 0.7 (1.5) | 22% | |
| Need for time alone | Husband | 3.9 (3.5) | 3.8 (2.9) | 3.4 (3.3) | 5.8 (4.3) | 18% |
| Wife | 3.0 (3.0) | 4.2 (3.6) | 3.9 (2.4) | 4.6 (3.6) | 22% | |
| Sexual relationship | Husband | 2.5 (2.4) | 3.4 (2.2) | 3.4 (3.7) | 5.0 (2.9) | 18% |
| Wife | 3.3 (3.0) | 3.0 (2.4) | 2.8 (2.3) | 3.3 (2.4) | 22% | |
| Religion | Husband | 1.5 (2.1) | 1.3 (2.1) | 0.5 (1.1) | 1.0 (1.7) | 6% |
| Wife | 0.8 (1.6) | 1.7 (3.2) | 0.9 (2.4) | 0.4 (1.1) | 9% | |
| Step-children | Husband | 2.1 (3.6) | 0.6 (2.0) | 0.9 (2.5) | 1.6 (3.6) | 6% |
| Wife | 0.5 (1.8) | 0.5 (2.0) | 0.7 (2.4) | 0.7 (1.9) | 9% | |
Note. Problems are sorted by most to least frequently reported as contributing to divorce. Bold indicates problems that were retained in analyses.
Contribution to Divorce.
At T5, which occurred post-divorce, participants were asked to “rate how much [the issue] contributed to your divorce/separation” for each of the 28 problems described above (and listed in Table 1). Response options were 0 = not at all, 1 = a little bit, or 2 = a lot. Responses of “not at all” and “a little” were collapsed into a “No” contribution to divorce category and responses of “a lot” were considered to have contributed to the divorce and were coded as “Yes.”
For the purpose of these analyses, only problems with sufficient data in both the “No” and “Yes” categories at T5 to establish a group intercept and slope (n ≥ 4) were included in the final list of problems. For example, for the problem “step-children” only one husband and two wives rated this as “Yes.” Thus there was insufficient data to establish a slope and intercept for the “Yes” group for this problem, therefore “step-children” was not included in the analyses. Similarly, for the problem “amount of time spent together” only three husbands rated this as “No.” Thus there was insufficient data to establish a slope and intercept for the “No” group for husbands for this problem, therefore “amount of time spent together” was not included in the analyses. The final thirteen problems with sufficient data included: management of money, relationship with in-laws, quality of time spent together, way you communicate, willingness to work on improving relationship, decisions about free time, trust, friends, personality characteristics, moods and tempers, making decisions/solving problems, unrealistic expectations, and plans for the future.
Analytic Plan
Analyses were conducted in Stata version 13 using the xtmixed procedure. Because the data consists of some interdependent data (20 individuals from 10 marriages) and some independent data (20 individuals from 20 different marriages), men and women were analyzed separately. The data was fit with a two-level model in which repeated measurements of problem ratings were modeled at level 1 and individuals’ ratings of whether a problem contributed to their divorce were included as a level 2 moderator.
Prior to the addition of the contribution to divorce variable, each model was tested for variance in intercept and slope to determine whether there were significant differences between individuals and significant change over time in the relationship problems.
To address the question of whether problems that did contribute to divorce were greater at the beginning of the marriage than problems that did not contribute to divorce, the intercept of the “Yes” group for each problem was tested against the intercept of the “No” group for that problem by examining the coefficient of the contribution to divorce moderator variable in the intercept equation (β01). If this coefficient was significant, then the intercept values were examined. If the intercept was significantly higher in the “Yes” group than the “No” group, this would indicate that the problem that contributed to divorce was also a large problem at the start of the relationship.
To address the question of whether problems that contributed to divorce increase in difficulty over time, the slope of the “Yes” group for each problem was tested against the slope of the “No” group for that problem by examining the coefficient of the contribution to divorce moderator variable in the slope equation (β11). If this coefficient was significant, then the simple slope values were examined. If the slope of the “Yes” group was positive and significantly different from zero this would indicate that the problem that contributed to divorce became worse over the course of the relationship.
Results
Descriptive Statistics
Table 1 presents descriptive statistics for all variables. The problems most often cited as contributing to divorce were “communication” (70%), “willingness to work on the relationship” (70%), “trust” (61%), “jealousy/infidelity” (56%), and “moods and tempers” (56%) for wives. For husbands, top-rated contributors to divorce were “moods and tempers” (65%), “communication” (59%), “trust” (53%), “quality of time spent together” (47%), “making decisions/solving problems” (41%), and “management of money” (41%). Husbands reported an average of 7.8 problems (SD = 5.9) contributing to their divorce, with a range of 0–19. Wives reported an average of 10.7 problems (SD = 4.7) contributing to their divorce, with a range of 3–21.
Chi-square tests conducted on the ten couples with dyadic data available indicated that for 27 out of 28 problems the partners did not significantly differ in their report of whether that problem contributed to their divorce. The only problem on which partners did not agree was “relationship with in-laws,” χ2(1) = 4.29, p = .038.
Husbands
Table 2 presents intercepts and slopes of the difficulty ratings of relationship problems, moderated by whether the problems did (“Yes” column) or did not (“No” column) contribute to divorce, separated by gender. Table 2 also gives coefficients for the moderation tests to determine whether the “Yes” and “No” groups were significantly different.
Table 2.
Coefficient, intercept and slope values of problem ratings moderated by contribution to divorce
| Husband | Wife | |||||||||||
|---|---|---|---|---|---|---|---|---|---|---|---|---|
| Intercept | Slope | Intercept | Slope | |||||||||
| Relationship Problem | β01 | No | Yes | β11 | No | Yes | β01 | No | Yes | β11 | No | Yes |
| Management of money | −2.0 | 6.0 | 5.1 | 1.1 | −0.2 | 1.0 | 3.9* | 3.2 | 6.6 | −0.4 | 0.2 | −0.2 |
| Quality of time spent together | −1.0 | 4.7 | 4.1 | 0.4 | −0.2 | 0.2 | −1.8 | 3.5 | 3.1 | 1.3* | −0.4 | 1.0* |
| Way you communicate | 1.1 | 4.5 | 5.1 | −0.5 | 0.4 | −0.1 | −1.4 | 4.5 | 4.5 | 1.4* | −0.6 | 0.8* |
| Personality characteristics | 2.7 | 3.1 | 4.4 | −1.4 | 0.7 | −0.7 | −1.4 | 3.5 | 3.3 | 1.2* | −0.1 | 1.1* |
| Making decisions/Solving problems | 2.6 | 2.7 | 4.6 | −0.8 | 0.7 | −0.1 | −0.9 | 2.5 | 3.4 | 1.8*** | 0.0 | 1.8*** |
| Unrealistic expectations | 3.4 | 2.3 | 5.2 | −0.5 | 0.4 | −0.1 | −1.3 | 2.2 | 2.2 | 1.2* | 0.1 | 1.3** |
| Plans for the future | 4.3* | 2.3 | 6.1 | −0.5 | 0.6 | 0.1 | −0.6 | 2.0 | 2.7 | 1.4** | −0.1 | 1.3*** |
| Willingness to work on improving relationship | 0.4 | 3.8 | 3.0 | −1.1* | 1.0** | −0.2 | −0.2 | 2.2 | 2.7 | 0.7 | 0.0 | 0.7 |
| Trust | 2.2 | 2.8 | 3.0 | −1.9* | 2.0** | 0.1 | −1.6 | 2.5 | 1.6 | 0.7 | 0.1 | 0.8* |
| Friends | 0.9 | 3.5 | 4.1 | −0.4 | 1.0** | 0.7 | −0.1 | 1.8 | 3.0 | 1.2† | 0.0 | 1.3* |
| Decisions about free time | 2.2 | 2.7 | 3.7 | −1.3 | 1.0* | −0.3 | −2.5 | 3.3 | 2.0 | 1.2† | −0.1 | 1.1* |
| Moods and tempers | 2.8 | 4.4 | 6.4 | −0.7 | 0.5 | −0.2 | −0.2 | 5.1 | 5.0 | 0.2 | 0.3 | 0.5 |
| Relationship with in-laws | 1.1 | 3.3 | 5.1 | 0.6 | −0.0 | 0.6 | −1.2 | 5.1 | 5.1 | 1.2 | −0.5 | 0.7 |
Note. All intercept values are significantly different from 0. Significant β01 and β11 values indicate that the intercept and slope, respectively, were moderated by contribution to divorce (i.e., No and Yes groups significantly differed from each other). N = 17 husbands; N = 23 wives
p < .10,
p < .05,
p < .01,
p < .001.
For husbands, the intercept of only one of the thirteen problems was moderated by contribution to divorce; “plans for the future.” Husbands who said that this problem contributed to their divorce rated it as nearly three times more difficult at the start of their marriage (6.1) than those who said it did not contribute to their divorce (2.3).
The slopes of two of the thirteen problems, “willingness to work on improving the relationship” and “trust,” were moderated by contribution to divorce for husbands. However, the slopes were not in the expected directions; slopes increased over time for those who said these problems did not contribute to their divorce, indicating that the problem worsened over the course of the relationship, whereas those who said these problems contributed to their divorce had a non-significant slope, indicating that the problem did not worsen over the course of the relationship.
Wives
For wives, the intercept of only one of the thirteen problems, “management of money,” was moderated by contribution to divorce. Wives who said that this problem contributed to their divorce rated it as nearly twice as difficult at the start of their marriage (6.6) than those who said it did not contribute to their divorce (3.2).
The slopes of six of the thirteen problems, including “quality of time spent together,” “way you communicate,” “personality characteristics,” “making decisions/solving problems,” “unrealistic expectations,” and “plans for the future,” were moderated by contribution to divorce for wives. For all six problems, those who said it did not contribute to their divorce had a non-significant slope, indicating that the problem did not get worse over time, whereas those who said the problems contributed to their divorce had a significant, positive slope, indicating that the problem increased in difficulty over the course of the marriage.
For another three problems, slopes of the “Yes” group increased significantly while the “No” group stayed flat, but the test for moderation failed to reach the p < .05 level of significance. For two of these problems, “decisions about free time” and “friends,” the coefficient was borderline significant (p < .10) and for “trust” the coefficient was not significant (p = .224)
Overall, then, husbands identified one problem that contributed to their divorce that was elevated from the beginning of their marriage. They also identified two problems that increased in difficulty over time, but only for those who said the problem did NOT contribute to their divorce. Wives identified nine total problems that contributed to their divorce that were either elevated from the start of their marriage (one problem) or became more difficult over the course of their marriage (eight problems). Figure 1 presents an example of these effects for husbands and wives.
Figure 1.
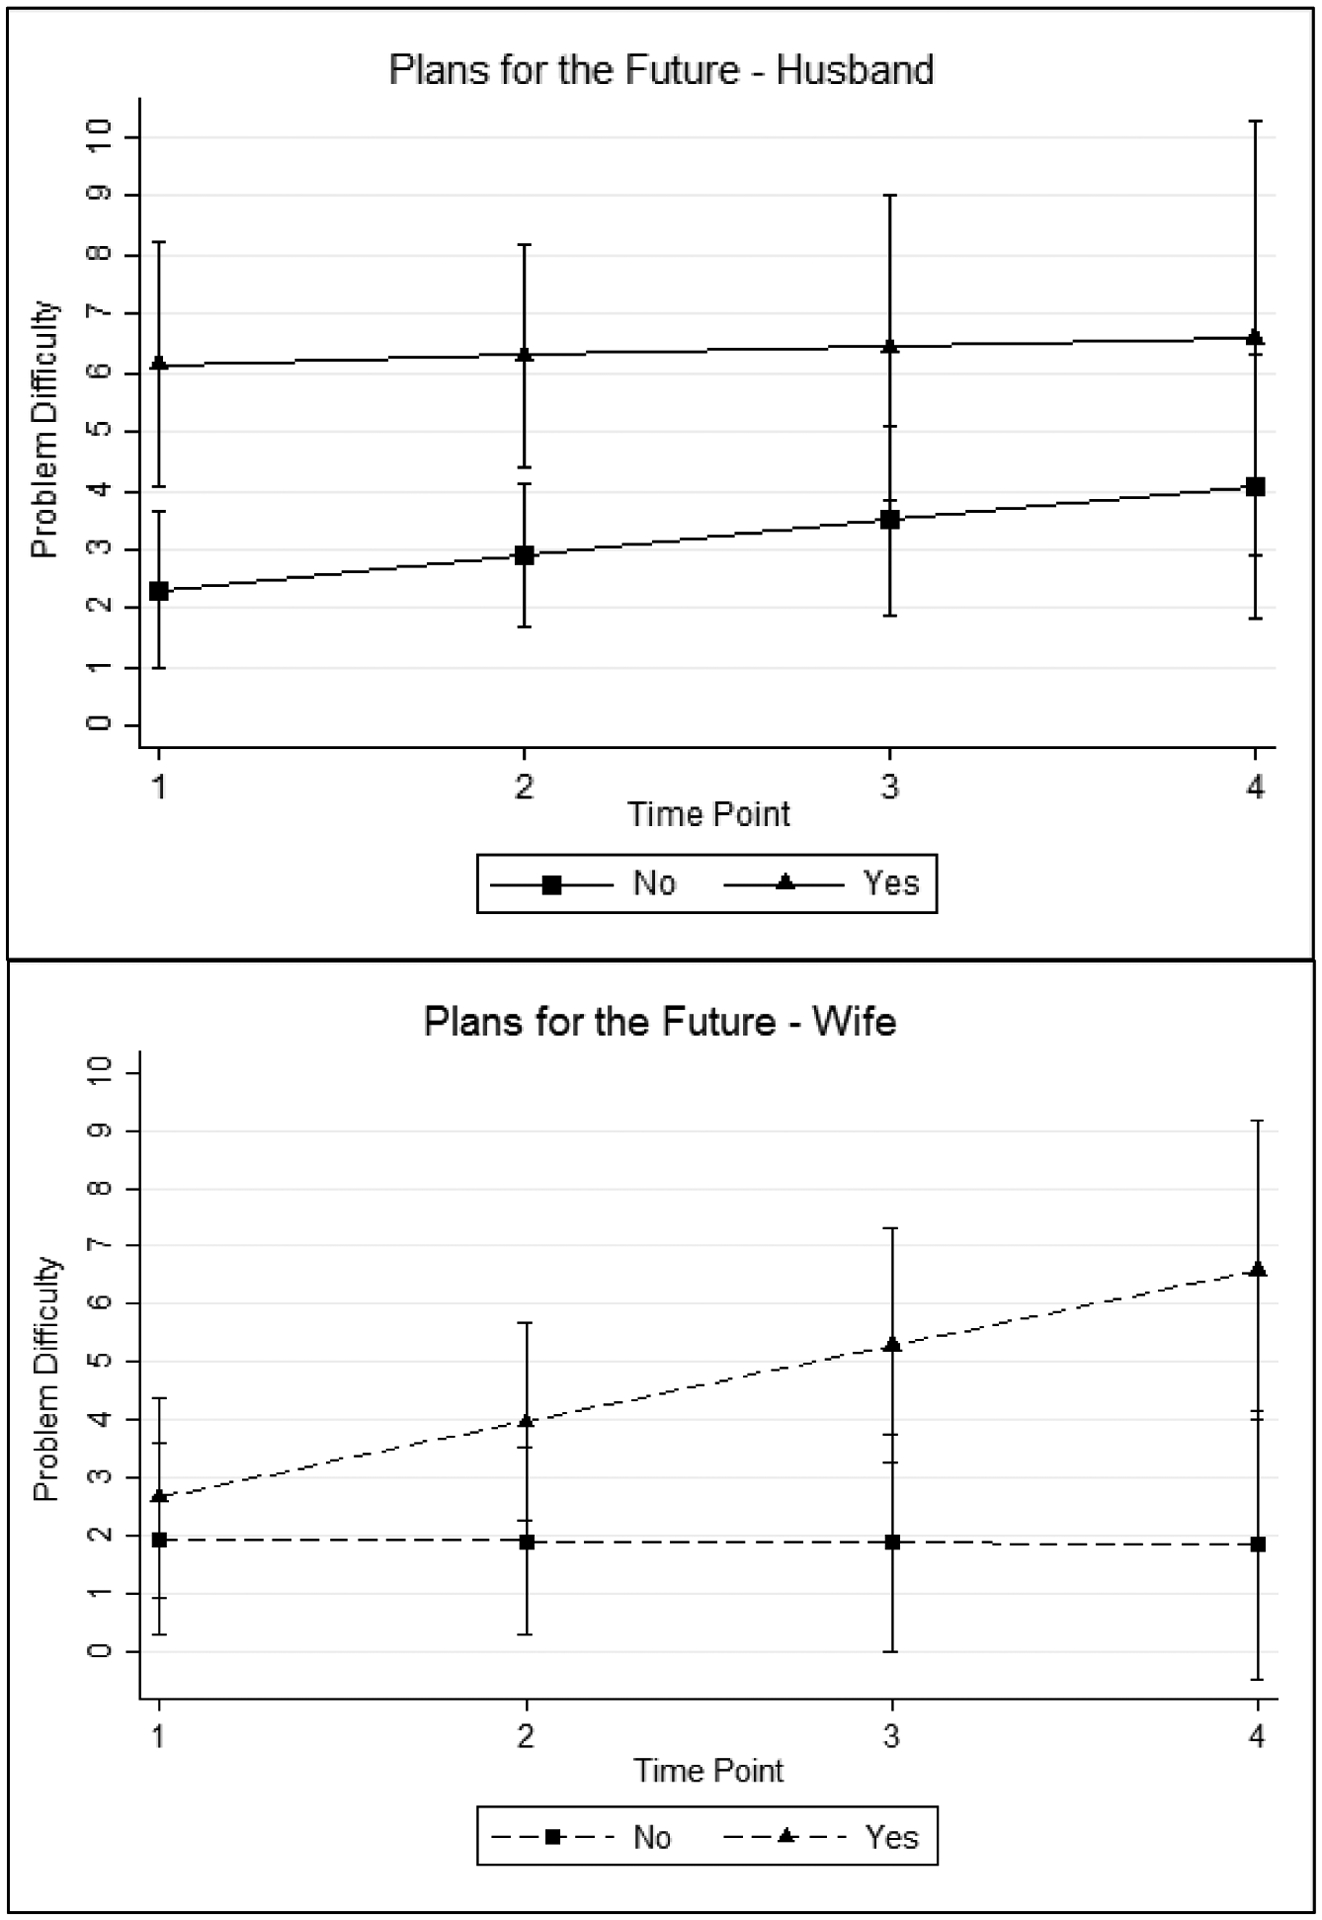
Top Panel: The intercept of the husband ‘Yes’ group is significantly greater than the husband ‘No’ group, but the slope is non-significant, indicating that the problem started out as highly difficult and stayed at that level throughout the relationship. Bottom Panel: For wives the intercepts are not significantly different from each other, but the slope of the ‘Yes’ group is significantly different from zero and from the slope of the ‘No’ group, indicating that the problem did not start out as highly difficult, but it became more difficult over time.
Discussion
Understanding why couples end their marriage is essential to interventions which aim to prevent divorce, and yet we do not know whether the problems that partners believe led to their divorce exist at the start of marriage (the enduring dynamics model), or whether they emerge and worsen over the course of the marriage (the emergent distress model). The current study sought to resolve these competing perspectives using prospective data on relationship problems collected from newlywed couples four times over the first three years of marriage. Forty individuals who went on to divorce provided information about how much these same relationship problems contributed to their divorce, and the intercepts and slopes of relationship problems that did and did not contribute to divorce were tested. Replicating prior findings (e.g., Amato & Previti, 2005; Cleek & Pearson, 1985; Scott, Rhoades, Stanley, Ellen, & Markman, 2013) the present study documents communication and infidelity/trust as commonly-cited problems in dissolved marriages, and extends this research by documenting that wives are more sensitive to relationship problems than husbands, and that they were more likely to see problems worsening over time, supporting the emergent distress model.
In only one of thirteen instances, husbands at the start of the marriage perceived the existence of a relationship problem that they would eventually describe as contributing to their divorce. Wives, however, perceived seven of thirteen problems that they would later describe as leading to their divorce as significantly elevated during the course of their relationship. The gender-specific nature of these results builds upon existing evidence that husbands and wives monitor their relationship differently. Men are commonly thought of as less aware of their relationship than women, and indeed women are more likely than men to recognize that their relationship is in trouble and seek therapy (Doss, Atkins, & Christensen, 2003) and to initiate divorce (Brinig & Allen, 2000). Our findings suggest that women not only see more problems in their relationship, they are more likely to recognize problems that will go on to end the relationship. Still unclear is how the process of recognizing problems, seeing them grow, and determining that the problems cannot be resolved eventuates in a decision to divorce.
At the same time, not all of the reasons for divorce were rooted in problems that individuals perceived during their marriage and were therefore only noted as problematic post-divorce. This is consistent with Lavner, Karney, & Bradbury, 2014 who found that problems stayed stable over time, even as relationship satisfaction decreased. Thus, there may be something about the global evaluation of a relationship and the decision to divorce that is not rooted directly in a couple’s experience of specific relationship problems. Another possible explanation is that retrospective bias may be playing a role in how recently-divorced individuals attempt to explain and make sense of the end of their marriage. For example, when asked whether a problem contributed to their divorce the respondent may have answered based on reasons their spouse gave them for seeking a divorce, and not on their own reasons. This underscores the need for future studies of divorce to link pre- and post-divorce data from both spouses in order to more fully understand the reasons why relationships end.
The results of this study should be interpreted with caution, for several reasons. First, the sample was small, consisting of 40 individuals representing 30 different couples. Additionally, dyadic data were available from only 10 couples, which allowed only cursory analyses of the extent to which the former spouses agree or disagree on what issues prompted the divorce. Similarly, the current sample was too small to integrate our results with information about who initiated the divorce and whether couples sought counseling before divorcing. Second, because the sample consists of couples who divorced early in their marriage (after 2.6 years on average), results cannot be generalized to couples who divorce later in their marriage. Additionally, there was a range in the amount of time since divorce when participants completed their post-divorce interview (1 month to 4 years), and it is possible that this would affect the way individuals interpret what went wrong in their relationship. Future studies that interview divorced individuals at a uniform time point soon after their divorce are needed to control for the possible effect of the passage of time. Finally, the manner in which marriages dissolve is dynamic and heterogeneous (e.g., Hetherington, Bridges, & Isabella, 1998), and the methods we have used fail to capture the complexity of these important transitions. Narrative studies would address this limitation, though our prediction would be that women’s retrospective accounts should reflect the growing realization of problems in the relationship to a greater degree than men’s accounts.
Notwithstanding these concerns, our results may be important for a number of reasons. First, if wives tend to view a problem as worsening whereas husbands tend to view the same problem as unchanging, wives’ requests for change might be met by husbands’ insistence that immediate changes are unnecessary. This adds a new perspective on the well-known demand-withdraw interaction pattern (e.g., Christensen & Heavey, 1990), as it suggests that men and women might be operating on the basis of distinctly different perceptions of substantively similar relationship problems. In this way, wives may make demands about problems that they perceive to have deteriorated over time, and when husbands withdraw and do not make changes, wives may be more likely view the lack of change as the cause of dissolution. This interpretation of our results is speculative given the limits of our sample, which did not include enough couples where both partners participated to test agreement between spouses on the development of problems. Future work that includes both spouses can shed light on whether this pattern holds true at the within-couple level.
Second, these results provide a bridge between two seemingly discrepant models of relationship deterioration. Prominent theories of relationships, including social learning and behavioral theories, have hypothesized that relationships end because the experience of the partners becomes gradually more negative and less rewarding over time, which would implicate the emergent distress model. However, much of the research examining the early years of marriage has found support for the enduring dynamics model, in which evidence of poorer relationship characteristics exists from the beginning in marriages that end in divorce (e.g., Huston, Niehuis, & Smith, 2001; Lavner, Bradbury, & Karney, 2012). The body of work supporting the enduring dynamics model has focused on global relationship characteristics, such as love and satisfaction, and found that couples who go on to become dissatisfied or divorce are low on these global characteristics at the start of marriage. In contrast, we examined specific problems in relationships and found support for the emergent distress model, in that problems that lead to divorce emerged and worsened over the early years of marriage, but were not perceived by partners at the start of marriage. This suggests that the development of global dissatisfaction and specific problems may take on different forms: marriages that will end in divorce may start out less happy, and this deficit in happiness may lead to the development of more specific relationship problems. Indeed, recent research on nearly 500 newlywed couples found that in the beginning of marriage, global sentiments of relationship satisfaction predict later perceptions of more specific relationship problems (Lavner, 2014).
In sum, the results of the current study indicate that many of the problems that women report as reasons for their divorce were not evident to them at the start of their marriage, but they did perceive them as worsening over the course of their marriage, whereas problems that men report as reasons for their divorce were usually not evident to them during their marriage at all. This suggests that interventions may benefit from focusing on problems identified by wives, and underscores the need for more studies that integrate information from before and after divorce in order to understand how to prevent this negative outcome.
Acknowledgments
Preparation of this report was supported by Research Grants HD053825 and HD061366 from the National Institute of Child Health and Human Development awarded to Benjamin Karney and National Science Foundation Graduate Research Fellowships awarded to Hannah Williamson and Teresa Nguyen.
Footnotes
Couples who did not participate did not differ significantly on their initial relationship satisfaction or average problem severity from those who did participate.
References
- Amato PR, & Previti D (2003). People’s reasons for divorcing: Gender, social class, the life course, and adjustment. Journal of Family Issues, 24, 602–626. doi: 10.1177/0192513X03254507 [DOI] [Google Scholar]
- Bodenmann G, Charvoz L, Bradbury TN, Bertoni A, Iafrate R, Giuliani C, Banse R, & Behling J (2007). The role of stress in divorce: A three-nation retrospective study. Journal of Social and Personal Relationships, 24, 707–728. doi: 10.1177/0265407507081456 [DOI] [Google Scholar]
- Boisvert MM, Wright J, Tremblay N, & McDuff P (2011). Couples’ reports of relationship problems in a naturalistic therapy setting. Family Journal: Counseling and Therapy for Couples and Families, 19, 362–368. doi: 10.1177/1066480711420044 [DOI] [Google Scholar]
- Brinig MF, & Allen DW (2000). “These boots are made for walking”: Why most divorce filers are women. American Law and Economics Review, 2, 126–169. doi: 10.1093/aler/2.1.126 [DOI] [Google Scholar]
- Christensen A, & Heavey CL, (1990). Gender and social structure in the demand/withdraw pattern of marital conflict. Journal of Personality and Social Psychology, 59, 73–81. doi: 10.1037/0022-3514.59.1.73 [DOI] [PubMed] [Google Scholar]
- Cleek MG, & Pearson TA (1985). Perceived causes of divorce: An analysis of interrelationships. Journal of Marriage and Family, 47, 179–183. doi: 10.2307/352080 [DOI] [Google Scholar]
- Doss BD, Atkins DC, & Christensen A (2003). Who’s dragging their feet? Husbands and wives seeking marital therapy. Journal of Marital and Family Therapy, 29, 165–177. doi: 10.1111/j.1752-0606.2003.tb01198.x [DOI] [PubMed] [Google Scholar]
- Geiss SK, & O’Leary DK (1981). Therapist ratings of frequency and severity of marital problems: Implications for research. Journal of Marital and Family Therapy, 7, 515–520. doi: 10.1111/j.1752-0606.1981.tb01407.x [DOI] [Google Scholar]
- Heaton TB, & Blake AM (1999). Gender differences in determinants of marital disruption. Journal of Family Issues, 20, 25–45. doi: 10.1177/019251399020001002 [DOI] [PubMed] [Google Scholar]
- Hetherington EM, Bridges M, & Isabella GM (1998). What matters? What does not? Five perspectives on the association between marital transitions and children’s adjustment. American Psychologist, 53, 167–84. doi: 10.1037/0003-066X.53.2.167 [DOI] [PubMed] [Google Scholar]
- Hewitt B, Western M, & Baxter J (2006). Who decides? The social characteristics of who initiates marital separation. Journal of Marriage and Family, 68, 1165–1177. doi: 10.1111/j.1741-3737.2006.00321.x [DOI] [Google Scholar]
- Huston TL, Caughlin JP, Houts RM, Smith SE, & George LJ (2001). The connubial crucible: Newlywed years as predictors of marital delight, distress, and divorce. Journal of Personality and Social Psychology, 80, 237–252. doi: 10.1037/0022-3514.80.2.237 [DOI] [PubMed] [Google Scholar]
- Huston TL, Niehuis S, & Smith SE (2001). The early marital roots of conjugal distress and divorce. Current Directions in Psychological Science, 10, 116–119. doi: 10.1111/1467-8721.00129 [DOI] [Google Scholar]
- Kitson GC, & Holmes WM (1992). Portrait of divorce: Adjustment to marital breakdown. New York: Guilford Press. [Google Scholar]
- Lavner JA (2014). Mechanisms of stability and change in newlywed marriage (Doctoral dissertation). Retrieved from ProQuest. (Accession No. 2015-99040-429) [Google Scholar]
- Lavner JA, Bradbury TN, & Karney BR (2012). Incremental change or initial differences? Testing two models of marital deterioration. Journal of Family Psychology, 26, 606–616. doi: 10.1037/a0029052 [DOI] [PMC free article] [PubMed] [Google Scholar]
- Lavner JA, Karney BR, & Bradbury TN (2014). Relationship problems over the early years of marriage: Stability or change? Journal of Family Psychology, 28, 979–985. doi: 10.1037/a0037752 [DOI] [PMC free article] [PubMed] [Google Scholar]
- Sbarra DA, Law RW, & Portley RM (2011). Divorce and death: A meta-analysis and research agenda for clinical, social, and health psychology. Perspectives on Psychological Science, 6, 454–474. doi: 10.1177/1745691611414724 [DOI] [PubMed] [Google Scholar]
- Scott SB, Rhoades GK, Stanley SM, Allen ES, & Markman HJ (2013). Reasons for divorce and recollections of premarital intervention: Implications for improving relationship education. Couple and Family Psychology: Research and Practice, 2, 131–145. doi: 10.1037/a0032025 [DOI] [PMC free article] [PubMed] [Google Scholar]
- Storaasli RD, & Markman HJ (1990). Relationship problems in the early stages of marriage: A longitudinal investigation. Journal of Family Psychology, 4, 80–98. doi: 10.1037/0893-3200.4.1.80 [DOI] [Google Scholar]
- U.S. Census of Population and Housing. (2002). Summary Population and Housing Characteristics: California. Washington, DC: Government Printing Office, 2002. [Google Scholar]