

Abstract
Redox state mediates embryonic stem cell (ESC) differentiation and thus offers an important complementary approach to understanding the pluripotency of stem cells. NADH redox ratio (NADH/(Fp + NADH)), where NADH is the reduced form of nicotinamide adenine dinucleotide and Fp is the oxidized flavoproteins, has been established as a sensitive indicator of mitochondrial redox state. In this paper, we report our redox imaging data on the mitochondrial redox state of mouse ESC (mESC) colonies and the implications thereof. The low-temperature NADH/Fp redox scanner was employed to image mESC colonies grown on a feeder layer of gamma-irradiated mouse embryonic fibroblasts (MEFs) on glass cover slips. The result showed significant heterogeneity in the mitochondrial redox state within individual mESC colonies (size: ∼200–440 μm), exhibiting a core with a more reduced state than the periphery. This more reduced state positively correlates with the expression pattern of Oct4, a well-established marker of pluripotency. Our observation is the first to show the heterogeneity in the mitochondrial redox state within a mESC colony, suggesting that mitochondrial redox state should be further investigated as a potential new biomarker for the stemness of embryonic stem cells.
Keywords: Redox imaging, pluripotency, NADH, flavoproteins, redox ratio
1. Introduction
Embryonic stem cells (ESCs) have gained wide-spread attention for their potential use in regenerative medicine. ESCs have been derived from the inner cell mass of blastocysts in several species, including mouse1,2 and human.3 In addition to their remarkable capacity for proliferation in vitro, they are pluripotent — capable of giving rise to all of the tissues of the adult organism.4,5 Mouse ESCs (mESCs) are widely used as tools to study the mechanisms of differentiation to various cell types,6 as well as to gain an understanding of the molecular signature of pluripotency.7 Transcription factors such as Oct4,8 Sox2,9 and Nanog10,11 have been demonstrated to play major roles in the establishment and maintenance of pluripotency.12
We set out to determine whether redox state contributes to the pluripotent phenotype. The source of energy for life is the mitochondria and they demand a complex chain of biochemicals to ensure their proper physiological function. NADH and FADH2 (the reduced form of flavin adenine dinucleotide, FAD) are energy-carrying co-enzymes, which are fed into the electron transport chain in mitochondria to generate ATP by oxidative phosphorylation. It has been shown that Fp and NADH fluorescence and their ratio (the redox ratio) are sensitive indicators of mitochondrial metabolic states.13–23 The Fp/NADH ratio is related to the hydroxybutyrate/acetoacetate ratio43 and thus to the NAD+-coupled mitochondrial redox potential NAD+/NADH and to the thermodynamic potential ΔG of the mitochondrial system.24 A highly active mitochondrial metabolic state results in oxidation of the electron transport system, leading to decreases in NADH, increases in Fp, and decreases in the NADH redox ratio, NADH/(Fp + NADH). It was found that redox state mediates ESC differentiation,25 and decreasing NADH redox ratio was detected upon differentiation of mesenchymal stem cell.26
Both NADH and Fp are intrinsic fluorophores. The low-temperature “redox scanner,”27,28 invented by Chance and his co-workers in 1970, is a PC-interfaced fluorometer for NADH and Fp measurement using the flying spot principle. With tissue samples snap-frozen and scanned in liquid nitrogen, the in vivo mitochondrial redox state is preserved and given by the ratio of Fp and NADH. Up to four channels can be time-shared at 60Hz with rotating filter wheels. A 50 to 100-μm bifurcated quartz fibre is driven by two stepper motors to scan sample surface. With a rotating cutting wheel to give a smooth surface, two-dimensional (2D) or three-dimensional (3D) redox images with accompanying histogram displays can be obtained at various cutting depths at liquid nitrogen temperature. Since its inception, the redox scanner has been widely employed in studying cellular energy metabolism29 and in measuring the in vivo mitochondrial redox state of different organ tissues.14,30 Recently, it has been further developed to quantitatively determine the in vivo redox state of a given sample using reference standards NADH and FAD.31,32 Its recent application in cancer studies has linked the in vivo mitochondrial redox state to solid tumor aggressiveness33,34,44 and to the differentiation between normal and premalignant pancreatic tissue.35 Additionally, cancer treatment response has been successfully monitored in animal models using the redox scanner.36,37 In this paper we will report on the heterogeneity in the mitochondrial redox states in individual embryonic stem cell colonies that were imaged by the redox scanner.
2. Materials and Methods
2.1. mESC colony preparation
Mouse embryonic stem cells (mESCs) (line ESD3) were grown at 37°C with 5% CO2 on gamma-irradiated mouse embryonic fibroblasts in DMEM containing 15% fetal bovine serum (Hyclone), ESGRO leukemia inhibitory factor (Millipore), 0.1 mM beta-mercaptoethanol (Sigma) and 1X each of nonessential amino acids, GlutaMAX, sodium pyruvate, and penicillin/streptomycin (Gibco/Invitrogen). In 48–72h, mESCs plated as single cells on round glass cover slips grew into colonies with diameters of 200–440 μm. Some experiments used a subclone of ESD3 that expressed the mCherry red fluorescent protein38 under the control of the Nanog promoter.39
2.2. mESC colony sample preparation for redox scanning
The snap-frozen standards of NADH and Fp were mounted with cold mounting medium in the plastic screw enclosure to determine the nominal concentrations of NADH and Fp of the scanned samples in reference of these standards.31,32 The surface of the mounting medium and the standards was then milled flat by the rotating cutting wheel equipped to the redox scanner. The cover slips were carefully taken out of the growth medium with forceps and held with their edges against Kimwipes® tissue to remove excess medium for ∼10s. These cover slips were then dipped into liquid N2 to snap-freeze the stem cells in order to preserve their redox states. One such cover slip was then placed on the surface of the flat mounting medium in the screw enclosure. Partially frozen mounting medium was carefully put along the border of the cover slip to “glue” it onto the flat surface for redox scanning.
2.3. Redox scanning and data analysis
The above-prepared mESC colony samples were imaged by the redox scanner in two dimensions. The scanning procedure was the same as explained previously.31,32,34 The Fp excitation and emission filters used for this study are 445 ± 25nm and 525 ± 32nm, respectively; and those of NADH are 360 ± 13nm and 430 ± 25nm, respectively. The filter system of the redox scanner has a time-sharing nature. The filters are installed in two rotating wheels (one for excitation and the other for emission) that spin synchronously at 60 Hz when turned on. The NADH fluorescence is generated by photons through the NADH excitation channel and collected only through the NADH emission channel, while the Fp fluorescence is generated by photons through the Fp excitation channel and collected only through Fp emission channel. Thus, there is no cross-talk between channels. The scan matrix varied between 128 × 64 and 256 × 64 for different samples. The step size was 40 μm, making each pixel 40 μm. However, the emission fiber bore was 50 μm, which ultimately limited the spatial resolution of the images.
In total, four samples were scanned from three independent preparations of ESD3 cells (Table 1). Samples 2 and 3 were from the same batch of cultured cells. Sample 4 was from the Nanog-mCherry transfected ESD3 subclone. Since the resolution of the redox scan images is 50 μm, only colonies with diameter ∼200 μm (determined by multiplying the number of pixels and the pixel size 40 μm) or larger were selected for the data presented in Tables 1 and 2.
Table 1.
Mitochondrial redox state biomarkers exhibiting core-rim difference in individual mESC colonies.
| Core |
Rim |
Core/rim ratio |
|||||||
|---|---|---|---|---|---|---|---|---|---|
| Sample (#a) | NADH redox ratio | NADH (μM) | Fp (μM) | NADH redox ratio | NADH (μM) | Fp (μM) | Rredox ratio | RNADH | |
| 1 (6) | 0.47 ± 0.07 | 462 ± 89 | 543 ± 65 | 0.29 ± 0.03 | 218 ± 53 | 510 ± 88 | 1.64 | 2.11 | 1.07 |
| 2 (6) | 0.35 ± 0.02 | 201 ± 17 | 376 ± 26 | 0.29 ± 0.03 | 130 ± 23 | 302 ± 25 | 1.22 | 1.54 | 1.25 |
| 3 (16) | 0.55 ± 0.04 | 493 ± 77 | 431 ± 89 | 0.42 ± 0.04 | 250 ± 53 | 314 ± 66 | 1.31 | 1.97 | 1.37 |
| 4 (8) | 0.54 ± 0.04 | 138 ± 22 | 124 ± 28 | 0.43 ± 0.02 | 81 ± 12 | 95 ± 20 | 1.26 | 1.71 | 1.31 |
| Mean | 0.47 ± 0.09 | 323 ± 180 | 369 ± 177 | 0.35 ± 0.07 | 170 ± 78 | 305 ± 170 | 1.36 ± 0.19 | 1.83 ± 0.26 | 1.25 ± 0.13 |
| p value | 0.02b | 0.04c | |||||||
The number of the analyzed colonies of the corresponding sample.
Comparison of the mean values of NADH redox ratio between core and rim using two-tailed, paired Student t-test.
Comparison of the mean values of RNADH and using two-tailed, paired Student t-test.
Table 2.
Distribution of 20% highest NADH redox ratios.
| Sample | Pixels in the core | Pixels in the rim | % pixels in the core |
|---|---|---|---|
| 1 (6) | 20 | 5 | 80% |
| 2 (6) | 25 | 9 | 74% |
| 3 (15) | 36 | 18 | 65% |
| 4 (8) | 38 | 21 | 64% |
| mean | 30 | 13 | 71% |
| SD | 9 | 8 | 8% |
The p value under 0:05 is considered statistically significant.
For each sample, images of a minimum of six colonies were selected for data analysis. The nominal NADH and Fp concentrations in the individual colonies were determined by comparing the signal intensity of the colonies with the average signal intensity of the reference standards.31,32 In this process, the background signal was also subtracted out from the raw signal of each channel. The NADH redox ratio, NADH/(Fp + NADH) was obtained from these nominal concentrations. Pseudo-color images were displayed with color bars indicating the range of nominal concentrations or redox ratio (Fig. 1).
Fig. 1.
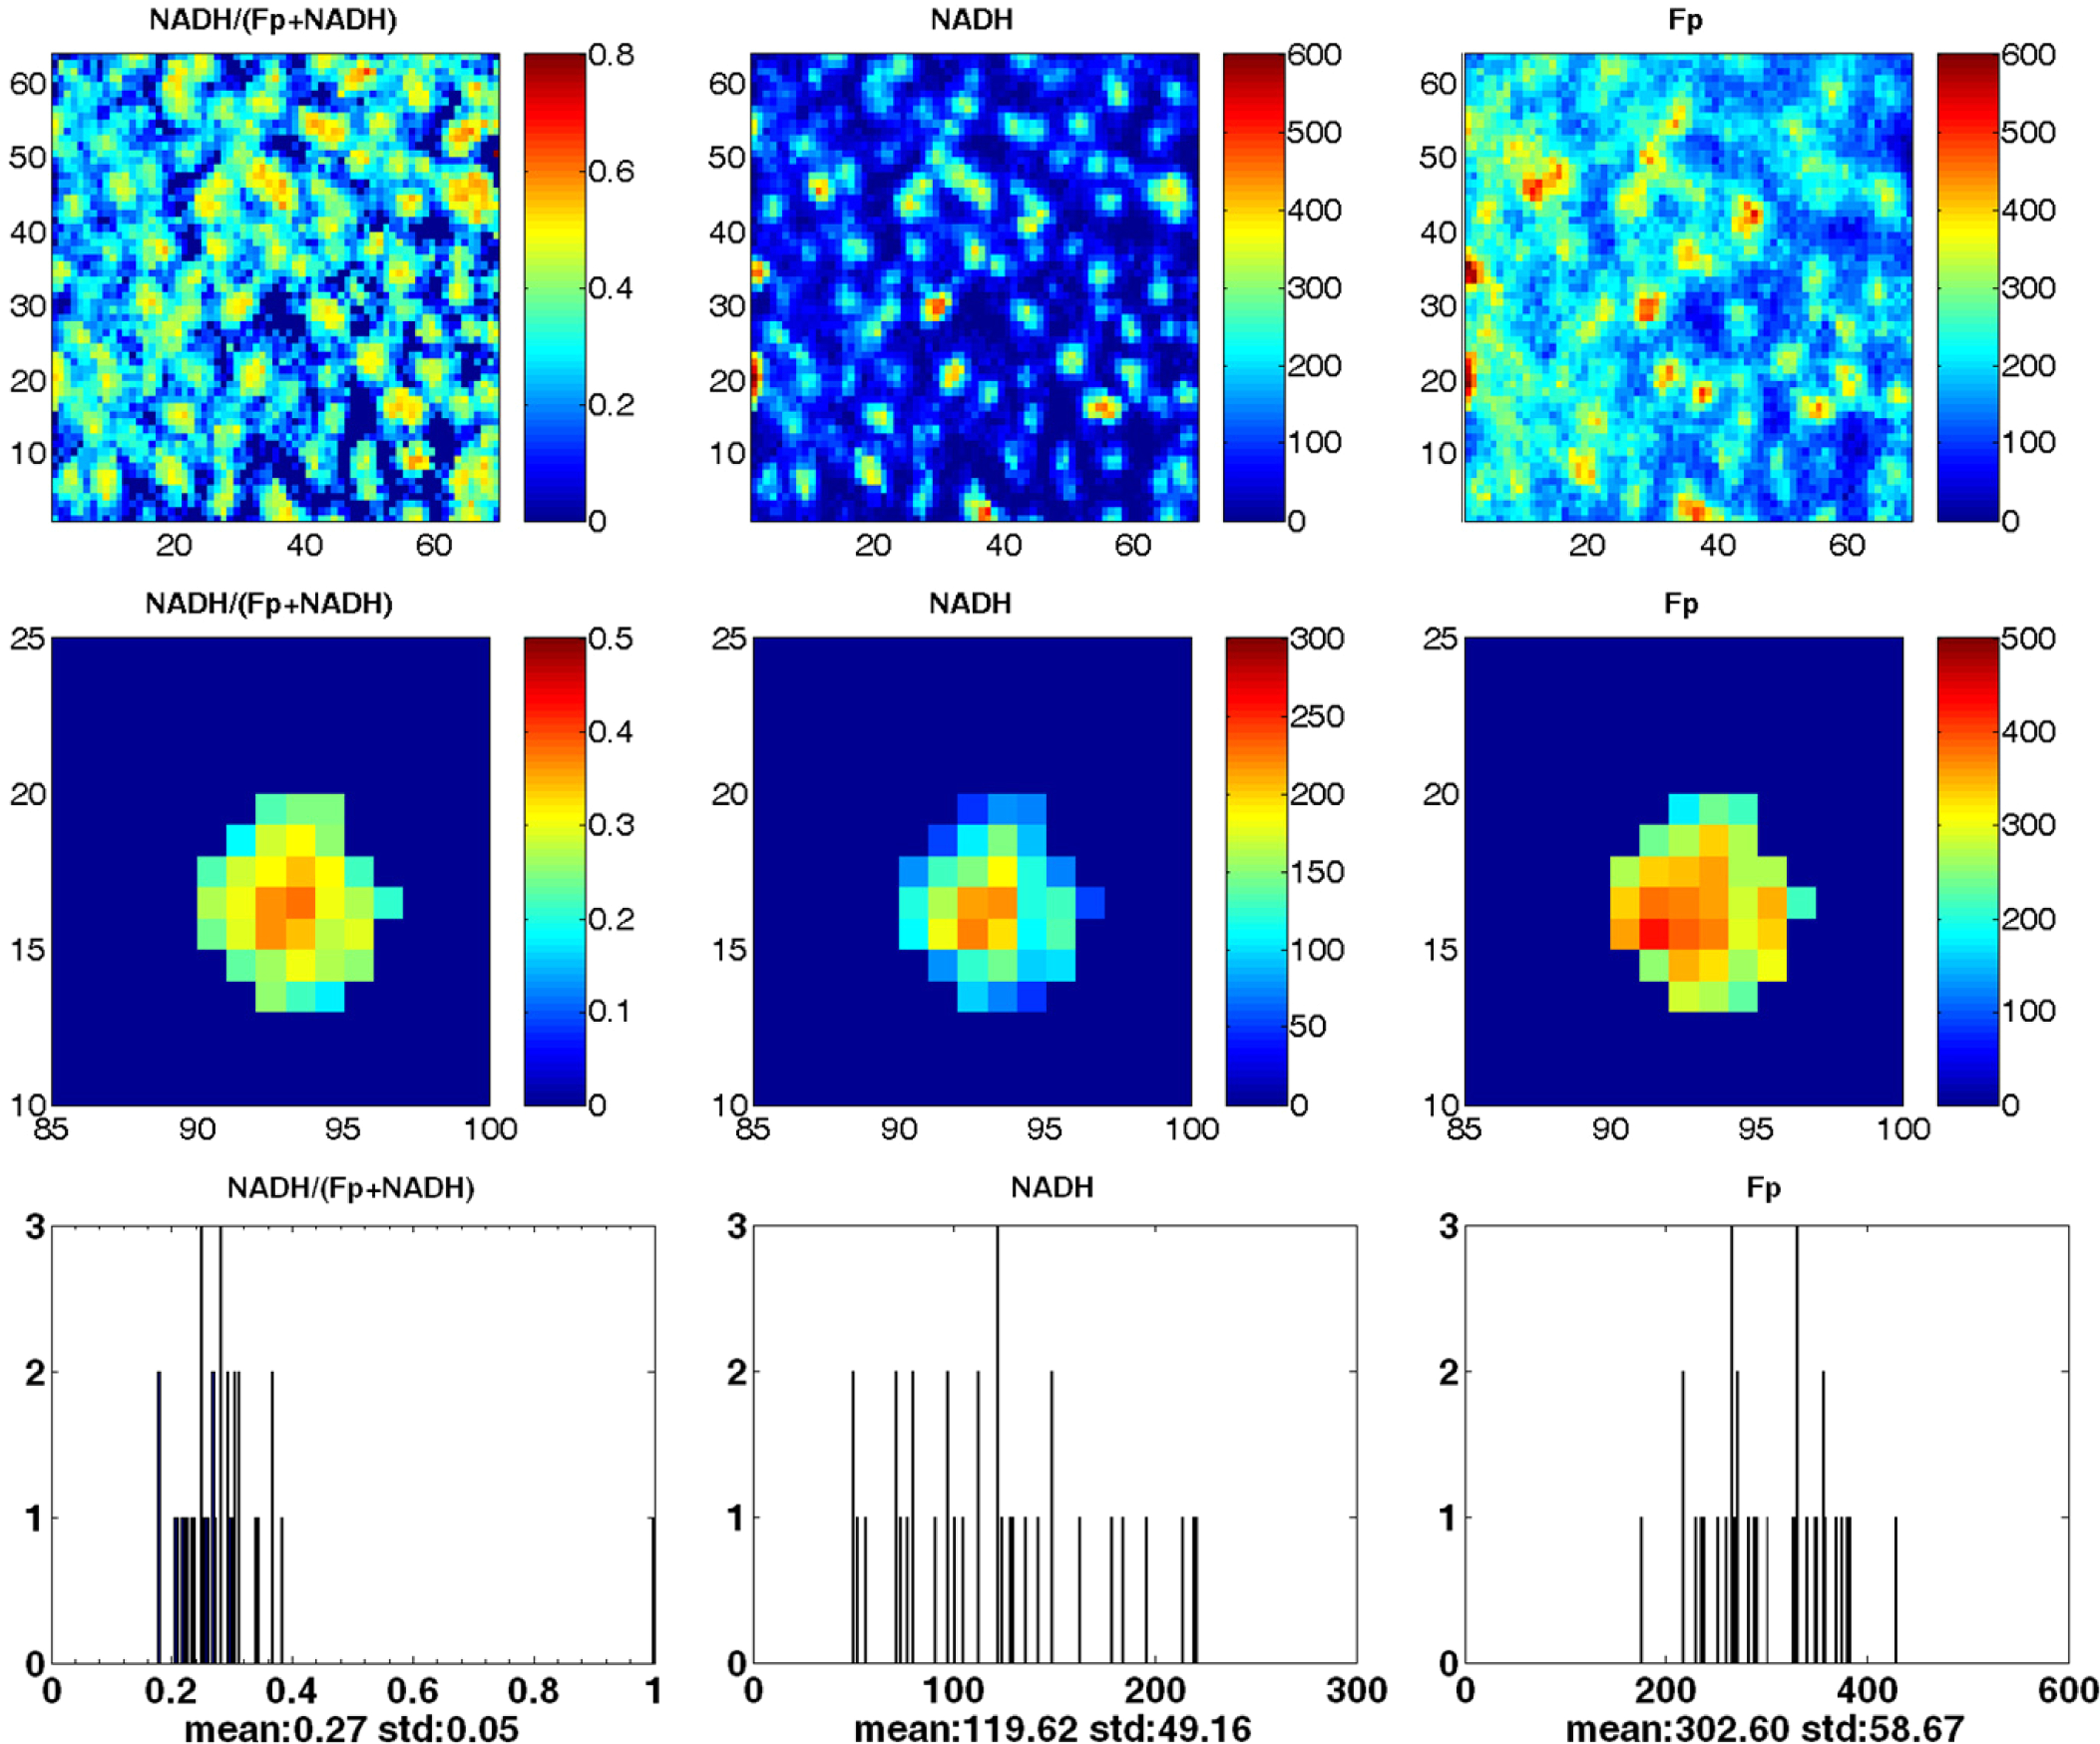
The first and second rows show typical pseudo-color redox images of mouse embryonic stem cell colonies grown on a cover slip, the second row being the enlarged view of the redox images from one of the colonies. The x and y axes represent spatial coordinates in terms of pixels (40 μm). The color bars of the Fp and NADH images indicate the nominal concentrations in μM relative to the corresponding reference standards, and the color bar of NADH redox ratio (NADH/(Fp + NADH)) image indicates the range of the redox ratio. The bottom row delineates the corresponding histograms of the images of the individual colony shown in the middle row, where the x axes represent the NADH redox ratio or nominal concentration. The y axes represent the number of pixels in the colony having a specific value of NADH redox ratio or nominal concentration.
A core-rim analysis was conducted first. The core was visually defined on an NADH image to be a cluster of pixels (representing a cluster of ESCs) with higher NADH than the surrounding pixels. The reason that NADH images were chosen as the template was because NADH images have a lower background than Fp image and the boundary of colonies were more clear-cut on NADH images. A cluster of pixels with obviously higher signals than the average of surrounding pixels can be clearly visualized on the NADH pseudo-color images. On this basis, an analyst manually drew the core region on the NADH images. The cores are not necessarily at the geometrical centers of colonies. The rim region was also drawn on the periphery of the colony with 1–2 pixels thickness depending on the size of colony. Larger colony size (>∼ 8 pixels across) may have a two-pixel thick boundary region. The same cores and rims were then applied to the Fp and the NADH redox ratio images for data reading. To obtain the average of NADH and Fp and the NADH redox ratio, the color bars were first used as a rough estimate of the value for the colony core or rim. This estimate was then used to guide reading more precise average values from the corresponding histograms for a specific colony. The values of the same index from the selected multiple colonies of the same sample were then averaged to obtain the mean value and the standard deviation, which were reported as the results from that specific sample in Table 1. The mean value of the corresponding index from each sample was then further averaged across the four samples. Such averaged values were reported as the mean and standard deviation (SD) of all samples in Table 1. A two-tailed, paired Student t-test was performed to determine the statistical significance of the difference between the indices of the core and the rim of the four samples.
The same sets of data were also analyzed using the following independent method. The 20% of the pixels that had the highest NADH redox ratios were selected from each individual colony and were geometrically located in the corresponding ratio image. The percentage of the selected pixels that fall in the core as defined by the core-rim analysis was calculated. The results are reported in Table 2.
2.4. Immunocytochemistry
Colonies of mESCs on glass cover slips were fixed in 4% paraformaldehyde in phosphate-buffered saline. They were blocked in 10% chicken serum and 0.1% bovine serum albumin, then treated with mouse anti-Oct3/4 (BD Biosciences, 1:200). The secondary antibody was chicken anti-mouse conjugated to AlexaFluor 488 (Invitrogen, 1:1000). Cover slips were mounted onto glass slides using Prolong Antifade Reagent with DAPI (Invitrogen). Images were taken on an Olympus iX81 microscope with a Hamamatsu camera. Pseudo-color images of Oct4, DAPI and Oct4/DAPI were displayed with color bars indicating the range of signal intensity (Fig. 2).
Fig. 2.
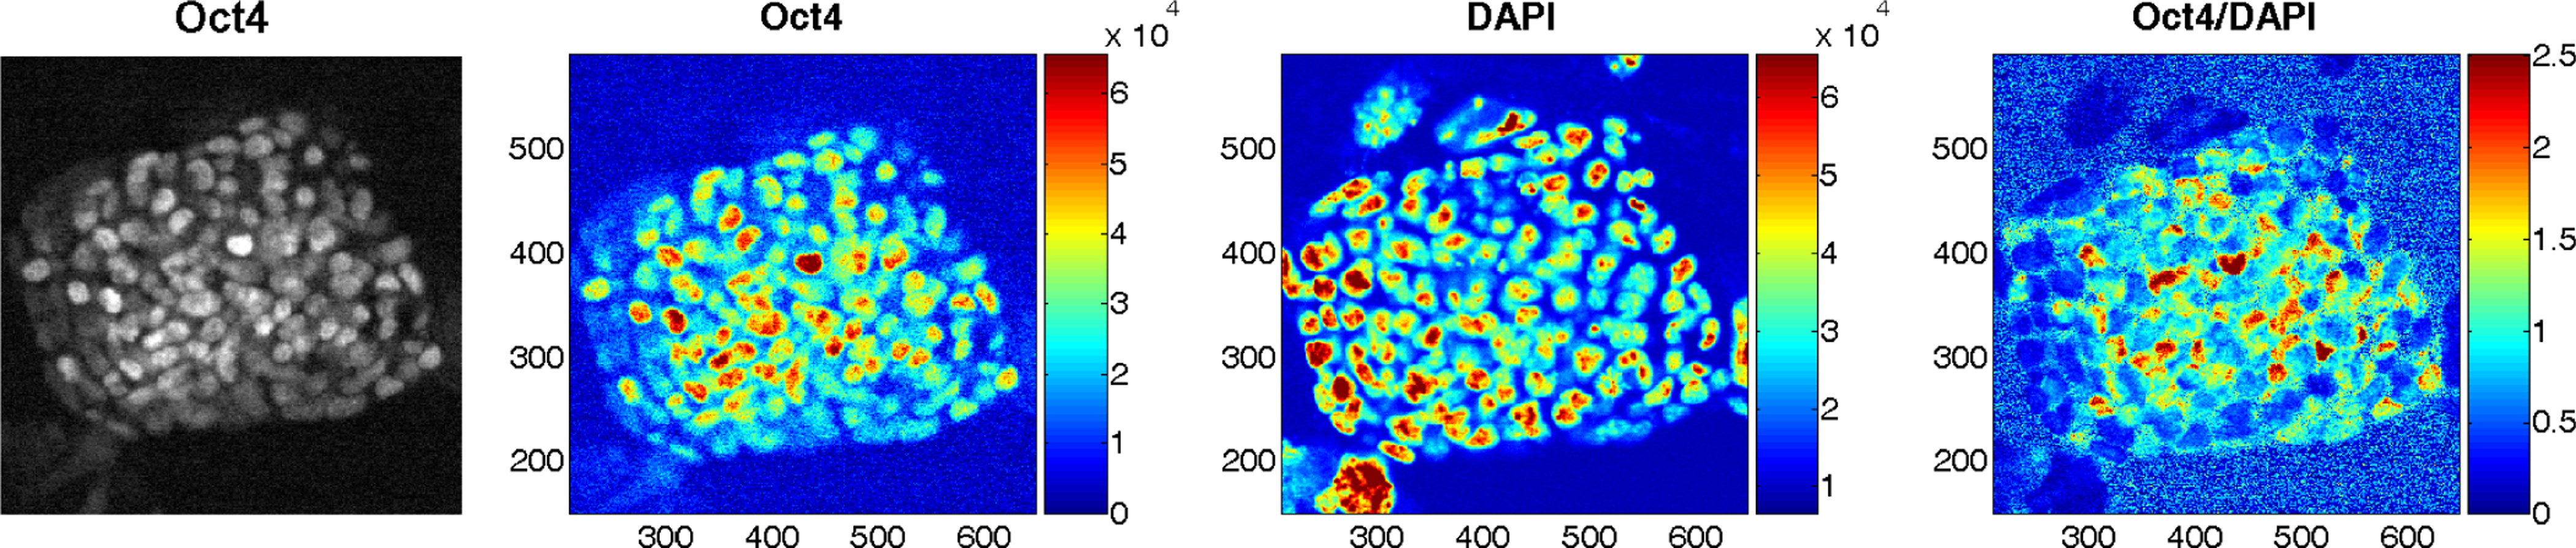
An mESC colony immunostained for Oct4 and co-stained with DAPI. From left to right: Oct4 image, pseudo-color Oct4 image, pseudo-color DAPI image, and pseudo-color ratio image of Oct4 to DAPI with the pixel intensity shown by the color bars in arbitrary units. The x and y axes represent spatial coordinates.
3. Results
Significant redox state heterogeneity was observed within individual mESC colonies as shown in Tables 1 and 2. There is a distinct but similar pattern in the NADH, Fp, and NADH redox ratio images with larger values in the central region (core) and smaller values in the periphery (rim). Figure 1 presents the typical pseudo-colored redox images of the redox state of freeze trapped flavoproteins and NADH in the mESC colonies and the corresponding histograms for the specific colony. There is a wide distribution of the nominal concentrations of NADH (∼50–600 μM) and Fp (50∼800 μM) and the NADH redox ratio (∼0.2–0.6) demonstrating the heterogeneity in all the indices.
Table 1 provides the nominal concentrations of NADH and Fp and the NADH redox ratios averaged for the core or rim of a number of colonies in each sample and the overall average values for all four samples. The differences between the core and rim are statistically significant. On average, the nominal concentrations of NADH and Fp were 323 ± 180 μM and 369 ± 177 μM, respectively, in the core, and 170 ± 78 μM and 305 ± 170 μM, respectively, in the rim. However, the nominal concentration of NADH in the rim was about 53% of that in the core, while the Fp concentration in the rim was about 80% of that in the core. Thus, the NADH redox ratio NADH/(FP+NADH) in the core (0.47 ± 0.09) was over 30% higher than that in the rim (0.35 ± 0.07) (p = 0.02). Table 2 shows that among the 20% of the ESCs with the highest NADH redox ratios in individual colonies, 71% of them fell in the core area defined by the core-rim analysis.
Figure 2 presents typical images of a mESC colony immunostained for Oct4 and co-stained with DAPI. The DAPI staining did not show any obvious core-rim difference pattern. However, both the Oct4 and the Oct4/DAPI ratio images show obvious heterogeneity in Oct4 signal intensity decreasing from the center towards the periphery. This is consistent with a previous report demonstrating that markers of pluripotency are radially organized within individual mESC colonies, with expression decreasing from core to rim.40
4. Discussion
Mitochondrial redox states are responsive to cellular energetic functions and changes in the levels of substrates and oxygen. In this study, we characterized mESC colonies by their mitochondrial redox state by imaging their NADH and Fp signals. Each colony displayed distinct heterogeneity in the redox indices, NADH, Fp, and NADH redox ratio with the core of the colony being more reduced, i.e. higher NADH redox ratio. Although the core-rim analysis may be limited by having a certain level of observer-dependence for the definition of core and rim, we have found consistent results with the independent analysis method identifying the locations of pixels with the 20% highest NADH redox ratios. The majority (71%) of them were found located in the colony core defined by the core-rim analysis. For larger image size with much more pixels, it is likely we see signal continuity throughout the image. We may then either evaluate the radial distribution of redox ratio as others have done for other markers40 or define the core and rim more objectively by signal thresholding.
As the NADH redox ratio was determined ratiometrically, it is insensitive to the heterogeneity in cell density of the colony. Note that the nominal concentrations of NADH and Fp obtained in reference to the frozen solution standards may not represent the true concentrations in the cells because the optical properties of the reference standards and the colonies may not be the same. Although both the NADH and Fp signals are higher in the core than in the rim, one must also consider that the distance between the fibreoptical probe and the colonies was smaller in the core than that in the rim, and the cell density may vary with locations as well. These factors may contribute to the higher fluorescence signals in the core than in the rim. However, they should not affect the redox ratio in which these factors tend to cancel out. The insensitivity of redox ratio to the variation of cell density and the distance between the probe and the colony surface is further supported by the lower relative errors (SD/mean) in the NADH redox ratios than that in the nominal concentrations of NADH and Fp.
Since the transcription factor Oct4 plays major roles in the establishment and maintenance of pluripotency8 and has been widely used as a marker for pluripotency of stem cells,12 we tested whether the reduced cores of mESC colonies correlated with increased Oct4 expression. Indeed, Oct4 immunocytochemistry clearly revealed heterogeneity, with the cells in the core region showing a higher level of Oct4 expression. Considering the possibility of heterogeneity in cell density and in light intensity, the sample was co-stained with DAPI to obtain the Oct4/DAPI ratio image. Higher levels of Oct4 can also be seen in the central region of the ratio image, which positively correlates with the NADH redox ratio distribution pattern. This suggests that the more reduced redox state directly correlates with pluripotency.
The heterogeneity in the redox state within individual mESC colonies revealed in this study suggests that individual colonies may contain a heterogeneous mixture of ESCs with varying potentials. As a more oxidized redox state was associated with the differentiated state of human mesenchymal stem cells,26,41 our results may indicate that peripheral cells are more differentiated (have less stemness) compared to the ones in the core region. This further suggests that mitochondrial redox state might be useful as a new marker for characterizing and sorting embryonic stem cells.
We considered the possibility that the more reduced redox state in the central region of the colony was caused by hypoxia. This is unlikely for the following two reasons: First, cells were grown under normoxic conditions (20% oxygen), and when the cover slips were taken out of the medium for snap freezing, there was plenty of oxygen in the air and the colonies were very thin (∼70 μm). Second, it has been shown that under either hypoxic (5% oxygen) conditions or in a differentiate state, human mesenchymal stem cells were more oxidized compared to normoxic (20% oxygen) conditions or the undifferentiated state.41
Redox state depends upon the levels of oxygen, ADP, and substrates. Previously, Chance et al. established five distinct states (State 1–5) of the mitochondrial respiratory chain that have varied Fp and NADH levels and the redox ratios.13–15 In the current study, there were sufficient oxygen and substrates in the growth medium, excluding the possibility of mESCs in State 1 or State 5. Given that the culture environment was substrates sufficient, the mESCs in the core of the colony were unlikely to be under the substrate starvation that was a characteristic of State 2. Further experiments are needed to determine the precise redox states of cells within mESC colonies.
The redox scanner is good for scanning tissue samples at liquid nitrogen temperature to obtain the in vivo redox state using snap-freeze technique. Scanning and storing of the samples in liquid nitrogen, can maintain the sample redox state for a long time and allows repeated imaging. An in vitro embryonic stem cell sample used for confocal microscopy under room temperature usually does not last long under intense laser and not good for repeated scanning beyond hours or days.
On the other hand, there is a limitation of spatial resolution of the redox scanner. The bore size of the emission fiber is 50 μm, which is unable to resolve the fluorescence from single mESCs. It was reported that pluripotency-associated genes were regulated by colony size.42 In the future, we will use confocal imaging to further the study under higher spatial resolution. This will permit us to determine the distribution pattern more easily and examine if and how colony size affects redox state and/or pluripotency.
5. Concluding Remarks
Redox state heterogeneity within individual mESC colonies was discovered for the first time using the low temperature redox scanner. The result showed the mitochondrial redox state of the cells in the core of a single mESC colony was more reduced than that at the periphery. Oct4 immunocytochemistry suggests that the more reduced state correlates with pluripotency. Further studies are needed to fully understand the significance of the observed phenomena. The reported data suggest that mitochondrial redox state might be a powerful and sensitive new marker for characterizing and sorting embryonic stem cells.
Acknowledgments
This research support is provided by the Institute for Regenerative Medicine at University of Pennsylvania with an IRM pilot grant (L. Z. Li). This research was also partially supported by NIH grant 2P41RR002305-26 (R. Reddy).
This article is dedicated to the memory of Dr. Britton Chance, who initiated the collaborative project and devoted himself to the entire research process with his profound insights into science and his great attention to detail.
References
- 1.Evans MJ, Kaufman MH, “Establishment in culture of pluripotential cells from mouse embryos,” Nature 292, 154–156 (1981). [DOI] [PubMed] [Google Scholar]
- 2.Martin GR, “Isolation of a pluripotent cell line from early mouse embryos cultured in medium conditioned by teratocarcinoma stem cells,” Proc. Natl. Acad. Sci. USA 78, 7634–7638 (1981). [DOI] [PMC free article] [PubMed] [Google Scholar]
- 3.Thomson JA, Itskovitz-Eldor J, Shapiro SS, Waknitz MA, Swiergiel JJ, Marshall VS, Jones JM, “Embryonic stem cell lines derived from human blastocysts,” Science 282, 1145–1147 (1998). [DOI] [PubMed] [Google Scholar]
- 4.Beddington RS, Robertson EJ, “An assessment of the developmental potential of embryonic stem cells in the midgestation mouse embryo,” Development 105, 733–737 (1989). [DOI] [PubMed] [Google Scholar]
- 5.Rossant J, “Stem cells and lineage development in the mammalian blastocyst,” Reprod. Fertil. Dev 19, 111–118 (2007). [DOI] [PubMed] [Google Scholar]
- 6.Christoforou N, Miller RA, Hill CM, Jie CC, McCallion AS, Gearhart JD, “Mouse ES cell-derived cardiac precursor cells are multipotent and facilitate identification of novel cardiac genes,” J. Clin. Invest 118, 894–903 (2008). [DOI] [PMC free article] [PubMed] [Google Scholar]
- 7.Addis RC, Prasad MK, Yochem RL, Zhan X, Sheets TP, Axelman J, Patterson ES, Shamblott MJ, “OCT3/4 regulates transcription of histone deacetylase 4 (Hdac4) in mouse embryonic stem cells,” J. Cell. Biochem 111, 391–401 (2010). [DOI] [PubMed] [Google Scholar]
- 8.Nichols J, Zevnik B, Anastassiadis K, Niwa H, Klewe-Nebenius D, Chambers I, Scholer H, Smith A, “Formation of pluripotent stem cells in the mammalian embryo depends on the POU transcription factor Oct4,” Cell 95, 379–391 (1998). [DOI] [PubMed] [Google Scholar]
- 9.Avilion AA, Nicolis SK, Pevny LH, Perez L,Vivian N, Lovell-Badge R, “Multipotent cell lineages in early mouse development depend on SOX2 function,” Genes. Dev 17, 126–140 (2003). [DOI] [PMC free article] [PubMed] [Google Scholar]
- 10.Chambers I, Colby D, Robertson M, Nichols J, Lee S, Tweedie S, Smith A, “Functional expression cloning of Nanog, a pluripotency sustaining factor in embryonic stem cells,” Cell 113, 643–655 (2003). [DOI] [PubMed] [Google Scholar]
- 11.Mitsui K, Tokuzawa Y, Itoh H, Segawa K, Murakami M, Takahashi K, Maruyama M, Maeda M, Yamanaka S, “The homeoprotein Nanog is required for maintenance of pluripotency in mouse epiblast and ES cells,” Cell 113, 631–642 (2003). [DOI] [PubMed] [Google Scholar]
- 12.Chambers I, Tomlinson SR, “The transcriptional foundation of pluripotency,” Development 136, 2311–2322 (2009). [DOI] [PMC free article] [PubMed] [Google Scholar]
- 13.Chance B, Baltscheffsky H, “Respiratory enzymes in oxidative phosphorylation. VII. Binding of intramitochondrial reduced pyridine nucleotide,” J. Biol. Chem 233, 736–739 (1958). [PubMed] [Google Scholar]
- 14.Chance B, Schoener B, Oshino R, Itshak F, Nakase Y, “Oxidation-reduction ratio studies of mitochondria in freeze-trapped samples. NADH and flavoprotein fluorescence signals,” J. Biol. Chem 254, 4764–4771 (1979). [PubMed] [Google Scholar]
- 15.Chance B, Williams GR, “Method for the localization of sites for oxidative phosphorylation,” Nature 176, 250–254 (1955). [DOI] [PubMed] [Google Scholar]
- 16.Chance B, Williams GR, “Respiratory enzymes in oxidative phosphorylation. The respiratory chain,” J. Biol. Chem 217, 429–438 (1955). [PubMed] [Google Scholar]
- 17.Chance B, “Pyridine nucleotide as an indicator of the oxygen requirements for energy-linked functions of mitochondria,” Circ. Res 38, 131–138 (1976). [PubMed] [Google Scholar]
- 18.Chance B, Cohen P, Jobsis F, Schoener B, “Intracellular oxidation-reduction states in vivo,” Science 137, 499–508 (1962). [DOI] [PubMed] [Google Scholar]
- 19.Chance B, Cohen P, Jobsis F, Schoener B, “Localized fluorometry of oxidation-reduction states of intracellular pyridine nucleotide in brain and kidney cortex of the anesthetized rat,” Science 136, 325 (1962). [DOI] [PubMed] [Google Scholar]
- 20.Chance B, Oshino N, Sugano T, Mayevsky A, “Basic principles of tissue oxygen determination from mitochondrial signals,” Adv. Exp. Med. Biol 37A, 277–292 (1973). [DOI] [PubMed] [Google Scholar]
- 21.Hassinen I, Chance B, “Oxidation-reduction properties of the mitochondrial flavoprotein chain,” Biochem. Biophys. Res. Commun 31, 895–900 (1968). [DOI] [PubMed] [Google Scholar]
- 22.Ranji M, Nioka S, Xu N, Wu B, Li LZ, Jaggard DL, Chance B, “Fluorescent images of mitochondrial redox states in in situ mouse hypoxic ischemic intestines,” JIOHS 2, 365–374 (2009). [Google Scholar]
- 23.Chance B, “Spectrophotometric and kinetic studies of flavoproteins in tissues, cell suspensions, mitochondria and their fragments,” in Flavins and Flavoproteins Slater EC, ed., pp. 498–510, Elsevier, Amsterdam; (1966). [Google Scholar]
- 24.Sato K, Kashiwaya Y, Keon CA, Tsuchiya N, King MT, Radda GK, Chance B, Clarke K, Veech RL, “Insulin, ketone bodies, and mitochondrial energy transduction,” Faseb. J 9, 651–658 (1995). [DOI] [PubMed] [Google Scholar]
- 25.Yanes O, Clark J, Wong DM, Patti GJ, Sanchez-Ruiz A, Benton HP, Trauger SA, Desponts C, Ding S, Siuzdak G, “Metabolic oxidation regulates embryonic stem cell differentiation,” Nat. Chem. Biol 6, 411 (2010). [DOI] [PMC free article] [PubMed] [Google Scholar]
- 26.Reyes JM, Fermanian S, Yang F, Zhou SY, Herretes S, Murphy DB, Elisseeff JH, Chuck RS, “Metabolic changes in mesenchymal stem cells in osteogenic medium measured by autofluorescence spectroscopy,” Stem Cells 24, 1213–1217 (2006). [DOI] [PubMed] [Google Scholar]
- 27.Gu Y, Qian Z, Chen J, Blessington D, Ramanujam N, Chance B, “High-resolution three-dimensional scanning optical image system for intrinsic and extrinsic contrast agents in tissue,” Rev. Sci. Instrum 73, 172–178 (2002). [Google Scholar]
- 28.Quistorff B, Haselgrove JC, Chance B, “High-spatial resolution readout of 3-D metabolic organ structure: An automated, low-temperature redox ratio-scanning instrument,” Anal. Biochem 148, 389–400 (1985). [DOI] [PubMed] [Google Scholar]
- 29.Chance B, “Optical Method,” Ann. Rev. Biophys. Biophys. Chem 20, 1–28 (1991). [DOI] [PubMed] [Google Scholar]
- 30.Chance B, Barlow C, Haselgrove J, Nakase Y, Quistorff B, Matschinsky F, Mayevsky A, “Microheterogeneities of redox states of perfused and intact organs,” in Microenvironments and Metabolic Compartmentation, Srere PA, Estabrook EW, eds., pp. 131148, Academic Press, New York: (1978). [Google Scholar]
- 31.Xu HN, Wu B, Nioka S, Chance B, Li LZ, “Biomedical optics calibration of redox scanning for tissue samples.” 71742F, SPIE, San Jose, CA: (2009). [DOI] [PMC free article] [PubMed] [Google Scholar]
- 32.Xu HN, Wu B, Nioka S, Chance B, Li LZ, “Quantitative redox scanning of tissue samples using a calibration procedure,” JIOHS 2, 375–385 (2009). [DOI] [PMC free article] [PubMed] [Google Scholar]
- 33.Li LZ, Zhou R, Xu HN, Moon L, Zhong T, Kim EJ, Qiao H, Reddy R, Leeper D, Chance B, Glickson JD, “Quantitative magnetic resonance and optical imaging biomarkers of melanoma metastatic potential,” Proc. Natl. Acad. Sci. USA 106, 6608–6613 (2009). [DOI] [PMC free article] [PubMed] [Google Scholar]
- 34.Xu HN, Nioka S, Glickson JD, Chance B, Li LZ, “Quantitative mitochondrial redox imaging of breast cancer metastatic potential,” J. Biomed. Optics 15, 036010 (2010). [DOI] [PMC free article] [PubMed] [Google Scholar]
- 35.Xu HN, Nioka S, Chance B, Li LZ, “Heterogeneity of mitochondrial redox state in premalignant pancreas in a PTEN null transgenic mouse model,” Adv. Exp. Med. Biol (2011) [in press]. [DOI] [PMC free article] [PubMed] [Google Scholar]
- 36.Li LZ, Xu HN, Ranji M, Nioka S, Chance B, “Mitochondrial redox imaging for cancer diagnostic and therapeutic studies,” J. Innov. Opt. Health Sci 2, 325–341 (2009). [DOI] [PMC free article] [PubMed] [Google Scholar]
- 37.Zhang Z, Blessington D, Li H, Busch TM, Glickson J, Luo Q, Chance B, Zheng G, “Redox ratio of mitochondria as an indicator for the response of photodynamic therapy,” J. Biomed. Opt 9, 772–778 (2004). [DOI] [PubMed] [Google Scholar]
- 38.Shaner NC, Campbell RE, Steinbach PA, Giepmans BN, Palmer AE, Tsien RY, “Improved monomeric red, orange and yellow fluorescent proteins derived from Discosoma sp. red fluorescent protein,” Nat. Biotechnol 22, 1567–1572 (2004). [DOI] [PubMed] [Google Scholar]
- 39.Rodda DJ, Chew JL, Lim LH, Loh YH, Wang B, Ng HH, Robson P, “Transcriptional regulation of nanog by OCT4 and SOX2,” J. Biol. Chem 280, 24731–24737 (2005). [DOI] [PubMed] [Google Scholar]
- 40.Davey RE, Zandstra PW, “Spatial organization of embryonic stem cell responsiveness to autocrine gp130 ligands reveals an autoregulatory stem cell niche,” Stem Cells 24, 2538–2548 (2006). [DOI] [PubMed] [Google Scholar]
- 41.Rice WL, Kaplan DL, Georgakoudi I, “Two-photon microscopy for non-invasive, quantitative monitoring of stem cell differentiation,” PLoS One 5(4), C10075 (2010). [DOI] [PMC free article] [PubMed] [Google Scholar]
- 42.Peerani R, Onishi K, Mahdavi A, Kumacheva E, Zandstra PW, “Manipulation of signaling thresholds in “engineered stem cell niches” identifies design criteria for pluripotent stem cell screens,” PLoS One 4, e6438 (2009). [DOI] [PMC free article] [PubMed] [Google Scholar]
- 43.Ozawa K, Chance B, Tanaka A, Iwata S, Kitai T, Ikai I, “Linear correlation between acetoacetate β-hydroxybutyrate in arterial blood and oxidized flavoprotein reduced pyridine-nucleotide in freeze-trapped human liver-tissue,” Biochimica Et Biophysica Acta 1138, 350–352 (1992). [DOI] [PubMed] [Google Scholar]
- 44.Li LZ, Zhou R, Zhong T, Moon L, Kim EJ, Qiao H, Pickup S, Hendrix MJ, Leeper D, Chance B, Glickson JD, “Predicting melanoma metastatic potential by optical and magnetic resonance imaging,” Adv. Exp. Med. Biol 599, 67–78 (2007). [DOI] [PMC free article] [PubMed] [Google Scholar]