Abstract
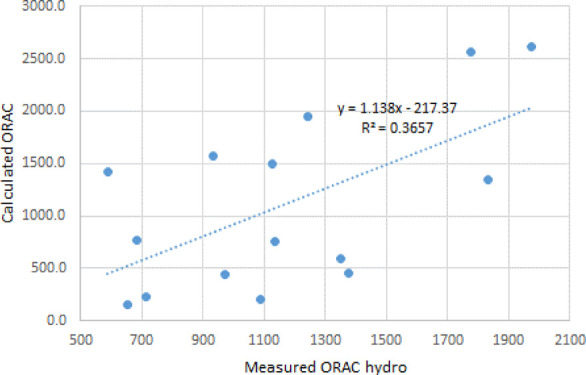
The present study measured the antioxidant properties of 15 commercial tea samples as expressed by the oxygen radical absorbance capacity (ORAC) hydro, ORAC lipo, and ferric reducing antioxidant power (FRAP) indexes. The main antioxidant compounds known to be present in tea are several catechins and catechin gallates, gallic acid, theaflavin and some theaflavin gallates, and theogallin. In this study, only gallic acid and the four most common catechins (epicatechin, epigallocatechin, epicatechin gallate, and epigallocatechin gallate) were analyzed in the tea samples. In addition, caffeine levels were measured. The ORAC and FRAP values for these compounds were also determined. The levels of theaflavin, theaflavin gallates, and theogallin were not measured since these compounds are present at relatively low levels in tea. The ORAC (and FRAP) indexes for each tea sample were also calculated based on the content of individual antioxidant compounds and their ORAC and FRAP indexes. Correlations between the experimental ORAC (and FRAP) and the calculated values were further obtained. The correlations were poor, with R2 = 0.3657 for ORAC hydro, R2 = 0.2794 for ORAC lipo, and R2 = 0.6929 for FRAP. The poor correlation between the overall catechin content and the experimental ORAC values in tea infusions was previously reported in the literature. The present study directly calculated the expected ORAC index from individual antioxidant components and reached the same result of poor correlation. For FRAP values, no comparison was previously reported in the literature. The poor correlations were not well explained, indicating that the cause of the antioxidant character of tea is more complex than simply produced by the main catechins.
1. Introduction
The antioxidant character of tea, in particular of green tea, is frequently attributed to a number of polyphenols present in tea.1−6 The correlation between the antioxidant effect of green tea and the content of polyphenols (in particular of a group of compounds known as catechins) has been previously evaluated for tea infusions1 but not for tea leaves. The correlation found between the oxygen radical absorbance capacity (ORAC) values (that characterize the antioxidant character) of the tea infusions and the content of catechins was not very good. However, the poor correlation was not well explained and an additional study with the analysis of catechins directly on the tea leave samples and including gallic acid in the list of antioxidants was considered useful. Also, since there were no studies on the correlation between the levels of catechins and the FRAP index, it was of interest to evaluate this type of correlation. The present study reevaluated the correlation between the content in catechins plus gallic acid in the tea plant material with both ORAC and FRAP values that characterize the antioxidant properties. The analysis of catechins and of gallic acid was performed using an original high-performance liquid chromatography (HPLC) method. Also, a gas chromatography/mass spectrometry (GC/MS) profiling of the tea samples was applied to potentially detect other compounds with the antioxidant character in tea. Although the GC/MS technique has limitation regarding the range of volatility for compounds amenable for the analysis, this technique was selected since it can provide useful qualitative information about the sample constituents. To extend the range of compounds detectable by GC/MS, the tea sample was subject to a derivatization using direct silylation. The plant material consisted of various commercially available teas.
2. Results and Discussion
2.1. Samples Evaluated in the Study
The tea samples evaluated in the study were commercially available. The list of these samples is given in Table 1, which also indicates the sample source. All the analyses of the samples were performed without drying the plant material. As a result, all the quantitative values reported in this study are for the sample “as is” and not on the “dry weight” basis.
Table 1. List of Tea Samples Used in this Study for Evaluating the Correlation between ORAC, FRAP, and the Polyphenol Content.
| no. | sample name | source |
|---|---|---|
| 1 | Big Green Hojicha | The Republic of Tea (Novato, CA, USA) |
| 2 | Clipper GTa | Clipper Teas Ltd. (clipper@clfdistribution.com) |
| 3 | Decaf Darjeeling | Mark T. Wendell Tea Company (Acton, MA, USA) |
| 4 | Decaf English Breakfast | Mark T. Wendell Tea Company |
| 5 | Decaf Sencha GT | Mark T. Wendell Tea Company |
| 6 | Harney Japanese GT | Harney & Sons Fine Teas (Salisbury, CT, USA) |
| 7 | Lan-Jing Pan Roasted | Jing Tea Shop (London, UK) |
| 8 | London English Breakfast | Harney & Sons Fine Teas |
| 9 | Shanghai GT | Shanghai Tiantan Int. Trading Co., Ltd. (Shanghai, China) |
| 10 | Stash GT | The Stash Tea Company (Tigard, OR, USA) |
| 11 | Stassen Organic Ceylon | Stassen Natural Foods Ltd. (Colombo, Sri Lanka) |
| 12 | Taylors Earl Grey | Taylors of Harrogate (Harrogate, UK) |
| 13 | Twinings English Breakfast | R. Twining and Company Ltd. (Painswick, UK) |
| 14 | Twinings Oolong | R. Twining and Company Ltd. |
| 15 | Two Leaves High Chai | Two Leaves and a Bud, Inc. (Basalt, CO, USA) |
GT indicates green tea.
2.2. Results for GC/MS Profiling of a Green Tea Sample
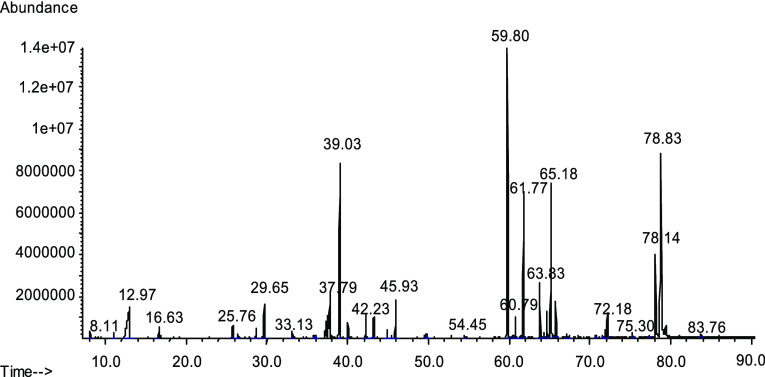
The GC/MS profiling of a green tea sample provided qualitative information regarding the composition of a tea sample. A typical GC/MS chromatogram obtained for Spl. 9 (Shanghai GT) is given in Figure 1. The identification of the main peaks from Figure 1 can be viewed in Table 2 where the retention times for individual compounds are listed. Table 2 indicates separate compounds known to have an antioxidant character and other main compounds present in tea. Some of the spectra of the silylated compounds are not available in common mass spectral libraries. The spectra of silylated epigallocatechin (EGC), epicatechin gallate (ECG), epigallocatechin gallate (EGCG), and chlorogenic acid, as obtained using standards, were obtained from the literature.7
Figure 1.
Chromatogram of silylated green tea dry leaf ( Spl. 9). The identification of main peaks is given in Table 2. (I.S. elutes at 29.65 min).
Table 2. Compound Identification for the Green Tea Chromatogram Shown in Figure 1.
| antioxidant compounds | ret. time | other main compounds | ret. time |
|---|---|---|---|
| caffeine | 37.79 | phosphate | 16.63 |
| gallic acid | 42.23 | malic acid | 25.76 |
| epicatechin | 63.83 | 5-oxoproline | 26.42 |
| catechin | 64.32 | fructose | 37.20 |
| epigallocatechin (EGC) | 65.18 | quinic acid | 39.03 |
| α-tocoferol (trace) | 68.03 | glucose | 43.22 |
| chlorogenic acid (trace) | 68.11 | myo-inositol | 45.93 |
| epicatechin gallate | 78.14 | sucrose | 59.80 |
| epigallocatechin gallate (EGCG) | 78.83 | disaccharide | 61.77 |
| gallocatechin gallate | 79.41 | disaccharide or trisaccharide | 72.18 |
Besides the compounds listed in Table 2, tea also contains compounds that are not seen in a GC/MS scan, even after the silylation of tea, and were not quantitated by the HPLC procedure previously described. Among these compounds are theaflavin and some theaflavin gallates, theogallin, some carotenoids, specific amino acids such as theanine, low levels of several aroma components such as geraniol, benzyl alcohol, linalool, etc. Some of these compounds do not have an antioxidant character except for theaflavin and theogallin, which probably are antioxidants but are at a low level in tea.1 A similar list of components was obtained for the GC/MS profiling of all types of tea, but peak intensities were frequently different.
2.3. ORAC and FRAP Results for the Tea Samples
The results for ORAC on the analyzed samples included two versions of the same procedure, one indicated as hydrophilic ORAC and the other as lipophilic ORAC. All samples were analyzed in five replicates. The results of ORAC averages expressed as μM TE/g (Trolox Equivalent) are given in Table 3. The RSD% values for all ORAC measurements were in the range between 3 and 12%. The results of FRAP averages expressed as μM Fe2+/g are given in Table 4. The RSD% values for all FRAP measurements were in the range between 3 and 14%.
Table 3. Results for Hydrophilic ORAC and Lipophilic ORAC for the Tea Samples.
| no. | sample name | hydrophilic (μM TE/g) | lipophilic (μM TE/g) |
|---|---|---|---|
| 1 | Big Green Hojicha | 714.4 | 812.7 |
| 2 | Clipper GT | 1831.0 | 1609.0 |
| 3 | Decaf Darjeeling | 682.7 | 919.3 |
| 4 | Decaf English Breakfast | 971.1 | 998.9 |
| 5 | Decaf Sencha GT | 1244.2 | 929.0 |
| 6 | Harney Japanese GT | 586.7 | 622.7 |
| 7 | Lan-Jing Pan Roasted | 1776.9 | 2062.3 |
| 8 | London English Breakfast | 1088.6 | 1089.0 |
| 9 | Shanghai GT | 1125.0 | 1060.1 |
| 10 | Stash GT | 1972.5 | 2030.4 |
| 11 | Stassen Organic Ceylon | 1350.4 | 1512.3 |
| 12 | Taylors Earl Grey | 1133.9 | 1603.9 |
| 13 | Twinings English Breakfast | 1376.7 | 1538.7 |
| 14 | Twinings Oolong | 934.0 | 1302.6 |
| 15 | Two Leaves High Chai | 653.2 | 784.9 |
Table 4. Results for FRAP for the Tea Samples.
| no. | sample name | μM Fe2+/g |
|---|---|---|
| 1 | Big Green Hojicha | 1548.4 |
| 2 | Clipper GT | 2583.7 |
| 3 | Decaf Darjeeling | 1866.6 |
| 4 | Decaf English Breakfast | 1769.0 |
| 5 | Decaf Sencha GT | 2192.4 |
| 6 | Harney Japanese GT | 1414.3 |
| 7 | Lan-Jing Pan Roasted | 2982.7 |
| 8 | London English Breakfast | 1653.7 |
| 9 | Shanghai GT | 1913.1 |
| 10 | Stash GT | 2567.1 |
| 11 | Stassen Organic Ceylon | 1278.0 |
| 12 | Taylors Earl Grey | 1629.4 |
| 13 | Twinings English Breakfast | 1443.9 |
| 14 | Twinings Oolong | 1711.0 |
| 15 | Two Leaves High Chai | 1310.9 |
2.4. ORAC and FRAP Results for Gallic Acid, Catechins, and Caffeine
The results for ORAC (hydro) and of FRAP for single compounds including gallic acid, catechins, and caffeine are listed in Table 5.
Table 5. ORAC and FRAP Values for Gallic Acid, Catechins, and Caffeine.
| compound | ORAC (μM TE/g) | FRAP (μM Fe2+/g) |
|---|---|---|
| gallic acid | 3.59 | 9.80 |
| EG-Cat | 26.86 | 13.12 |
| E-Cat | 42.20 | 14.22 |
| EG-cat-G | 15.27 | 19.61 |
| E-cat-G | 16.83 | 23.51 |
| caffeine | 0.09 | 0.00 |
2.5. Results for Levels Catechins, Gallic Acid, and Caffeine
The levels of catechins, gallic acid, and caffeine expressed in μg/g tea (as is) are given in Table 6. The results were obtained as duplicates, and the RSD% value was less than 7% for all measurements.
Table 6. Results for the Levels of Catechins, Gallic Acid, and Caffeine Expressed in μg/g for the Tea Samples as Obtained Using the HPLC Quantitation.
| no. | sample name | gallic acid | EG-cat | E-cat | EG-cat-G | E-cat-G | caffeine |
|---|---|---|---|---|---|---|---|
| 1 | Big Green Hojicha | 2310.4 | 2708.4 | 338.0 | 6690.7 | 1564.4 | 17778.5 |
| 2 | Clipper GT | 3116.5 | 2476.2 | 9142.5 | 49593.8 | 7407.3 | 19924.9 |
| 3 | Decaf Darjeeling | 10421.3 | 1645.8 | 544.3 | 24788.1 | 16697.1 | 1223.6 |
| 4 | Decaf English Breakfast | 10786.9 | 1460.4 | 589.0 | 20653.2 | 1727.8 | 2281.8 |
| 5 | Decaf Sencha GT | 1814.8 | 27354.7 | 7629.5 | 47569.9 | 9788.1 | 1508.0 |
| 6 | Harney Japanese GT | 1515.3 | 23237.4 | 5066.6 | 30460.1 | 6949.9 | 9548.6 |
| 7 | Lan-Jing Pan Roasted | 19302.2 | 20819.4 | 10591.5 | 54639.3 | 38972.9 | 33667.4 |
| 8 | London English Breakfast | 3495.0 | 542.4 | 0.0 | 4713.5 | 6299.1 | 27519.4 |
| 9 | Shanghai GT | 4653.5 | 13221.1 | 4063.9 | 42775.7 | 17500.5 | 21280.4 |
| 10 | Stash GT | 7230.7 | 39507.3 | 7670.9 | 54130.1 | 22521.1 | 22334.4 |
| 11 | Stassen Organic Ceylon | 9677.6 | 2416.9 | 1541.4 | 16171.6 | 10449.6 | 23587.4 |
| 12 | Taylors Earl Grey | 6554.4 | 1542.5 | 2887.0 | 19207.0 | 16112.4 | 25737.7 |
| 13 | Twinings English Breakfast | 6198.1 | 893.8 | 1556.1 | 12104.2 | 9651.2 | 24355.6 |
| 14 | Twinings Oolong | 3835.5 | 17900.2 | 4881.3 | 42727.1 | 12958.0 | 20428.0 |
| 15 | Two Leaves High Chai | 2538.0 | 0.0 | 0.0 | 4115.1 | 5009.0 | 16828.0 |
2.6. Calculation of ORAC and FRAP Values from those of Antioxidant Constituents and Correlation with Measured Values
The calculated ORAC of a tea sample obtained from the values of the compounds with an antioxidant character that were present in the sample should be obtained based on the formula
| 1 |
In expression 1, ORACi is the ORAC value for gallic acid (gal) and EC-cat, E-cat,... up to caffeine (caf), and Conci are the concentration of each component. A similar expression should hold true for FRAP
| 2 |
Based on the values from Tables 5 and 6, the values for ORAC were calculated using formula 1. The correlation between the calculated values and experimental ORAC hydro is shown in Figure 2.
Figure 2.
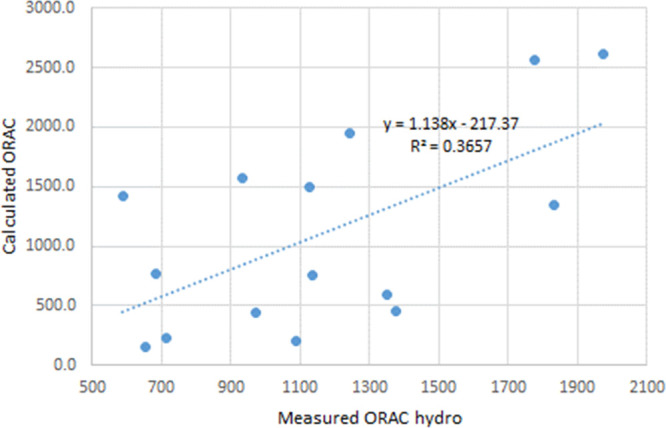
Correlation between calculated ORAC values using formula 1 and measured ORAC hydro for several tea samples.
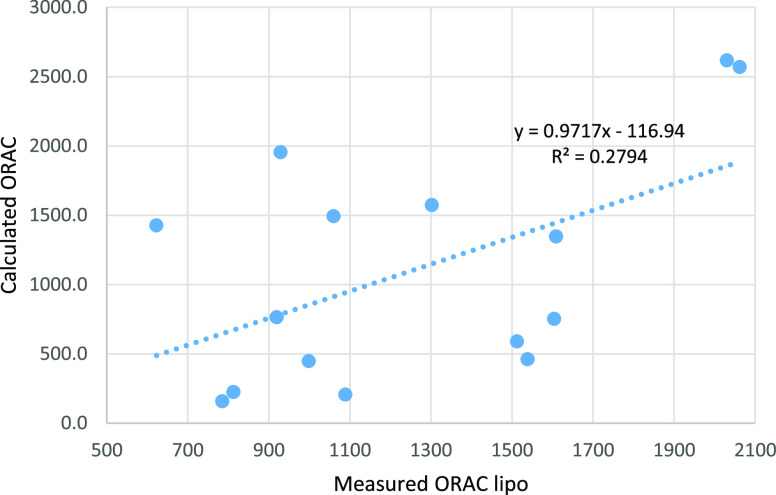
The correlation coefficient R2 between the calculated and experimental values for ORAC is rather low. Even a lower correlation is obtained between the calculated and experimental values for ORAC lipo. The graph showing the correlation is given in Figure 3.
Figure 3.
Correlation between calculated ORAC values using formula 1 and measured ORAC lipo for several tea samples.
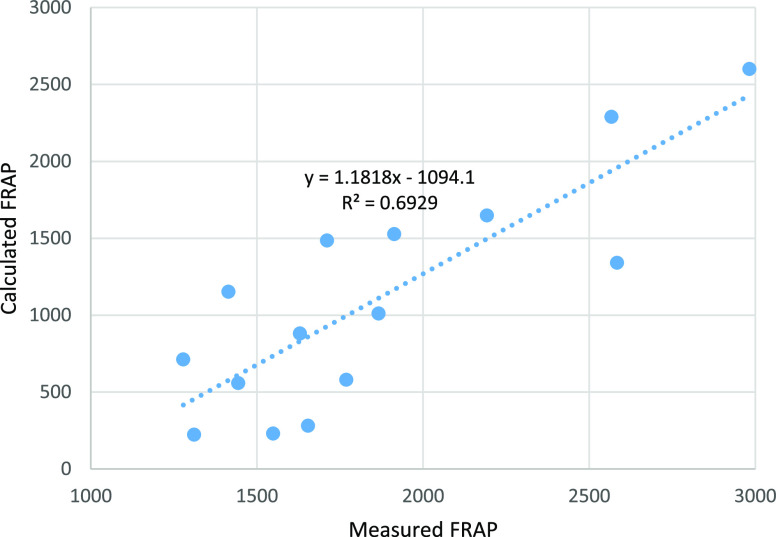
Based on the values from Tables 5 and 6, the values for FRAP were calculated using expression 2. The correlation between the calculated values for FRAP and the measured FRAP in various tea samples is shown in Figure 4.
Figure 4.
Correlation between calculated FRAP values using formula 2 and measured FRAP for several tea samples.
Correlations between the experimental ORAC (and FRAP) and the calculated values were rather poor, with R2 = 0.3657 for ORAC hydro, R2 = 0.2794 for ORAC lipo, and R2 = 0.6929 for FRAP. The poor correlation between ORAC values calculated from the antioxidant content and the experimental ORAC values was previously reported in the literature.1 The poor correlations were not well explained. The attempt of using GC/MS to identify other potential contributors to the ORAC or FRAP values did not show any chemical compounds that would have a strong antioxidant character. Potential synergistic effects of catechin mixtures may contribute to the differences between the calculated and the experimental values.
The role of tea consumption and health benefits has been frequently discussed in the literature (see, e.g., ref (8)). The tea health benefits are typically related to the antioxidant character of tea and its catechin content.3,300 Green tea that is higher in catechins and has a higher antioxidant character is typically credited with more health benefits.9,10 A poor correlation was previously reported between the catechin content and ORAC values1 of tea infusion. The present study calculated the ORAC (and FRAP) values for the tea extracts based on individual ORAC (and FRAP) values of the tea components of catechins (gallic acid and caffeine). It is because in the previously published study1 only a correlation between ORAC and the total level of catechins was evaluated that it was possible to attribute the discrepancy to the different antioxidant capability of different catechins. This assumption was proven to be not valid by the present study. However, in the present study, the calculation was performed based on ORAC values of individual catechins, and still, a poor correlation between calculated and the experimental ORAC values for tea samples was obtained. The extraction conditions for catechins (gallic acid and caffeine) utilized in present study were rather similar to the conditions of obtaining infusions reported in the literature,1 except for a longer extraction time (15 min) and lower temperature (78 °C) in the present study as compared to a 3 min extraction and 100 °C reported in the literature.1 The extraction for HPLC analysis in the conditions described in the present study was verified to be complete. The extraction for measuring the ORAC and FRAP values was not identical with the one for HPLC analysis, but the larger volume of extracting solution (double compared to the one used for HPLC analysis) basically eliminates the possibility that the lack of correlation is caused by extraction differences. A few hypotheses can be made to explain why such a discrepancy exists between the ORAC values predicted from the antioxidant character of some main antioxidant components and the experimental antioxidant values. These include the possibility that the presence of other antioxidant compounds besides catechins plays an important role in the tea antioxidant character, that some oxidants may be present in tea, which would reduce the overall antioxidant character, and that some synergistic effects take place in tea such that the final result is not equal with the sum of activity of individual components. The possibility that the tea extracts contain oligopolymers/polymers that are not measured in standard HPLC analysis or GC/MS analysis cannot be eliminated. Such oligopolymers/polymers may have an antioxidant character not captured from small-molecule HPLC analysis. The correlation between calculated and measured FRAP values is better than for ORAC but still rather low. The differences from the calculated and experimental results may be attributed to the presence in the tea of other species that have FRAP activity and were not measured. The present study is the first to report the correlation (or lack of it) between experimental FRAP for tea and the attempted calculated values from individual antioxidant components.
3. Conclusions
The present study describes the evaluation of the correlation between the content of catechins (plus gallic acid and caffeine) from several commercial teas and the ORAC and FRAP values. Catechins, gallic acid, and caffeine are measured using an original HPLC procedure, while the ORAC and FRAP values are measured using procedures recommended in the literature. The correlation between the calculated ORAC and FRAP values of the teas based on their levels of catechins (plus gallic acid and caffeine) correlates very poorly with the values of ORAC and FRAP determined experimentally for the teas.
4. Experimental Section
4.1. Materials
For ORAC measurements, Trolox (6-hydroxy-2,5,7,8-tetramethylchroman-2-carboxylic acid), AAPH (2,2 azobis(2-amidinopropane)dihydrochloride), fluorescein, and KH2PO4 and for FRAP measurements, CH3COONa, CH3COOH, TPTZ (2,4,6-tripyridyl-s-triazine), FeSO4·7H2O, and FeCl3·6H2O were all purchased from Sigma-Aldrich (St. Louis, MO, USA). Gallic acid, epicatechin, epigallocatechin, epicatechin gallate, epigallocatechin gallate, and caffeine were also obtained from Sigma-Aldrich. Other utilized chemicals, tert-butylhydroquinone, dimethylformamide (DMF), methanol, and acetone, were also obtained from Sigma-Aldrich. N,O-Bis(trimethylsilyl)-trifluoroacetamide (BSTFA) with 1% trimethylchlorosilane (TMCS) was obtained from UCT (Bristol, PA, USA). Water (18.2 mΩ/cm) was obtained from a Barnsted Nanopure unit (Thermo Scientific Rockford, IL, USA). For the filtration of plant extracts, 0.45 μm PVDF filters were used (Whatman Autovial, GE Healthcare, Little Chalfort, UK). The vials utilized were 2 mL of GC vials and 4 mL of vials with screw top caps with septa.
4.2. Instrumentation
A wrist action shaker (Burrell Co., Pittsburgh, PA, USA) was used for the extraction of the samples. Scanning of samples for ORAC measurements was performed on a Molecular Devices Gemini XPS microplate reader (Molecular Devices, Sunnyvale, CA 94089, USA). The color measurements for FRAP were performed on a Microplate Reader spectrophotometer SpectraMax 340 PC384 (Molecular Devices, Sunnyvale, CA 94089, USA). The GC/MS analysis was performed on GC/MS 7890-5975 from Agilent (Agilent Technologies Inc., Wilmington, DE, USA). The GC separation was performed on a DB5-MS 30 m, 0.25 mm i.d. chromatographic column with a 0.25 μm film from Agilent. The HPLC separation was performed on an Agilent 1200 HPLC system that consisted of a binary pump, an autosampler with cooling capability, a diode array detector (DAD), and a column thermostatted compartment. The HPLC chromatographic separation was achieved on a Prodigy 5u Phenyl-3250 × 4.6 mm column from Phenomenex (Phenomenex, Torrance, CA, USA).
4.3. ORAC Measurement
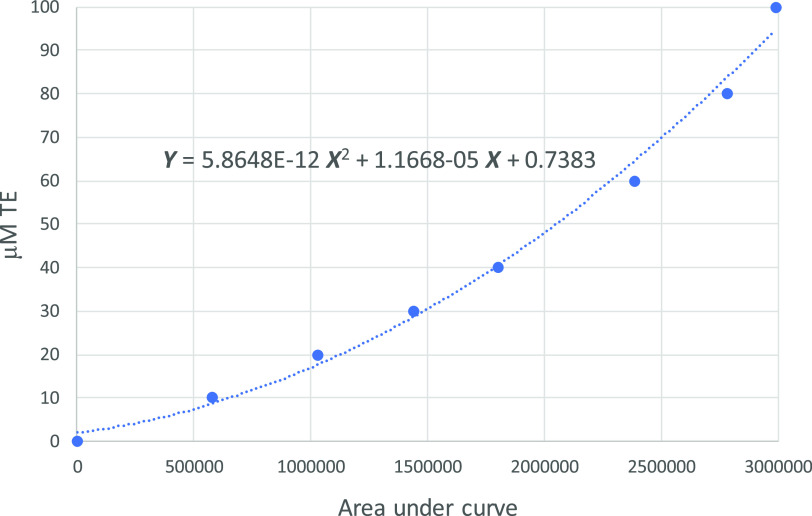
The measurement of the ORAC index was performed following a procedure described in the literature.11,12 The procedure used the measurement of fluorescence decay of the analyzed samples with an excitation wavelength of 480 nm and an emission at 530 nm. The preparations of samples for the measurement of ORAC values were performed as follows: 500 mg of a fine ground plant material (as is) was extracted with 20 mL of a solution containing 50% acetone and 50% water (v/v). The extraction was performed for 30 min on a wrist action shaker. After extraction, the liquid and solid were separated by filtration using a 0.45 μm pore PVDF filter. From the extract, 10 μL was further diluted to 1.0 mL with a diluent. This solution was further diluted as needed to bring responses within the calibration range. ORAC values were measured by two versions of the same procedure, one indicated as hydrophilic (hydro) ORAC and the other as lipophilic ORAC (lipo). For the hydrophilic version, the dilution was done with phosphate buffer solution at pH = 7.2, while for the lipophilic versions, the dilution was performed with 50% acetone and 50% water (v/v). For the calibration of the hydrophilic ORAC, the stock solution of Trolox (0.4 mM) was diluted with phosphate buffer solution at seven different levels by adding 250, 200, 150, 100, 50, 25, and 12.6 mL of stock solution and then buffered to 1 mL. For the lipophilic ORAC, the calibration concentrations were identical with those for the hydrophilic test, but the dilution was performed using 50% acetone and 50% water (v/v). With the areas from the standards, a calibration curve was obtained, plotting Y, the Trolox concentration, versus X, the area between the blank and the corresponding fluorescence curve. This type of calibration is shown in Figure 5 for ORAC hydro.
Figure 5.
Calibration curve for the calculation of Trolox concentration versus area under the curve shown in the fluorescence kinetic measurement with an excitation wavelength of 480 nm and an emission at 530 nm.
4.4. FRAP Measurement
The measurement of the FRAP index was performed following a procedure described in the literature.13 The calibration of FRAP measurement was made using a set of standards made from a stock solution of FeSO4·7H2O in the range of 100–2000 μmol/L. The stock solution in this study was made from 56.82 mg of FeSO4·7H2O in 100 mL of solution in water and corresponded to 2044 μmol/L of Fe2+. From this solution, eight standards containing between 2044 and 127.8 μmol/L were prepared by dilution with water. For the measurement, 200 μL of the reagent was added to each used cell of a 96-well plate. The plate (by itself) was allowed to equilibrate at 37 °C for 10 min. After the equilibration, 10 μL of the sample (or standard) was added to each cell and the absorbance was measured every 30 s for a period of 10 min at 620 nm. The calibration with Fe2+ standard solutions was linear and generated an equation of the form
| 3 |
where A is the absorbance reading. For samples with a continuous increase in absorbance for a certain period of time followed by a plateau, the plateau reading was used as measurement. For the sample with a continuous increase in absorbance that does not show a stable value, an arbitrary end time was selected for the reading (e.g., 10 min) for all samples.
4.5. Scanning GC/MS Technique
For this analysis, duplicate samples of the 50 mg plant material were weighed (with a 0.1 mg precision) in GC vials. The samples were directly silylated. For this purpose, each vial with the sample were added 0.4 mL of DMF with internal standards and 0.8 mL of BSTFA with 1% TMCS. The internal standard was tert-butylhydroquinone at a concentration of 400 μg/mL in DMF. The vials were kept at 78 °C (in a heating block) for 30 min and were allowed to cool at room temperature for another 30 min. After cooling, the solution from each vial was filtered using a 0.45 μm PTFE filter into another GC vial and used for the GC/MS analysis.7 The GC/MS analysis was performed on the DB-5 column in conditions consisting of ramping the oven temperature between 50 and 320 °C. The carrier gas was hydrogen used at a constant flow of 1 mL/min. The injection type was split (30:1 ratio), and the injection volume was 1 μL. The compound identification was performed using NIST14 library searches. All peak areas in the total ion chromatogram (TIC) were normalized by the peak area of the internal standard tert-butylhydroquinone. Although the response factor is different from compound to compound, the normalized peak areas still allow a comparison of the relative content of each compound, although this is not a quantitation but only an indication if a compound is present at a larger or lower level.
4.6. HPLC Procedure for Catechins, Gallic Acid, and Caffeine Analysis in Tea.
For this analysis, 100 mg of the tea sample was weighed in 4 mL vials. To each vial was added with 2 mL of water. The extraction was performed by heating the vials for 15 min at 78 °C followed by cooling and filtration using 0.45 μm PTFE filters. For assessing the completeness of extraction, the extracted samples from two different types of tea (tea Spl. 1 and tea Spl. 3 from Table 1) were removed from the filter and allowed to dry under room conditions. From this material, 50 mg of dry extracted tea was reextracted with 1 mL of water in the same conditions as the initial material. The extract from these samples was also submitted for HPLC analysis. The HPLC separation on the Prodigy 5u Phenyl-3 column was performed in gradient conditions with solvent A water and solvent B methanol. The gradient started with solvent A at 95%, then to 65% at 4 min holding for 1.5 min, and to 0% at 10 min holding for 2 min. The initial conditions were restored at 12.5 min holding for another 2.5 min. The injection volume was 3 μL, and the reading was performed at 270 nm. A typical chromatogram for a green tea extract obtained in these conditions is given in Figure 6.
Figure 6.
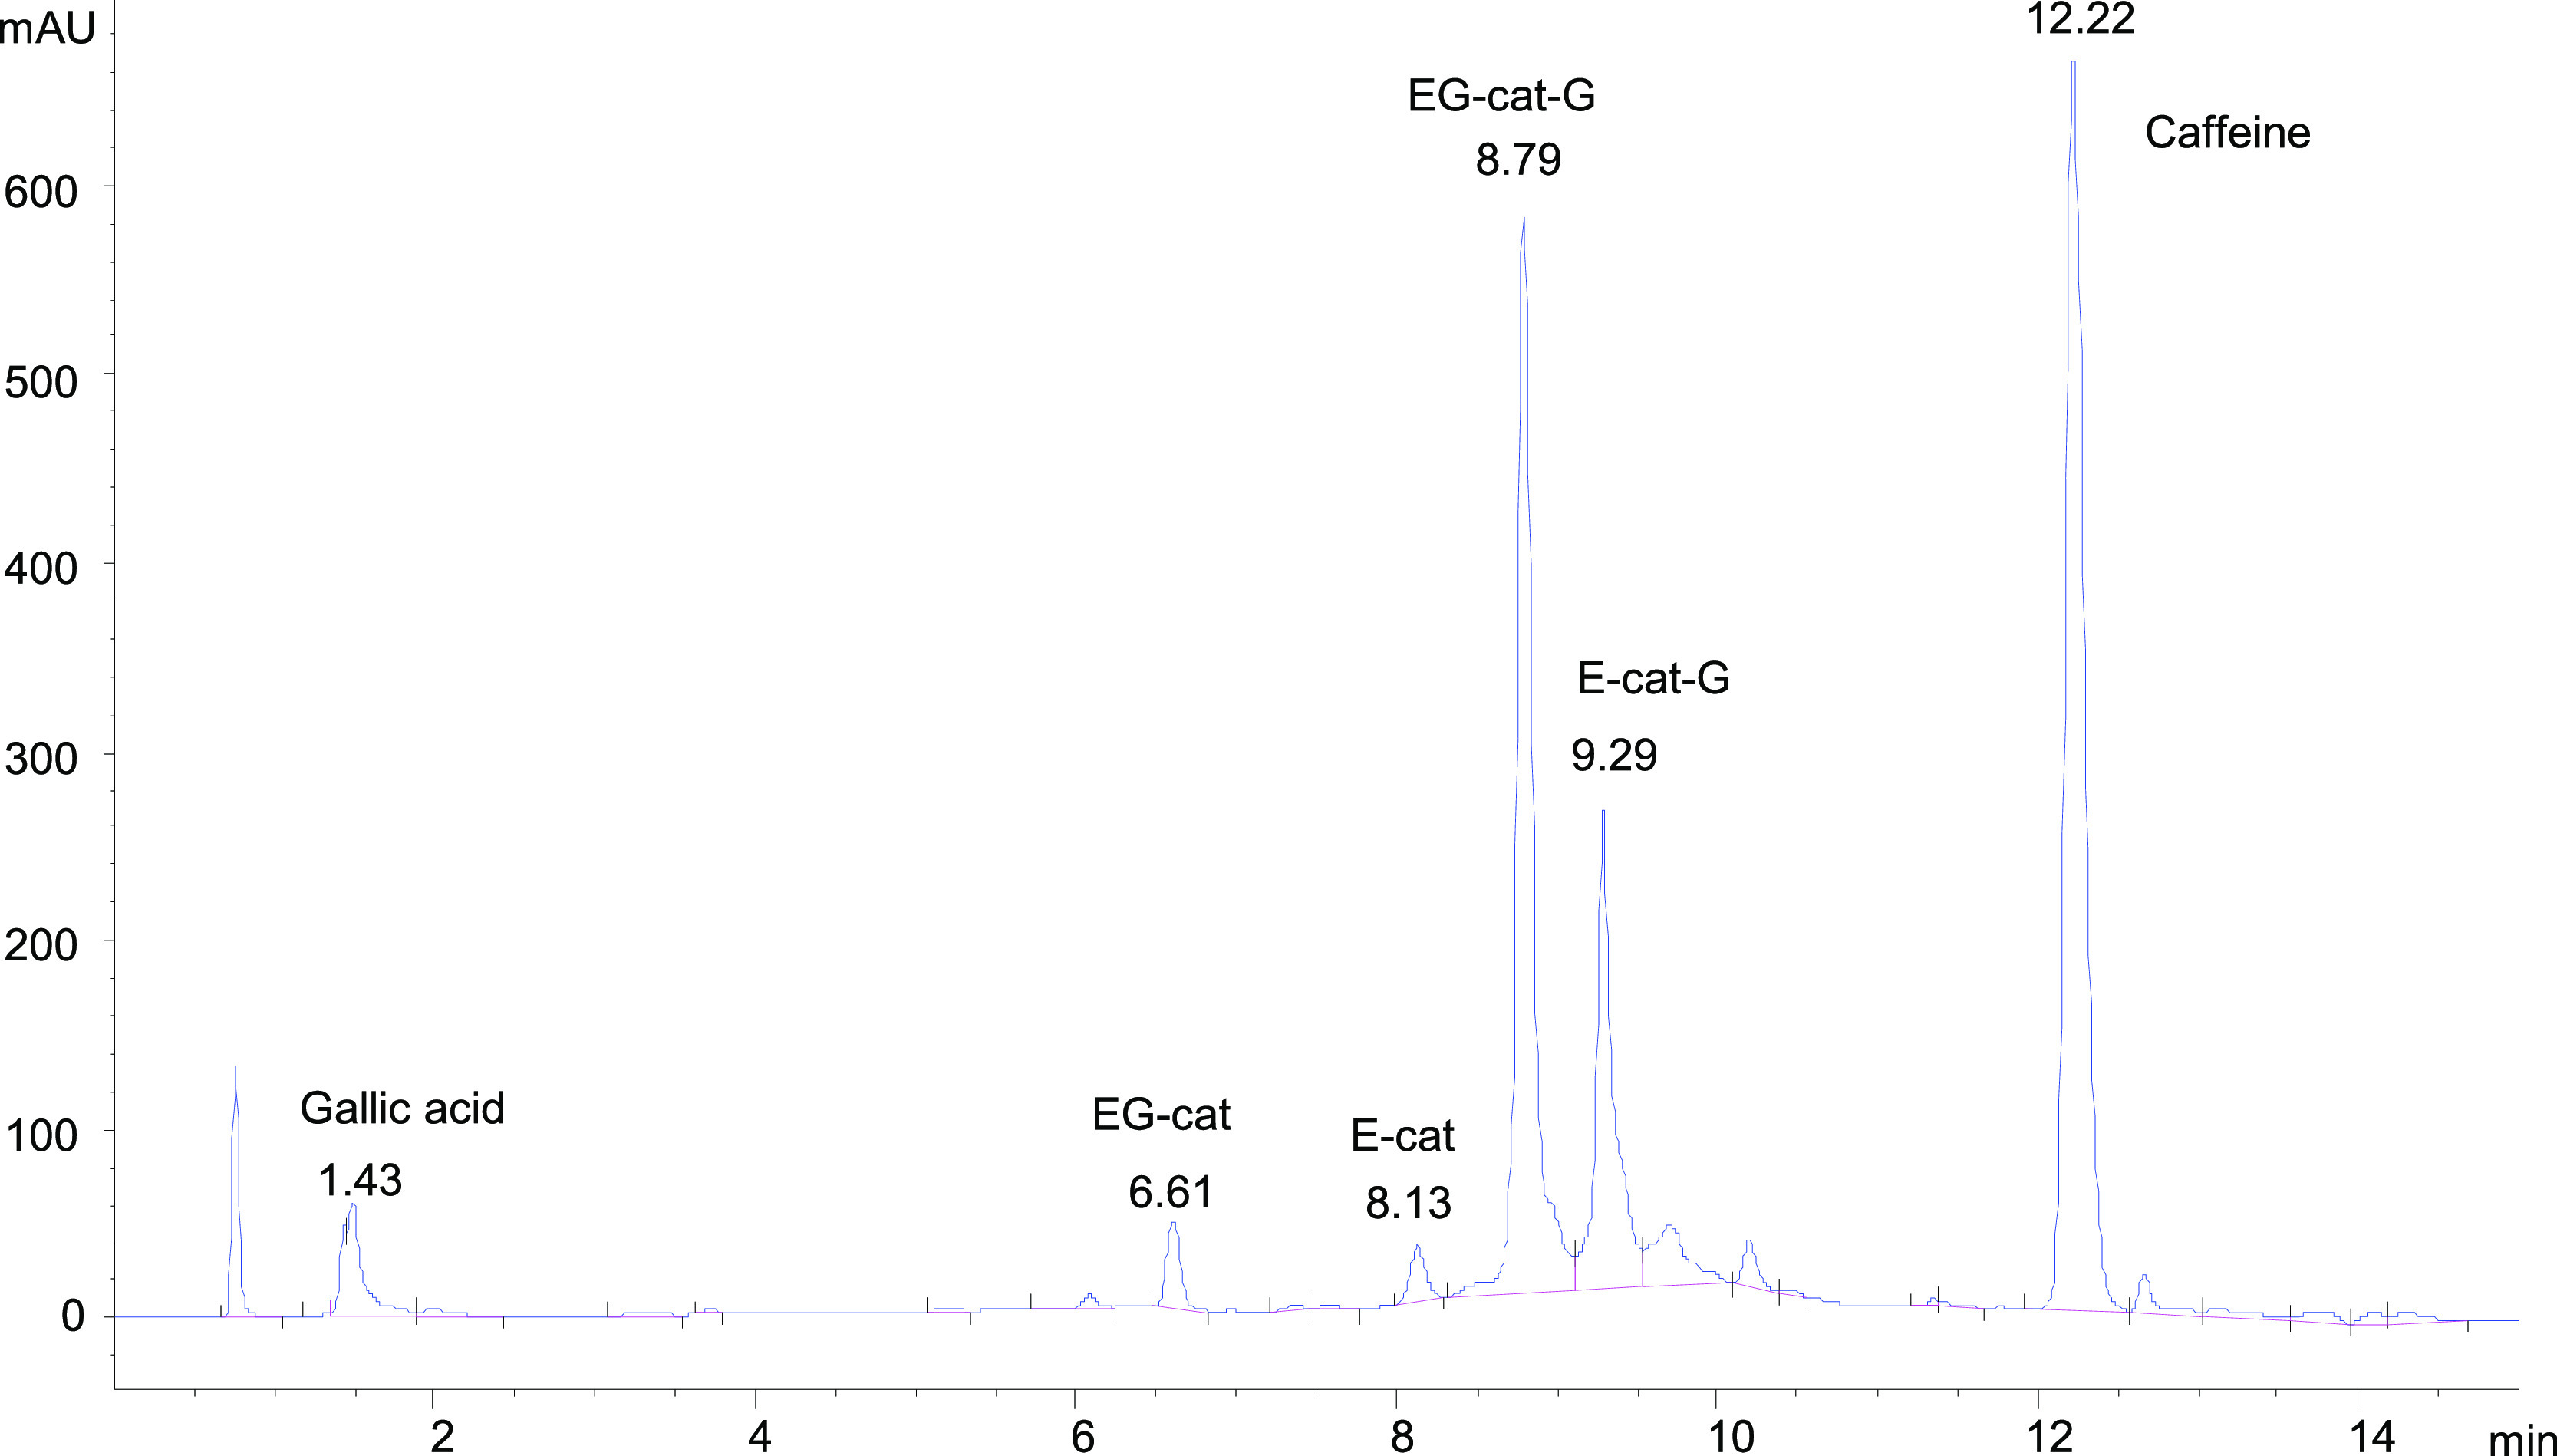
HPLC chromatogram of a green tea extract.
The quantitation of catechins, gallic acid, and caffeine was performed using calibration curves. No internal standard was used in the calibration. The calibrations were obtained using a set of five standards for each compound with the following concentration ranges: gallic acid (1001.60–83.47 μg/mL), epicatechin (520.00–43.33 μg/mL), epigallocatechin (510.00–42.50 μg/mL), epicatechin gallate (505.00–42.08 μg/mL), epigallocatechin gallate (500.00–41.67 μg/mL), and caffeine (2001.60–166.80 μg/mL). The calibration curves were best approximated using quadratic equations of the form
| 4 |
where Y is the concentration of the analyte in μg/g and X is the area count of the chromatographic peak. The parameters a, b, and c and the regression R2 coefficients are indicated in Table 7 for the analyzed compounds. As shown in Table 7, all calibrations provided very good R2 values.
Table 7. Parameters a, b, and c and the Regression R2 Coefficient for the Analyzed Compounds.
| compound | acronym | a | b | c | R2 |
|---|---|---|---|---|---|
| gallic acid | –1.8159 × 10⁻⁴ | 9.2214 × 10⁻¹ | –4.5096 × 10⁻¹ | 0.9979 | |
| epicatechin | E-cat | –6.3782 × 10⁻⁴ | 1.4163 × 10 e0 | –2.1824 × 101 | 0.9997 |
| epigallocatechin | EG-cat | –4.0559 × 10⁻³ | 3.4536 × 10 | –1.4703 × 101 | 0.9937 |
| epicatechin gallate | E-cat-G | –2.0346 × 10⁻⁴ | 6.9423 × 10⁻¹ | –4.1047 × 101 | 0.9974 |
| epigallocatechin gallate | EG-cat-G | –2.9265 × 10⁻⁴ | 8.0861 × 10⁻¹ | –8.1673 × 10 | 0.9950 |
| caffeine | –4.0705 × 10⁻⁶ | 2.2556 × 10⁻¹ | –6.4707 × 101 | 0.9997 |
A summary validation was performed for the HPLC analysis. The selectivity of the procedure was assured by the good HPLC separation and by selectivity of the use of 270 nm measurement specific for the analytes. From the signal-to-noise ratio (S/N) of the peaks in the chromatogram of the lowest standard mixture, it was estimated that the LOD for the analytes was about 20 times lower than the lowest standard used for the calibration. This result indicated that LOQ values for the analytes were the following: 13.9 μg/mL for gallic acid, about 7.2 μg/mL for catechins, and about 27.8 μg/mL for caffeine. The analysis of the reextracted tea samples (tea Spl. 1 and tea Spl. 3 from Table 1) generated levels below LOQ for all analytes in the sample demonstrating efficient extraction using previously described conditions.
The authors declare no competing financial interest.
References
- Henning S. M.; Fajardo-Lira C.; Lee H. W.; Youssefian A. A.; Go V. L. W.; Heber D. Catechin content of 18 teas and a green tea extract supplement correlates with the antioxidant capacity. Nutr. Cancer 2003, 45, 226–235. 10.1207/S15327914NC4502_13. [DOI] [PubMed] [Google Scholar]
- Graham H. N. Green tea composition, consumption, and polyphenol chemistry. Preventive Med. 1992, 21, 334–350. 10.1016/0091-7435(92)90041-F. [DOI] [PubMed] [Google Scholar]
- Friedman M.; Kim S.-Y.; Lee S.-J.; Han G.-P.; Han J.-S.; Lee K.-R.; Kozukue N. Distribution of catechins, theaflavins, caffeine, and theobromine in 77 teas consumed in the United States. Food Chem. Toxicol. 2005, 70, C550–C559. 10.1111/j.1365-2621.2005.tb08304.x. [DOI] [Google Scholar]
- Yang C. S.; Chung J. Y.; Yang G.-y.; Chhabra S. K.; Lee M.-J. Tea and tea polyphenols in cancer prevention. J. Nutr. 2000, 130, 472S–478S. 10.1093/jn/130.2.472S. [DOI] [PubMed] [Google Scholar]
- Zhong L.; Goldberg M. S.; Gao Y.-T.; Hanley J. A.; Parent M.-É.; Jin F. A population-based case-control study of lung cancer and green tea consumption among women living in Shanghai. China. Epidemiology 2001, 12, 695–700. 10.1097/00001648-200111000-00019. [DOI] [PubMed] [Google Scholar]
- Yang C. S.; Landau J. M.; Huang M.-T.; Newmark H. L. Inhibition of carcinogenesis by dietary polyphenolic compounds. Annu. Rev. Nutr. 2001, 21, 381–406. 10.1146/annurev.nutr.21.1.381. [DOI] [PubMed] [Google Scholar]
- Santhosh K. T.; Swarnam J.; Ramadasan K. Potent suppressive effect of green tea polyphenols on tobacco-induced mutagenicity. Phytomedicine 2005, 12, 216–220. 10.1016/j.phymed.2003.09.011. [DOI] [PubMed] [Google Scholar]
- Moldoveanu S.The utilization of gas chromatography/mass spectrometry in the profiling of several antioxidants in botanicals. In Advances in Gas Chromatography; Guo X., Ed., Intech: Rijeka Croatia, 2014; pp. 103–133. [Google Scholar]
- Preedy V. R.Tea in Health and Disease Prevention; Elsevier: Amsterdam, 2013. [Google Scholar]
- Bushman J. L. Green tea and cancer in humans: a review of the literature. Nutr. Cancer 1998, 31, 151–159. 10.1080/01635589809514697. [DOI] [PubMed] [Google Scholar]
- Blot W. J.; McLaughlin J. K.; Chow W.-H. Cancer rates among drinkers of black tea. Crit. Rev. Food Sci. Nutr. 1997, 37, 739–760. 10.1080/10408399709527800. [DOI] [PubMed] [Google Scholar]
- Ou B.; Hampsch-Woodill M.; Prior R. L. Development and validation of an improved oxygen radical absorbance capacity assay using fluorescein as the fluorescent probe. J. Agric. Food Chem. 2001, 49, 4619–4626. 10.1021/jf010586o. [DOI] [PubMed] [Google Scholar]
- Ou B.; Hampsch-Woodill M.; Flanagan J.; Deemer E. K.; Prior R. L.; Huang D. Novel fluorometric assay for hydroxyl radical prevention capacity using fluorescein as the probe. J. Agric. Food Chem. 2002, 50, 2772–2777. 10.1021/jf011480w. [DOI] [PubMed] [Google Scholar]
- Benzie I. F. F.; Strain J. J. The ferric reducing ability of plasma (FRAP) as a measure of “antioxidant power”: The FRAP assay. Anal. Biochem. 1996, 239, 70–76. 10.1006/abio.1996.0292. [DOI] [PubMed] [Google Scholar]


