

Abstract
Metal-enhanced fluorescence (MEF) has become an increasingly important technology in recent years, with thorough research addressing the fundamentals of MEF. In many studies, spectral distortion is observed in the enhanced spectra as compared to free-space fluorescence emission profiles. Despite this observation, very little experimentation has hitherto been undertaken to investigate the mechanistic underpinnings of spectral distortion in MEF. Herein we investigate MEF spectral distortion using Rose Bengal and Fluorescein on silver nanoparticle substrates, subsequently isolating the coupled fluorescence spectrum for a deeper understanding of the spectral modifications. Clear experimental evidence for bathochromic distortion is reported. Remarkably, we also report hypsochromic distortion in one of the first experimental observations of plasmonic coupling to high-energy excited states. Additionally, the coupled fluorescence spectra from other published literature has also been both extracted and examined, and the subsequent spectral distortion reported here. The previously asserted theory of radiative decay rate modification for spectral distortion is discussed in the context of both plasmonic properties as well as fluorophore photophysical characteristics including lifetime and quantum yield. The dual enhancement mechanism of MEF is also explored in the context of spectral distortion. The results and discussion reported herein subsequently provide one of the first comprehensive examinations of spectral distortion in MEF to date.
Graphical Abstract

1.0. INTRODUCTION
Metal-enhanced fluorescence (MEF) has become an increasingly important and well-researched technology in fields such as biotechnology, diagnostics and even electronics.1–3 Many literature reports explore the synthesis of novel MEF platforms, tuning the properties of both fluorophores and their corresponding metal nanomaterials for expanded applications.4–7 In fact, the growing trend in MEF research focuses on synthesis and development for applications. Previous studies have also extensively investigated the mechanism of MEF and have identified key features such as the presence of two main enhancement mechanisms for plasmonic amplification of fluorescence: namely enhanced absorption and enhanced fluorescence.8–10 In the case of enhanced absorption, far-field excitation of the metal nanoparticles yields enhanced electric fields near-to the metal nanoparticles that preferentially excite nearby fluorophores in this region. The total fluorophore solution volume that experiences this field can be considered the “MEF region”; this volume can be tuned by varying the excitation laser power and therefore irradiance and is termed the MEF excitation volume effect (EVE) in the research literature.10, 11 In the case of enhanced emission, fluorophore dipoles both couple to and induce surface plasmons such that the fluorophore-metal system radiates collectively as a unit. Both mechanisms are through-space and distance dependent,12–15 as shown schematically in Figure 1a. To address the fundamentals of MEF, effects of metal nanoparticle substrate properties such as localized surface plasmon resonance (LSPR) and synchronous scattering (λex = λem) spectral profiles have been investigated to tune enhancement.16–18 Modifications in fluorophore properties such as lifetime and quantum yield from plasmonic amplification have also been reported, demonstrating the differences between classical free-space emission and MEF;19–22 however, to date little experimental investigation or discussion has been reported for the widely observed spectral distortion in MEF,23–25 although changes in spectral profile have been observed for enhanced fluorescence.26–29 One of the few specific and focused discussions of spectral distortion in MEF was presented by Le Ru et al. in 2010, where they suggested that spectral modification was the result of radiative decay rate modification of enhanced fluorescence.8 The authors suggest that when strong coupling occurs for the fluorophore-nanoparticle system, the decay rate of individual transitions is enhanced; this enhancement may lead to a change in density of states in MEF versus the typical distribution characteristic of free-space classical fluorescence. They report a theoretical correlation between fluorophore emission overlap with the metal LSPR peak at individual wavelengths, stating that efficient overlap may lead to significant enhancement. This implies that distortion patterns would therefore follow the intensity of the metal LSPR trends at subsequent wavelengths. Le Ru proposes that this effect may lead to amplification of transitions in both the “ultra-fast” and “slow dynamics” regime, described schematically in Figure 1b. For classical fluorescence, excitation occurs to an excited non-zero vibronic energy level, S1(ω). Rapid and non-radiative internal conversion then occurs, bringing the fluorophore to the lowest energy excited state, S1(0), before radiative decay and fluorescence emission, S1(0)→S0(ω). The density of states for all radiative transitions in these conditions is determined by the Boltzmann distribution, which leads to the spectral profile observed in classical fluorescence. In the case of MEF, the probability of each transition to a non-zero ground state vibronic level, S0(ω), is altered, based on radiative decay rate enhancement. As such, the classical Boltzmann distribution is modified on the red-edge and spectral distortion is predicted, as pictured in Figure 1b. In dramatic cases, large bathochromic shifts may be observed (not pictured). This case is described as the “slow dynamics” (SD) regime by Le Ru et al.; in contrast, amplification may also occur by coupling of the metal nanoparticle plasmons to a non-zero excited vibronic state, S1(ω), before internal conversion may occur. This is termed the “ultra-fast dynamics” (UFD) regime and can result in large hypsochromic shifts as pictured in Figure 1b; in less dramatic cases, blue-edge distortion could be observed (not pictured). To experimentally address this theory and also investigate other potential sources of spectral distortion in MEF, we report herein the trends in spectral modification for fluorophores including Rose Bengal and Fluorescein on silver nanoparticle substrates. The resulting observations and discussion establish a deeper understanding of this characteristic feature in metal-enhanced fluorescence.
Figure 1.

Diagrams depicting the radiative transitions responsible for spectral distortion in metal-enhanced fluorescence (MEF). A) Schematic of the electric field from an excited silver island film and proximal fluorophores (F) with resulting relative emission color from free-space fluorescence, slow dynamics (SD) MEF, and ultra-fast dynamics (UFD) MEF. B) Modified Jablonski diagrams for left – fluorescence, middle – SD MEF, and right – UFD MEF with corresponding theoretical distortion effects depicted.
2.0. EXPERIMENTAL METHODS
2.1. Materials.
Fluorescein disodium salt and Rose Bengal were purchased from Sigma-Aldrich, USA. Silver pellets used in thermal vapor deposition were purchased from Kurt J. Lesker Company, USA. All chemicals used in the wet preparation of silver island films (SiFs) were prepared according to a previous report from our laboratory.30 All solvents used were of spectrophotometric grade.
2.2. Film preparation.
Silvered slides were made via dry or wet deposition methods. For the former, an Edwards 306 thermal vapor deposition system was used, with a deposition rate of 0.3 nm/sec at a typical pressure of 5e-6 torr. A quartz crystal oscillator was used to monitor the rate and overall deposition thickness for each run. Film sizes reported for the dry deposition silver films correlate to the thicknesses reported from these runs. The wet deposition method was used for the preparation of SiFs, as described in previous publications from our laboratory;31 in brief, a solution of silver nitrate was mixed with sodium hydroxide followed by ammonium hydroxide then cooled to 5°C. Silane-prep™ slides were then submerged in the solution, D-glucose was added, and the system was warmed to 30°C. Films were removed, washed with water, and sonicated at room temperature.31 The films are characterized by absorption measurements. All slides were stored under a vacuum to minimize oxidation.
2.3. Spectroscopic Measurements.
Absorption values of the films were recorded using a Cary 60 Bio UV-Vis spectrograph from Agilent Technologies. The silvered slide was oriented perpendicular to the beam, and an uncoated glass microscope slide was used as the sample blank to establish a baseline. Absorption values reported herein correspond to the maximum absorption intensity for each film, at approximately 380 nm. Synchronous scattering spectra,16 or spectra recorded when the excitation wavelength is set equal to the emission wavelength (λex = λem), were detected using a Varian Cary Eclipse spectrophotometer equipped with a plate reader accessory. To minimize background, the slides were placed on an absorptive neutral density filter before being mounted perpendicular to the plate reader beam.
Fluorophore absorption spectra were detected also using the Cary 60 Bio UV-Vis spectrograph, with a sample pathlength of 1-cm from a standard glass cuvette. The instrument was zeroed using deionized water as the blank. Extinction coefficients (ε) were determined by preparing three solutions of varying concentrations for each fluorophore; absorption measurements were then taken and ε calculated for each wavelength of interest by equation 1:
| (1) |
where A is the absorption intensity, l is the pathlength, and [F] indicates the concentration of fluorophore. Error was calculated by propagating experimental error through all calculations.
Fluorophore (concentrations = 10 μM) emission on the silver films and glass slide controls were detected using an HR+ 2000 spectrograph from Ocean Optics, with emission light collected via a 600 μm diameter core optical fiber from Ocean Optics. Emission was filtered through a 473 nm Razor Edge filter (Semrock, USA) to prevent the detection of scattered excitation light. Samples were excited parallel to the film surface normal (P orientation) using a 473 nm laser. Excitation power was adjusted using a variable metallic neutral density filter and was subsequently measured using a PM100D meter equipped with a silicon photodiode sensor of model S121C (Thorlabs, USA) prior to sample excitation. Spectral resolution for the above indicated measurements was ± 1 nm. All reported spectra are the average of a minimum of n = 3 trials; corresponding standard deviation is minimal and is therefore not observable in the spectra.
2.4. Data Extraction, Analysis and Calculations.
Fluorescence intensities were extracted from image files of plotted intensities for all fluorophores on all substrates. Figure axes were fit to a set centimeter grid (or pixel) scale, and both intensity and wavelength values were recorded in either centimeters or pixels at regular wavelength intervals (spectral resolution of ±1 or ±2 nm). Each pixel value was converted to its corresponding original intensity or wavelength unit according to the data scale and was plotted in Microsoft® Office Excel. The grid extraction method afforded the most error per data point, corresponding to a ± 2.5 a.u. fluorescence intensity error for the raw spectra and ± 3.5 a.u. for the coupled fluorescence spectra (see below). For all reported peaks this corresponds to ≤15% relative error and is therefore not visualized or reported in the figures. For more detail regarding the extraction procedure, see the supplemental material, Appendix B. These data were then smoothed by a moving average from five data points and plotted as a smoothed curve alongside the raw data to display trends. All subsequent data analysis was performed using the raw data. This procedure was performed for both the collected data and for additional literature analysis, as reported in later sections. Using the extracted data, metal-enhanced fluorescence (MEF) enhancement factors (EF) were calculated at all emission wavelengths (λ) of each spectrum according to equation 2:
| (2) |
where I is the fluorescence intensity at the emission wavelength of interest for fluorescence detected on either metal nanoparticle (M) or glass substrates (G).
Using the raw fluorescence data, an additional spectrum defined as the “coupled fluorescence” (CF) spectrum was calculated according to equation 3 for each data set:
| (3) |
For this equation, [Ix]λ is the fluorescence intensity at each wavelength (λ) for the x spectrum of fluorescence detected on metal nanoparticle substrate (x = M), detected on glass substrate (x = G), or calculated as coupled fluorescence (x = CF). Data deconvolution was performed for the CF spectra using the Excel Solver add-in to fit select spectra to a multi-Gaussian distribution described by equation 4,
| (4) |
where Icalc,λ is the fluorescence intensity calculated at each wavelength (λ) analyzed in the CF spectrum and a, b, and c are all constant variables determined for single Gaussian components 1 through n. Total number of components for each spectrum were selected to optimize the R2 value and minimize the sum squared residuals. Calculated sum squared residual (SSRλ) and residual (Rλ) values, shown by equations 5 and 6 respectively, were weighted at each wavelength according to an assumed Poisson distribution where the relative weight (WR, λ) can be approximated by equation 7,32
| (5) |
| (6) |
| (7) |
where ICF,λ is the fluorescence intensity obtained after data extraction and determination of the CF values.
Following spectral deconvolution, percent area contribution (%AC) values were obtained for each spectrum according to equations 8 and 9,
| (8) |
| (9) |
where AT is the total integrated area of the multi-Gaussian fit and An is the integrated area of a single Gaussian component for 1 through n total integer components of the fit. In some cases, percent area contributions of single components are summed over a range relative to the peak emission wavelength (λmax) of the fluorophore detected on glass. For more information regarding these calculations and wavelength range definitions, see the supplemental material, Appendix C.
3.0. EXPERIMENTAL RESULTS
3.1. Spectral distortion in the spectra of Rose Bengal on silver nanoparticle films.
Spectral distortion has been observed by our lab previously for MEF from Rose Bengal on silver nano-substrates.27 In order to more closely examine and analyze these changes, solutions of Rose Bengal were excited on silver nanoparticle-coated or glass slides as shown in Figure 2a. The silver nanoparticle slides were obtained using the vapor deposition (dry) method and displayed a film thickness of 3 nm (abbreviated AgNPs). With this method, nanoparticles grow in size and decrease inter-particle spacing over time; this phenomenon, similar to “Oswald Ripening,” is also the growth mechanism for silver island films (SiFs) and is described schematically in Figure 2b.33 SiFs present an alternative nano-silvered substrate to the thermal vapor deposition method and will be discussed further in later sections. Photographs of both the AgNP and SiF substrates can be found in supplemental Figure S1.
Figure 2.

Experimental schematic for the detection of metal-enhanced fluorescence (MEF) from silvered substrates. A) Experimental set up with excitation source (hν) and resulting fluorescence collection. B) Diagram depicting the changing particle size geometries (Oswald ripening) of silver island films (SiFs) with varying absorption values.
For AgNP substrates, excitation of Rose Bengal was conducted using a 0.32-Wcm−2 laser irradiance. As anticipated, notable fluorescence enhancement was observed relative to the fluorophore on a blank glass slide alone (Fig. 3a). Surprisingly, the resulting MEF spectrum displays a distinct red-shift in wavelength maximum (λmax), with an overall change of approximately 8 nm (Fig. 3b). This alone indicates significant spectral distortion for Rose Bengal on AgNPs, however, there is also a clear wavelength-dependence of the enhancement factor (EF) as well; in fact, the strongest MEF response was observed at approximately 595 nm emission, which is a substantial bathochromic shift from the wavelength maximum of glass (Fig. 3a). Significantly strong enhancement factors were also observed in the hypsochromic (or blue edge) region, centered at 510 nm (Fig. 3a).
Figure 3.

Fluorescence spectra for Rose Bengal (λex = 473 nm, 0.32 Wcm−2) detected on glass or 3 nm silver nanoparticles (AgNPs). The resulting coupled fluorescence (CF) spectrum is also shown. A) Raw fluorescence intensity of each spectrum and resulting enhancement factor (EF) reported at each emission wavelength. B) Left - normalized fluorescence spectra displaying red-shifted maxima and the emergence of a blue-shifted peak, right – corresponding full width half maxima for the glass versus coupled fluorescence spectra.
In order to isolate those fluorescence intensities that were the result of fluorophore-nanoparticle coupling, the intensities from the glass spectrum were subtracted from those of the AgNP spectrum at each respective wavelength. These subtracted data comprise the “coupled fluorescence” (CF) spectrum. This is a necessary step in the examination of a MEF response for a fluorophore solution, as MEF is a near-field phenomenon that is known to be through-space and distance dependent.12, 14 In fact, much less than a percentage of freely diffusing fluorophore in solution will actually enter into the “coupling region,” approximately 50 nm from the AgNP surface.34 Assuming that 1% of the solution volume couples to the silver substrate for enhanced fluorescence, it is logical to assume that a significant portion of the MEF spectrum detected will be composed of classical un-coupled, free-space fluorophore emission. By subsequently subtracting the spectrum detected on glass from that detected on silver, it is possible to isolate specifically the enhanced, or coupled fluorescence, alone. The result of this calculation for Rose Bengal on AgNPs is shown also in Figure 3. Examining this spectrum, the red-shift observed for the coupled system is even more evident, demonstrating an overall red-shift of approximately 13 nm. The blue-shifted peak is also apparent, resolving distinctly at 510 nm. The full width half maxima (FWHM) values for both the glass and CF spectra were determined and are reported in Figure 3b. Interestingly, the FWHM increased by approximately 7 nm for the CF spectrum relative to glass. Previous reports of MEF have observed both increased and decreased FWHM.24, 34, 35 In the latter case, selective coupling of particular fluorescence transitions is cited as a possible rationale for the narrowing distribution.24 This is also echoed in Le Ru’s theoretical predictions in the condition where the metal LSPR peak has good spectral overlap with fluorophore emission; for conditions where there is not strong overlap between these peaks, widening FWHM values were predicted.8 For Rose Bengal on AgNPs, both broadening and a red-shifted maximum are observed in the coupled spectrum, indicating that this coupling of varying energy transitions between fluorophore and nanoparticle is likely occurring.
Previous reports of MEF have demonstrated an increase in enhancement in tandem with increased laser powers, known as the MEF excitation volume effect (MEF EVE).10, 11 Accordingly, excitation of Rose Bengal on AgNPs was also conducted using a 0.16-Wcm−2 laser irradiance, shown in supplemental Figure S2. Although the peak at 510 nm is present in the CF spectrum at this power, it is not of significantly high intensity and in fact the enhancement factors at these wavelengths are largely contributed to by noise. Conversely, the red-shift is still readily observed; this could indicate that blue-shifted wavelengths are less favorably enhanced as compared to the red-shifted emission.
To further investigate the potential transitions observed for the coupled fluorescence spectrum, multi-Gaussian deconvolution analysis was completed for the 0.32-Wcm−2 data. The resulting fits and their respective single Gaussian component peaks are shown in Figure 4 for both glass (Fig. 4a) and AgNP (Fig. 4b), with additional fit information reported in supplemental Figure S3. Within the glass control sample spectrum, two single Gaussian peak components are resolved; the first has a wavelength maximum at 565 nm, corresponding to λmax of the glass slide spectrum (Fig. 4a). This peak contributes 40.6% of the total integrated area of the fit, with the secondary peak comprising the remaining 59.4%. Therefore, on glass slides there is already observable red-shifted emission. This stands in stark contrast, however, to the AgNP coupled fluorescence spectrum; for these data, the overall percent area contribution of red-shifted peak components increases almost 2-fold. In fact, the red-shifted peaks comprise nearly 100% of the overall integrated intensity of the spectrum, with only 1.5% of the area due to the 510 nm peak and zero contribution from a λmax component peak. For these spectra, it is possible that the silver nanoparticle substrates selectively couple and subsequently amplify certain fluorophore electronic transitions. Conversely, it could also be possible that in this MEF system the coupled fluorescence spectrum is simply red-shifted by ~15 nm from its glass-detected counterpart. Nonetheless, the spectral properties of the coupled fluorescence are in fact distinct from the characteristic major transitions of the classical, free-space fluorophore.
Figure 4.

Multi-Gaussian deconvolution analysis of the fluorescence spectra for Rose Bengal (λex = 473 nm) detected on A) glass and B) the resulting coupled fluorescence (CF) spectrum from detection on 3 nm silver nanoparticles (AgNPs). Cumulative fits are indicated in black; component Gaussian distributions are indicated by colored spectra. Peak wavelengths for each component are labeled. For additional fit information, see supplemental Figure S3. Insets display the percent area contribution of each Gaussian distribution to the total integrated area of the corresponding fit.
3.2. Spectral distortion in the spectra of Rose Bengal on silver island films.
Metal-enhanced fluorescence from Rose Bengal was also detected from a second silver substrate called silver island films (SiFs) of varying absorption values. As in the case of AgNPs, fluorescence was detected for Rose Bengal both on glass substrates and on SiFs as shown in Figure 5. The coupled fluorescence spectrum for each was also determined and reported alongside wavelength-dependent enhancement factors. For all absorption values below 1.0 a.u. a spectral red shift is observed, similar to what was detected on AgNPs. Strong enhancement is also observed on the blue edge for these lower absorption values; in fact, the enhancement at these blue-shifted wavelengths is stronger than the enhancement reported for the red-shifted region. This could indicate strong coupling between the high-energy transition dipole at 510 nm and therefore ultra-fast dynamics for MEF from SiFs, similar to that observed for AgNPs. To more clearly observe the differences in spectral distortion for Rose Bengal on SiFs, the coupled fluorescence spectra were plotted together as shown in Figure 6. The raw intensity values for the coupled fluorescence spectrum are plotted in Figure 6a. These spectra show that the blue-shifted emission peak is strongest for film absorption values of 0.57 and 0.61; however, longer wavelengths are the most significantly enhanced at 0.61 a.u. absorption. Comparing the normalized spectra, the most dramatic shift in λmax is reported for the 0.57 film absorption relative to glass than for any other film used (Fig. 6b).
Figure 5.

Fluorescence spectra for Rose Bengal (λex = 473 nm) detected on glass or silver island films (SiFs) at absorption values (“A”) of A/E) 1.0, B/F) 0.67, C/G) 0.61, and D/H) 0.57 arbitrary units. The resulting coupled fluorescence (CF) spectra are also shown. A-D) Raw fluorescence intensity of each spectrum and resulting enhancement factor (EF) reported at each emission wavelength. E-F) Normalized fluorescence spectra.
Figure 6.
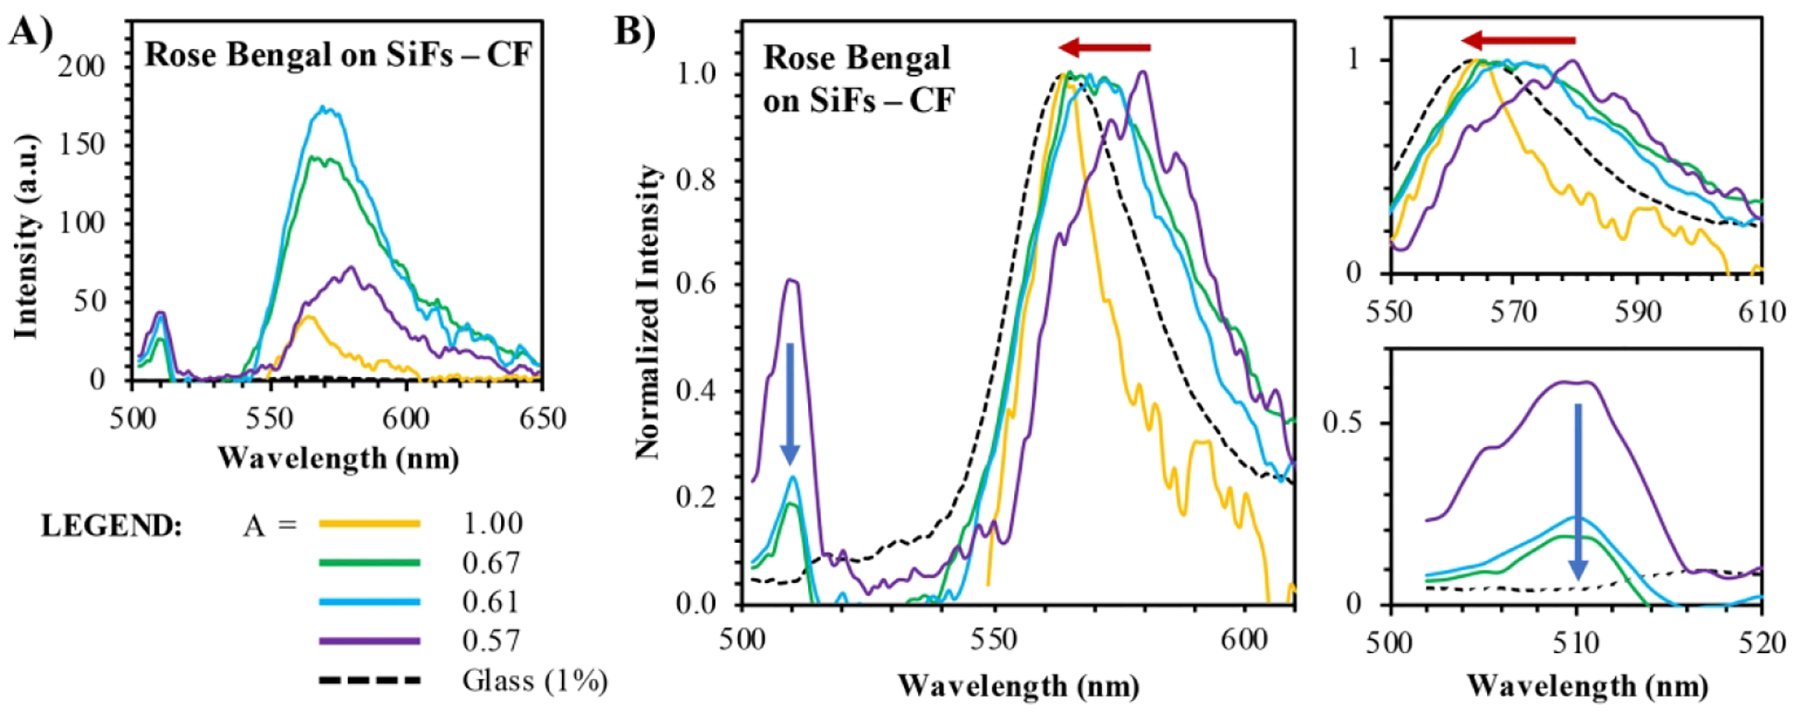
Coupled fluorescence (CF) spectra for Rose Bengal (λex = 473 nm) detected on glass or silver island films (SiFs) at absorption values (“A”) of 0.57 – 1.0 arbitrary units. A) Coupled fluorescence spectra. B) Normalized spectra from (A); left – displays the full emission wavelength range analyzed, while right, top – displays the red region (red arrow) and right, bottom – displays the blue region (blue arrow).
In fact, as absorption increases, λmax of the coupled fluorescence spectrum gradually blue shifts until complete agreement between the coupled spectrum and glass spectrum is achieved for detection on a 1.0 a.u. SiF. It is interesting to note also that the 1.0 a.u. film yields the lowest intensity coupled fluorescence despite spectral agreement with the free-space fluorescence detected on glass. Intensity of the CF spectrum, and subsequently detectable enhancement, is conversely highest for the 0.61 a.u. SiF. This film also displays a non-negligible red-shift in λmax. In many reports of MEF, agreement in λmax values is observed and reported for fluorophore-nanoparticle systems optimized for enhancement;14, 19, 36 however, it is clear from these data that this cannot be assumed to be the case indiscriminately. In fact, the properties of the metal substrate play a significant role in establishing not just the enhancement factor, but also observed spectral distortion in the coupled fluorescence (and metal-enhanced fluorescence) spectrum as discussed later. To further characterize the degree of spectral distortion within the samples tested, full width half maxima (FWHM) values were calculated and are reported in Figure 7. As anticipated, the glass spectra collected and serving as a control sample for each trial all exhibited very similar FWHM values at approximately 33 nm. The CF spectra exhibit broader FWHM values for 0.57 – 0.67 a.u. SiFs. In addition, the FWHM also increase proportionally to the overall integrated intensity of the coupled fluorescence spectra in this absorption range. This suggests an increase in the overall density of states for the coupled (or enhanced) spectra relative to glass; however, remarkably there is also a distinct substrate dependence on the density of states for the coupled transitions as well, as FWHM is seen to steadily increase from 0.54 to 0.67 a.u. films before dropping sharply at an absorption of 1.0 arbitrary units.
Figure 7.

Full width half maxima (FWHM) of fluorescence spectra for Rose Bengal (λex = 473 nm) detected on glass versus the corresponding coupled fluorescence (CF). FWHM are reported for signals within the 550 – 600 nm emission range.
To further elucidate the potential transitions from Rose Bengal enhanced on SiFs, the coupled fluorescence spectra subsequently underwent deconvolution analysis using a Multi-Gaussian model fit. The results of this analysis are shown in Figure 8, with additional fit information available in the supplemental material Figure S4. Here, the supposed increased density of states for coupled fluorescence becomes even more apparent for SiFs with 0.57 to 0.67 a.u. absorption values. While the deconvolution for glass contains three single Gaussian peak components (supplemental Fig. S5), the coupled spectra—with the exception of 1.0 a.u. films (Fig. 8a) which will be discussed later—by comparison exhibit as few as three but as many as six peak components after deconvolution analysis (Fig. 8b–d). All of these spectra additionally exhibit at least one blue-shifted peak component. Despite the fact that the coupled fluorescence spectrum from 0.57 a.u. SiFs also contains three peaks, comparable to glass, the spectral distribution is significantly different. For the SiF spectrum, a single blue-shifted peak is identified with only two additional peaks at longer wavelengths. The blue-shifted peaks are also visible for the 0.61 and 0.67 a.u. SiF spectra, where reported enhancement is strong. In fact, blue-edge distortion is also identified for Rose Bengal detected 0.61 a.u. films, which is also the condition that results in the highest intensity of coupled fluorescence and therefore enhancement as mentioned previously. Under these conditions, it could be considered that fluorophore-nanoparticle properties and subsequent enhancement are “optimized” for this MEF system. With efficient coupling and rapid decay rates, fluorophores may radiate from a higher energy level (510 nm), resulting in the observed blue shift for both AgNPs and SiFs, or from lower non-zero vibronic levels in the S1 excited state, resulting in blue-edge distortion, as observed for Rose Bengal on 0.61 a.u. SiFs. These data provide some of the first experimental evidence for fast and ultra-fast dynamic coupling in metal-enhanced fluorescence. Interestingly, both a hypsochromic peak and significant red-edge distortion are absent using the 1.0 a.u. SiF substrate, resulting in a narrow FWHM. In addition, the coupled fluorescence intensity for this system is low. As such, it is likely that the weaker transitions enhanced by coupling to silver are in fact re-absorbed and are therefore undetectable in the coupled fluorescence spectrum for particularly high absorption films (Fig. 8a).
Figure 8.

Multi-Gaussian deconvolution analysis of the coupled fluorescence (CF) spectra for Rose Bengal (λex = 473 nm) detected on glass versus silver island films (SiFs) with absorption values (“A”) of A) 1.0, B) 0.67, C) 0.61 and D) 0.57 arbitrary units. Cumulative fits are indicated in black; component Gaussian distributions are indicated by colored spectra. Peak wavelengths for each component are labeled. For additional fit information, see supplemental Figure S4.
The deconvolution analysis also exhibits variation in red-edge density of states. In the glass spectrum, peaks are observed at λmax (561 nm), 574 nm, and 586 nm. These peaks are likely representative of transitions from the S1 excited state to a higher-energy ground state vibronic levels. These transitions are also observed in the coupled fluorescence spectra; however, the degree to which each transition is enhanced varies significantly between substrates. In the case of 1.0 a.u. SiFs, only the two most probable transitions are observed. On the lower limit of absorption, the 0.57 a.u. spectrum exhibits no enhancement of the λmax peak (Fig. 8d). An identical change was observed for the Rose Bengal on AgNPs in section 3.1, where the absorption of 3 nm AgNP films was less than 0.2 arbitrary units; similar to that condition, the possibility of enhanced select transitions or a cumulative red shift must be considered. To more closely examine the relative transition enhancement efficiency, percent area contributions were calculated for each component peak in the deconvolution analysis for Rose Bengal detected on each SiF platform, and were then summed to defined wavelength ranges including λmax as well as the distorted “blue edge” (less than λmax) and “red edge” (greater than λmax). As shown by Figure 9, as absorption increases the overall contribution (or percent of area comprised of a certain peak component) of the λmax component increases as well; in fact, blue-edge and red-edge distortion becomes less prominent in the coupled fluorescence spectra at these higher absorption values.
Figure 9.

Percent area contribution of each Gaussian distribution comprising the spectral fits of the coupled fluorescence (CF) spectra for Rose Bengal (λex = 473 nm) detected on glass versus silver island films (SiFs) with varied absorption values. A) Summarized contributions from Fig. 8. B) Normalized contributions of each emission wavelength region. Percent area contributions are reported with all peaks summed for three emission regions, where “λmax” is the peak maximum of the fluorophore on glass, “blue edge” is comprised of those peaks having demonstrated a hypsochromic shift relative to λmax, and “red edge” consists of those displaying a bathochromic shift relative to λmax.
3.3. Spectral distortion in the spectra of Fluorescein on silver island films.
Rose Bengal is characterized by low quantum yield, a relatively short fluorescence lifetime (psec scale), low absorption of the excitation wavelength, and a relatively poor spectral overlap with the LSPR band of SiFs. In contrast, fluorescein disodium salt displays a relatively higher quantum yield, a nanosecond lifetime, high absorption at the excitation wavelength, and good spectral overlap with the SiF LSPR band. Fluorescein was therefore investigated in a similar manner for comparison. The resulting detected fluorescence spectra for glass and SiFs are shown in Figure 10a–d, plotted alongside the calculated enhancement factors (section 2.4) and coupled fluorescence spectra. When comparing the normalized spectra (Fig. 10e–h), the raw spectra from SiFs do not appear to demonstrate much spectral distortion; however, upon examination of the coupled fluorescence spectra, small distortions become evident. These coupled fluorescence spectra are summarized for Fluorescein in Figure 11. Unlike Rose Bengal, there is no distinct trend between absorption and enhancement (Fig. 11a). There are, however, clear differences visible in the spectral profile of the coupled fluorescence on each SiF; subsequently, the normalized spectra were plotted (Fig. 11b). Examining these spectra, spectral distortion is observed both on the blue- and red-edges of the normalized free-space fluorescence peak detected on glass. In fact, a small red shift in λmax is observed for several of the coupled fluorescence spectra. Of note is the absence of a blue shifted peak comparable to that detected for Rose Bengal at 510 nm. This is to be expected given that the absorption maximum for Fluorescein is present at approximately 500 nm, while the blue-shifted absorption shoulder occurs at approximately 465 – 470 nm. The latter is inaccessible as the excitation wavelength used is lower energy; the former, if actually present, could be obscured within the spectra of this high-quantum yield fluorophore. This becomes clear upon examination of the blue-edge distortion observable in the coupled fluorescence spectra, which occurs at 500 nm (Fig. 11b). When the coupled fluorescence spectra for Fluorescein detected on 0.54 a.u. SiFs is fit in this region (500 – 535 nm) two single Gaussian peak components are resolved; one occurs at a maximum of 519 nm, which is approximately the λmax of free-space Fluorescein emission on glass (Fig. 11b). The increase in relative standard deviation (%) for coupled fluorescence also draws attention to another feature of these data: a negative correlation between FWHM and absorption. The other peak occurs at 503 nm. This corresponds to the absorption maximum of Fluorescein. The expanded population of both red- and blue-edge emission is also observable in the reported FWHM for coupled versus free-space fluorescence, as shown in Figure 12. While the FWHM of glass spectra are all approximately 41.6 ± 0.8 (2%) nm, the average FWHM of the coupled spectra is 51 ± 2 (4%) nm. As absorption increases, the peak in fact narrows, thereby implying a narrowing density of states and selective coupling of certain transitions or re-absorption of weaker emission, to be discussed in later sections.
Figure 10.

Fluorescence spectra for Fluorescein (λex = 473 nm) detected on glass or silver island films (SiFs) at absorption values (“A”) of A/E) 0.68, B/F) 0.67, C/G) 0.54, and D/H) 0.48 arbitrary units. The resulting coupled fluorescence (CF) spectrum is also shown. A-D) Raw fluorescence intensity of each spectrum and resulting enhancement factor (EF) reported at each emission wavelength. E-F) Normalized fluorescence spectra.
Figure 11.

Coupled fluorescence (CF) spectra for Fluorescein (λex = 473 nm) detected on glass or silver island films (SiFs) at absorption values of 0.48 – 0.68 arbitrary units. A) Coupled fluorescence spectra. B) Normalized spectra from (A); left – displays the full emission wavelength range analyzed, while right, top – provides a magnified portion of the spectra. Right, bottom – displays the multi-Gaussian fitting parameters for the 0.54 a.u. CF spectra with inset – corresponding residuals.
Figure 12.

Full width half maxima (FWHM) of fluorescence spectra from Fluorescein (λex = 473 nm) detected on glass versus the corresponding coupled fluorescence (CF).
To better understand the individual transition components that may contribute to the spectral profile of Fluorescein coupled fluorescence, deconvolution analysis was also completed for these data using a Multi-Gaussian distribution, displayed in Figure 13 (fit information is contained in supplemental Fig. S6). Unlike Rose Bengal, each of these spectra contain the same overall number of single Gaussian peak components; in fact, the analyzed spectrum for glass also exhibits comparable peaks (supplemental Figure S7). There are slight variations in the relative intensity and width of these peaks which account for the spectral distortions observed in Figure 11, although by-and-large the components could be considered roughly equivalent between spectra. To further demonstrate this change, the percent area contributions of both the red- and blue-edge peak components were calculated as displayed in Figure 14. It is clear from these data that for the case of MEF from Fluorescein on SiFs, spectral distortion may be observed; however, compared to Rose Bengal distortion these effects are relatively minor. Of particular note is the coupled fluorescence spectrum detected on 0.68 a.u. SiFs. At this absorption, the observed enhancement is highest—as evidenced by the intense coupled fluorescence signal displayed in Figure 11a. Interestingly this SiF also yields the only spectrum for which the blue-edge peak component increases relative to the more dominant, approximately 520 nm emission peak.
Figure 13.

Multi-Gaussian deconvolution analysis of the coupled fluorescence (CF) spectra for Fluorescein (λex = 473 nm) detected on glass versus silver island films (SiFs) with absorption values of A) 0.68, B) 0.67, C) 0.54 and D) 0.48 arbitrary units. Cumulative fits are indicated in black; component Gaussian distributions are indicated by colored spectra. Peak wavelengths for each component are labeled. For additional fit information, see supplemental Fig. S6.
Figure 14.

Percent area contribution of each Gaussian distribution comprising the spectral fits of the coupled fluorescence (CF) spectra for Fluorescein (λex = 473 nm) detected on glass versus silver island films (SiFs) with varied absorption values. A) Summarized contributions from Fig. 13. Percent area contributions are reported with all peaks summed for two emission regions relative to the peak maximum of the fluorophore on glass (λmax); the “blue edge” is comprised of those peaks having demonstrated a hypsochromic shift relative to λmax and “red edge” consists of those displaying a bathochromic shift relative to λmax. B) Percent area contribution from each peak component. The glass spectrum analysis is included for comparison.
3.4. Spectral distortion is revealed by data extraction and analysis in other reports of MEF.
In addition to the experimental data collected by us in this study, a selection of MEF data found in the literature was analyzed by the image extraction method described in section 2.4. This was conducted in order to see if our data analysis approaches and identification of modified transitions applies generically to the entire MEF literature landscape. In a previous publication by Zhang et al. in 2006, Rose Bengal was studied on a SiF platform.27 The results of the data extraction performed for this study are presented in Figure 15a–b. Unlike the mere 2-fold enhancement reported for Rose Bengal on SiFs in this study, Zhang et al. reported a remarkable near 15-fold enhancement for Rose Bengal dried directly on SiFs versus glass. Upon first look at the spectra in Figure 8 of their study there is no obvious spectral distortion.27 When enhancement factors are calculated and subsequently reported at each emission wavelength, however, a clear wavelength-dependence of enhancement factor is shown (Fig. 15a). When the data is normalized, distortion becomes quite apparent (Fig. 15b). It is significant to note here that the coupled fluorescence spectrum does not vary in shape as compared to the raw spectrum detected on SiFs. This is likely due to the detection format used by Zhang et al., where the fluorophore was dried directly on to SiFs. For this system, it can be assumed that all or nearly all fluorophores are within the enhancement region of the metal nanoparticles. As such, the overall contribution of free-space fluorescence to the SiFs spectrum is minor. This could also indicate that fluorophores are contained within a reasonable distance for effective 3D coupling and a strong enhanced emission mechanism, although the group additionally reported enhanced absorption for their fluorophore-metal system.27 In terms of emission, a red-shift in λmax is observed, just as was reported for both Rose Bengal solutions in this study. The data deconvolution also reveals many of the same transition peaks that were identified in sections 3.1 and 3.2 (Fig. 15c–d, fit information in supplemental material Fig. S8).When the percent area contribution of each component peak is calculated, it is clear that the red-edge wavelengths are preferentially coupled and enhanced by the MEF system in this study. No blue-shifted peak was identified, though it must be noted that the excitation wavelength used by Zhang et al. was 532 rather than 473 nm—well beyond the 510 nm signal observed in Figure 8 of this article. Spectral distortion from two additional literature reports28 with different fluorophores were also analyzed in a similar manner. In one 2018 study by Losytskyy et al. a benzothiazole trimethine cyanine dye D-51 was detected on SiFs (O.D. ~0.85 a.u.).26, 28 Significant wavelength dependence of enhancement factor was observed for these data after our data extraction and analysis was completed, as shown in supplemental Figure S9. In fact, a small shift in λmax was observed in the coupled fluorescence spectrum following the extraction and analysis procedure in addition to clear red-edge distortion. In a 2019 study, Synak et al. studied MEF of Valrubicin coupled to silicon dioxide coated silver nanoparticles.26 To achieve this structure, the group spin-coated Valrubicin in PVA solution over the nanoparticles and allowed the system to air dry. In this case, our data extraction and analysis revealed significant blue-edge distortion (Fig. S10); following deconvolution analysis, blue-edge component peaks contributed 31.5% to the total area. In all of the reports by these others, spectral distortion was not heavily considered or discussed.
Figure 15.

Fluorescence spectra for Rose Bengal (λex = 532 nm) detected on glass or silver island films (SiFs) and the resulting coupled fluorescence (CF) spectrum. A) Extracted raw intensity values for each spectrum and corresponding enhancement factors (EF) at each emission wavelength. B) Normalized spectra from (A). Note that the Glass* spectrum had baseline noise subtracted for clarity of spectral shape. C) Multi-Gaussian deconvolution analysis of CF spectrum (black spectrum) with corresponding Gaussian distributions (colored spectra). Peak wavelengths for each component are labeled. For additional fit information, see Fig. S8. D) Percent area contribution of each Gaussian distribution to the total integrated area of the resulting fit from (C). Data was analyzed from reference [27].
4.0. DISCUSSION
4.1. The role of plasmonic properties in spectral distortion.
As previously mentioned, a theoretical model by Le Ru et al. for spectral distortion in MEF supposes that the density of states for a fluorophore emission spectrum may be modified based on the enhancement of certain transitions from metal-fluorophore coupling.8 By modifying the decay rates of less favorable transitions, these emission wavelengths/energy levels become more probable and therefore more abundant in detection. Le Ru suggests that these spectral modifications are highly dependent upon the LSPR peak of the metal nanoparticle; by definition, increases in emission wavelength would then be proportional to the absorption/oscillator strength of the metal nanoparticle at that wavelength. To test this hypothesis, Rose Bengal and Fluorescein were studied on silvered substrates, where absorption measurements were taken for both the AgNP and SiF substrates (Fig. 16). To recall from section 3.1, Rose Bengal exhibited strongly red-shifted emission and the emergence of a 510 nm blue-shifted peak when detected on the AgNP substrate. By Le Ru’s model, radiative decay modification is a likely explanation for the detected 510 nm peak. Although not originally detected in the spectrum for Rose Bengal on glass, the 510 nm peak corresponds to a strong absorption from the AgNP substrate. Thus, effective coupling could occur between this fluorophore transition dipole and the plasmonic nanoparticles. This overlap would be particularly important for blue-shifted emission, as this requires radiative decay from a high-energy excited state to observe. Rather than emitting light, this excited state in classical conditions will instead undergo internal conversion to the lowest energy S1(0) excited state before emitting. By instantaneously coupling to metal nanoparticle plasmons in what Le Ru terms “ultra-fast dynamics,” this transition may become more favorable and thus detectable in the MEF spectrum of Rose Bengal. This could also be a source of blue-shifted distortion for Rose Bengal on SiFs as well.
Figure 16.

Synchronous scattering (λex = λem) intensity and absorption spectra for A) silver nanoparticle films (AgNPs) collected by the vapor deposition method and B) silver island films (SiFs) collected by the wet deposition method. The emission spectra for Rose Bengal (RB, red) and Fluorescein (Fl, green) detected on glass are indicated by the shaded regions.
Radiative decay rate modification for red-edge transitions, however, seems a less likely—or at least less encompassing—of an explanation for the spectral distortion observed in Rose Bengal detected on AgNPs. As shown in Figure 16a, these red-edge emissions overlap with only the tail edge of the silver LSPR peak. Thus, it is possible that the metal nanoparticles could still amplify the decay rates of these red-edge transitions in a process described by Le Ru as the “slow dynamics” MEF regime. It is also noteworthy that localized resonances are well-known to couple, reinforce, or diphase each other. With regard to MEF, the broader plasmonic absorption spectra due to coupled metallic plasmons provides opportunity for broader wavelength dependence of MEF. As the particles diphase each other and move towards red wavelengths, more opportunity is provided for fluorophores to couple at these energies. As such, spectral broadening is observed for Rose Bengal on SiFs as the substrate absorption values increase from 0.57 to 0.67 a.u. (Fig. 7). We do not see in the data an increased contribution from red-edge component peaks as absorption increases, which would be expected under these considerations (Fig. 9). This is likely due to the increased prevalence of the λmax component peak in the cumulative spectra. Revisiting the radiative decay model, transitions such as λmax should be preferentially amplified as the LSPR intensity is higher at these wavelengths, as is observed with higher absorption films; the same is true for SiFs (Fig. 16b). This was not observed for either the AgNP or 0.54 a.u. SiFs, as there was no detectable peak component corresponding to λmax. For lower absorption silver substrates, emission overlap with the LSPR band alone is therefore insufficient to predict and explain observations in spectral distortion for Rose Bengal.
For Fluorescein, Le Ru’s model alone proves more suitable a rationale for the spectral changes. As reported in section 3.3, all coupled fluorescence spectra of Fluorescein on SiFs resemble the spectrum from free-space fluorescence detected on glass. There are instead only relatively minor red- and blue-edge distortions present in the spectra. This is to be expected based on Le Ru’s model, as the absorption of SiFs varies less over the emission wavelengths detected and all peak components identified in the free-space fluorescence are included in the coupled spectra. In this case, all wavelengths can couple to the metal nanoparticles and therefore all are enhanced for both ultra-fast and slow transitions. Le Ru’s model does predict dominant blue-edge distortion for this condition, so an alternate description is needed to address the observation of both simultaneous blue- and red-edge distortion for Fluorescein detected on SiFs. We must therefore consider the possibility that a whole array of either enhanced or hindered transitions are occurring simultaneously.
Previous reports have linked synchronous scattering (λex = λem) spectral properties of metal nanoparticle films to the reported enhancement factors at different emission wavelengths.16, 17 The synchronous scattering spectrum, which is a convolution of both the absorption and scattering components of a film, reveals that MEF efficiency correlates to the scattering portion of a nanoparticle’s extinction spectrum rather than solely to its absorbing component, although it is clear that many reports confuse these two in the literature.16 Accordingly, the synchronous scattering spectra for AgNPs and SiFs of varying absorption values were analyzed and are reported in Figure 16. For AgNPs, the scattering intensity is approximately constant over the emission range of Rose Bengal. While this could help to address the favored enhancement of red-edge emission and observation of slow dynamics MEF, it still does not account for the fact that λmax is absent from the AgNP coupled fluorescence spectrum. In fact, were the synchronous scattering spectrum a reliable predictor of distortion in this case, λmax would also be amplified. For Rose Bengal on SiFs, this should be especially true as scattering is actually stronger at λmax as compared to the red-edge wavelengths (Fig. 16b); however, enhanced λmax is not observed for the lowest absorption film (Fig. 8d). As SiF absorption increased, λmax was amplified with increased percent area contribution to the overall coupled spectra. It is possible that increased scattering is not solely responsible for this observation as the synchronous scattering spectra sees only minor increases in intensity proportional to absorption differences over the emission range of Rose Bengal (Fig. 16b). Additionally, the changes in synchronous scattering intensity for SiFs do not follow a comparable trend to the reported wavelength dependence of Rose Bengal enhancement factors (Fig. 5, 16b). The same is true for Fluorescein, where minimal wavelength dependence was reported for enhancement factors, while large changes in synchronous scattering intensity occur for the emission range in question (Fig. 10, 16b.) While both Le Ru’s model and scattering properties of the metal nanoparticle films can clearly contribute to a model for spectral distortion in MEF, these trends alone do not account for the changes observed here.
4.2. The role of fluorophore photophysical properties in spectral distortion.
As mentioned previously, the fluorophores investigated in this study vary in their photophysical properties. In particular, Rose Bengal exhibits a low quantum yield with a fast radiative lifetime (psec timescale), whereas the quantum yield of Fluorescein is much higher and its lifetime longer (nsec timescale). This is significant because the spectral distortion theory described by Le Ru et al. is predicated on the assumption of a substantial radiative decay rate modification explanation. While this has been detected for many fluorophores37, 38 including Rose Bengal5 and Fluorescein,39 there are also cases where no change in lifetimes is reported for MEF systems. Please note when we refer to a reduced lifetime and increased radiative decay rate, we are in fact referring to the fluorophore-metal system, a system that is coupled both in the ground and excited state. In MEF, it is the nanoparticle itself that radiates the coupled quanta, rather than a modification of the actual properties of the fluorophore. It is for this reason we nearly always see MEF lifetimes of only a few picoseconds, indicative of the plasmon decay itself. In this case, metal plasmons provide a competitive alternative radiative decay pathway (Γm) to free-space emission alone and subsequently the fluorophore lifetime is significantly lowered in the MEF condition (τMEF) as shown in equation 10.
| (10) |
In this equation, Γ is the free-space radiative decay rate and knr are the non-radiative decay rate components.40 The lifetime of free-space fluorescence can be described by this same equation, where no decay occurs from MEF coupling (Γm = 0). For low quantum yield fluorophores such as Rose Bengal, the non-radiative decay rate is significant relative to radiative decay in free-space emission. Under MEF conditions, radiative decay from the coupled system is likely competitive to non-radiative decay; this will be particularly impactful in the detection of low-probability emission wavelengths such as those seen in the ultra-fast dynamics regime. It follows subsequently that a new emission peak at 510 nm emerged in the spectrum for Rose Bengal coupled fluorescence (Fig. 8b–d, 9). This phenomenon indicates strong coupling between Rose Bengal emission and the plasmonic system, which may not be immediately intuitive when studying a relatively weak fluorophore. When considering that such classically considered “weak” fluorophores are prime candidates for photophysical gains such as increased quantum yields in MEF systems,19, 41, 42 it becomes obvious that coupling is favorable for these fluorophores. In contrast to “weak” Rose Bengal, Fluorescein presented blue-edge peaks in the coupled fluorescence spectra that were already present in the free-space emission profile (Fig. 13, 14). Loss of the 510 nm peak for Rose Bengal was observed for detection on 1.0 a.u. SiFs (Fig. 8a); this is wholly due to coupled quanta being dissipated across the closely spaced nanoparticle film and will be addressed later in section 4.3.
In the case of long lifetime, high quantum yield fluorophores, it is also reasonable to expect less dramatic changes in the densities of states—which is to say less dramatic observed spectral distortion—if one considers the radiative decay rate modification. As quantum yield approaches unity, knr becomes negligible; for longer lifetimes, Γ must be relatively slow. Given that plasmons themselves decay on the picosecond timescale, the coupled radiative decay rate is likely much more rapid than free-space emission alone (Γm >> Γ). This relationship transfers also to the radiative decay rate of individual transitions (γn), which are roughly equivalent in magnitude to the overall free-space radiative decay rate (Γm >> Γ ≈ γ1 ≈ γ2 … ≈ γn). As such, each individual transition will see roughly the same magnitude of change with decay rate modification from plasmonic coupling; therefore, there can be only minor anticipated variation in the density of states beyond what would normally be expected by the Boltzmann distribution. In fact, this is observed for spectral distortion in the coupled fluorescence spectra for Fluorescein reported herein (Fig. 13, 14).
4.3. The role of the two enhancement mechanisms in spectral profile modification.
As introduced earlier, MEF is well-known to occur by both enhanced absorption and enhanced emission mechanisms. For a fluorophore solution, it is likely that both mechanisms contribute to the overall detected enhancement effect in the coupled spectrum; however, each will have different implications for observed spectral distortion. By the absorption mechanism, any ground state fluorophore within the metal nanoparticle near-field may be excited by an intense electric field generated by plasmon excitation from incident light; this additional volume of fluorophores would not experience excitation events in the case of free-space fluorescence, so we can consider these fluorophores to be “plasmon-excited.” The magnitude of the electric field, and therefore the distance at which fluorophores may be “plasmon-excited,” may be tuned by adjusting the power or irradiance of incident light—the MEF excitation volume effect (EVE),10, 11—and/or by adjusting the size, shape, and spacing of the metal nanoparticle films.43–45 Once in the excited state, the fluorophore could decay on its own as free-space fluorescence or via a coupled, enhanced emission pathway depending on its distance and its dipole orientation from the nanoparticle substrate. The degree to which enhanced absorption contributes to the overall coupled fluorescence emission, of course, will vary depending on plasmonic and fluorophore photophysical properties. Rose Bengal, for example, has an extinction coefficient (ε) of 6,200 ± 400 M−1cm−1 at 473 nm and therefore is a relatively inefficient absorber of this wavelength light (Fig. S11, Table S1). Based on the MEF EVE effect alone, one would predict an increase in enhancement factor for Rose Bengal emission detected on AgNPs using a 0.32-versus a 0.16-Wcm−2 irradiance excitation source since the near-field excitation volume increases. Interestingly, maximum enhancement factors in the range of 3–4 are reported for both powers (Fig. 3, S2). In this case, the MEF EVE effect is not observed, or has little effect. Similarly, there is no distinct increase in enhancement associated with an increase in SiF absorption for Rose Bengal (Fig. 5). There is, however, a notable decrease in not only enhancement factor, but also in full width half maximum (FWHM) observed for Rose Bengal detected on 1.0 a.u. SiFs. Both of these observations suggest a narrowing density of states for the coupled spectra as compared to the glass spectrum, which is not identified for the other spectra reported herein. That the weaker blue-shifted and red-edge distortion transitions are not observed for this film may imply instead that a high absorption nanoparticle substrate can have a narrowing, rather than broadening, effect on spectral distortion. In the context of other observations reported here, it is therefore likely that weaker transitions are instead dispersed non-radiatively when the nanoparticle film is closely spaced, rather than specific and selective enhancement occurring for particular transitions from Rose Bengal.
In contrast, Fluorescein more strongly absorbs 473 nm light (ε = 32,000 ± 3,000 M−1cm−1, Fig. S11/Table S1) and is therefore a prime candidate for the enhanced absorption mechanism of MEF for silver nanoparticle substrates. Although the anticipated increase in enhancement factor is still not particularly observed for Fluorescein detected on increasing absorption SiFs (Fig. 10), the reported intensities of the coupled spectra do in fact reach a maximum for 0.68 a.u. SiFs (Fig. 11), which is the highest absorption film tested with Fluorescein in this study. FWHM also gradually decreases with increased absorption for the Fluorescein on SiFs; this could indicate preference for the enhanced absorption mechanism for higher absorption films, where the spectral profile of “plasmon-excited” but not necessarily plasmon-coupled fluorophores is dominant in the cumulative coupled spectrum.
To this point, each discussed phenomenon related to spectral distortion has done little to address the source of strong red-edge distortion, where there is actually an observed change in λmax for the reported coupled spectra as is true for Rose Bengal on AgNPs or 0.54 a.u. SiFs. For both of these measurements, it seems plausible that the component peaks of Rose Bengal detected on glass (565 and 575 nm) simply red-shifted by ~15 nm to values of 565 to 576 nm and 575 to 590 (AgNPs) or to 596 nm (SiFs). It is well-known that factors such as solvent relaxation and increasing solvent polarities may influence the position of λmax, as observed here, in classical fluorescence by stabilizing polar dipole moments of excited fluorophores;46 therefore, it is reasonable to predict similar effects in the case of metal-enhanced fluorescence. For the enhanced absorption mechanism alone, one would not expect to observe a change in the position of λmax, as emission would occur as observed in free-space fluorescence; however, MEF is also known to progress by an enhanced emission mechanism, whereby an excited fluorophore may couple to plasmonic nanoparticles to radiate as a unit. This coupling provides the basis for Le Ru’s model for spectral distortion, and is dependent upon the spectral overlap of fluorophore emission with the LSPR band for the metal nanoparticles as mentioned previously.8 In conditions where coupling is less favorable, for example with poor emission-LSPR spectral overlap, excited plasmonic dipoles may also have a secondary interaction with the dipole of an excited fluorophore. Rather than coupling, these dipoles may serve to stabilize or destabilize fluorophore excited states if both nanoparticle and fluorophore are excited and within a reasonable distance, akin to solvent relaxation effects. This could account for detected red shifts in MEF because a strong, appropriately aligned plasmon dipole would be significantly polar in nature. This effect is most likely to be observable in conditions where the enhanced absorption mechanism is not particularly strong, and where low emission-LSPR overlap is observed. For this study, detection of Rose Bengal on AgNPs and 0.54 a.u. SiFs satisfies these parameters, and in fact these are the spectra for which the strongest red-edge distortion is reported (Fig. 3, 5).
In the case of Fluorescein, conversely, absorption is strong and there is considerable emission-LSPR spectral overlap. As such, reported red-edge distortion is relatively minor (Fig. 10, 11). It is also interesting to note that red-edge distortion can also be observed in reports of metal-enhanced chemiluminescence, where there is no enhanced absorption mechanism at play.47–49 Although it is reasonable to predict that a plasmon dipole may stabilize the excited state of an un-coupled fluorophore in close range thereby reducing its emission energy, more thorough experimental verification of this phenomenon is necessary. Additionally, ionization at the metal nanoparticle surface could contribute to higher local solvent polarity, causing a red-shift in MEF as compared to free-space fluorescence. Were this the case it could be predicted that higher absorption, and therefore mass density, substrates would induce more significant red-edge distortion. That this trend is not observed is intriguing and could be the focus of future studies.
4.0. CONCLUSION
Herein we have begun to address the complexity of the dual enhancement mechanism of MEF as it relates to observed spectral profile modification. While phenomena such as radiative decay rate modification and enhancement by nanoparticle scattering have been implicated, spectral distortion has not hitherto been investigated extensively in the literature. In many cases, such as those reported here, distortion may not be readily apparent if free-space fluorescence from uncoupled fluorophore is too dominant in the enhanced spectra. As such, this paper has investigated spectral distortion in the context of coupled fluorescence for both Rose Bengal and Fluorescein on nano-silver plasmonic substrates. Strong red-edge distortion is reported for Rose Bengal; blue-edge and blue-shifted distortion is also reported for the coupled fluorescence spectra of Rose Bengal on silvered substrates. Similar trends were also identified in data extracted from a previous publication by Zhang et al using Rose Bengal on SiFs, albeit under different coating and excitation conditions, further strengthening the significance of our approaches.27 For Fluorescein excited under the conditions described in this article, less distortion was observed, though changes in both the blue- and red-edge were noted for all silver island films used. From these observations, a number of different sources of spectral distortion are acknowledged and discussed, including the roles of both plasmonic and fluorophore properties. For metal nanoparticles, characteristics such as LSPR band position and absorption as well as synchronous scattering profile are significant contributors to spectral distortion in MEF, impacting the decay rate modification necessary to change the density of states reported for a fluorophore in MEF versus free-space conditions. Fluorophore lifetime and quantum yield are also identified as important considerations in decay rate modification. Additionally, we report correlation between observed spectral distortion and the two enhancement mechanisms of MEF. In cases where the enhanced absorption mechanism contributes strongly to the detected MEF signal, minor spectral changes are observed due to dominating free-space emission properties of “plasmon-excited” fluorophores. This can be especially true as the absorption of a metal nanoparticle substrate is increased; in addition to significantly expanding the “excitation volume” for enhanced absorption (known as MEF EVE), strongly absorbing films may also disperse weaker enhanced wavelengths, leading to a narrowing spectral profile relative to free-space emission. When enhanced emission properties are more dominant, distortion is more obvious in the coupled spectrum due to the significant contribution of decay rate modification and fluorophore-plasmon dipole interactions in this enhancement mechanism as compared to enhanced absorption alone. This study provides the first comprehensive discussion of experimentally observed spectral distortion in MEF to date, permitting a deeper understanding of the complex interplay of fluorophore and plasmonic properties in the mechanisms of metal-enhanced fluorescence.
Supplementary Material
APPENDIX A: Acronyms and Abbreviations
APPENDIX B: Sample Data Extraction from Image File
APPENDIX C: Percent Area Contribution Example Calculation
APPENDIX D: Supplemental Figures
Figure S1. Real-color photographs of silver nanoparticle substrates. A-C) Silver island films (SiFs) deposited on glass by the wet deposition method, with absorption values of A) 0.582, B) 0.82, and C) 1.0. D) Silver nanoparticles of 3 nm thickness deposited on glass by the vapor deposition method.
Figure S2. Fluorescence spectra for Rose Bengal (λex = 473 nm, 0.16-Wcm−2) detected on glass or 3 nm silver nanoparticles (AgNPs). The resulting coupled fluorescence (CF) spectrum is also shown. A) Raw fluorescence intensity of each spectrum and resulting enhancement factor (EF) reported at each emission wavelength. B) Normalized fluorescence spectra displaying red-shifted maxima (solid arrow).
Figure S3. Multi-Gaussian fitting parameters for Rose Bengal (λex = 473 nm) detected on glass or silver nanoparticles (AgNPs). Fits included are A) the raw spectrum from Rose Bengal on glass, B) the red region of the coupled fluorescence (CF) spectrum, and C) the blue region of the CF spectrum. For all panels, the left – displays the fit and the right – displays the corresponding residuals.
Figure S4. Fitting parameters for the multi-Gaussian fits of the coupled fluorescence (CF) spectra for Rose Bengal (RB, λex = 473 nm) detected on glass versus silver island films with absorption values of A/E) 0.57, B/F) 0.61, C/G) 0.67 and D) 1.0 arbitrary units. A-D) Fitting for the red-shifted region. E-G) Fitting for the blue-shifted region. For each panel, left – displays the fit and the right – displays corresponding residuals.
Figure S5. Multi-Gaussian fit of the raw spectrum from Rose Bengal (λex = 473 nm) detected on glass. A) Spectral fit (black spectrum) with corresponding Gaussian distributions (colored spectra). Peak wavelengths for each component are labeled. B) Fitting parameters for (A) showing left – the fit and right – the corresponding residuals.
Figure S6. Fitting parameters for the multi-Gaussian fits of the coupled fluorescence (CF) spectra for Fluorescein (λex = 473 nm) detected on glass versus silver island films with absorption values of A) 0.68, B) 0.67, C) 0.54 and D) 0.48 arbitrary units. For each panel, left – displays the fit and the right – displays corresponding residuals.
Figure S7. Multi-Gaussian deconvolution analysis of the raw spectrum from Fluorescein (λex = 473 nm) detected on glass. A) Spectral fit (black spectrum) with corresponding Gaussian distributions (colored spectra). Peak wavelengths for each component are labeled. B) Fitting parameters for (A) showing left – the fit and right – the corresponding residuals.
Figure S8. Multi-Gaussian fit of the coupled fluorescence (CF) spectrum from Rose Bengal (λex = 532 nm) detected on glass or silver island films (SiFs) reported in Figure 15 of the main article. Left – fit for CF spectrum and right – corresponding residuals. Data was analyzed from reference [S1].
Figure S9. Fluorescence spectra for trimethine cyanine dye (λex = 530 nm) detected on glass or silver island films (SiFs, A = ~0.85 a.u.) and the resulting coupled fluorescence (CF) spectrum. A) Extracted raw intensity values for each spectrum and corresponding enhancement factors (EF) at each emission wavelength. B) Normalized spectra from (A). Note that the Glass* spectrum had baseline noise subtracted for clarity of spectral shape. C) Multi-Gaussian deconvolution analysis of the CF spectrum (black spectrum) with corresponding Gaussian distributions (colored spectra). Peak wavelengths for each component are labeled. D) Percent area contribution of each Gaussian distribution to the total integrated area of the resulting fit from (C). E) Left – fit for CF spectrum and right – corresponding residuals. Data was analyzed from reference [S2].
Figure S10. Fluorescence spectra for Valrubicin (λex = 470 nm) detected on glass or silver core-shell nanostructure coated glass (Ag@SiO2) and the resulting coupled fluorescence (CF) spectrum. A) Extracted raw intensity values for each spectrum and corresponding enhancement factors (EF) at each emission wavelength. B) Normalized spectra from (A). C) Multi-Gaussian deconvolution analysis of the CF spectrum (black spectrum) with corresponding Gaussian distributions (colored spectra). Peak wavelengths for each component are labeled. D) Percent area contribution of each Gaussian distribution to the total integrated area of the resulting fit from (C). E) Left – fit for CF spectrum and right – corresponding residuals. Data was analyzed from reference [S3].
Figure S11. Normalized absorption spectra for fluorescein sodium salt and Rose Bengal dissolved in water. Each spectrum is a single representative spectrum of the three averaged spectra used to determine the extinction coefficients for each fluorophore.
Table S1. Extinction Coefficients (ε) of Rose Bengal and Fluorescein Sodium Salt Reported for Different Wavelengths.
ACKNOWLEGEMENT
This work was supported by the National Science Foundation Graduate Research Fellowship Program (2018262827) and the HHS/NIH/National Institute of General Medical Sciences (NIGMS) through the Chemistry/Biology Interface Program at the University of Maryland Baltimore County (5T32GM066706). The authors also acknowledge the Institute of Fluorescence (IoF) as well as the Department of Chemistry and Biochemistry at the University of Maryland Baltimore County (UMBC) as sources of internal funding.
ABBREVIATIONS:
- MEF
metal-enhanced fluorescence
- CF
coupled fluorescence
- EF
enhancement factor
- AgNPs
silver nanoparticle substrate
- SiFs
silver island films
Footnotes
Conflicts of Interest.
There are no conflicts of interest to declare.
For additional acronyms and abbreviations, see the supplemental material Appendix A.
REFERENCES
- 1.Jeong Y; Kook Y-M; Lee K; Koh W-G, Metal enhanced fluorescence (MEF) for biosensors: General approaches and a review of recent developments. Biosensors and Bioelectronics 2018, 111, 102–116. [DOI] [PubMed] [Google Scholar]
- 2.Sai L; Ziwei W; Yijun Z; Yunyun H; Rongrong Y; Weidong X; Yongqiang Z, Easy synthesis of silver nanoparticles-orange emissive carbon dots hybrids exhibiting enhanced fluorescence for white light emitting diodes. Journal of Alloys and Compounds 2017, 700, 75–82. [Google Scholar]
- 3.Strobbia P; Languirand E; Cullum BM, Recent advances in plasmonic nanostructures for sensing: a review. Optical Engineering 2015, 54 (10), 100902. [Google Scholar]
- 4.Cui Q; He F; Li L; Möhwald H, Controllable metal-enhanced fluorescence in organized films and colloidal system. Advances in Colloid and Interface Science 2014, 207, 164–177. [DOI] [PubMed] [Google Scholar]
- 5.Zhang Y; Aslan K; Previte MJR; Geddes CD, Metal-enhanced fluorescence from paper substrates: Modified spectral properties of dyes for potential high-throughput surface analysis and assays and as an anti-counterfeiting technology. Dyes and Pigments 2008, 77 (3), 545–549. [Google Scholar]
- 6.Asselin J; Legros P; Grégoire A; Boudreau D, Correlating Metal-Enhanced Fluorescence and Structural Properties in Ag@SiO Core-Shell Nanoparticles. Plasmonics 2016, 11 (5), 1369–1376. [Google Scholar]
- 7.Golberg K; Elbaz A; Zhang Y; Dragan A; Marks R; Geddes C, Mixed-metal substrates for applications in metal-enhanced fluorescence. Journal of Materials Chemistry 2011, 21 (17), 6179. [Google Scholar]
- 8.Geddes CD, Metal-enhanced fluorescence. Hoboken, N.J.: Wiley, c2010.: 2010. [Google Scholar]
- 9.Weisenberg M; Zhang Y; Geddes CD, Metal-enhanced chemiluminescence from chromium, copper, nickel, and zinc nanodeposits: Evidence for a second enhancement mechanism in metal-enhanced fluorescence. Applied Physics Letters 2010, 97 (13), 133103. [Google Scholar]
- 10.Geddes CD, Metal-enhanced fluorescence based excitation volumetric effect of plasmon-enhanced singlet oxygen and super oxide generation. PHYSICAL CHEMISTRY CHEMICAL PHYSICS 2013, 15 (38), 15740–15745. [DOI] [PubMed] [Google Scholar]
- 11.Dragan AI; Geddes CD, Excitation volumetric effects (EVE) in metal-enhanced fluorescence. Physical Chemistry Chemical Physics 2011, 13 (9), 3831–3838. [DOI] [PubMed] [Google Scholar]
- 12.Zhou Z; Huang H; Chen Y; Liu F; Huang CZ; Li N, A distance-dependent metal-enhanced fluorescence sensing platform based on molecular beacon design. Biosensors and Bioelectronics 2014, 52, 367–373. [DOI] [PubMed] [Google Scholar]
- 13.Abadeer NS; Brennan MR; Wilson WL; Murphy CJ, Distance and Plasmon Wavelength Dependent Fluorescence of Molecules Bound to Silica-Coated Gold Nanorods. ACS Nano 2014, 8 (8), 8392. [DOI] [PubMed] [Google Scholar]
- 14.Mishra H; Mali BL; Karolin J; Dragan AI; Geddes CD, Experimental and theoretical study of the distance dependence of metal-enhanced fluorescence, phosphorescence and delayed fluorescence in a single system. Phys. Chem. Chem. Phys 2013, 15, 19538–19544. [DOI] [PubMed] [Google Scholar]
- 15.Zhang Y; Yang C; Zhang G; Peng Z; Yao L; Wang Q; Cao Z; Mu Q; Xuan L, Distance-dependent metal enhanced fluorescence by flowerlike silver nanostructures fabricated in liquid crystalline phase. Optical Materials 2017, 72, 289–294. [Google Scholar]
- 16.Dragan AI; Mali B; Geddes CD, Wavelength-dependent metal-enhanced fluorescence using synchronous spectral analysis. Chemical Physics Letters 2013, 556, 168–172. [Google Scholar]
- 17.Knoblauch R; Ra E; Geddes CD, Heavy carbon nanodots 2: plasmon amplification in Quanta Plate™ wells and the correlation with the synchronous scattering spectrum. Physical Chemistry Chemical Physics: PCCP 2019, 21 (3), 1254–1259. [DOI] [PMC free article] [PubMed] [Google Scholar]
- 18.Petryayeva E; Krull UJ, Localized surface plasmon resonance: Nanostructures, bioassays and biosensing—A review. Analytica Chimica Acta 2011, 706 (1), 8–24. [DOI] [PubMed] [Google Scholar]
- 19.Dragan AI; Geddes CD, Metal-enhanced fluorescence: The role of quantum yield, Q0, in enhanced fluorescence. Applied Physics Letters 2012, 100 (9), 093115. [Google Scholar]
- 20.Karolin JO; Geddes CD, Reduced Lifetimes are Directly Correlated with Excitation Irradiance in Metal-Enhanced Fluorescence (MEF). JOURNAL OF FLUORESCENCE 2012, 22 (6), 1659–1662. [DOI] [PubMed] [Google Scholar]
- 21.Wei L-Y; Huang K-S; Ling H-H; Wu Y-P; Tan K-T; Lee YY; Chen IC, Kinetic Mechanism of Metal Enhanced Fluorescence by Gold Nanoparticle with Avidin-Biotin as Spacer and by Gold-Silver Core-Shell Nanoparticle Using Fluorescence Lifetime Image Microscopy. Journal of Physical Chemistry C 2018, 122 (49), 28431–28438. [Google Scholar]
- 22.Centeno A; Xie F, An Electromagnetic Study of Metal Enhanced Fluorescence Due to Immobilized Nanoparticle Arrays on Glass Substrates. Materials Today: Proceedings 2015, 2 (1), 94–100. [Google Scholar]
- 23.Ben Hamo H; Kushmaro A; Marks R; Karolin J; Mali B; Geddes CD, Metal-enhanced fluorescence from zinc substrates can lead to spectral distortion and a wavelength dependence. APPLIED PHYSICS LETTERS 2015, 106 (8). [Google Scholar]
- 24.Geddes CD, Spectral shifts in metal-enhanced fluorescence. APPLIED PHYSICS LETTERS 2014, 105 (6). [Google Scholar]
- 25.Le Ru EC; Etchegoin PG; Grand J; Félidj N; Aubard J; Lévi G, Mechanisms of Spectral Profile Modification in Surface-Enhanced Fluorescence. Journal of Physical Chemistry C 2007, 111, 16076–16079. [Google Scholar]
- 26.Synak A; Szczepańska E; Grobelna B; Gondek J; Mońka M; Gryczynski I; Bojarski P, Photophysical properties and detection of Valrubicin on plasmonic platforms. Dyes and Pigments 2019, 163, 623–627. [Google Scholar]
- 27.Zhang Y; Aslan K; Previte MJR; Malyn SN; Geddes CD, Metal-enhanced phosphorescence: interpretation in terms of triplet-coupled radiating plasmons. Journal of Physical Chemistry B 2006, 110 (49), 25108–25114. [DOI] [PubMed] [Google Scholar]
- 28.Losytskyy MY; Akbay N; Chernii SV; Kryvorotenko DV; Yarmoluk SM; Kovalska VB, Metal-enhanced fluorescence of the trimethine cyanine dyes complexed with amyloid fibrils. Journal of Luminescence 2018, 204, 209–215. [Google Scholar]
- 29.Mishra H; Geddes CD, Metal-Enhanced Si and Alpha-S-1 Fluorescence: Effects of Far-Field Excitation Irradiance on Enhanced Fluorescence. Journal of Physical Chemistry C 2014, 118, 28791–28796. [Google Scholar]
- 30.Geddes CD; Lakowicz JR, Metal-enhanced fluorescence. Journal of Fluorescence 2002, 12 (2), 121–129. [DOI] [PMC free article] [PubMed] [Google Scholar]
- 31.Aslan K; Geddes CD, Microwave-Accelerated Metal-Enhanced Fluorescence: Platform Technology for Ultrafast and Ultrabright Assays. Analytical Chemistry 2005, 77 (24), 8057. [DOI] [PubMed] [Google Scholar]
- 32.Garland CW; Nibler JW; Shoemaker DP, Experiments in physical chemistry. 8th ed. ed.; McGraw-Hill Higher Education: 2009. [Google Scholar]
- 33.Pribik R; Dragan AI; Zhang Y; Gaydos C; Geddes CD, Metal-Enhanced Fluorescence (MEF): Physical characterization of Silver-island films and exploring sample geometries. Chemical Physics Letters 2009, 478, 70–74. [DOI] [PMC free article] [PubMed] [Google Scholar]
- 34.Knoblauch R; Geddes CD, Silvered conical-bottom 96-well plates: enhanced low volume detection and the metal-enhanced fluorescence volume/ratio effect. Nanoscale 2019, 11 (10), 4337. [DOI] [PubMed] [Google Scholar]
- 35.Zhang Y; Aslan K; Previte MJ; Geddes CD, Low Temperature Metal-Enhanced Fluorescence. Journal of Fluorescence 2007, 17 (6), 627–631. [DOI] [PubMed] [Google Scholar]
- 36.Jin T; Zhang Y; Li Y; Jing W; Li Y; Fan L; Li X, Ag@SiO2 nanoparticles performing as a nanoprobe for selective analysis of 2-aminoanthracene in wastewater samples via metal-enhanced fluorescence. Talanta 2019, 200, 242–248. [DOI] [PubMed] [Google Scholar]
- 37.Asian K; Previte MJR; Yongxia Z; Geddes CD, Metal-enhanced fluorescence from nanoparticulate zinc films. Journal of Physical Chemistry C 2008, 112 (47), 18368–18375. [DOI] [PMC free article] [PubMed] [Google Scholar]
- 38.Yongxia Z; Geddes CD, Metal-enhanced fluorescence from thermally stable rhodium nanodeposits. Journal of Materials Chemistry 2010, 20 (39), 8600–8606. [Google Scholar]
- 39.Mishra H; Dragan A; Geddes CD, UV to NIR Surface Plasmon Coupled and Metal-Enhanced Fluorescence Using Indium Thin Films: Application to Intrinsic (Label-less) Protein Fluorescence Detection. JOURNAL OF PHYSICAL CHEMISTRY C 2011, 115 (35), 17227–17236. [Google Scholar]
- 40.Lacowicz JR; Geddes CD; Gryczynski I; Malicka J; Gryczynski Z; Aslan K; Lukomska J; Matveeva E; Zhang J; Badugu R; Huang J, Advances in surface-enhanced fluorescence. Journal of Fluorescence 2004, 14 (4), 425–441. [DOI] [PMC free article] [PubMed] [Google Scholar]
- 41.Gryczynski I; Malicka J; Gryczynski Z; Geddes CD; Lakowicz JR, The CFS engineers the intrinsic radiative decay rate of low quantum yield fluorophores. Journal of Fluorescence 2002, 12 (1), 11–13. [Google Scholar]
- 42.Yongxia Z; Dragan A; Geddes CD, Broad Wavelength Range Metal-Enhanced Fluorescence Using Nickel Nanodeposits. Journal of Physical Chemistry C 2009, 113 (36), 15811–15816. [Google Scholar]
- 43.Corrigan T; Guo S; Phaneuf R; Szmacinski H, Enhanced Fluorescence from Periodic Arrays of Silver Nanoparticles. Journal of Fluorescence 2005, 15 (5), 777. [DOI] [PubMed] [Google Scholar]
- 44.Bingjie Y; Nan L; Dianpeng Q; Renping M; Qiong W; Juanyuan H; Xiaoming L; Ying M; Reboud V; Kehagias N; Torres C; Boey F; Xiaodong C; Lifeng C, Tuning the Intensity of Metal-enhanced Fluorescence by Engineering Silver Nanoparticle Arrays. Small 2010, 6 (9), 1038–1043. [DOI] [PubMed] [Google Scholar]
- 45.Lakowicz JR, Radiative decay engineering 5: metal-enhanced fluorescence and plasmon emission. Analytical Biochemistry 2005, 337 (2), 171. [DOI] [PMC free article] [PubMed] [Google Scholar]
- 46.Lakowicz JR, Principles of fluorescence spectroscopy. New York: Springer, c2006. 3rd ed.: 2006. [Google Scholar]
- 47.Mustafa HC; Stuart NM; Kadir A; Joseph RL; Chris DG, Multicolor Directional Surface Plasmon-Coupled Chemiluminescence. Journal of Physical Chemistry B 2006, 110 (45), 22644–22651. [DOI] [PMC free article] [PubMed] [Google Scholar]
- 48.Previte MJR; Aslan K; Malyn SN; Geddes CD, Microwave Triggered Metal Enhanced Chemiluminescence: Quantitative Protein Determination. Analytical Chemistry 2006, 78 (23), 8020–8027. [DOI] [PubMed] [Google Scholar]
- 49.Chowdhury MH; Malyn SN; Aslan K; Lakowicz JR; Geddes CD, First observation of surface plasmon-coupled chemiluminescence (SPCC). Chemical Physics Letters 2007, 435 (1), 114–118. [DOI] [PMC free article] [PubMed] [Google Scholar]
Associated Data
This section collects any data citations, data availability statements, or supplementary materials included in this article.
Supplementary Materials
APPENDIX A: Acronyms and Abbreviations
APPENDIX B: Sample Data Extraction from Image File
APPENDIX C: Percent Area Contribution Example Calculation
APPENDIX D: Supplemental Figures
Figure S1. Real-color photographs of silver nanoparticle substrates. A-C) Silver island films (SiFs) deposited on glass by the wet deposition method, with absorption values of A) 0.582, B) 0.82, and C) 1.0. D) Silver nanoparticles of 3 nm thickness deposited on glass by the vapor deposition method.
Figure S2. Fluorescence spectra for Rose Bengal (λex = 473 nm, 0.16-Wcm−2) detected on glass or 3 nm silver nanoparticles (AgNPs). The resulting coupled fluorescence (CF) spectrum is also shown. A) Raw fluorescence intensity of each spectrum and resulting enhancement factor (EF) reported at each emission wavelength. B) Normalized fluorescence spectra displaying red-shifted maxima (solid arrow).
Figure S3. Multi-Gaussian fitting parameters for Rose Bengal (λex = 473 nm) detected on glass or silver nanoparticles (AgNPs). Fits included are A) the raw spectrum from Rose Bengal on glass, B) the red region of the coupled fluorescence (CF) spectrum, and C) the blue region of the CF spectrum. For all panels, the left – displays the fit and the right – displays the corresponding residuals.
Figure S4. Fitting parameters for the multi-Gaussian fits of the coupled fluorescence (CF) spectra for Rose Bengal (RB, λex = 473 nm) detected on glass versus silver island films with absorption values of A/E) 0.57, B/F) 0.61, C/G) 0.67 and D) 1.0 arbitrary units. A-D) Fitting for the red-shifted region. E-G) Fitting for the blue-shifted region. For each panel, left – displays the fit and the right – displays corresponding residuals.
Figure S5. Multi-Gaussian fit of the raw spectrum from Rose Bengal (λex = 473 nm) detected on glass. A) Spectral fit (black spectrum) with corresponding Gaussian distributions (colored spectra). Peak wavelengths for each component are labeled. B) Fitting parameters for (A) showing left – the fit and right – the corresponding residuals.
Figure S6. Fitting parameters for the multi-Gaussian fits of the coupled fluorescence (CF) spectra for Fluorescein (λex = 473 nm) detected on glass versus silver island films with absorption values of A) 0.68, B) 0.67, C) 0.54 and D) 0.48 arbitrary units. For each panel, left – displays the fit and the right – displays corresponding residuals.
Figure S7. Multi-Gaussian deconvolution analysis of the raw spectrum from Fluorescein (λex = 473 nm) detected on glass. A) Spectral fit (black spectrum) with corresponding Gaussian distributions (colored spectra). Peak wavelengths for each component are labeled. B) Fitting parameters for (A) showing left – the fit and right – the corresponding residuals.
Figure S8. Multi-Gaussian fit of the coupled fluorescence (CF) spectrum from Rose Bengal (λex = 532 nm) detected on glass or silver island films (SiFs) reported in Figure 15 of the main article. Left – fit for CF spectrum and right – corresponding residuals. Data was analyzed from reference [S1].
Figure S9. Fluorescence spectra for trimethine cyanine dye (λex = 530 nm) detected on glass or silver island films (SiFs, A = ~0.85 a.u.) and the resulting coupled fluorescence (CF) spectrum. A) Extracted raw intensity values for each spectrum and corresponding enhancement factors (EF) at each emission wavelength. B) Normalized spectra from (A). Note that the Glass* spectrum had baseline noise subtracted for clarity of spectral shape. C) Multi-Gaussian deconvolution analysis of the CF spectrum (black spectrum) with corresponding Gaussian distributions (colored spectra). Peak wavelengths for each component are labeled. D) Percent area contribution of each Gaussian distribution to the total integrated area of the resulting fit from (C). E) Left – fit for CF spectrum and right – corresponding residuals. Data was analyzed from reference [S2].
Figure S10. Fluorescence spectra for Valrubicin (λex = 470 nm) detected on glass or silver core-shell nanostructure coated glass (Ag@SiO2) and the resulting coupled fluorescence (CF) spectrum. A) Extracted raw intensity values for each spectrum and corresponding enhancement factors (EF) at each emission wavelength. B) Normalized spectra from (A). C) Multi-Gaussian deconvolution analysis of the CF spectrum (black spectrum) with corresponding Gaussian distributions (colored spectra). Peak wavelengths for each component are labeled. D) Percent area contribution of each Gaussian distribution to the total integrated area of the resulting fit from (C). E) Left – fit for CF spectrum and right – corresponding residuals. Data was analyzed from reference [S3].
Figure S11. Normalized absorption spectra for fluorescein sodium salt and Rose Bengal dissolved in water. Each spectrum is a single representative spectrum of the three averaged spectra used to determine the extinction coefficients for each fluorophore.
Table S1. Extinction Coefficients (ε) of Rose Bengal and Fluorescein Sodium Salt Reported for Different Wavelengths.