

Abstract

Non-decomposable plastic has been replaced with polylactic acid, which is a biodegradable aliphatic polyester stationary phase, in composite films embedded with a TiO2 photocatalyst for mitigation of indoor air pollution. PLA has superior properties relative to those of other biopolymers, such as a relatively high melting point, crystallinity, and rigidity. This study aimed to incorporate TiO2-anatase into PLA for use as a photocatalyst using the blown film method. Photocatalytic oxidation, an advanced oxidative process, has been recognized as an economical technique providing convenience and efficiency with indoor air treatment. Therefore, the use of new environmentally friendly biodegradable polymers provides an alternative way to address the severe environmental concerns caused by non-decomposable plastics. UV–vis spectrophotometry and scanning electron microscopy–energy-dispersive X-ray spectroscopy (SEM–EDX) were used to observe the dispersibility and mixing capacity of the TiO2-anatase PLA matrix. TiO2 dosages were 5, 10, and 15% (wt/wt), and they were incorporated with a twin-screw extruder. SEM–EDX images demonstrated the homogeneity of TiO2 distribution in the PLA matrix. The energy band gaps of TiO2 in the PLA/TiO2-composite films were between 3.14 and 3.22 eV. The relationship between the photocatalytic oxidation rate and the TiO2 dosage in the PLA/TiO2-composite films was determined. A prototype reactor model is geared toward the development of air purifiers for indoor air conditioning. Rate constants for benzene degradation were obtained using first-order kinetics to find rate constants matching experimental findings. In the PLA/TiO2-composite film, the TiO2-anatase photocatalyst was able to degrade 5 ppm benzene. This work contributes to the use of ecoefficient photocatalytic oxidation.
Highlights
TiO2 loaded on a plant-based biodegradable polylactic acid was used as a photocatalyst for benzene degradation in simulated indoor air.
The photocatalyst was placed in a commercial air purifier, catalysis was performed with a high volume of simulated indoor air, and the highest photocatalytic oxidation efficiency was seen with a 5% PLA/TiO2 film.
Introduction
Adults inspire and expire 400–500 mL of air in each respiratory cycle.1 People spend approximately 90% of their time indoors, in offices, homes, malls, gyms, and schools.2 Therefore, indoor air quality (IAQ) can significantly affect the health and quality of life.3 Poor indoor air quality, particularly involving indoor air microbiomes, e.g., Mycobacterium tuberculosis(4) and severe acute respiratory syndrome coronavirus 2 (SARS-CoV-2),5 seriously affects human health.6 The coronavirus spreads through liquid droplets when an infected person coughs,7 sneezes,8 speaks,9 sings,10 and/or shouts.7 During the coronavirus (COVID-19) pandemic, people spend almost all of their time at home; as a result, they are exposed to high levels of indoor air pollution, not only bioaerosols but also volatile organic compounds (VOCs). Sources of VOCs that cause poor indoor air quality are tobacco,11 cooking,12 solvents,13 wood preservatives,14 painting,15 cleansers, and disinfectants.16 The main indoor and outdoor environmental problems caused by VOCs are increased tropospheric ozone,17 adverse health effects,18 and carcinogenicity.19 VOCs increase the risk of obstructive pulmonary diseases, skin cancers, birth defects, and neurocognitive impairment.20 Benzene is one of the VOCs identified as carcinogenic to humans by the International Agency for Cancer Research (IARC) (Group I) on the basis of ample evidence that it causes leukemia.21
The main industrial hygiene principles to follow to reduce exposure to hazards are recognition, measurement, evaluation, and control.22 An air purifier is an affordable, user-friendly, and easily accessible way to control chemical hazards.23 Technologies for VOC reduction include adsorption,24 liquid absorption,25 photolysis,26 membrane separation,27 bio-filtration,28 ozonation,29 plasma catalysis,30 biological degradation,31 and advanced oxidation processes such as photocatalytic oxidation.32 Photocatalytic oxidation (PCO) has been widely used and is well known for the treatment of VOCs because it can transform not only VOCs but also a wide range of pollutants to end products obtained from processes involving H2O and CO2; it exhibits various advantages, such as operation at low pressure and temperature.28 The authors of this paper chose titanium dioxide (TiO2) as a photocatalyst due to its abundance, lack of toxicity, low cost, effectiveness, and high chemical stability.33 Many types of TiO2 composites with polymers, such as polyethylene,34 polypropylene,35 polyvinyl chloride,36 and nylon-6,37 have been successfully synthesized; however, after treatment, environmental issues arise. As a result, non-decomposable plastics have been replaced by polylactic acids, which are biodegradable aliphatic polyesters that serve as stationary phases for composite films containing TiO2; these compositions can be used as photocatalysts to test the photocatalytic activity of biodegradable composite films for the removal of VOCs. A plant-based biodegradable polylactic acid (PLA) was used in this work as a biosupport for TiO2 catalysts.28 Benzene is a major indoor and industrial air pollutant38 and has been chosen as a representative indoor VOC.39 The Langmuir–Hinshelwood model has been used extensively to successfully explain the photocatalytic oxidation rate of various contaminants, such as VOCs. This research uses the Langmuir adsorption isotherm to explain the rate of pollutant removal.
This research aims to incorporate TiO2-anatase into PLA for photocatalytic applications. Characterization of PLA/TiO2-composite films was performed by analyzing SEM–EDX data, determining the functional groups of chemical structures by ATR-FTIR and using UV–visible absorbance spectra to determine band gap energies. Finally, the efficiencies of PLA/TiO2-composite films in benzene photocatalytic oxidative degradation in simulated indoor air were analyzed using the films in indoor air purifiers.
Materials
TiO2 (anatase phase) was purchased from Dupont Company. Food-grade polylactic acid was purchased from NatureWorks.
Preparation of the Photocatalyst; PLA/TiO2-Composite Film
Titanium dioxide (TiO2) dosages of 5, 10, and 15% (wt/wt) were mixed with polylactic acid (PLA) and incorporated utilizing a twin-screw extruder (Lab Tech, LTE16-40). TiO2 anatase levels were altered to increase TiO2 dispersion and boost the compatibility between the TiO2 and the PLA matrix.40 PLA/TiO2-composite films with a thickness of 30 μm were obtained at operating temperatures ranging from 100 to 190 °C and at 200 rpm using the blown film technique.41
Characterization of the Photocatalyst; PLA/TiO2-Composite Film
Scanning electron microscopy (SEM) (LEO 1455 VP, 20 kV) was used to study the morphologies of the films. Energy-dispersive X-ray spectroscopy (EDX) (LEO 1455 5VP, SEM–EDX 20 kV) was used for qualitative and quantitative analysis of elements in films. A UV–visible spectrophotometer (UV–vis) (Analytik Jena SPECORD 210 PLUS) was used to measure the photocatalyst absorptions in the ultraviolet–visible spectrum with a scan range of 200–800 nm, a scan speed of 50 nm/s, a slit of 1 nm, and a delta lambda of 1 nm. All spectra were monitored in absorbance mode under ambient conditions. The band gap energy of TiO2 on a film was calculated from the absorbance results. Attenuated total reflectance Fourier transform infrared spectroscopy (ATR-FTIR) (PerkinElmer Frontier) was used to determine the functional groups of the chemicals.42 Spectra were recorded in the range of 400–4000 cm–1 with a scan step of 1 cm–1; the functional groups of the films were determined before and after photocatalytic experiments (360 h duration).
Photocatalytic Oxidation Degradation with Scale-Up of the Photoreactor for Air Purification
A UVC 254 nm lamp was placed in the middle of a cylindrical annular reactor43 containing the photocatalyst. The annular reactor was set up in a commercial air purifier, as shown in Figure 1. Photocatalytic oxidative degradation was conducted in an annular closed-system reactor. In a 785 L chamber cabinet, a scaled-up photoreactor was used to simulate indoor air conditions, and the total reactor volume was approximately 2 L. The PLA/TiO2-composite film and a type-C ultraviolet lamp with an output wavelength of 254 nm were mounted inside the reactor. The electrical power of the UVC lamp was 18 W, which is equivalent to a light intensity of approximately 5 mW·cm–2.
Figure 1.

Schematic of (a) scale-up of the photoreactor; (b) air purifier in the photoreactor.
Figure 1 displays a schematic diagram of the experimental setup. The reactor was linked to an air compressor that maintained an air flow rate of 300 L·min–1. The relative humidity in the reactor was changed to 55% by initially circulating air with a particular humidity through the reactor. The humidity and temperature inside the reactor were continuously measured with a thermohygrometer. The original benzene concentration was 5.21 ppm. The UVC lamp was switched on to start the photocatalytic oxidation after a steady state was reached.
Quantitative research was performed using gas chromatography (GC) with an instrument fitted with a flame ionization detector (FID)44 to track the concentration of benzene in the reactor throughout the experiment. Heterogeneous catalytic processes, including adsorption and photodegradation, were defined in the model. The Langmuir–Hinshelwood model represented by eq 1 was used to determine the bulk photodegradation rate.
| 1 |
where k is the apparent kinetic constant (ppm·min–1), K is the adsorption equilibrium constant (ppm–1), and C is the concentration of VOCs on the photocatalyst surface in the gas phase (ppm). The adsorption equilibrium and reaction rate constants are intrinsic properties of the photocatalyst for the decomposition of VOCs. Other variables were measured by experimentation.
For determination of the oxidation rate and CO2 yield,45 gas samples were collected at the sampling port of the reactor. The gas samples were then studied using gas chromatography–flame ionization detection (GC-FID) and gas chromatography–thermal conductivity detection (GC-TCD) for the analyses of benzene and CO2, respectively. The analyses of benzene were performed using gas chromatography–mass spectroscopy (GC–MS) as described earlier, whereas the CO2 concentration was analyzed using GC-TCD with a Shimadzu model GC-8A TCD instrument equipped with a polar pack Q 5 M in a glass column. The analytical conditions were set as follows: an injection temperature of 50 °C, a column temperature of 100 °C, a TCD temperature of 100 °C, a current of 90 mA, an injection volume of 0.2 mL, and a gas pressure of 2 kg·cm–3.
Results and Discussion
Characterization of the PLA/TiO2-Composite Film
The compounding of the virgin PLA film and PLA/TiO2-composite film by the extrusion method is demonstrated in Figure 2. The virgin-PLA film and PLA/TiO2-composite film were produced by compounding using a blow machine, as shown in Figure 2. SEM–EDX was used to classify the morphology of the PLA/TiO2-composite film. The dispersion of TiO2 on the surface of PLA/TiO2-composite films is shown in Figure 3, and a virgin PLA film is shown for reference in Figure 3a. TiO2 was well dispersed on the inner surface of the film, especially for 5 and 10% TiO2 loadings, as shown in Figure 3. In comparison with prior research, better results were obtained during this work.46 However, a few clumps of TiO2 particles were observed on the inner surface of the film with high dosages of TiO2. During the heating phase of the blown film method, aggregation of the TiO2 particles could occur.47 EDX mapping of the PLA and the PLA/TiO2-composite films is described in Table 1.
Figure 2.
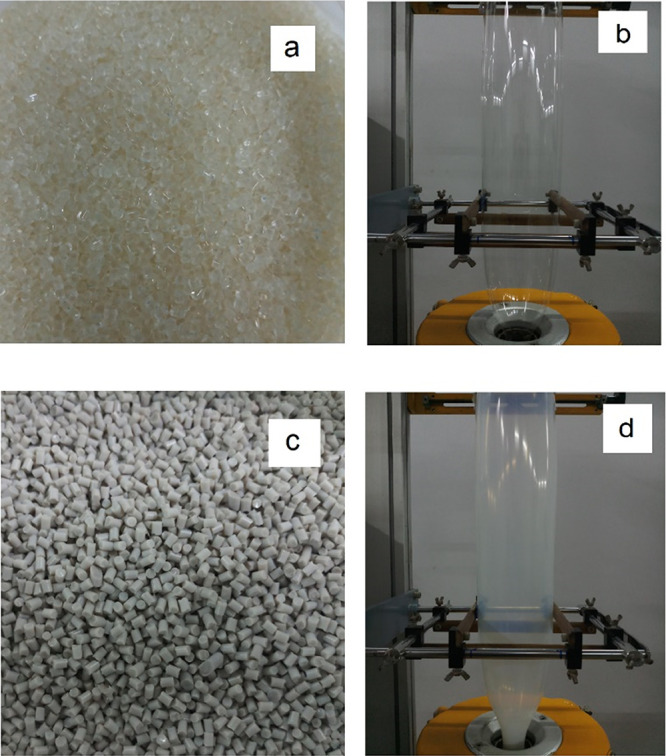
Virgin PLA produced by a (a) twin-screw extruder and (b) blow machine; compounding of PLA/TiO2-composite films by the (c) extrusion method and (d) blow machine.
Figure 3.

SEM images of the (a) virgin PLA composite film, (b) 5% wt/wt PLA/TiO2-composite film, (c) 10% wt/wt PLA/TiO2-composite film, and (d) 15% wt/wt PLA/TiO2-composite film.
Table 1. EDX Analysis of PLA/TiO2 Composite Films and the Corresponding Elemental Compositions.
| element | PLA | 5% PLA/TiO2 | 10% PLA/TiO2 | 15% PLA/TiO2 |
|---|---|---|---|---|
| carbon (C) | 50.12 | 48.01 | 47.98 | 44.54 |
| oxygen (O) | 49.88 | 45.65 | 42.14 | 40.15 |
| titanium (Ti) | 6.34 | 9.88 | 15.32 |
Optical Properties of the PLA/TiO2 Composite Film Determined Using a UV–Visible Spectrophotometer
The UV–vis absorbance spectra of the PLA/TiO2-composite films with different concentrations of TiO2-anatase were examined. As seen from the spectra in Figure 4, the virgin PLA film absorbed little UV–visible light in the range of 200–800 nm, while the films with 5 and 10% wt/wt TiO2-anatase absorbed UV light with wavelengths less than 350 nm. The energy band gap (Eg) of the TiO2-anatase in PLA composite films can be calculated from the absorption spectra. A range of 3.14–3.22 eV was determined for the band gaps, as shown in Table 2. The band gap energy is provided when this material is irradiated with photons with wavelengths less than 350 nm. An electron from the valence band is promoted to the conduction band under these conditions. In the space-charge field, the resulting electron–hole pair has a lifetime that allows its participation in chemical reactions.36
Figure 4.
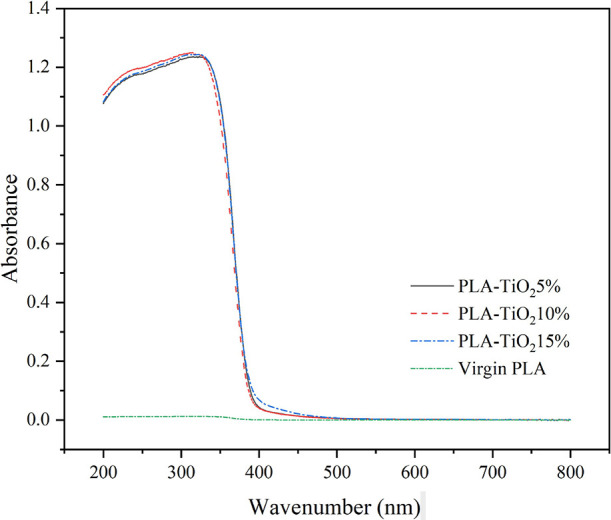
UV–visible absorbance spectra of the virgin PLA film and 5, 10, and 15% PLA/TiO2-composite films.
Table 2. Calculated Results from the Absorbance of the PLA/TiO2 Composite Films with Various Dosages of TiO2.
| no. | PLA/TiO2-composite film | band gap energy (Eg, eV) |
|---|---|---|
| 1 | 5% wt/wt | 3.22 |
| 2 | 10% wt/wt | 3.19 |
| 3 | 15% wt/wt | 3.14 |
Chemical Structure of PLA/TiO2-Composite Films Determined by ATR-FTIR
The functional groups contained in the PLA/TiO2 composite films were defined by ATR-FTIR. The same findings were obtained for all samples. The ATR-FTIR spectra are shown in Figure 5. The characteristic bands corresponding to H—C=O::C–H aliphatic hydrocarbons, aldehydes,48 and COOR groups are at 2850–3000, 2830–2695, and 1640–1690 cm–1, respectively. Additionally, C–C aromatic stretching49 vibrations gave peaks at 1400–1500 cm–1. The band width at 719 cm–1 should be attributable to the band envelope for Ti–O–Ti groups.50 After photocatalytic oxidation experiments, all FTIR spectra of the PLA/TiO2 composite films recorded decreases in the intensities of all adsorption bands. Moreover, after photocatalytic oxidation, the adsorption peak at 1640–1690 cm–1 was shifted to 1710–1760 cm–1. Furthermore, as mentioned in general texts, the photocatalytic oxidation of PLA under UV light generates various radicals during decomposition.51 In addition, the photocatalytic oxidation of PLA was performed at ambient temperature and has the potential for degradation of PLA into small organic acids or compounds such as HCOOH, CH3COOH, (COOH)2, or CH3CHO.52
Figure 5.

ATR-FTIR spectra of the 5, 10, and 15% PLA/TiO2-composite films.
Photocatalytic Oxidation of Benzene in Simulated Indoor Air
Benzene photocatalytic oxidation was studied by using PLA/TiO2-composite films with different TiO2 dosages. The relationship of the photocatalytic oxidation rate to the catalyst dosage level is presented in Figure 6. Benzene degradation rate constants were obtained using first-order kinetics, and rate constants were determined by fitting experimental results. Table 3 shows the apparent kinetic rate constant for photocatalytic oxidation, obtained by using a simplified Langmuir–Hinshelwood approach. The apparent kinetic constant of the 5% PLA/TiO2-composite film was the highest. The plots demonstrate that the slopes were determined from straight lines by following first-order kinetic methods and using the least-squares procedure. A first-order reaction at low concentrations was confirmed by previous research, and a linear increase in the reaction rate at low initial benzene concentrations was reported. In this study, benzene was the only pollutant available for degradation, and a single site Langmuir–Hinshelwood model was applied to evaluate the photocatalytic oxidation rates.45 In addition, Figure 6 shows that the film with a TiO2 dosage of 5% wt/wt yielded the highest removal efficiency (44%); the 10 and 15% wt/wt films exhibited removal efficiencies of 42 and 32%, respectively. On the other hand, there was a small decrease when the dose of TiO2 rose from 5 to 15% wt/wt. This could be due to the higher doses of TiO2 and higher abundance of hydroxyl radicals interacting with benzene, resulting in faster film removal. However, over a certain dose of TiO2, the rate of degradation began to decrease due to mass transfer53 and the attenuation of light penetration.54
Figure 6.

Impact of various TiO2 dosages (initial benzene concentration, 5 ppm; light intensity, 5 mw·cm–2; gas flow rate, 300 L·min–1; and relative humidity, 55% RH).
Table 3. Simplified Langmuir–Hinshelwood Forma.
| PLA/TiO2-composite
film |
|||||||||
|---|---|---|---|---|---|---|---|---|---|
| 5% PLA/TiO2 |
10% PLA/TiO2 |
15% PLA/TiO2 |
|||||||
| initial concentration (ppm) | kb | Kc | R2 | kb | Kc | R2 | kb | Kc | R2 |
| 5.21 | 0.0047 | 0.1975 | 0.9988 | 0.0008 | 0.1956 | 0.9288 | 0.0001 | 0.1940 | 0.9996 |
Simplified Langmuir–Hinshelwood form is ln(C/Co) = −kKt.
k is the apparent kinetic constant (ppm·min–1).
K is the adsorption equilibrium constant (ppm–1).
Mass transfer affects the rate of degradation, which is explained by the processes of photocatalytic oxidation. These processes are as follows: first, benzene is transferred to the photocatalyst surface; second, benzene is adsorbed on the photocatalyst surface; third, a photocatalytic oxidation reaction occurs on the surface; then, byproducts are desorbed from the surface of the photocatalyst; finally, byproducts are transferred from the surface into the air.55 TiO2 dosages of 10 and 15% may be too high for PLA/TiO2-composite films and may cause aggregation, which affects mass transfer and lowers the degradation rate.56 Moreover, the photocatalytic oxidation reaction occurs at the liquid–catalyst interface, and therefore, when the catalyst is immobilized, both external and internal mass transfers play significant roles in the overall photocatalytic process.
Intermediate Products in the Photocatalytic Oxidation of Benzene in Simulated Indoor Air
Intermediate products were produced in the process of photocatalytic degradation of benzene by the PLA/TiO2-composite film, as shown in Figure 7. The mechanism of the photocatalytic degradation of benzene by TiO2 has been shown in a previous study.57 Benzene was converted into phenol, then into other intermediates, and finally into carbon dioxide and water.57 The proportions of residual intermediates increased as the oxidation rate and time increased. The CO2 yield was probably due to a surface reaction. The CO2 yield rate was related to the apparent oxidation rate of benzene or a secondary intermediate. Hypothetically, benzene can be transformed into CO2 and H2O; however, residual intermediates can be found for incomplete mineralization. The amounts of residual intermediates increased rapidly. After this, the concentrations of intermediates increased slowly at rates corresponding to the oxidation rates. For PCO, accumulation of residual intermediates can occur at the active site and in the benzene gas phase, which subsequently increases the proportions of residual intermediates.45
Figure 7.

Intermediate products formed in the photocatalytic process using the 5% PLA/TiO2 composite film.
Conclusions
In summary, TiO2-anatase incorporated into a PLA/TiO2-composite film was found to be a highly promising photocatalyst for the degradation of benzene at a 5% wt/wt level of TiO2-anatase. The benzene removal efficiencies for photocatalytic oxidation in simulated indoor air suggest that PLA/TiO2-composite films can be used for indoor air purifiers.
Acknowledgments
Saksit Imman was supported by a Unit of Excellence (UOE63006) from the University of Phayao. The authors would like to express gratitude to the Faculty of Public Health, Burapha University, 169, Saensuk, Mueang Chon Buri District, Chon Buri Province 20131, Thailand.
The authors declare no competing financial interest.
References
- Hallett S.; Toro F.; Ashurst J. V.. Physiology, Tidal Volume [Online]; StatPearls Publishing: Treasure Island, FA, 2020; pp. 1–15. https://www.ncbi.nlm.nih.gov/books/NBK482502/?report=reader (access Dec 10, 2020). [PubMed] [Google Scholar]
- Klepeis N. E.; Nelson W. C.; Ott W. R.; Robinson J. P.; Tsang A. M.; Switzer P.; Behar J. V.; Hern S. C.; Engelmann W. H. The National Human Activity Pattern Survey (NHAPS): a resource for assessing exposure to environmental pollutants. J. Expo. Sci. Environ. Epidemiol. 2001, 11, 231–252. 10.1038/sj.jea.7500165. [DOI] [PubMed] [Google Scholar]
- Cincinelli A.; Martellini T. Indoor Air Quality and Health. Int. J. Environ. Res. Public Health 2017, 14, 1286. 10.3390/ijerph14111286. [DOI] [PMC free article] [PubMed] [Google Scholar]
- Lin Y.-J.; Lin H.-C.; Yang Y.-F.; Chen C.-Y.; Ling M.-P.; Chen S.-C.; Chen W.-Y.; You S.-H.; Lu T.-H.; Liao C.-M. Association Between Ambient Air Pollution and Elevated Risk of Tuberculosis Development. Infect Drug Resist 2019, Volume 12, 3835–3847. 10.2147/IDR.S227823. [DOI] [PMC free article] [PubMed] [Google Scholar]
- Meselson M. Droplets and Aerosols in the Transmission of SARS-CoV-2. N. Engl. J. Med 2020, 382, 2063–2063. 10.1056/NEJMc2009324. [DOI] [PMC free article] [PubMed] [Google Scholar]
- Nwanaji-Enwerem J. C.; Allen J. G.; Beamer P. I. Another invisible enemy indoors: COVID-19, human health, the home, and United States indoor air policy. J. Expo. Sci. Environ. Epidemiol. 2020, 30, 773–775. 10.1038/s41370-020-0247-x. [DOI] [PMC free article] [PubMed] [Google Scholar]
- Jones N. R.; Qureshi Z. U.; Temple R. J.; Larwood J. P. J.; Greenhalgh T.; Bourouiba L. Two metres or one: what is the evidence for physical distancing in covid-19?. BMJ 2020, 370, m3223. 10.1136/bmj.m3223. [DOI] [PubMed] [Google Scholar]
- Busco G.; Yang S. R.; Seo J.; Hassan Y. A. Sneezing and asymptomatic virus transmission. Phys. Fluids 2020, 32, 073309 10.1063/5.0019090. [DOI] [PMC free article] [PubMed] [Google Scholar]
- Stadnytskyi V.; Bax C. E.; Bax A.; Anfinrud P. The airborne lifetime of small speech droplets and their potential importance in SARS-CoV-2 transmission. Proc. Nat. Acad. Sci. 2020, 117, 11875. 10.1073/pnas.2006874117. [DOI] [PMC free article] [PubMed] [Google Scholar]
- Hamner L.; Dubbel P.; Capron I.; Ross A.; Jordan A.; Lee J.; Lynn J.; Ball A.; Narwal S.; Russell S.; Patrick D.; Leibrand H. High SARS-CoV-2 Attack Rate Following Exposure at a Choir Practice — Skagit County, Washington, March 2020. Morb. Mortal Wkly. Rep. High 2020, 69, 606–610. 10.15585/mmwr.mm6919e6. [DOI] [PubMed] [Google Scholar]
- Vanker A.; Nduru P. M.; Barnett W.; Dube F. S.; Sly P. D.; Gie R. P.; Nicol M. P.; Zar H. J. Indoor air pollution and tobacco smoke exposure: impact on nasopharyngeal bacterial carriage in mothers and infants in an African birth cohort study. ERJ Open Res. 2019, 5, 00052–02018. 10.1183/23120541.00052-2018. [DOI] [PMC free article] [PubMed] [Google Scholar]
- Zhang D. C.; Liu J. J.; Jia L. Z.; Wang P.; Han X. Speciation of VOCs in the cooking fumes from five edible oils and their corresponding health risk assessments. Atmos. Environ. 2019, 211, 6–17. 10.1016/j.atmosenv.2019.04.043. [DOI] [Google Scholar]
- Zhang X.; Zhao W.; Nie L.; Shao X.; Dang H.; Zhang W.; Wang D. A new classification approach to enhance future VOCs emission policies: Taking solvent-consuming industry as an example. Environ. Pollut. 2021, 115868. 10.1016/j.envpol.2020.115868. [DOI] [PubMed] [Google Scholar]
- Rösch C.; Kohajda T.; Röder S.; Bergen M. V.; Schlink U. Relationship between sources and patterns of VOCs in indoor air. Atmos. Pollut. Res. 2014, 5, 129–137. 10.5094/APR.2014.016. [DOI] [Google Scholar]
- Mølgaard B.; Viitanen A.-K.; Kangas A.; Huhtiniemi M.; Larsen S.; Vanhala E.; Hussein T.; Boor B.; Hämeri K.; Koivisto A. Exposure to airborne particles and volatile organic compounds from polyurethane molding, spray painting, lacquering, and gluing in a workshop. Int. J. Environ. Res. Public Health 2015, 12, 3756–3773. 10.3390/ijerph120403756. [DOI] [PMC free article] [PubMed] [Google Scholar]
- Chin J. Y.; Godwin C.; Parker E.; Robins T.; Lewis T.; Harbin P.; Batterman S. Levels and sources of volatile organic compounds in homes of children with asthma. Indoor Air 2014, 24, 403–415. 10.1111/ina.12086. [DOI] [PMC free article] [PubMed] [Google Scholar]
- Zhang J.; Wei Y.; Fang Z. Ozone Pollution: A Major Health Hazard Worldwide. Front. Immunol. 2019, 10, 2518. 10.3389/fimmu.2019.02518. [DOI] [PMC free article] [PubMed] [Google Scholar]
- Santiago F.; Lima S.; Pinheiro T.; Silvestre R. T.; Otero U. B.; Tabalipa M. M.; Kosyakova N.; Ornellas M. H.; Liehr T.; Alves G. Benzene poisoning, clinical and blood abnormalities in two Brazilian female gas station attendants: two case reports. BMC Res. Notes 2017, 10, 52–52. 10.1186/s13104-016-2369-8. [DOI] [PMC free article] [PubMed] [Google Scholar]
- Zhang J.; Wang P.; Li J.; Mendola P.; Sherman S.; Ying Q. Estimating population exposure to ambient polycyclic aromatic hydrocarbon in the United States - Part II: Source apportionment and cancer risk assessment. Environ. Int. 2016, 97, 163–170. 10.1016/j.envint.2016.08.024. [DOI] [PMC free article] [PubMed] [Google Scholar]
- Cheng S.; Chang-Chien G.-P.; Huang Q.; Zhang Y.-B.; Yan P.; Zhang J.; Wang Y.; Zhang D.; Teng G. Global Research Trends in Health Effects of Volatile Organic Compounds during the Last 16 Years: A Bibliometric Analysis. Aerosol Air Qual. Res. 2019, 19, 1834–1843. 10.4209/aaqr.2019.06.0327. [DOI] [Google Scholar]
- Chemicals and industrial processes associated with cancer in humans: an updating of IARC monographs volumes 1 to 20. IARC Monogr. Eval. Carcinog. Risks Hum. Suppl. 1979, 1, 15. [PubMed] [Google Scholar]
- Talty J. T.General Methods of Control Available to the Industrial Hygiene Engineer. In Industrial Hygiene Engineerin ;Talty J. T. Eds.; William Andrew Publishing: Park Ridge, NJ, 1998; pp. 70–78. [Google Scholar]
- Fox R. W. Air cleaners: A review. J. Allergy Clin. Immunol. 1994, 94, 413–416. 10.1053/ai.1994.v94.a56025. [DOI] [PubMed] [Google Scholar]
- Zhu L.; Shen D.; Luo K. H. A critical review on VOCs adsorption by different porous materials: Species, mechanisms and modification methods. J. Hazard. Mater. 2020, 389, 122102. 10.1016/j.jhazmat.2020.122102. [DOI] [PubMed] [Google Scholar]
- Ma X.; Wu M.; Liu S.; Huang J.; Sun B.; Zhou Y.; Zhu Q.; Lu H. Concentration control of volatile organic compounds by ionic liquid absorption and desorption. Chin. J. Chem. Eng. 2019, 27, 2383–2389. 10.1016/j.cjche.2018.12.019. [DOI] [Google Scholar]
- Liu C. Y.; Tseng C. H.; Wang H. C.; Dai C. F.; Shih Y. H. The Study of an Ultraviolet Radiation Technique for Removal of the Indoor Air Volatile Organic Compounds and Bioaerosol. Int. J. Environ. Res. Public Health 2019, 16, 2557. 10.3390/ijerph16142557. [DOI] [PMC free article] [PubMed] [Google Scholar]
- Kong W.; Miao Q.; Qin P.; Baeyens J.; Tan T. Environmental and economic assessment of vegetable oil production using membrane separation and vapor recompression. Front. Chem. Sci. Eng. 2017, 11, 166–176. 10.1007/s11705-017-1616-4. [DOI] [Google Scholar]
- Huang Y.; Ho S.; Lu Y.; Niu R.; Xu L.; Cao J.; Lee S. Removal of Indoor Volatile Organic Compounds via Photocatalytic Oxidation: A Short Review and Prospect. Molecules 2016, 21, 56. 10.3390/molecules21010056. [DOI] [PMC free article] [PubMed] [Google Scholar]
- da Costa Filho B. M.; Silva G. V.; Boaventura R. A. R.; Dias M. M.; Lopes J. C. B.; Vilar V. J. P. Ozonation and ozone-enhanced photocatalysis for VOC removal from air streams: Process optimization, synergy and mechanism assessment. Sci. Total Environ. 2019, 687, 1357–1368. 10.1016/j.scitotenv.2019.05.365. [DOI] [PubMed] [Google Scholar]
- Liu R.; Song H.; Li B.; Li X.; Zhu T. Simultaneous removal of toluene and styrene by non-thermal plasma-catalysis: Effect of VOCs interaction and system configuration. Chemosphere 2021, 263, 127893. 10.1016/j.chemosphere.2020.127893. [DOI] [PubMed] [Google Scholar]
- Mokhtari M.; Hajizadeh Y.; Jafari N.; Ebrahimi A. A.; Abdolahnejad A. Improved biodegradation of hydrophobic volatile organic compounds from the air stream in a multilayer biofilter. MethodsX 2019, 6, 2052–2056. 10.1016/j.mex.2019.09.020. [DOI] [PMC free article] [PubMed] [Google Scholar]
- Tang G. L. Converting Volatile Organic Compounds to CO2 and Water. Am. J. Chem. Eng. 2016, 4, 62–67. [Google Scholar]
- Haider A. J.; Jameel Z. N.; Al-Hussaini I. H. M. Review on: Titanium Dioxide Applications. Energy Proc. 2019, 157, 17–29. 10.1016/j.egypro.2018.11.159. [DOI] [Google Scholar]
- Suwannahong K.; Sirivithayapakorn S.; Noophan P.; Sanongraj W. Improvement of TiO2/LDPE Composite Films for Photocatalytic Oxidation of Acetone. Adv. Mater. Res. 2014, 931–932. 10.4028/www.scientific.net/AMR.931-932.235. [DOI] [Google Scholar]
- Pavasupree S.; Dubas S. T.; Rangkupan R. Surface modification of polypropylene non-woven fibers with TiO2 nanoparticles via layer-by-layer self assembly method: Preparation and photocatalytic activity. J Environ. Sci. 2015, 37, 59–66. 10.1016/j.jes.2015.04.020. [DOI] [PubMed] [Google Scholar]
- Mishra G.; Mukhopadhyay M. TiO2 decorated functionalized halloysite nanotubes (TiO2@HNTs) and photocatalytic PVC membranes synthesis, characterization and its application in water treatment. Sci. Rep. 2019, 9, 4345. 10.1038/s41598-019-40775-4. [DOI] [PMC free article] [PubMed] [Google Scholar]
- Pahasup-anan T.; Suwannahong K.; Dechapanya W.; Rangkupan R. Fabrication and photocatalytic activity of TiO2 composite membranes via simultaneous electrospinning and electrospraying process. J. Environ. Sci. 2018, 72, 13–24. 10.1016/j.jes.2017.11.025. [DOI] [PubMed] [Google Scholar]
- Sekar A.; Varghese G. K.; Ravi Varma M. K. Analysis of benzene air quality standards, monitoring methods and concentrations in indoor and outdoor environment. Heliyon 2019, 5, e02918 10.1016/j.heliyon.2019.e02918. [DOI] [PMC free article] [PubMed] [Google Scholar]
- Montero-Montoya R.; López-Vargas R.; Arellano-Aguilar O. Volatile Organic Compounds in Air: Sources, Distribution, Exposure and Associated Illnesses in Children. Ann. Glob. Health. 2018, 84, 225–238. 10.29024/aogh.910. [DOI] [PMC free article] [PubMed] [Google Scholar]
- Salahuddin N.; Abdelwahab M.; Gaber M.; Elneanaey S. Synthesis and Design of Norfloxacin drug delivery system based on PLA/TiO2 nanocomposites: Antibacterial and antitumor activities. Mater. Sci. Eng. 2020, 108, 110337. 10.1016/j.msec.2019.110337. [DOI] [PubMed] [Google Scholar]
- Tharasawatpipat C.; Suwannahong K.; Kruenate J.; Kreetachat T. Removal of VOCs by photocatalytic oxidation using nano-TiO2/PLA biocomposite. J. Environ. Biol. 2015, 36, 617–621. [Google Scholar]
- Mahapatra D. M.; Chanakya H. N.; Ramachandra T. V.. Chapter 15- : algae derived single-cell proteins: economic cost analysis and future prospects. In:Protein byproducts: transformation from environmental burden into value-added products; Elsevier: San Diego, 2016; pp. 275–301. [Google Scholar]
- Mo J.; Zhang Y.; Xu Q.; Lamson J. J.; Zhao R. Photocatalytic Purification of Volatile Organic Compounds in Indoor Air: A Literature Review. Atmos. Environ. 2009, 43, 2229–2246. 10.1016/j.atmosenv.2009.01.034. [DOI] [Google Scholar]
- Jafari A. J.; Kalantari R. R.; Kermani M.; Firooz M. H. Photocatalytic degradation data of benzene and toluene by ZnO coated on glass plates under simulated sunlight. Data Brief 2018, 20, 490–495. 10.1016/j.dib.2018.08.040. [DOI] [PMC free article] [PubMed] [Google Scholar]
- Kaoien P.; Dechapanya W.; Khamwichit A.; Suwannahong K. Natural rubber modification as a pre-vulcanized latex impregnated with TiO2 for photo-catalytic degradation of gaseous benzene. Heliyon 2020, 6, e03912 10.1016/j.heliyon.2020.e03912. [DOI] [PMC free article] [PubMed] [Google Scholar]
- Li S.; Chen G.; Qiang S.; Yin Z.; Zhang Z.; Chen Y. Synthesis and evaluation of highly dispersible and efficient photocatalytic TiO2/poly lactic acid nanocomposite films via sol-gel and casting processes. Int. J. Food Microbiol. 2020, 331, 108763. 10.1016/j.ijfoodmicro.2020.108763. [DOI] [PubMed] [Google Scholar]
- Kreetachat T.; Kruenate J.; Suwannahong K. Preparation of TiO2/Bio-Composite Film by Sol-Gel Method in VOCs Photocatalytic Degradation Process. Appl. Mech. Mater. 2013, 390, 552–556. 10.4028/www.scientific.net/AMM.390.552. [DOI] [Google Scholar]
- Soodoo N.; Raghunanan L.; Bouzidi L.; Narine S. Phase behavior of monosulfones: Use of high polarity sulfonyl groups to improve the thermal properties of lipid-based materials for PCM applications. Sol. Energy Mater. Sol. Cells 2019, 201, 110115. 10.1016/j.solmat.2019.110115. [DOI] [Google Scholar]
- Asmatulu R.; Khan W. S.Chapter 13 - Characterization of electrospun nanofibers. In Synthesis and Applications of Electrospun Nanofibers ;Asmatulu R.; Khan W. S., Eds.; Elsevier: Amsterdam, 2019; pp. 257–281. [Google Scholar]
- Suwannahong K.; Liengcharernsit W.; Sanongraj W.; Kruenate J. Application of Nano-TiO2/LDPE composite film on photocatalytic oxidation degradation of dichloromethane. J. Environ. Biol. 2012, 33, 955–959. [PubMed] [Google Scholar]
- Salač J.; Šerá J.; Jurča M.; Verney V.; Marek A. A.; Koutný M. Photodegradation and Biodegradation of Poly (Lactic) Acid Containing Orotic Acid as a Nucleation Agent. Materials 2019, 12, 481. 10.3390/ma12030481. [DOI] [PMC free article] [PubMed] [Google Scholar]
- Boonmee C.; Kositanont C.; Leejarkpai T. Degradation of Poly (Lactic Acid) under Simulated Landfill Conditions. Environ. Nat. Resour. J. 2016, 14, 1–9. 10.14456/ennrj.2016.8. [DOI] [Google Scholar]
- Ola O.; Maroto-Valer M. M. Review of material design and reactor engineering on TiO2 photocatalysis for CO2 reduction. J. Photochem. Photobiol. C. 2015, 24, 16–42. 10.1016/j.jphotochemrev.2015.06.001. [DOI] [Google Scholar]
- Raza W.; Haque M. M.; Muneer M.; Bahnemann D. Synthesis of visible light driven TiO2 coated carbon nanospheres for degradation of dyes. Arab. J. Chem. 2019, 12, 3534–3545. 10.1016/j.arabjc.2015.09.002. [DOI] [Google Scholar]
- Assadi A. A.; Palau J.; Bouzaza A.; Wolbert D. Modeling of a continuous photocatalytic reactor for isovaleraldehyde oxidation: Effect of different operating parameters and chemical degradation pathway. Chem. Eng. Res. Des. 2013, 91, 1307–1316. 10.1016/j.cherd.2013.02.020. [DOI] [Google Scholar]
- Pellegrino F.; Pellutiè L.; Sordello F.; Minero C.; Ortel E.; Hodoroaba V.-D.; Maurino V. Influence of agglomeration and aggregation on the photocatalytic activity of TiO2 nanoparticles. Appl. Catal. B. 2017, 216, 80–87. 10.1016/j.apcatb.2017.05.046. [DOI] [Google Scholar]
- Boyjoo Y.; Sun H.; Liu J.; Pareek V. K.; Wang S. A Review on Photocatalysis for Air Treatment: From Catalyst Development to Reactor Design. Chem. Eng. J. 2017, 310, 537–559. 10.1016/j.cej.2016.06.090. [DOI] [Google Scholar]