Abstract
In recent decades, biodegradable polymeric nanoparticles have been used as a nanocarrier for the delivery of anticancer drugs. In the present study, we synthesize bovine serum albumin (BSA) nanospheres and evaluate their ability to incorporate a plant extract with anticancer activity. The plant extract used was the methanol fruit extract of Cucumis prophetarum, which is a medicinal herb. The fruit-extract-encapsulated BSA nanospheres (Cp-BSA nanospheres) were prepared using a desolvation method at various pH values of 5, 7, and 9. The nanosphere formulations were characterized using various techniques such as dynamic light scattering (DLS), ζ-potential, Fourier transform infrared spectroscopy (FTIR), and field-effect scanning electron microscopy (FESEM). The results show that the Cp-BSA nanospheres prepared at pH 7 were spherical with a uniform particle size, low polydispersity index (PDI), ζ-potential, and high entrapment efficiency (82.3%) and showed sustained release of fruit extract from Cp-BSA nanospheres in phosphate-buffered saline (PBS), pH 5. The anticancer activity was evaluated on A549, HepG2, MCF-7 cancer cell lines and HEK 293 normal cell lines. In vitro, antioxidant activity using the 2,2-diphenyl-1-picrylhydrazyl (DPPH) assay, intracellular reactive oxygen species (ROS) production, and mitochondrial membrane potential were estimated. An in vitro cellular uptake study was performed using fluorescein isothiocyanate (FITC) dye at a different time of incubation, and DNA fragmentation was observed in a dose-dependent manner. The gene expression level of Bax and the suppression level of Bcl-2 were observed upon the treatment of Cp-BSA nanospheres. Thus, the Cp-BSA nanospheres triggered ROS-dependent mitochondrial apoptosis in different human cancer cell lines when compared to the noncancerous cell lines and could be used as a potential candidate for anticancer agents.
Introduction
Nanotechnology has the ability to provide enormous chances for advancing medical technologies over a wide scene of disciplines. In recent years, pharmaceutical research has concentrated on the improvement of nanotechnology frameworks relevant in various fields of medication, particularly in the field of drug delivery.1 In the past few decades, polymeric nanoparticles have proved to be promising agents in biomedical fields such as controlled drug/gene delivery, tissue engineering, cancer treatment.2 Nanobiopolymers such as bovine serum albumin (BSA), poly(lactic-co-glycolic acid) (PLGA), chitosan, etc., are nowadays widely used in nanobiotechnology due to their favorable properties such as biocompatibility, easy preparation and design, a variety of structures, and interesting biomimetic character. One of the latest advancements in designing drug delivery systems has highlighted the protein-based nanodrug delivery platforms, which can be characterized as a substance of normally self-gathered protein subunits of a similar protein or a combination of proteins making up a complete framework. Among the huge variety of proteins used to prepare nanoparticles, albumin has been widely utilized due to its bioavailability, nontoxicity, water-solubility, and innocuous degradation metabolites.3 Most of the reported studies focused on the BSA nanoparticles since they have great acceptance in the industry and are used as carrier systems or just as protein models in numerous fundamental studies.4,5 Meanwhile, BSA with a long half-life can assist drugs in improving the blood drug concentration for a relatively long time.6
Cancer is considered a major cause of death in the world.7−9 According to GLOBOCAN data of 2020, the cancer burden has risen to 19.29 million cases and was responsible for around 9.95 million cancer deaths. There are different ways to treat cancer, including radiotherapy and chemotherapy, hormone and gene therapy, surgery, phototherapy, and immunotherapy.10−12 However, along with the effectiveness of these methods, there are many side effects also associated, including fatigue, loss of appetite, weight loss, pain, etc. However, cancer cells make them resistant to nearly all types of chemotherapeutic drugs, and about 80–90% of deaths in cancer patients are directly or indirectly attributed to drug resistance.13 The finding of new drug research and development has emerged as a powerful challenge in cancer therapy.
Herbal medicines, nowadays, are used as an alternative drug to treat a number of dangerous diseases, and they are thought to be successful and safe. Most of the bioactive compounds of herbal plants are hydrophobic in nature, and hence they are poorly absorbed. This nature of bioactive constituents leads to less bioavailability and more consistent clearance and therefore requires continuous administration and a high amount of dose, thus restricting the clinical use of herbal medicines.14Cucumis prophetarum(CP), commonly known as wild gourd or wild cucumber belonging to the Cucurbitaceae family, is one of the well-known plants known for its antioxidant, hepatoprotective, anticancer, and antidiabetic properties.15,16 The plants of this family contain cucurbitacins as one of the major compounds. The diversity of the cucurbitacin activities, especially differential cytotoxicity toward renal, brain, tumor, and melanoma cell lines, makes them potential species to explore further.17 The plant is native to the semiarid region of Asia and Africa and is associated with potent medicinal properties. In this study, we synthesized the BSA-nanosphere-encapsulated fruit extract of C. prophetarum at different pH values of 5, 7, and 9 and checked the in vitro anticancer activity of these nanospheres on different cancer cell lines.
Results and Discussion
Phytochemical Profile of C. prophetarum Fruit Extract
Plants are an excellent source of phytochemicals. In the qualitative phytochemical screening of C. prophetarum fruits extracted using 80% methanol as a solvent, we found the presence of some phytocompounds like terpenoids, flavonoids, phenols, steroids, and saponins, as shown in Table 1. The alkaloids are not detected in the qualitative analysis performed using the method given by Cyril et al.
Table 1. Qualitative Phytochemical Screening of the Fruit Extract of C. prophetarum.
| phytoconstituents | fruit extract |
|---|---|
| tannins | + |
| steroids | + |
| flavonoids | + |
| alkaloids | – |
| triterpenoids | + |
| phenol | + |
| saponins | + |
In quantitative phytochemical estimation, the total phenol content of the methanolic fruit extract of C. prophetarum was determined by the Folin–Ciocalteu method, which was reported as a gallic acid equivalent. The amount of phenolic compounds in methanolic fruit extract was found to be 101.32 mg gallic acid/g weight. The total flavonoid content in the methanolic fruit extract of C. prophetarum extract was calculated using quercetin as a standard and was found to be 212.87 mg quercetin/g weight. Previously, the phenolic content in the methanol extract of Cucumis melo fruits was found to be 80 mg gallic acid/g weight,18 and the flavonoid content in the leaf of the Cucumis africanus was found to be 228.9 mg quercetin/g weight.19 We found a high flavonoid concentration as compared to phenols. Previously, it has been reported in C. melo that methanol is the best solvent for recovering the highest extractable phytocompounds from whole fruit and seed extract.20 The absence of alkaloids and the presence of other phytocompounds have been previously reported in a similar pattern in the fruits of Cucumis sativus.21,22 Generally, flavonoids and phenol phytocompounds have been known as the major contributors to the antioxidant and anticancer activities of the plant extract as compared to the other secondary phytocompounds.23
Preparation and Characterization of the Methanolic Fruit Extract of C. prophetarum-Loaded BSA Nanospheres
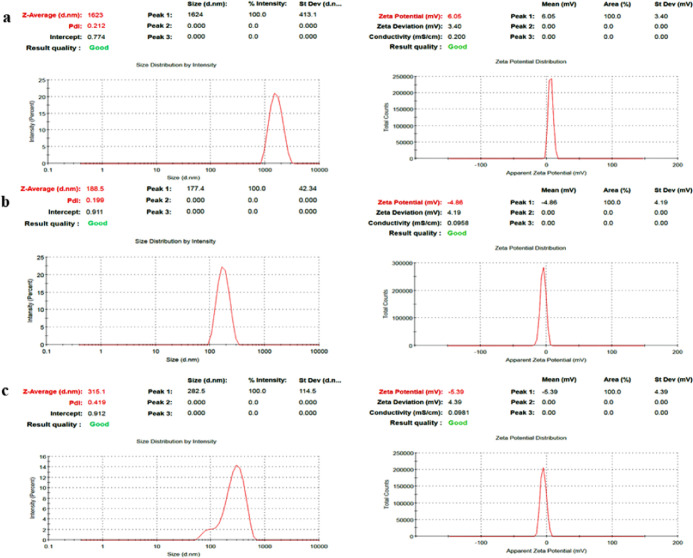
The methanolic fruit extract of C. prophetarum-loaded BSA nanospheres (Cp-BSA nanospheres) was successfully synthesized using the desolvation method. It has been reported in a previous study that the process of protein nanoparticle synthesis depends on the pH of the starting solution, the amount of desolvation agent added, and the amount of cross-linking agent used in the nanosphere formation (glutaraldehyde).24 The amount of ethanol and pH of the solution can directly alter the size of nanoparticles. By changing the amount of ethanol and the rate of its addition in the nanosphere formation process, one can modify the solubility of the protein used as a polymer and, therefore, alter the size of nanospheres.25 In our study, we used three different pH values (5, 7, and 9) for the synthesis of Cp-BSA nanospheres, and we analyzed how the pH strongly influences the BSA NP formation. The average particle size of blank BSA nanospheres (BBNPs) was found to be 126.9 nm with a ζ-potential of 1.13 mV, as shown in Figure 1a,b, respectively. The particle sizes of Cp-BSA nanospheres synthesized at pH 5, 7, and 9 were 1623, 188.5, and 315.1 nm with ζ-potentials of 6.05, −4.86, and −5.39 mV, respectively (Figure 2a–c). Previously, the size of BSA nanoparticles encapsulated with salicylic acid, synthesized at pH 7.4, was found to be 182.20 nm with a ζ-potential of −6.45 mV.25
Figure 1.
(a) Particle size and (b) ζ-potential of blank BSA nanospheres analyzed using dynamic light scattering (DLS).
Figure 2.
Particle size and ζ-potential of Cp-BSA nanospheres at (a) pH 5, (b) pH 7, and (c) pH 9 analyzed using the DLS technique.
The average particle size (nm) and ζ-potential (mV) of Cp-BSA nanospheres at different pH values is given in Table 2. ζ-Potential is based on the charge conductivity principle to ensure the stability of the formulation. The isoelectric point (IP) of BSA is 4.9, and as the pH solution moves away from the IP of BSA, the diameter of the particle decreases, suggesting that electrostatic interaction is one of the essential factors in controlling BSA NP formation.26 We found that the blank BSA nanospheres were successfully synthesized at pH 7 and Cp-BSA nanospheres were successfully synthesized at pH 7 and 9 compared to pH 5.
Table 2. Physical Parameters of BSA Nanospheres and Cp-BSA Nanospheres at Different pH Values.
| s.no. | BSA nanospheres | particle size (nm) | ζ-potential (mV) | entrapment efficiency (%) |
|---|---|---|---|---|
| 1 | blank BSA nanospheres pH 7 | 126.9 | 1.13 | |
| 2 | Cp-BSA nanospheres pH 5 | 1623 | 6.05 | 6.4 |
| 3 | Cp-BSA nanospheres pH 7 | 188.5 | –4.86 | 82.3 |
| 4 | Cp-BSA nanospheres pH 9 | 315.1 | –5.39 | 63.1 |
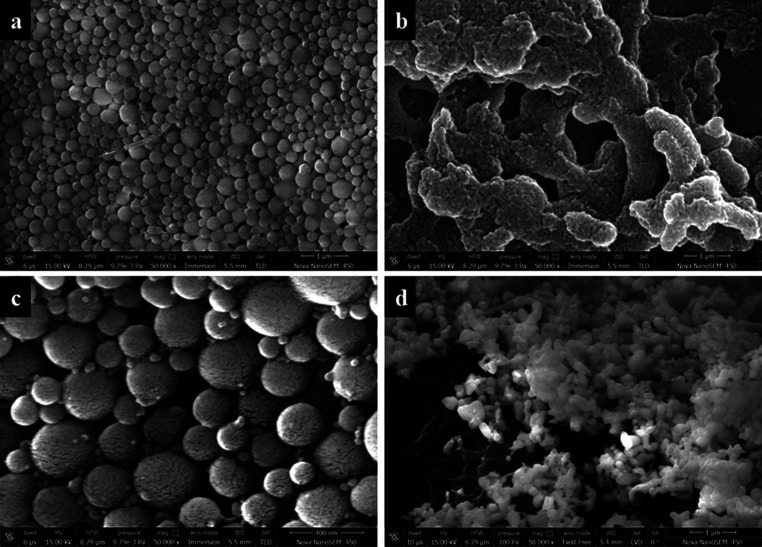
The morphology of the BSA nanospheres was examined using field-effect scanning electron microscopy (FESEM). As shown in Figure 3, blank BSA nanospheres are successfully synthesized at pH 7 (Figure 3a), and the Cp-BSA nanospheres were not able to synthesize at pH 5 and form aggregates (Figure 3b). Cp-BSA nanospheres formed at pH 7 (Figure 3c) showed a uniform spherical distribution compared to nanospheres formed at pH 9 (Figure 3d). The size of the Cp-BSA nanospheres synthesized at pH 7 was small with a high entrapment efficiency (EE) when compared to Cp-BSA nanospheres synthesized at pH 9 and 5. Therefore, we used Cp-BSA nanospheres synthesized at pH 7 for further studies. The low entrapment efficiency of Cp-BSA nanospheres at pH 5, given in Table 2, indicated that the charges present on the protein surface (close to IEP of BSA) hindered plant extract entrapment into nanoparticles.25
Figure 3.
SEM images of BSA nanospheres at magnification 50 000×, prepared using the desolvation method at different pH values: (a) blank BSA nanospheres at pH 7; (b) Cp-BSA nanospheres at pH 5; (c) Cp-BSA nanospheres at pH 7; and (d) Cp-BSA nanospheres at pH 9.
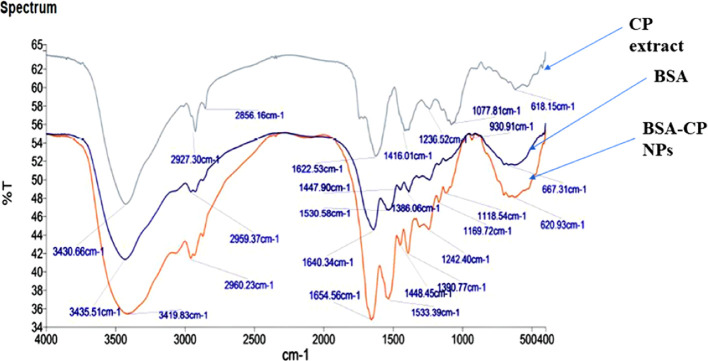
Figure 4 shows the Fourier transform infrared spectroscopy (FTIR) spectrum of crude C. prophetarum fruit extract, BSA, and Cp-BSA nanospheres. The spectrum shows the chemical, conformational, and shift in characteristic bands when nanospheres form. The IR peaks of BSA at 3435.51, 2959.37, 1640.34, 1530.58, 1386.06 cm–1 are characteristic peaks of the stretching vibration of −OH, −NH stretching of the NH+ free ion (amide B), C=O stretching of amide I, and C-N stretching and N–H bending of amide II-A and CH2 bending groups, respectively. FTIR results showed that all of these intense bands correspond to the secondary structure and conformation of the proteins. The FTIR spectrum of the methanolic fruit extract of C. prophetarum showed peaks at 2927.30, 1416.01, 1236.52, 1077.81, and 618.15 cm–1. The peak at 618.15 cm–1 was due to the C–H stretching of aliphatic and aromatic groups, the one at 1077.81 cm–1 was due to the C–OH stretching of aromatic compounds, the one at 1236.52 cm–1 signified the C-N stretching of amines, the one at 1416.01 cm–1 was due to the alkenyl or aromatic C=C stretch, and the one at 2927.03 showed the involvement of C–H stretching of the methylene group/aliphatic group and might also be a characteristic peak of triterpenoid saponins. The spectra of Cp-BSA nanospheres also exhibited these characteristics peaks of the protein and C. prophetarum fruit extract with a slight shift. Similar peaks for pure BSA were also previously reported by other authors.25,27 The changes in the absorption peaks’ amides confirm the formation of the Cp-BSA nanosphere.
Figure 4.
FTIR spectra of C. prophetarum (CP) extract (green), BSA (blue), and Cp-BSA nanospheres (orange), in order of their arrangement from the top to bottom.
Entrapment Efficiency
The entrapment efficiency (EE) of Cp-BSA nanospheres was calculated using the calibration curve of quercetin (Figure S1). Under controlled parameters (BSA 100 mg, pH 7, plant extract 20 mg, ethanol 8 ml, and glutaraldehyde 8%), the EE reached 82.3%. The EE of Cp-BSA nanospheres at different pH values is given in Table 2.
In Vitro Release
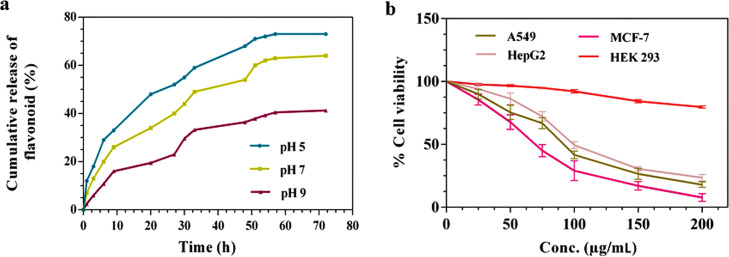
The in vitro release of the methanolic fruit extract of C. prophetarum from BSA nanospheres prepared at different pH values of 5, 7, and 9, under room temperature, was analyzed in terms of the spectroscopic estimation of flavonoid release in phosphate-buffered saline (PBS) that imitates the physiological environment at pH 7.4. As shown in Figure 5a, the release of flavonoids from BSA nanospheres was monitored for 72 h at specific time intervals. During the initial few hours, there is a controlled release of flavonoids observed. This is because during the initial hours, the plant extract is present on the surface of nanospheres, characterizing a burst effect.28 The plateau phase was seen after a few hours, corresponding to the sustained release of flavonoid from BSA nanospheres, making it an effective carrier. The total release rates of flavonoids from Cp-BSA NPs for over 72 h at 5, 7, and 9 were 76, 64, and 39%, respectively. The increased behavior of the release of flavonoids at pH 5 is suitable for the tumor region.29 There are various factors that can delay the release of plant extracts from the nanospheres. One factor can be the strong chemical interaction between the plant extract and the polymer, and another factor that can influence the plant extract release is the stiffening of the polymer network during the cross-linking of the nanoparticle process.30
Figure 5.
(a) In vitro release kinetics of flavonoid from Cp-BSA nanospheres in PBS of pH values of 5, 7, and 9 over 72 h. (b) Cytotoxic effect of Cp-BSA nanospheres on the viability of human cancer cell lines and normal cell lines investigated using the 3-(4,5-dimethylthiazol-2-yl)-2,5-diphenyltetrazolium bromide (MTT) assay. Data are means ± standard deviation (SD), n = 3.
Cytotoxicity Assay
The cytotoxic potential of Cp-BSA nanospheres against A549, HepG2, and MCF-7 cancer cell lines and HEK 293 normal cell lines was evaluated using the MTT assay. The Cp-BSA nanospheres showed significant dose-dependent toxicity on the different cell lines, and results are presented in Figure 5b. The IC50 concentrations (p < 0.5) calculated over 48 h for A549, HepG2, and MCF-7 cell lines were 87.6, 98.4, and 66.9 μg/mL, respectively. We also found that Cp-BSA nanospheres are not significantly toxic toward the normal HEK 293 cell line. As shown in Figure S2a, only quercetin treatment on cells was less effective than nanoformulations with IC50 values of 163.89, 193.61, and 104.41 μg/mL on A549, HepG2, and MCF-7 cell lines, respectively. Blank BSA NPs were not effective toward any of the three cancer cell lines and HEK 293 cell lines (Figure S2b). The morphologies and cell proliferations of A549, HepG2, and MCF-7 (Figures S3–S5, respectively) also changed in a dose-dependent manner. The results of the previous study showed that different kinds of plant-extract-encapsulated BSA nanoparticles may produce varying results. Previously, catechin- and epicatechin-encapsulated BSA NPs showed cytotoxic effects against A549 cell lines with a significant IC50 concentration.31
Assessment of Oxidative Stress
Antioxidant Activity Using the 2,2-Diphenyl-1-picrylhydrazyl (DPPH) Assay
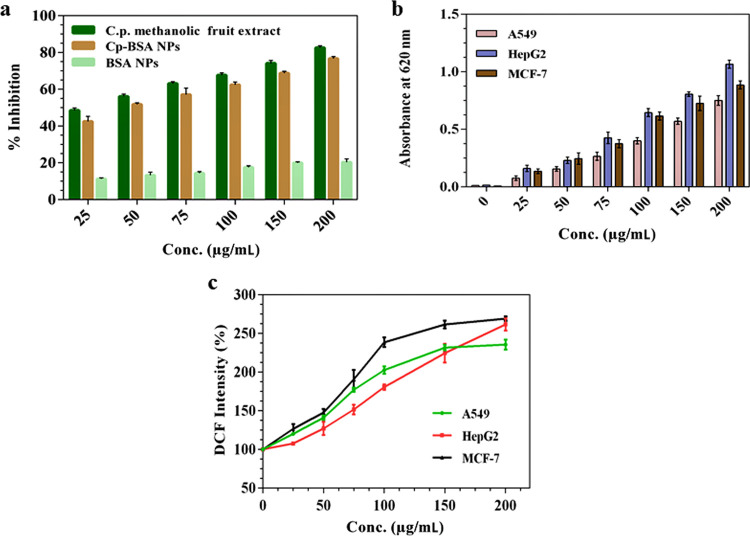
The in vitro antioxidant activities of the methanolic fruit extract of C. prophetarum, blank BSA nanospheres, and Cp-BSA nanospheres were analyzed using the DPPH assay. As shown in Figure 6a, the scavenging effect of the methanolic fruit extract and Cp-BSA nanospheres on DPPH was increased in a concentration-dependent manner, whereas blank BSA nanospheres showed very little or no scavenging activity. The IC50 values of the methanolic fruit extract of C. prophetarum and Cp-BSA nanospheres were found to be 48.6 μg/mL and 43.2 μg/mL, respectively. Ascorbic acid was used as a positive control. The lower inhibition of DPPH by Cp-BSA nanospheres as compared to its unencapsulated form (Cp methanolic fruit extract) might be because of the slow release of the loaded plant extract during the incubation period in the dark or encapsulation might have hindered the accessibility of the hydrogen radical and protected the Cp methanolic fruit extract from being oxidized. Previously, the antioxidant activities of catechin and epicatechin encapsulated in BSA NPs,31 essential oil eugenol, and carvacrol-grafted chitosan nanoparticles,32 and quercetin encapsulated in PLA NPs33 were assessed by the DPPH assay.
Figure 6.
Antioxidant potential determination using various in vitro assays. (a) Free radical scavenging activity of different concentrations of CP fruit extract, Cp-BSA nanospheres, and blank BSA nanospheres using the DPPH scavenging effect. Intracellular reactive oxygen species (ROS) (superoxide ion) generation by (b) reduction of nitro blue tetrazolium (NBT) and (c) monitored using the DCFHA dye after treatment with Cp-BSA nanospheres on different cancer cell lines. Data are means ± SD, n = 3.
NBT Assay
Cp-BSA nanospheres treated with A549, HepG2, and MCF-7 cell lines show a concentration-dependent increase in ROS. The NBT assay measures the production of formazan crystals mediated by superoxide production, which shows a linear increase in absorbance on increasing the dose of Cp-BSA nanospheres (Figure 6b). However, blank BSA nanospheres exhibited very less production of the superoxide ion, as shown in Figure S6.
NBT was another method to check the antioxidant potential of Cp-BSA nanospheres. The NBT reduction assay not only evaluates superoxide radicals but also reveals the mitochondria activity indirectly as it has been estimated that around 2% of the total mitochondrial O2 consumption is utilized to produce the superoxide ion by complexes I, II, and III.34 The result suggested that Cp-BSA nanospheres significantly inhibit the activity of mitochondria.
ROS Generation Assay Using 2′,7′-Dichlorofluorescein Diacetate (DCFH-DA)
The formation of ROS is one of the incidences that take place during apoptosis. Changes in the intracellular ROS formation after the exposure of different concentrations of Cp-BSA nanospheres on A549, HepG2, and MCF-7 cell lines were monitored using the DCFH-DA as a fluorescent probe. DCFH-DA can cross freely through the cellular membrane and enter the cell, where it is hydrolyzed by the esterase and transformed into DCFH. Intracellular ROS oxidizes nonfluorescent DCFH into DCF with a green fluorescent color. As shown in Figure 6c, compared to control and blank BSA nanospheres (Figure S7a), the increasing concentration of Cp-BSA nanospheres was responsible for the increase in the intracellular ROS level in the different cell lines, which in turn was responsible for the oxidative stress in the cells.
In the cancerous cells, the ROS plays an important role in the proapoptotic effect, and change in the ROS level can cause respiratory change interruption, which may lead to the p53-mediated intrinsic apoptosis pathway.35 In general, the alteration of the intracellular ROS level by anticancerous agents leads to an imbalance in the homeostatic redox state, induction of genotoxicity, and, finally, induction of programmed cell death.36 Change in the intracellular ROS level may be considered a promising anticancer mode of action for Cp-BSA nanospheres.
Cellular Uptake Studies
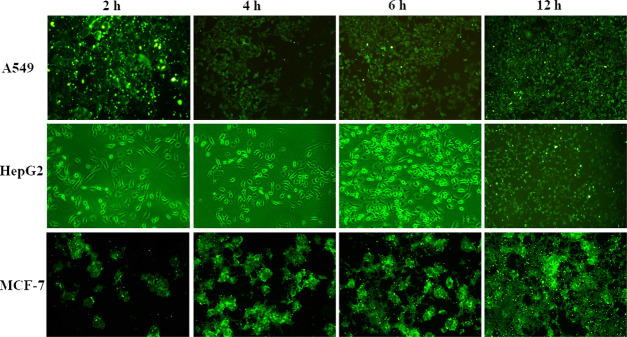
The cellular uptake study of Cp-BSA nanospheres by cancer cells was performed after the conjugation of Cp-BSA nanospheres to fluorescein isothiocyanate (FITC). The cellular uptake and localization of Cp-BSA nanospheres showed an increase in the green fluorescence intensity on increasing the incubation time up to 6 h, which indicated the time-dependent internalization of Cp-BSA nanospheres as shown in Figure 7.
Figure 7.
Intracellular uptake of FITC-Cp-BSA nanospheres by 549, HepG2, and MCF-7 cells at different time intervals using fluorescence microscopy.
FITC-Cp-BSA nanosphere uptake was consistent over time, as the size, number, and fluorescent intensity of nanosphere aggregates present in the cell expanded over the incubation time of 6 h. After the incubation time of 2 h, the Cp-BSA nanospheres were well-distributed in the cells and accumulated around the endothelial cell body and nucleus of the cells. However, large aggregates of nanospheres remained in the cells for up to 6 h, and there is no more uptake of Cp-BSA NP over the incubation time of 12 h. The uptake of NPs in a time-dependent manner follows the endocytic process for the localization of NPs into the cells.37
Mitochondrial Potential Assay
During apoptosis, the mitochondrial membrane potential decreases due to the disintegration of the electrochemical gradient.38 The effect of different concentrations (25–200 μg/mL) of Cp-BSA NPs on the mitochondrial membrane potential was evaluated in different cell lines A549, HepG2, and MCF-7, using the mitochondrial-specific JC-10 dye. Figure 8 shows that the ratio of the red/green fluorescence intensity decreases with the increasing concentration of Cp-BSA NPs.
Figure 8.
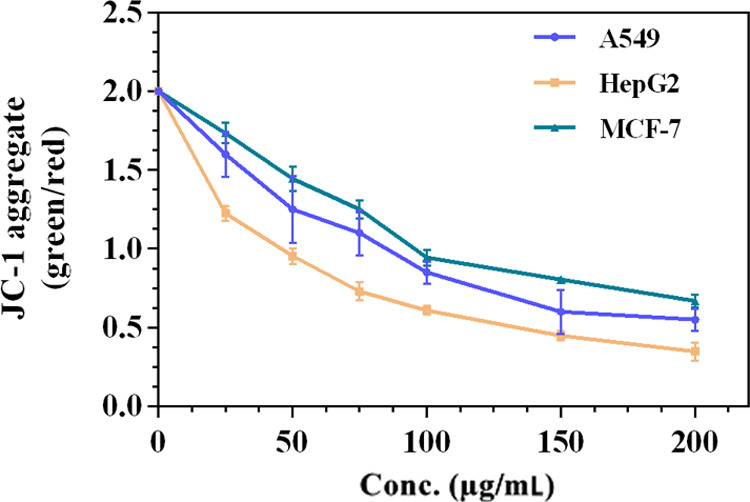
Loss of mitochondrial membrane potential after treatment of different concentrations of Cp-BSA nanospheres in different cancer cell lines detected by JC-1 staining and expressed as the ratio of green/red fluorescence intensity.
The MMP assay was performed to check the disintegration of the electrochemical gradient after exposure to Cp-BSA nanospheres. After the exposure of Cp-BSA nanospheres to cells, there is a loss of red (JC-10 aggregate) fluorescence and the appearance of cytoplasmic diffusion of green (JC-10 monomer) fluorescence due to the disruption of the mitochondrial membrane potential, which in turn led to the activation of apoptotic cascade and finally cell death.39 Also, there is no effect of increasing the concentration of blank BSA NPs (Figure S7b) on the depolarization of the mitochondrial membrane potential. Taken together, the study suggested that the methanol extract of C. prophetarum fruit was successfully delivered to the mitochondria with the mediation of BSA nanospheres, resulting in mitochondrial membrane depolarization.
DNA Fragmentation Assay
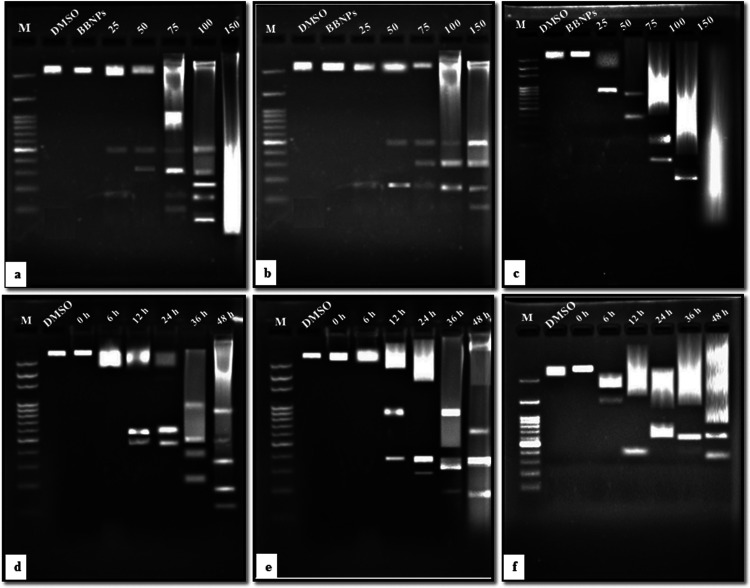
Genomic DNA fragmentation is one of the essential features of the cell when it goes to apoptosis, which results in the ladderlike arrangement of the genomic DNA on agarose gel.40,41 A549, HepG2, and MCF-7 cancer cell lines were treated with different doses (25–150 μg/mL) of Cp-BSA nanospheres for 48 h followed by extraction of the DNA from treated cells. As shown in Figure 9, fragmentation of the DNA was absent in 10% dimethyl sulfoxide (DMSO), and blank BSA-nanosphere-treated cells, whereas the DNA laddering pattern was seen in all three cell lines after the concentration-dependent treatment of Cp-BSA nanospheres.
Figure 9.
Effect of different concentrations of Cp-BSA nanospheres on intranucleosomal DNA fragmentation of (a) A549, (b) HepG2, and (c) MCF-7 cell lines, run on separate gels (0.8%), and M denotes the marker or DNA ladder (100 bp). The effect of blank BSA nanospheres (BBNPs) and 10% DMSO was also checked. Time-dependent effect of the IC50 concentration of Cp-BSA nanospheres on (d) A549, (e) HepG2, and (f) MCF-7 cell lines.
The DNA damage might be due to the generation of free radical ROS in cells. When DNA is exposed to ROS, this leads to the formation of the compound called 8-hydroxy-20-deoxyguanosine (8-OHdG), which changes the guanosine base and increases the chances of conversion of G to T mutation during DNA replication.42 8-OHdG is known as a marker for DNA damage and oxidative stress.43 We also treated the cells with IC50 concentration of the respective cell lines for different time intervals to see the time-dependent fragmentation of DNA after treatment with Cp-BSA nanospheres. Hence, we can conclude that Cp-BSA nanospheres cause concentration- and time-dependent damage to DNA.
Quantitative Analysis of Apoptotic Gene Expression Using Quantitative Real-Time Polymerase Chain Reaction (qRT-PCR)
We performed the quantitative real-time PCR to check the apoptotic effect of Cp-BSA nanospheres by examining the proapoptotic and antiapoptotic gene expressions. We treated the IC50 concentrations of the Cp-BSA nanospheres on A549, HepG2, and MCF-7 cell lines and analyzed the expression levels of caspase-3, caspase-9, bax, bcl-2, and p53 genes. Change in the expression folds of caspase-3, caspase-9, p53, bcl-2, and bax was shown using box and whisker plots. As shown in Figure 10a–c, the expression levels of caspase-3, caspase-9, and bax were significantly upregulated in A549 and HepG2 cell lines, and the expression level of bcl-2 was down-regulated in all three cell lines. In A549 and MCF-7 cells, the expression of p53 is significantly increased, as compared to HepG2.
Figure 10.
Box and whisker plots of caspase-3, caspase-9, p53, bcl-2, and bax gene expression fold change after treatment with IC50 concentration of Cp-BSA nanospheres on (a) A549, (b) HepG2, and (c) MCF-7 cancer cell lines. The bottom and top of the box are the first and third quartiles, respectively, and the band inside the box is always the second quartile (the median). The ends of the whiskers represent the 5th percentile and the 95th percentile.
Caspase-3, caspase-9, bax, and p53 are proapoptotic family proteins, and bcl-2 is an antiapoptotic family protein. The ratio of bax/bcl-2 was upregulated in all three cancer cell lines. Bcl-2 is an antiapoptotic family protein that plays an important role in the apoptotic pathway. Different studies prove that the increased ratio of proapoptotic to antiapoptotic gene levels successfully triggers the apoptosis pathway.44,45 Both bax and bcl-2 have been reported to be transcriptional targets of the p53 tumor suppressor gene, which in turn induces apoptosis in response to the number of cellular stresses involving nucleotide deprivation, DNA damage, and hypoxia.46 Hence, in our study, we proposed a mechanism for the action of Cp-BSA nanospheres on different cancer cell lines (Figure 11). This pathway involves the generation of ROS and activation of different mitochondrial factors, which leads to DNA damage and apoptosis of different cancer cell lines and, therefore, Cp-BSA-nanosphere-mediated ROS-dependent mitochondrial damage of cancer cells.
Figure 11.
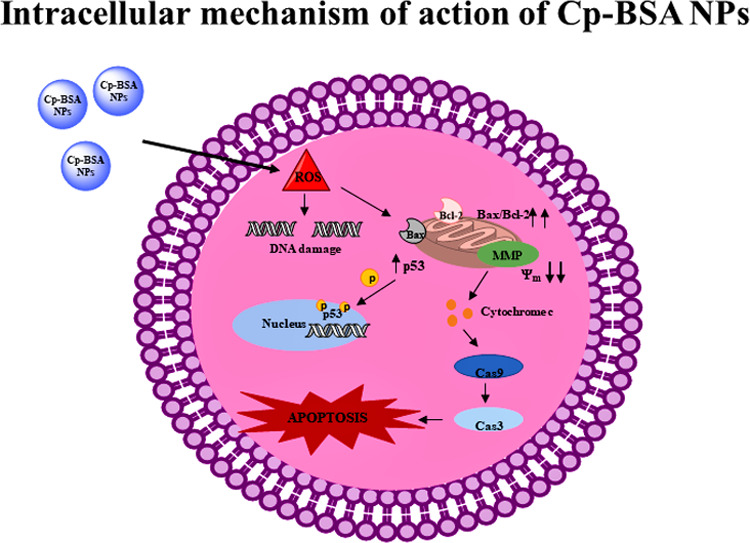
Hypothetical mechanism of action of Cp-BSA nanospheres against human cancer cell lines. “Photograph courtesy of “Hemlata”. Copyright 2020”.
Conclusions
In conclusion, the present research findings in human lung (A549), liver (HepG2), and breast cancer cells provide evidence of the molecular pathways involved in cell death and apoptosis induced by C. prophetarum fruit extract-encapsulated BSA nanoparticles. In the qualitative and quantitative phytochemical analyses, we found that flavonoids and, to some extent, phenols are mainly present in the methanolic fruit extract of C. prophetarum. Here, we have observed that activation of the intrinsic pathway of apoptosis in the human cancer cells is related to an increase in the cellular stress induced by reactive oxygen species and disruption in the mitochondrial membrane stability by alteration in the expression of proapoptotic and antiapoptotic protein levels. The increase in ROS in the cell is responsible for the loss of mitochondrial membrane potential that would act as a channel to release the cytochrome c (Cyt c) from mitochondria into the cytosol. Cyt c in turn activates caspase-9 and caspase-3, and ultimately, the activated cleaved caspases promote cell death and apoptosis via DNA damage and nuclear condensation. Thus, we can conclude that phytocompounds, mainly flavonoids present in the Cp-BSA nanospheres, have the potential to activate the apoptotic mode of cancer cell death. Thus, our current research investigated the mechanism of Cp-BSA-nanosphere-induced intrinsic apoptosis in human cancer cells. Therefore, Cp-BSA nanospheres proved safe to use for different biomedical applications.
Materials and Methods
Materials
Bovine serum albumin (BSA), nitro blue tetrazolium (NBT), 3-(4,5-dimethylthiazol-2-yl)-2,5-diphenyltetrazolium bromide (MTT), 2,2-diphenyl-1-picrylhydrazyl (DPPH), dimethyl sulfoxide (DMSO), and DNA ladder were purchased from HiMedia. 2′,7′-Dichlorofluorescein diacetate (DCFH-DA), TRIzol reagent, and the mitochondrial membrane potential kit were purchased from Sigma. The cDNA synthesis kit was purchased from verso, the PCR master mix was purchased from Genei, and primers were purchased from Eurofins. Human cancer cell lines A549, HepG2, and MCF-7 were procured from NCCS Pune. All other chemicals used were of analytical grade procured from reputed firms.
Collection of Plant Material and Taxonomic Identification
The fresh fruit samples of C. prophetarum were collected from the campus of the Central University of Rajasthan, Kishangarh, Ajmer. Authentication of the plant sample was done in the Department of Botany, Rajasthan University, where a voucher specimen was deposited (Voucher no. RUBL No. -211677).
Preparation of Extracts of Fruit Samples
The fruits were washed thoroughly two times with distilled water, cut into small pieces, and allowed to dry in a shed at room temperature. The shed-dried fruits were crushed using an electric blender to make a fine powder. A total of 25 gm of fruits was extracted with 250 mL of 80% methanol using the maceration method for 24 h. The mixture was centrifuged at 5500g to remove the solid plant material, and the resulting solution was filtered using Whatman filter paper No. 1. The resulting extract was collected using a rotary evaporator at 60 °C to obtain the powder extract and kept at 4 °C for future use.
Phytochemical Analysis
Qualitative Phytochemical Analysis
The methanolic fruit extract of C. prophetarum was subjected to different biochemical tests for screening of active secondary metabolites such as polyphenol, tannins, flavonoids, triterpenoids, steroids, saponins, and alkaloids by following standard phytochemical procedures.47
Quantitative Analysis
Total Phenolic Content
The total content of phenolic compounds in the methanol fruit extract of C. prophetarum was estimated following the method described by Sun, Powers.48 Briefly, 10 μL of different concentrations (20–500 μg/mL) of gallic acid and methanolic fruit extract was mixed with the Folin–Ciocalteu reagent in the ratio of 1:5 and incubated for 3 min. After that, 40 μL of sodium carbonate (7.5%, w/v) was added to each well and incubated in a water bath at 45 °C for 15 min. The absorbance was taken at 765 nm using a BMG Labtech spectrophotometer. The standard calibration curve of gallic acid was prepared, and the total amount of phenolic content was calculated and represented as milligram of gallic acid equivalent (mg of GA/g of weight).
Total Flavonoid Content
The total content of flavonoid compounds in methanolic fruit extracts of C. prophetarum was estimated using the ammonium chloride colorimetric method.49 Quercetin (Q) was used to make the standard calibration curve. The stock solution of standard (1 mg/mL) was prepared in 80% ethanol, and different dilutions (20–500 μg/mL) were prepared. Next, 0.5 mL of different dilutions of standard or fruit extract was separately mixed with 1.5 mL of 95% ethanol, 0.1 mL of 10% ammonium chloride solution, 0.1 mL of 1 M potassium acetate, and 2.8 mL of distilled water. The reaction mixtures were allowed to incubate for 60 min at room temperature. After incubation, the absorbance was taken at 415 nm wavelength using a BMG Labtech spectrophotometer. In the fruit extract, the concentration of the total flavonoid content was calculated using the standard calibration plot of quercetin and expressed as milligram of quercetin equivalent (mg of Q/g of weight).
Preparation of BSA Nanospheres and Cp-BSA Nanospheres
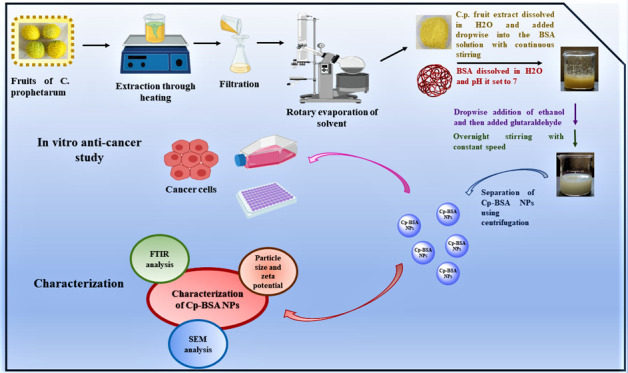
Blank BSA nanospheres and Cp-BSA nanospheres were prepared using a desolvation technique.50 Briefly, 100 mg of BSA was dissolved in 2 mL of Milli-Q water and was adjusted to pH 7 and kept for continuous stirring at 500 rpm at room temperature. The dissolved BSA was converted into BSA nanospheres by the dropwise addition of 8 mL of ethanol at a speed of 1 mL/min, forming a turbid suspension. After 5–10 min, 100 μL of 16% glutaraldehyde was added to cross-link the BSA nanospheres, and the cross-linking process was performed for 24 h at room temperature to ensure the cross-linking of all amino acid moieties. The BSA nanospheres were purified by three cycles of centrifugation at 22 000g for 20 min, and the obtained pellet was dried under a nitrogen environment to get nanosized powder. For preparing Cp-BSA nanospheres, 100 mg of BSA was added to 2 mL of Milli-Q water stirred under the constant speed of 28 g at room temperature. The pH was then adjusted to 5.0, 7.0, and 9.0 with 0.1 M HCl and NaOH solution. Subsequently, 20 mg of methanol extract of C. prophetarum fruit was dissolved in 2 mL of ethanol, which was added dropwise at the speed of 1 mL/min, to the various pH values of aqueous BSA solution with constant stirring at 28 g at room temperature. After this, 8 mL or more ethanol was added until the reaction mixture became turbid. Again, the pH was checked and adjusted to 5.0, 7.0, and 9.0. Following the desolvation process, 100 μL of 16% glutaraldehyde was added to induce particle cross-linking to increase the stability of the particles. The cross-linking process was performed under stirring of the colloidal suspension over a period of time of 24 h at room temperature to ensure the cross-linking of all amino acid moieties. The methanolic fruit extract of C. prophetarum-encapsulated BSA nanospheres (Cp-BSA nanospheres) formed was separated using two cycles of centrifugation at 22 000g for 20 min to remove residues of the fruit extract and free BSA molecules. The supernatant was removed for further analysis (Sup), and the pellet was dried under a nitrogen environment.
Characterization of Nanospheres
Dynamic Light Scattering (DLS) and ζ-Potential Measurements
Physical characterization of Cp-BSA nanospheres and BSA nanospheres was performed by dynamic light scattering (DLS) (Malvern nanoZs, Malvern instruments) and using a zetasizer (Malvern, U.K.), which measures the size and ζ-potential or surface charge on nanospheres. The size measurements were carried out at 25 °C by light scattering at 90°. For analysis, nanospheres were dissolved in Milli-Q water and kept for sonication in an ultrasonic bath for 10 min to obtain a well-dispersed suspension. The ζ-potential data was measured through an electrophoretic cell with an electric field using a zetasizer.
Field-Effect Scanning Electron Microscopy (FESEM) Analysis
The surface morphologies of the BSA nanospheres and Cp-BSA nanospheres prepared at pH 5. 7 and 9 were analyzed by field-effect scanning electron microscopy (EVO 18, ZEISS) at the magnification of 10 000×. For the analysis, the samples were fixed with a double-sided carbon tape on the tubular aluminum stub, and the stub-supported samples were coated with gold. Finally, the prepared gold-coated samples were placed under a microscope to observe the morphology of the samples.
Fourier Transform Infrared Spectroscopy (FTIR) Measurements
The molecular structure and conformational changes in BSA nanospheres due to interaction with the C. prophetarum fruit extract were analyzed by the FTIR spectrophotometer (PerkinElmer Spectrum Version 10.4.00, M/s PerkinElmer Co., Waltham, Massachusetts) using the KBr pellet method at a scanning range of 4000–400 cm–1 having a resolution of 1 cm–1 at room temperature.
Entrapment Efficiency
The entrapment efficiency (EE) of Cp-BSA nanospheres was indirectly determined by evaluating the amount of total flavonoid content using a UV–vis spectrophotometer. For that, the supernatant (Sup) from the centrifugation step of the preparation of Cp-BSA nanospheres was decanted, and flavonoid estimation was done using the calibration curve of quercetin. The EE of the Cp-BSA nanospheres was calculated using
In Vitro Release Studies
In vitro release of the flavonoid extract from BSA nanospheres synthesized at pH 7 was checked in phosphate-buffered saline (PBS) at three different values pH 5, 7, and 9 using the reported methods51 with slight modifications. Briefly, Cp-BSA NPs (5 mg/mL) were suspended in 5 mL of PBS and allowed to stir. At different time intervals, the mixture was centrifuged at 22 000g for 5 min; then, 200 μL of the supernatant was taken for analysis and was replaced with an equal volume of fresh PBS to maintain the total volume. The amount of flavonoid released from Cp-BSA nanospheres at a specific time interval was determined using a UV–vis spectrophotometer. Three different reactions were conducted to check the in vitro release in three different pHs of PBS. The total release percentage of flavonoids from Cp-BSA nanospheres was calculated using the following equation
where At is the total amount of flavonoid at each testing time and A0 is the initial weight of flavonoid loaded in the nanospheres.
Culturing of Cell Lines
To assess the cytotoxicity assay of BSA nanospheres and Cp-BSA nanospheres, we used three types of human cancer cell lines and one normal cell line. The cell lines used were lung cancer cell lines (A549), breast cancer cell lines (MCF-7), hepatic cancer cell lines (HepG2), and human embryonic kidney cell lines (HEK 293). The cells were grown in Dulbecco’s modified Eagle’s medium (DMEM) supplemented with 10% fetal bovine serum (FBS) and 1% penicillin–streptomycin solution and kept in a CO2 incubator with 5% CO2. The viable cells were counted by a trypan blue assay using a hemocytometer and then seeded at a density of 1 × 10⁴ in a 96-well plate for 24 h at 37 °C in a CO2 incubator.
MTT Assay
Different concentrations (25, 50, 75, 100, 150, and 200 μg/mL) of blank BSA nanospheres and Cp-BSA nanospheres were treated on the A549, HepG2, and MCF-7 cell lines. The same concentration of Cp-BSA nanospheres was also treated on the HEK 293 normal cell lines. The samples of nanospheres were prepared in DMSO. The cells were incubated for 48 h in a CO2 incubator followed by treatment. The morphology of cells was observed after 48 h. A total of 20 μL of MTT reagent (5 mg/mL) was added in each well and incubated for 4 h at 37 °C. After incubation, the purple formazan was formed in the cells, which was solubilized by the addition of 100 μL of DMSO, and the absorbance was recorded at 570 nm by an ELISA reader. Cells treated with quercetin were used as a positive control. The viability of cells was calculated using the following formula:
Assessment of Oxidative Stress
Antioxidant Activity Using 1,1-Diphenyl-2-picrylhydrazyl (DPPH) Assay
The in vitro antioxidant activity was performed using a DPPH radical scavenging assay, followed by the previously reported method.52 Briefly, the stock solution of 0.1 mM DPPH was prepared in 80% methanol. Different concentrations (25, 50, 75, 100, 150, and 200 μg/mL) of plant extracts, blank BSA nanospheres, and Cp-BSA nanospheres were mixed with 100 μL of stock solution of DPPH and incubated for 30 min in the dark at room temperature. After incubation, the absorbance of reaction mixtures was taken using a BMG Labtech spectrophotometer at a wavelength of 517 nm against a blank (80% ethanol). Ascorbic acid was used for this assay as a positive control. The percentage of radical scavenging activity was calculated using the following formula
Nitro Blue Tetrazolium (NBT) Assay
The reduction of nitro blue tetrazolium (NBT) is responsible for the formation of the superoxide anion in different cell lines A549, HepG2, and MCF-7, which is detected using the method of Wang.53 Briefly, 1 × 10⁴ to 105 cells/well were seeded in the 96-well plates and the cells were allowed to grow at 37 °C for 24 h. Cells were treated with different concentrations of Cp-BSA nanospheres for 48 h. Following 48 h treatment, the media was removed from the plate, and cells were washed twice with PBS. Then, 100 μL of 0.1% NBT was added to each well, and the plate was incubated for 1 h at 37 °C. The cells were fixed with absolute methanol, washed thrice with 70% methanol, and allowed to dry for several minutes. The formed formazan within the cells was dissolved using 120 μL of 2 M KOH followed by the addition of 120 μL of DMSO, and absorbance was taken at 620 nm using KOH/DMSO as a blank.
Intracellular ROS Measurement Using DCFH-DA
The ROS production levels of A549, HepG2, and MCF-7 cancer cell lines were determined using DCFH-DA as a fluorescent probe, which measured the intracellular formation of hydrogen peroxide (H2O2).54 Briefly, 1 × 10⁴ to 105 cells/well were seeded in the 96-well plates and the cells were allowed to grow at 37 °C for 24 h. Cells were then treated with different concentrations (25–200 μL) of BSA NPs and Cp-BSA NPs for 48 h. Following exposure to NPs, the cells were washed with PBS and then incubated with 100 μL of working solution of 20 μM DCFH-DA for 30–45 min at 37 °C. The fluorescence spectra were taken at 485ex/530em nm using an Agilent Cary Eclipse fluorescence spectrophotometer.
FITC Conjugated Nanospheres
The Cp-BSA nanospheres were first labeled with FITC, as mentioned by Jochums, Friehs.55 Briefly, 1 mL of Cp-BSA nanospheres (1 mg/mL) was added into the 1 ml PBS and stirred for 15–20 min at room temperature. After that, 500 μL of FITC solution (5 mg/mL in acetone or methanol) was added into the Cp-BSA nanosphere solution, and the reaction was allowed to continue at 112 g for 12 h. After incubation, the mixture was centrifuged at 7000g and washed with dH2O until the supernatant became colorless. To obtain the FITC-labeled Cp-BSA nanospheres, the pellet was resuspended in PBS to a final concentration of 1 mg/mL and stored in the dark at 4 °C until further use.
Cellular Uptake Assay Using FITC-Labeled Nanospheres
For the cellular uptake assay, cells were seeded in a 6-well plate at a density of 1 × 10⁵ in a complete growth medium for 24 h at 37 °C in a CO2 incubator. After incubation, the cells were treated with Cp-BSA nanospheres-FITC for 2, 4, 6, and 12 h. Finally, the cells were washed thrice with PBS at the respective time intervals to remove the uninternalized nanospheres and observed by OLYMPUS CKX53 fluorescence microscopy.
Mitochondrial Membrane Potential Assay
The MMP was measured using JC-10 dye (Sigma Aldrich, MAK159) following the manufacturer’s instructions. The ratio of the red/green fluorescence intensity was measured using an Agilent Cary Eclipse fluorescence spectrophotometer to determine the MMP level in blank BSA nanospheres and Cp-BSA-nanosphere-treated A549, HepG2, and MCF-7 cell lines.
DNA Fragmentation Assay
The chromosomal DNA was isolated from the A549, HepG2, and MCF-7 cancer cell lines after treatment with Cp-BSA nanospheres using the protocol given by Banerjee56 with slight modifications. Briefly, the cells were treated with different concentrations of Cp-BSA nanospheres (25–150 μg/mL) for 48 h. After the treatment, the cells were harvested by trypsinization and centrifuged at 252g for 5 min. The pellet was resuspended in 500 μL of TE buffer (20 mM tris-HCL pH 8, 10 mM ethylenediaminetetraacetic acid (EDTA), and 0.5% Triton X-100) and incubated at 65 °C for 5 min. Then, 700 μL of the chloroform–isopropanol mixture was added after cooling down the mixture at room temperature. The mixture was centrifuged at 16 128g for 5 min at 4 °C, and the supernatant was taken in a fresh Eppendorf with 1 mL of ice-cold 70% ethanol and kept at −80 °C for 3 h. Next, the samples were thawed gently and centrifuged at 14 000g for 45 min at 4 °C. The ethanol was then thoroughly removed, and the pellet was left to dry at 37 °C and finally resuspended in 200 μL of molecular-grade water or TE buffer. The samples were treated with 0.1 mg/mL RNAse A at 37 °C for 30 min to remove RNA contamination and then incubated with 0.25 mg/mL proteinase K for 2 h at 37 °C to remove protein contamination. Finally, samples were mixed with a loading buffer and run on a 0.8% agarose gel.
Quantitative Real-Time PCR (qRT-PCR)
Expressions of apoptosis-related genes caspase-3, caspase-9, p53, bax, and bcl-2 were checked using reverse transcriptase-PCR (RT-PCR). Briefly, A549, HepG2, and MCF-7 cell lines were seeded in a 6-well plate and allowed to grow at 37 °C for 24 h. Cells were then treated with IC50 concentration of Cp-BSA nanospheres for 48 h. After treatment, total RNA was isolated from the A549, HepG2, and MCF-7 cell lines using the TRIzol reagent method.57 RNA was washed twice with 70% ethanol, dissolved in 40 μL of molecular-grade water, and stored at −80 °C until further use. The purity and quantity of RNA were checked using a nanodrop at 260 nm. Complementary DNA (cDNA) was synthesized by a reverse transcription system using cDNA synthesis kits (Thermo fisher). The cDNA was used as a template, and RT-PCR was done in a StepOne Plus thermocycler (applied Biosystem), using Eva green PCR Master Mix. The forward and reverse primers used to check the mRNA expressions of apoptotic genes in A549, HepG2, and MCF-7 are given in Table 3.
Table 3. Primer Sequences.
| s.no. | primer | sequence |
|---|---|---|
| 1 | GADPH_ F | 5′-AAT GGG CAG CCG TTA GGA AA-3′ |
| 2 | GADPH_R | 5′-GCG CCC AAT ACG ACC AAA TC-3′ |
| 3 | Bcl 2_F | 5′-TGCACCTGACGCCCTTCAC-3′ |
| 4 | Bcl 2_R | 5′-AGAGGACCAGGAGAATCAA-3′ |
| 5 | Bax_F | 5′-GGC CCT TTT GCT TCA GGG TT-3′ |
| 6 | Bax_R | 5′-GGA AAA AGA CCT CTC GGG GG-3′ |
| 7 | P53_F | 5′-GGCCCACTTCACCGTACTAA-3′ |
| 8 | P53_R | 5′-GTGGTTTCAAGGCGAGATGT-3′ |
| 9 | Caspase 3_F | 5′-CAT ACT CCA CAG CAC CTG GTT A-3′ |
| 10 | Caspase 3_R | 5′-ACT CAA ATT CTG TTG CCA CCT T-3′ |
| 11 | Caspase 9_F | 5′-ACT TTC CCA GGT TTT GTT TCC T-3′ |
| 12 | Caspase 9_R | 5′-GAA ATT AAA GCA ACC AGG CAT C-3′ |
The expression level of apoptotic genes was normalized to the level of expression of the housekeeping GAPDH gene. The expression level of genes was calculated using the cyclic threshold method (Ct method). The mean of the Ct values from the triplicate was used to calculate the expression level of the target gene using the 2–ΔΔCt formula
Statistical Analysis
The analysis of each sample was performed in triplicate. The results were denoted as a mean ± standard deviation (SD) of triplicates and analyzed by one-way analysis of variance (ANOVA). Statistical significance was considered when p < 0.05. * signifies p < 0.5, ** signifies p < 0.01, and *** signifies p < 0.001. The box and whisker plot for gene expression data was plotted using GraphPad Prism.
Acknowledgments
The authors would like to acknowledge the financial support received from the Department of Science and Technology (SERB/EEQ/2016/000696) and the University Grants Commission (UGC) for the award of Junior Research Fellowship. The authors would also like to acknowledge the Department of Pharmacy and Chemistry, Central University of Rajasthan, Ajmer, India, for fluorescence microscopy and fluorescence spectroscopy, and the Material Research Centre, Malviya National Institute of Technology, Jaipur, for DLS, FTIR, and FESEM analyses.
Supporting Information Available
The Supporting Information is available free of charge at https://pubs.acs.org/doi/10.1021/acsomega.1c00755.
Calibration curve of quercetin; cell viability assay using quercetin and blank BSA nanospheres; morphological changes of A549, HepG2, and MCF-7 after the treatment of Cp-BSA nanospheres; reduction of NBT, intracellular ROS generation, and loss of mitochondrial membrane potential after the treatment of blank BSA nanospheres (PDF)
Author Contributions
Hemlata carried out all of the experiments, analyzed the data, interpreted the results, and drafted the manuscript. S.G. contributed to editing the manuscript. Dr. K.K.T. formulated and supervised the work. All authors read and approved the final manuscript.
The authors declare no competing financial interest.
Supplementary Material
References
- Calzoni E.; Cesaretti A.; Polchi A.; Di Michele A.; Tancini B.; Emiliani C. Biocompatible polymer nanoparticles for drug delivery applications in cancer and neurodegenerative disorder therapies. J. Funct. Biomater. 2019, 10, 4 10.3390/jfb10010004. [DOI] [PMC free article] [PubMed] [Google Scholar]
- Nitta S. K.; Numata K. Biopolymer-based nanoparticles for drug/gene delivery and tissue engineering. Int. J. Mol. Sci. 2013, 14, 1629–1654. 10.3390/ijms14011629. [DOI] [PMC free article] [PubMed] [Google Scholar]
- Tarhini M.; Benlyamani I.; Hamdani S.; Agusti G.; Fessi H.; Greige-Gerges H.; Bentaher A.; Elaissari A. Protein-based nanoparticle preparation via nanoprecipitation method. Materials 2018, 11, 394 10.3390/ma11030394. [DOI] [PMC free article] [PubMed] [Google Scholar]
- Varca G. H.; Queiroz R. G.; Lugão A. B. Irradiation as an alternative route for protein crosslinking: cosolvent free BSA nanoparticles. Radiat. Phys. Chem. 2016, 124, 111–115. 10.1016/j.radphyschem.2016.01.021. [DOI] [Google Scholar]
- Maghsoudi A.; Shojaosadati S. A.; Farahani E. V. 5-Fluorouracil-loaded BSA nanoparticles: formulation optimization and in vitro release study. AAPS PharmSciTech 2008, 9, 1092–1096. 10.1208/s12249-008-9146-5. [DOI] [PMC free article] [PubMed] [Google Scholar]
- Huang Y.; Deng S.; Luo X.; Liu Y.; Xu W.; Pan J.; Wang M.; Xia Z. Evaluation of Intestinal Absorption Mechanism and Pharmacokinetics of Curcumin-Loaded Galactosylated Albumin Nanoparticles. Int. J. Nanomed. 2019, 14, 9721–9730. 10.2147/IJN.S229992. [DOI] [PMC free article] [PubMed] [Google Scholar]
- Afsharzadeh M.; Hashemi M.; Mokhtarzadeh A.; Abnous K.; Ramezani M. Recent advances in co-delivery systems based on polymeric nanoparticle for cancer treatment. Artif. Cells, Nanomed., Biotechnol. 2018, 46, 1095–1110. 10.1080/21691401.2017.1376675. [DOI] [PubMed] [Google Scholar]
- Li B.; Li Q.; Mo J.; Dai H. Drug-loaded polymeric nanoparticles for cancer stem cell targeting. Front. Pharmacol. 2017, 8, 51 10.3389/fphar.2017.00051. [DOI] [PMC free article] [PubMed] [Google Scholar]
- El-Serag H. B.Epidemiology of Hepatocellular Carcinoma. In The Liver: Biology and Pathobiology; Wiley, 2020; pp 758–772. [Google Scholar]
- Kumari P.; Ghosh B.; Biswas S. Nanocarriers for cancer-targeted drug delivery. J. Drug Targeting 2016, 24, 179–191. 10.3109/1061186X.2015.1051049. [DOI] [PubMed] [Google Scholar]
- Gopinath H.; Venugopal K.; Shanmugasundaram S.; Shanmugam D. Anti-cancer nanoparticulate drug delivery system using biodegradable polymers. Elixir Appl. Chem. 2013, 58, 14551–14556. [Google Scholar]
- Doppalapudi S.; Jain A.; Domb A. J.; Khan W. Biodegradable polymers for targeted delivery of anti-cancer drugs. Expert Opin. Drug Delivery 2016, 13, 891–909. 10.1517/17425247.2016.1156671. [DOI] [PubMed] [Google Scholar]
- Yuan R.; Hou Y.; Sun W.; Yu J.; Liu X.; Niu Y.; Lu J. J.; Chen X. Natural products to prevent drug resistance in cancer chemotherapy: a review. Ann. N. Y. Acad. Sci. 2017, 1401, 19–27. 10.1111/nyas.13387. [DOI] [PubMed] [Google Scholar]
- Inamdar N.; Edalat S.; Kotwal V. B.; Pawar S. Herbal drugs in milieu of modern drugs. Int. J. Green Pharm. 2008, 2, 39154 10.4103/0973-8258.39154. [DOI] [Google Scholar]
- Kavishankar G.; Lakshmidevi N. Anti-diabetic effect of a novel N-Trisaccharide isolated from Cucumis prophetarum on streptozotocin–nicotinamide induced type 2 diabetic rats. Phytomedicine 2014, 21, 624–630. 10.1016/j.phymed.2013.12.002. [DOI] [PubMed] [Google Scholar]
- Hemlata; Meena P. R.; Singh A. P.; Tejavath K. K. Biosynthesis of Silver Nanoparticles Using Cucumis prophetarum Aqueous Leaf Extract and Their Antibacterial and Antiproliferative Activity Against Cancer Cell Lines. ACS Omega 2020, 5, 5520–5528. 10.1021/acsomega.0c00155. [DOI] [PMC free article] [PubMed] [Google Scholar]
- Ayyad S.-E. N.; Abdel-Lateff A.; Basaif S. A.; Shier T. Cucurbitacins-type triterpene with potent activity on mouse embryonic fibroblast from Cucumis prophetarum, cucurbitaceae. Pharmacogn. Res. 2011, 3, 189 10.4103/0974-8490.85006. [DOI] [PMC free article] [PubMed] [Google Scholar]
- Hashemi Z.; Ebrahimzadeh M. A.; Khalili M. Sun protection factor, total phenol, flavonoid contents and antioxidant activity of medicinal plants from Iran. Trop. J. Pharm. Res 2019, 18, 1443–1448. 10.4314/tjpr.v18i7.11. [DOI] [PMC free article] [PubMed] [Google Scholar]
- Abifarin T. O.; Afolayan A. J.; Otunola G. A. Phytochemical and Antioxidant Activities of Cucumis africanus Lf:: A Wild Vegetable of South Africa. J. Evidence-Based Integr. Med. 2019, 24, 2515690X19836391 10.1177/2515690X19836391. [DOI] [PMC free article] [PubMed] [Google Scholar]
- Zhang X.; Bai Y.; Wang Y.; Wang C.; Fu J.; Gao L.; Liu Y.; Feng J.; Swamy M. K.; Yogi M.; Rudramurthy G. R.; Purushotham B.; et al. Anticancer Properties of Different Solvent Extracts of Cucumis melo L. Seeds and Whole Fruit and Their Metabolite Profiling Using HPLC and GC-MS. BioMed Res. Int. 2020, 2020, 5282949 10.1155/2020/5282949. [DOI] [PMC free article] [PubMed] [Google Scholar]
- Mandey J. S.; Wolayan F. R.; Pontoh C. J.; Sondakh B. Phytochemical characterization of cucumber (Cucumis sativus L.) seeds as candidate of water additive for organic broiler chickens. J. Adv. Agric. Technol. 2019, 6, 64 10.18178/joaat.6.1.61-64. [DOI] [Google Scholar]
- Begum H. A.; Asad F.; Sadiq A.; Mulk S.; Ali K. 44. Antioxidant, antimicrobial activity and phytochemical analysis of the seeds extract of Cucumis sativus Linn. Pure Appl. Biol. 2019, 8, 433–441. 10.19045/bspab.2018.700202. [DOI] [Google Scholar]
- Tungmunnithum D.; Thongboonyou A.; Pholboon A.; Yangsabai A. Flavonoids and other phenolic compounds from medicinal plants for pharmaceutical and medical aspects: An overview. Medicines 2018, 5, 93 10.3390/medicines5030093. [DOI] [PMC free article] [PubMed] [Google Scholar]
- Weber C.; Kreuter J.; Langer K. Desolvation process and surface characteristics of HSA-nanoparticles. Int. J. Pharm. 2000, 196, 197–200. 10.1016/S0378-5173(99)00420-2. [DOI] [PubMed] [Google Scholar]
- Bronze-Uhle E.; Costa B.; Ximenes V.; Lisboa-Filho P. Synthetic nanoparticles of bovine serum albumin with entrapped salicylic acid. Nanotechnol., Sci. Appl. 2017, 10, 11–21. 10.2147/NSA.S117018. [DOI] [PMC free article] [PubMed] [Google Scholar]
- Galisteo-González F.; Molina-Bolívar J. Systematic study on the preparation of BSA nanoparticles. Colloids Surf., B 2014, 123, 286–292. 10.1016/j.colsurfb.2014.09.028. [DOI] [PubMed] [Google Scholar]
- Huang P.; Li Z.; Hu H.; Cui D. Synthesis and characterization of bovine serum albumin-conjugated copper sulfide nanocomposites. J. Nanomater. 2010, 2010, 641545 10.1155/2010/641545. [DOI] [Google Scholar]
- Huang X.; Brazel C. S. On the importance and mechanisms of burst release in matrix-controlled drug delivery systems. J. Ccontrolled Release 2001, 73, 121–136. 10.1016/S0168-3659(01)00248-6. [DOI] [PubMed] [Google Scholar]
- Mohamed N. Synthesis of Hybrid Chitosan Silver Nanoparticles Loaded with Doxorubicin with Promising Anti-cancer Activity. BioNanoScience 2020, 10, 758–765. 10.1007/s12668-020-00760-y. [DOI] [Google Scholar]
- Thote A. J.; Chappell J. T. Jr; Kumar R.; Gupta R. B. Reduction in the initial-burst release by surface crosslinking of PLGA microparticles containing hydrophilic or hydrophobic drugs. Drug Dev. Ind. Pharm. 2005, 31, 43–57. 10.1081/DDC-43985. [DOI] [PubMed] [Google Scholar]
- Yadav R.; Kumar D.; Kumari A.; Yadav S. K. Encapsulation of catechin and epicatechin on BSA NPs improved their stability and antioxidant potential. EXCLI J. 2014, 13, 331. [PMC free article] [PubMed] [Google Scholar]
- Chen F.; Shi Z.; Neoh K.; Kang E. Antioxidant and antibacterial activities of eugenol and carvacrol-grafted chitosan nanoparticles. Biotechnol. Bioeng. 2009, 104, 30–39. 10.1002/bit.22363. [DOI] [PubMed] [Google Scholar]
- Kumari A.; Yadav S. K.; Pakade Y. B.; Kumar V.; Singh B.; Chaudhary A.; Yadav S. C. Nanoencapsulation and characterization of Albizia chinensis isolated antioxidant quercitrin on PLA nanoparticles. Colloids Surf., B 2011, 82, 224–232. 10.1016/j.colsurfb.2010.08.046. [DOI] [PubMed] [Google Scholar]
- Zorov D. B.; Juhaszova M.; Sollott S. J. Mitochondrial reactive oxygen species (ROS) and ROS-induced ROS release. Physiol. Rev. 2014, 94, 909–950. 10.1152/physrev.00026.2013. [DOI] [PMC free article] [PubMed] [Google Scholar]
- Kunjiappan S.; Govindaraj S.; Parasuraman P.; Sankaranarayanan M.; Arunachalam S.; Palanisamy P.; Mohan U. P.; Babkiewicz E.; Maszczyk P.; Sivakumar V. Design, insilico modelling and functionality theory of folate receptor targeted Myricetin-loaded bovine serum albumin nanoparticle formulation for cancer treatment. Nanotechnology 2020, 31, 155102. [DOI] [PubMed] [Google Scholar]
- McCubrey J. A.; LaHair M. M.; Franklin R. A. Reactive oxygen species-induced activation of the MAP kinase signaling pathways. Antioxid. Redox Signaling 2006, 8, 1775–1789. 10.1089/ars.2006.8.1775. [DOI] [PubMed] [Google Scholar]
- Imanparast F.; Paknejad M.; Faramarzi M. A.; Kobarfard F.; Amani A.; Doosti M. Potential of mZD7349-conjugated PLGA nanoparticles for selective targeting of vascular cell-adhesion molecule-1 in inflamed endothelium. Microvasc. Res. 2016, 106, 110–116. 10.1016/j.mvr.2016.04.003. [DOI] [PubMed] [Google Scholar]
- Sharma V.; Anderson D.; Dhawan A. Zinc oxide nanoparticles induce oxidative DNA damage and ROS-triggered mitochondria mediated apoptosis in human liver cells (HepG2). Apoptosis 2012, 17, 852–870. 10.1007/s10495-012-0705-6. [DOI] [PubMed] [Google Scholar]
- Liu R.; Yu X.; Su C.; Shi Y.; Zhao L. Nanoparticle delivery of artesunate enhances the anti-tumor efficiency by activating mitochondria-mediated cell apoptosis. Nanoscale Res. Lett. 2017, 12, 403 10.1186/s11671-017-2169-7. [DOI] [PMC free article] [PubMed] [Google Scholar]
- Allen R. T.; Hunter W. J. III; Agrawal D. K. Morphological and biochemical characterization and analysis of apoptosis. J. Pharmacol. Toxicol. Methods 1997, 37, 215–228. 10.1016/S1056-8719(97)00033-6. [DOI] [PubMed] [Google Scholar]
- Gurunathan S.; Han J. W.; Eppakayala V.; Jeyaraj M.; Kim J.-H. Cytotoxicity of biologically synthesized silver nanoparticles in MDA-MB-231 human breast cancer cells. BioMed Res. Int. 2013, 2013, 535796 10.1155/2013/535796. [DOI] [PMC free article] [PubMed] [Google Scholar]
- Ali S. H.; Sulaiman G. M.; Al-Halbosiy M. M.; Jabir M. S.; Hameed A. H. Fabrication of hesperidin nanoparticles loaded by poly lactic co-Glycolic acid for improved therapeutic efficiency and cytotoxicity. Artif. Cells, Nanomed., Biotechnol. 2019, 47, 378–394. 10.1080/21691401.2018.1559175. [DOI] [PubMed] [Google Scholar]
- Valavanidis A.; Vlachogianni T.; Fiotakis C. 8-hydroxy-2′-deoxyguanosine (8-OHdG): a critical biomarker of oxidative stress and carcinogenesis. J. Environ. Sci. Health, Part C 2009, 27, 120–139. 10.1080/10590500902885684. [DOI] [PubMed] [Google Scholar]
- Tsujimoto Y. Role of Bcl-2 family proteins in apoptosis: apoptosomes or mitochondria?. Genes Cells 1998, 3, 697–707. 10.1046/j.1365-2443.1998.00223.x. [DOI] [PubMed] [Google Scholar]
- Borner C. The Bcl-2 protein family: sensors and checkpoints for life-or-death decisions. Mol. Immunol. 2003, 39, 615–647. 10.1016/S0161-5890(02)00252-3. [DOI] [PubMed] [Google Scholar]
- Montazeri M.; Sadeghizadeh M.; Pilehvar-Soltanahmadi Y.; Zarghami F.; Khodi S.; Mohaghegh M.; Sadeghzadeh H.; Zarghami N. Dendrosomal curcumin nanoformulation modulate apoptosis-related genes and protein expression in hepatocarcinoma cell lines. Int. J. Pharm. 2016, 509, 244–254. 10.1016/j.ijpharm.2016.05.039. [DOI] [PubMed] [Google Scholar]
- Cyril N.; George J. B.; Joseph L.; Raghavamenon A. C. Assessment of antioxidant, antibacterial and anti-proliferative (lung cancer cell line A549) activities of green synthesized silver nanoparticles from Derris trifoliata. Toxicol. Res. 2019, 8, 297–308. 10.1039/C8TX00323H. [DOI] [PMC free article] [PubMed] [Google Scholar]
- Sun T.; Powers J. R.; Tang J. Evaluation of the antioxidant activity of asparagus, broccoli and their juices. Food Chem. 2007, 105, 101–106. 10.1016/j.foodchem.2007.03.048. [DOI] [Google Scholar]
- Chang C.-C.; Yang M.-H.; Wen H.-M.; Chern J.-C. Estimation of total flavonoid content in propolis by two complementary colorimetric methods. J. Food Drug Anal. 2002, 10, 178–182. [Google Scholar]
- Jithan A.; Madhavi K.; Madhavi M.; Prabhakar K. Preparation and characterization of albumin nanoparticles encapsulating curcumin intended for the treatment of breast cancer. Int. J. Pharm. Invest. 2011, 1, 119 10.4103/2230-973X.82432. [DOI] [PMC free article] [PubMed] [Google Scholar]
- Hosseini S. F.; Zandi M.; Rezaei M.; Farahmandghavi F. Two-step method for encapsulation of oregano essential oil in chitosan nanoparticles: preparation, characterization and in vitro release study. Carbohydr. Polym. 2013, 95, 50–56. 10.1016/j.carbpol.2013.02.031. [DOI] [PubMed] [Google Scholar]
- Cheng Z.; Moore J.; Yu L. High-throughput relative DPPH radical scavenging capacity assay. J. Agric. Food Chem. 2006, 54, 7429–7436. 10.1021/jf0611668. [DOI] [PubMed] [Google Scholar]
- Dubey A.; Goswami M.; Yadav K.; Chaudhary D. Oxidative stress and nano-toxicity induced by TiO2 and ZnO on WAG cell line. PLoS One 2015, 10, e0127493 10.1371/journal.pone.0127493. [DOI] [PMC free article] [PubMed] [Google Scholar]
- Fageria L.; Pareek V.; Dilip R. V.; Bhargava A.; Pasha S. S.; Laskar I. R.; Saini H.; Dash S.; Chowdhury R.; Panwar J. Biosynthesized protein-capped silver nanoparticles induce ros-dependent proapoptotic signals and prosurvival autophagy in cancer cells. ACS Omega 2017, 2, 1489–1504. 10.1021/acsomega.7b00045. [DOI] [PMC free article] [PubMed] [Google Scholar]
- Jochums A.; Friehs E.; Sambale F.; Lavrentieva A.; Bahnemann D.; Scheper T. Revelation of different nanoparticle-uptake behavior in two standard cell lines NIH/3T3 and A549 by flow cytometry and time-lapse imaging. Toxics 2017, 5, 15 10.3390/toxics5030015. [DOI] [PMC free article] [PubMed] [Google Scholar]
- Banerjee K.; Rai V. R.; Umashankar M. Effect of peptide-conjugated nanoparticles on cell lines. Prog. Biomater. 2019, 8, 11–21. 10.1007/s40204-019-0106-9. [DOI] [PMC free article] [PubMed] [Google Scholar]
- Chomczynski P.; Sacchi N. Single-step method of RNA isolation by acid guanidinium thiocyanate-phenol-chloroform extraction. Anal. Biochem. 1987, 162, 156–159. 10.1016/0003-2697(87)90021-2. [DOI] [PubMed] [Google Scholar]
Associated Data
This section collects any data citations, data availability statements, or supplementary materials included in this article.


