

Abstract

Fast photochemical oxidation of proteins (FPOP) is a recently developed technique for studying protein folding, conformations, interactions, etc. In this method, hydroxyl radicals, usually generated by KrF laser photolysis of H2O2, are used for irreversible labeling of solvent-exposed side chains of amino acids. Mapping of the oxidized residues to the protein’s structure requires pinpointing of modifications using a bottom-up proteomic approach. In this work, a quadrupole time-of-flight (QTOF) mass spectrometer coupled with trapped ion mobility spectrometry (timsTOF Pro) was used for identification of oxidative modifications in a model protein. Multiple modifications on the same residues, including six modifications of histidine, were successfully resolved. Moreover, parallel accumulation–serial fragmentation (PASEF) technology allows successful sequencing of even minor populations of modified peptides. The data obtained indicate a clear improvement of the quality of the FPOP analysis from the viewpoint of the number of identified peptides bearing oxidative modifications and their precise localization. Data are available via ProteomeXchange with identifier PXD020509.
Introduction
Methods of structural mass spectrometry, such as hydrogen deuterium exchange (HDX-MS), chemical cross-linking (XL-MS), and various chemical labeling methods, have become a very valuable and effective tool for the study of protein structures and protein–ligand and protein–protein interactions. Among them, fast photochemical oxidation of protein (FPOP) employing hydroxyl radicals, introduced by Aye and co-workers1 and later by Hambly and Gross,2 has been recognized for its ability to study conformational changes in proteins.3 The main advantages of this method are the speed of the labeling reaction, which occurs on the time scale of microseconds, and its broad reactivity.4 FPOP irreversibly labels solvent-accessible amino acid side chains and allows the determination of reactivity at single residue resolution more easily in comparison with hydrogen deuterium exchange.5
In theory, side chains of all amino acids except Gly could be modified by ·OH.6 However, stable oxidation products have been detected by mass spectrometry for only 14 of them.4 Recently, mechanisms of oxidative modifications of 13 amino acids have been reported.7 The amino acids have been classified into three categories with respect to mechanisms of oxidation based on the source of oxygen uptake. Class 1 consists of His, Arg, Tyr, and Phe, which preferably take oxygen from H2O2. Met is assigned to class 2, where oxygen is competitively taken from H2O2 and dissolved oxygen. The rest of the reactive amino acids (Leu, Ile, Val, Pro, Lys, Asp, Gln, and Glu) comprise class 3 and take oxygen only from O2.7
The most reactive amino acids using FPOP are sulfur-containing Cys and Met followed by the aromatic ones with the order of reactivity Trp > Tyr > Phe.3 It should be noted that some amino acids have several possible modifications, which should be considered for a more accurate analysis.6 Sometimes, to simplify data analysis, only major modifications, like oxidation to carbonyl (+14 Da), oxidation (+16 Da), and di- and trioxidation, might be taken into account,8 but some valuable information may be lost in this approach.
Precise localization of a modified residue is of great importance in FPOP analysis, representing a very challenging task. Because of the broad reactivity of hydroxyl, a single peptide might have the same modification at different residues. Another obstacle arises from the dynamic range in intensities of an unmodified peptide and its oxidized form, which can be up to 3 orders of magnitude.9 Thus, instrumentation plays a crucial role in FPOP analysis.
From this point of view, the timsTOF Pro mass spectrometer from Bruker Daltonics has performance characteristics that should be very useful. The timsTOF Pro is a quadrupole time-of-flight instrument with integrated trapped ion mobility spectrometry (TIMS) allowing a third dimension of peptide separation.10 Another advantage of this device is the “parallel accumulation–serial fragmentation” (PASEF) method.11 The combination of both TIMS separation and PASEF allows selection of multiple precursors with the same mass and retention time but differing mobilities for fragmentation and increases the sequencing speed without loss of sensitivity.12 Good performance of this device has been already shown in the shotgun proteomic approaches.12,13
In the current study, we present data indicating that the timsTOF Pro mass spectrometer has great potential to improve FPOP analyses.
Results and Discussion
Before the FPOP analysis, the purity of Hp was confirmed by SDS-PAGE electrophoresis. Only two bands corresponding to the α and β subunits were resolved on the gel (Supporting Information, Figure S1), allowing the use of a simplified database for searching MSMS data.
Two injection volumes, corresponding to 20 and 40 ng of digested protein, were analyzed. Using a bottom-up approach, a nearly 100% sequence coverage of the model protein Hp was achieved with 20 ng of the peptide mixture (Supporting Information, Figure S2). A twice higher injection volume led to full sequence coverage of the protein and a significant increase in the number of modified peptides identified.
A comparison of peptide maps of control (laser off) and irradiated (laser on) samples revealed a higher number of modifications in the latter case for both Hp subunits (Figure 1). Four and 16 modifications on 4 and 7 types of amino acids were unambiguously deduced from fragmentation spectra in Hpα and Hpβ, respectively, without laser exposure, whereas 6 and 55 such modifications on 5 and 15 types of amino acids were found in the respective samples after laser irradiation. Hpβ was modified at a much higher extent than Hpα, making it more informative for the evaluation of the timsTOF Pro for FPOP analysis (Table 1 and Supporting Information, Table S2).
Figure 1.

Peptide map of haptoglobin (40 ng): Hpα sequence coverage for (a) laser off and (b) laser on samples. Hpβ sequence coverage for (c) laser off and (d) laser on samples. Peptides passing thresholds −10lgP > 15 and AScore > 20 were accepted for analysis. Modifications localized on a particular residue from fragmentation spectra are indicated above the sequence line.
Table 1. Amino Acids Modified with Hydroxyl Radicals during the FPOP Experiment.
| position |
||
|---|---|---|
| residue | Hpα | Hpβ |
| Cys | 111 | 266, 340 |
| Trp | 175, 284, 398 | |
| Tyr | 114, 125 | 272, 280, 386 |
| Met | 263, 300 | |
| Phe | 173, 205, 290, 292, 339 | |
| His | 166, 208, 295 | |
| Arg | 261 | |
| Ile | 233 | |
| Leu | 127 | 167, 206, 221, 230, 296 |
| Val | 124 | 231, 275, 278 |
| Pro | 219, 268, 302 | |
| Thr | 293, 338 | |
| Ser | 282 | |
| Lys | 170, 178, 228, 235, 270, 291 | |
| Asp | 122 | 397 |
Plotting of all certain modifications detected in the irradiated sample onto the Hp 1-1 3D (PDB 4WJG) structure revealed that oxidized residues were in close proximity to the protein surface (Figure 2). This observation indirectly indicates the reliability of identification of modified residues with the selected approach. Also, a correlation between the solvent-accessible surface area (SASA) and modification rates of amino acids was evaluated (Figure 3). As it was expected, the increase of SASA led to a higher modification extent of more reactive residues, like aromatic amino acids and Met. It should be mentioned that an Hp 1-1 high-resolution structural model has not been deposited in its free form so far. Thus, Hp coordinates for SASA calculation were derived from the Hb–Hp complex stabilized with the Trypanosoma brucei brucei receptor (PDB 4WJG).14 Therefore, detected oxidation of Trp175 and Tyr272 with calculated zero SASA and minor oxidation of highly accessible His295 might indicate different positions of the respective side chains of Hp 1-1 in its free form. Also, these data are in agreement with the reactivity of amino acids in the FPOP analysis.6 Slightly accessible, highly reactive Tyr, Trp, Phe, or Met residues were readily oxidized by ·OH, whereas low- or middle-reactive amino acids, namely, Leu, Ile, Val, and Lys, were less modified, even possessing high SASA values (Figure 3).
Figure 2.

Structural model of Hp 1-1 (based on PDB 4WJG) with highlighted modified residues identified in the laser irradiated sample. The α subunit is in green color, and the β subunit is in cyan color. Modified residues are in red color. Respective light colors represent the solvent-accessible area of the protein surface.
Figure 3.

Correlation of oxidation extents (orange bars) of single amino acids and their relative solvent-accessible surface areas (blue bars) calculated using the Hp 1-1 coordinates extracted from the PDB 4WJG model.
Analysis of the identified modifications showed oxidation (+16 Da) to be the dominant one. Also, we were able to easily assign rare modifications on Thr residues that were previously shown to be difficult to detect.3 Thr modification was assigned by PEAKS+ software to the peptide with the sequence NANFKFTDHLK (Supporting Information, Figure S3). The manual validation of the raw spectrum confirmed PEAKS+ assignment (Figure 4). An unmodified N-terminal sequence was deduced from the respective b-ion series b3–b6. Fragment b6 at m/z 722.35 corresponded to the unmodified NANFKF sequence. The loss of 2 a.m.u. was detected on the b7 ion at m/z 821.38, which corresponded to the NANFKFT sequence, meaning carbonylation on the Thr residue. The subsequent b8 at m/z 936.42 and b9 at 1056.55 fragment ions confirmed such observation. Thr oxidative modification was also supported by the complementary y-ion series, where y4 at m/z 512.28 represented the unmodified DHLK sequence and all further detected y fragments (y6–y9) were bearing −2.02 a.m.u. modification (Figure 4).
Figure 4.

Fragmentation spectrum of the peptide with the sequence NANFKFTDHLK (doubly charged at m/z 666.8388) with a modification of a Thr residue identified during FPOP analysis. A precursor ion is labeled with a blue rhombus. Pound symbol, oxidized fragment ion. The modified residue is labeled with a lowercase letter.
For some amino acids, several types of modifications were detected, generating different populations of specific peptides. For instance, mono-, di-, or trioxidized forms of aromatic amino acids (Trp, Tyr, or Phe) were found as well as di- and trioxidized Cys (Figure 1). Also, five possible histidine modifications that may occur during FPOP experiments described in previous work were detected in the present study (Table 2).6 Using PASEF technology, it was possible to get direct evidence of differently modified His residues from the fragmentation spectra (Figure 5) even for very low intensity precursors (Table 2). Moreover, one more possible modification of His, namely, +14 Da,15 was determined (Figure 5f).
Table 2. List of Detected Histidine Modifications in the ILGGHLDAK Peptidea.
| m/z (no laser/laser) | –10lgP (no laser/laser) | Z (no laser/laser) | RT, min (no laser/laser) | 1/k0 range (no laser/laser) | intensity* (no laser/laser) | contribution to the overall oxidation of the peptide* (no laser/laser), % | modification |
|---|---|---|---|---|---|---|---|
| 469.24 | 34.28/32.24 | 2 | 9.45 | 0.8353–0.8539 | 13,852/22,520 | 1.2/0.6 | +14 Da |
| 900.49 | 53.31 | 1 | 8.59 | 1.4441–1.4619 | -/41,104 | -/1.2 | His → Asn |
| 901.48 | 51.15 | 1 | 9.47 | 1.4377–1.4555 | -/27,527 | -/0.8 | His → Asp |
| 913.48 | 49.49/43.38 | 1 | 6.21 | 1.4477–1.4655 | 8763/11,365 | 0.7/0.3 | –10 Da |
| 928.48 | 52.13 | 1 | 9.23 | 1.4527–1.4705 | -/21,471 | -/0.6 | +5 Da |
| 470.25/939.50 | 35.18/62.14 | 2/1 | 9.06/9.01 | 0.8182–0.8368/1.4833–1.5010 | 6025/505,579 | 0.5/14.5 | +16 Da |
1/k0, reduced ion mobility coefficient;12 *, the parameter was calculated using all charge states of respective peptides.
Figure 5.

Fragmentation spectra of the peptide with the sequence ILGGHLDAK with different modifications at the histidine residue: (a) +16 Da, (b) His → Asp, (c) His → Asn, (d) +5 Da, (e) −10 Da, and (f) +14 Da. Modified residues are labeled with an underlined lowercase letter.
The most abundant histidine modification detected in both samples was +16 Da followed by +14 and −10 Da (Table 2). However, a contribution of peptides with −10 and +14 Da modifications to the overall oxidation of the peptide was higher for the sample without laser irradiation, indicating that these oxidations are from H2O2. The remaining three modifications (His to Asn or Asp, +5 Da) represented minor populations and were characteristic of oxidation with ·OH.
The introduction of trapped ion mobility spectrometry on the timsTOF Pro instrument provides an additional dimension of peptide separation. Several products of hydroxyl radical footprinting were detected at the same retention time, and the ion mobility separation resolved them, which is crucial for the quantification of modified products (Supporting Information, Table S3). The representative example is demonstrated in Figure 6. Using the ion mobility separation, two forms of the peptide with the sequence NLFLDHSEDATAK in its doubly charged form at m/z 738.84 and the same RT (9.44 min) were identified. The more abundant form showed oxidation of the Phe residue, and the minor form was assigned to the oxidation of the His residue. Both modified peptides were identified by PEAKS+ software with a high score: 113.76 and 84.83 for oxidized Phe and His, respectively. Oxidation of Phe was deduced from the respective b and y fragment ion series. The mass difference of 163.06 a.m.u. between b2 at m/z 228.13 and b3 at m/z 391.19 together with y11 at m/z 1249.55 and y10 at m/z 1086.49 fits exactly the mass of the Phe residue (147.07 a.m.u.) plus oxygen (+15.99 a.m.u.). In the case of His modification, b5 at m/z 603.29 corresponded to the unmodified NLFLD N-terminal peptide sequence while b7 at m/z 972.42 reflected oxidation of the peptide region containing His and Ser. The complementary y6° at m/z 616.28 and at y8° at m/z 856.36 confirmed the oxidation of the same sequence. The oxidation was finally assigned to His since the oxidation of Ser is extremely rare, and the rate constant of His oxidation is an order of magnitude higher than that of Ser.6
Figure 6.

Separation of two forms of the peptide with sequence NLFLDHSEDATAK appearing doubly charged at m/z 738.84 using ion mobility. Left side, chromatogram; right side, mobilogram.
Previously, sub-residue resolution in an FPOP experiment has been reported.16 Analogue results were obtained in the present study, where peptides containing aromatic amino acids oxidized at different sites were found. In particular, fragmentation spectra of peptides with position numbers of amino acids 203–215 (m/z 738.8416) eluting at 7.7 and 9.4 min were identical and corresponded to the oxidized Phe (Supporting Information, Figure S4). Similar fragmentation spectra were also found for the peptides 271–277 (m/z 825.3568, RT 5.6 and 6.5) and 392–401 (m/z 610.3093, RT 9.7, 10.4, and 12.4) bearing oxidative modification of Tyr and Trp, respectively (Supporting Information, Figures S5 and S6). Nevertheless, the key factor in achieving sub-residue resolution is the quality of liquid chromatography (LC) separation.
Five possible sites of oxidation were found in the peptide with sequence KQLVEIEK at m/z 501.78. Modification of different residues leads to changes in retention times of the peptides (Table 3). Another indication supporting oxidation of multiple sites in the peptide was changes in the ion mobility parameter. Another benefit of the PASEF technology is that the fragmentation spectra for peptides can be obtained over a wide dynamic range of respective intensities, which has been shown previously in the proteomic data.12 In the present study, this range was estimated to be almost 3 orders of magnitude (Table 3). Moreover, the quality of fragmentation spectra allowed a precise determination of modified amino acid even in the least abundant peptide (Figure 7).
Table 3. List of Detected Modifications in the KQLVEIEK Peptidea.
| –10lgP | z | RT | 1/k0 range | intensity | oxidation site | AScore |
|---|---|---|---|---|---|---|
| 38.14 | 2 | 2.97 | 0.8442–0.8628 | 147,992 | L3 | 26.31 |
| 41.03 | 2 | 3.79 | 0.8345–0.8531 | 1224 | V4 | 30.46 |
| 36.83 | 2 | 5.83 | 0.8286–0.8472 | 16,835 | K8 | 26.31 |
| 43.59 | 2 | 6.12 | 0.8487–0.8673 | 25,697 | K1 | 36.05 |
| 38.07 | 2 | 7.15 | 0.8717–0.8903 | 5250 | I6 | 32.28 |
| 53.33 | 2 | 6.31 | 0.8583–0.8769 | 1,479,460 | NA | NA |
NA, not applicable.
Figure 7.

Fragmentation spectra of the peptide KQLVEIEK appearing doubly charged at m/z 501.78: (a) L3, (b) V4, (c) K8, (d) K1, (e) I6, and (f) without modification. Modified residues are labeled with underlined lowercase letters.
Quantification is a key point of FPOP analysis for the precise footprinting of a protein surface. Thus, its reproducibility is of crucial importance. To evaluate this parameter, we selected the KQLVEIEK peptide bearing various modifications with different intensities representing high-, middle-, and low-intensive populations (Figure 8).
Figure 8.
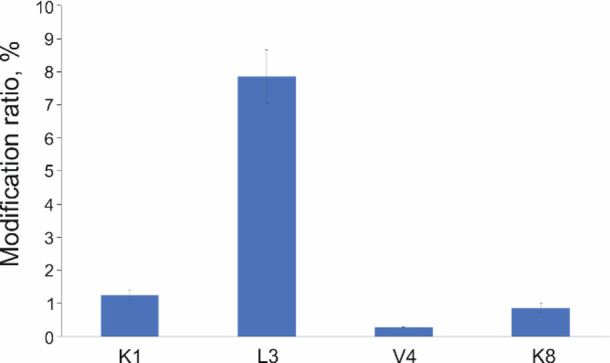
Reproducibility of FPOP quantitative analysis using the timsTOF Pro mass spectrometer. An oxidation of the KQLVEIEK peptide at the residue L3 represents highly abundant modification, K1 and K8 are middle abundant modifications, and V4 is a low abundant modification. Error bars represent standard deviation from three replicates.
Obtained data confirmed a high accuracy of the timsTOF Pro even for low abundant peptides. It should be mentioned that these results were highly reproducible, including retention time, m/z, and ion mobility (1/k0), meaning a confident automatic data interpretation in the case of multiplicates (Supporting Information, Figure S7).
Conclusions
In the present study, a benefit of ion mobility application for the needs of FPOP analysis was demonstrated for the first time. We demonstrate that TIMS and PASEF technologies in the timsTOF Pro instrument produce reliable data. Multiple modifications on the same residues as well as multiple sites of oxidation of the same peptide were identified. The high dynamic range of analysis allowed single residue resolution of the site of modification for peptides spanning an intensity range of 3 orders of magnitude and is comparable to the previous reports.17,18 Also, the introduction of the TIMS technology allows an additional parameter, namely, CCS. Although this parameter has not been widely implemented for peptide identifications, there is an avenue for the simplification/automation of data processing. It might be useful for combining several LC–MS runs, which subsequently facilitates in an unambiguous matching of peptides bearing the same modifications. To our knowledge, the results represent a highly informative FPOP data set from the viewpoint of the number of identified modifications at single residue resolution. Identification of maximum possible sites of modification in FPOP experiments secures precise footprinting information of a protein surface. Such comprehensive analysis should result in more reliable data for structural characterization of proteins and protein–ligand complexes.
Experimental Section
Chemicals and Materials
Human haptoglobin (Hp) phenotype 1-1 was purchased from Sigma Aldrich. PNGase F was from New England BioLabs Inc. A trypsin/Lys-C mass spectrometry grade protease mixture was obtained from Promega Corporation. Additional chemicals reported in this article were purchased in the highest available purity from Merck.
SDS-PAGE Electrophoresis
The purity of purchased Hp was checked by SDS electrophoresis as follows. Hp (5 μg) was diluted in 15 μL of 150 mM ammonium acetate and mixed with 5 μL of 4× LDS (lithium dodecyl sulfate) sample buffer, including 400 mM dithiothreitol. Afterward, the sample was boiled for 5 min and loaded in a 10-well pre-casted NuPAGE Bis-Tris gradient gel of 4–12% (Thermo Fisher Scientific) placed in an electrophoretic apparatus filled with SDS-MES running buffer. After that, one well was loaded with 5 μL of pre-stained Protein Standard SeeBlue Plus2 (Thermo Fisher Scientific). Electrophoresis was run for 35 min under 200 V. The final gel was processed with a standard Coomassie Blue staining and destaining protocol.
Fast Photochemical Oxidation of Proteins (FPOP)
The FPOP experiment was carried out in a continuous capillary flow system composed of two syringe pumps (New Era, models NE-1000 and NE-4000). Prior to the experiment, solutions of 0.27 mg/mL Hp, 7.5 mM H2O2, and 75 mM l-methionine were prepared in degassed 150 mM ammonium acetate buffer (pH 6.8). After that, three glass syringes (Hamilton) for 250, 500, and 1000 μL for the samples, H2O2, and l-methionine, respectively, connected with quartz capillaries (Polymicro Technologies), MicroTees (Upchurch Scientific) were filled, and pumps were started. Flow rates were set to 10, 20, and 20 μL/min for Hp, H2O2, and l-methionine, respectively. For generation of hydroxyl radicals, a 248 nm KrF laser (Coherent, COMPex50) was used. The laser beam was focused on a quartz capillary with an i.d. of 75 μm where a transparent window (approximately 6.5 mm) was formed by removal of the polyimide coating. Subsequently, Hp mixed with H2O2 was subjected to one laser shot (15 Hz, 20 ns pulse duration, 2.24 mJ/mm2 radiant exposure, and exclusion volume was 16%) followed by mixing with 75 mM l-methionine, which served as a radical scavenger.
Protein Digestion and LC–MS/MS Analysis
Samples collected after the FPOP experiment were subjected to a reduction of cysteines with 20 mM tris(2-carboxyethyl)phosphine, for 20 min, at 56 °C followed by alkylation with 20 mM iodoacetamide, for 20 min, at 25 °C in the dark. Subsequently, samples were twice diluted with 100 mM 4-ethylmorpholine buffer (pH 8.5):acetonitrile (ACN) (90:10 v/v) followed by overnight deglycosylation with PNGase F (protein:enzyme ratio, 1:20). Afterward, trypsin/Lys-C was added (protein:enzyme ratio, 1:20) and samples were digested for 8 h at 37 °C. Digestion was stopped by addition of TFA to a final concentration of 0.1%, and the resulting digest was subsequently dried by a SpeedVac (Eppendorf).
Samples were analyzed on an ultrahigh pressure nanoflow chromatography system (nanoElute, Bruker Daltonics) coupled to a trapped ion mobility quadrupole time-of-flight mass spectrometer (timsTOF Pro, Bruker Daltonics) via a nanoelectrospray ion source (Captive Spray Source, Bruker Daltonics). Peptides (20 or 40 ng, respectively) were directly loaded and separated on an analytical column (25 cm × 75 μm, C18, 1.6 μm) (Aurora Column, Ion Opticks, Australia). Peptides were eluted using 2% ACN/0.1% formic acid as mobile phase A at a flow rate of 400 nL/min and 21 minute-long gradient with liner increase of acetonitrile to 37% (the mobile phase B was ACN/0.1% formic acid) at a 50 °C column oven temperature. The eluting peptides were interrogated by an MS acquisition method recording spectra from 100 to 1700 m/z and ion mobility scanned from 0.6 to 1.6 Vs/cm2. The method consisted of a TIMS survey scan of 150 ms followed by six PASEF MS/MS scans, each 150 ms for ion accumulation and ramp time. The total cycle time was 1.08 s. The target intensity was 40,000, the intensity threshold was 1000, and singly charged peptides with m/z < 800 were excluded by an inclusion/exclusion polygon filter applied within the ion mobility over m/z heatmaps. Precursors for data-dependent acquisition were fragmented with an ion mobility-dependent collision energy, which was linearly increased from 20 to 59 eV.
The raw data were deposited to a ProteomeXchange Consortium via a PRIDE19 partner repository with a data set identifier PXD020509.
Data Analysis
The acquired data were searched against a database containing the sequence of haptoglobin (deglycosylated form) supplemented with sequences of common contaminants (Max Planck Institute of Biochemistry, Martinsried, Germany) using PEAKS X+ software (Bioinformatics Solutions Inc., Waterloo, ON, Canada). Precursor ion tolerance was set at 10 ppm, and the mass tolerance for MS/MS fragment ions was set at 0.05 Da. Carbamidomethylation of cysteine and commonly observed FPOP modifications6 (Supporting Information, Table S1) were considered as variable modifications. Peptide-spectrum matches were filtered by peptide −10lgP scores ≥15, and the threshold to a localization score assigned to modifications was set at ≥20. FDR was set to 5%. Intensities of modified peptides were determined using Compass DataAnalysis v.5.2 (Bruker Daltonics).
To calculate the surface-accessible surface area (SASA) of Hp 1-1, respective coordinates were extracted from the model PDB 4WJG. The calculation was accomplished by NACCESS 2.1.1 software using the rolling probe algorithm.20 A probe radius was set to 2.8 Å to mimic the composition of the H2O2 molecule.21
Acknowledgments
This work was mainly supported by the Czech Science Foundation (grant number 19-16084S), the Ministry of Education of the Czech Republic (program “NPU II” project LQ1604), the European Commission H2020 (EPIC-XS - grant agreement ID: 823839), and, in part, by the Czech Academy of Sciences (RVO61388971). We thank Dr. Filip Dycka (University of South Bohemia, Czech Republic) for providing access to the PEAKS software, and we acknowledge the Centre of Molecular Structure Core Facility at BIOCEV, a facility funded by the European Regional Development Funds (CZ.1.05/1.1.00/02.0109 BIOCEV) and supported by the Czech Infrastructure for Integrative Structural Biology (structural mass spectrometry CF - LM2018127 CIISB for CMS BIOCEV funded by MEYS CR).
Supporting Information Available
The Supporting Information is available free of charge at https://pubs.acs.org/doi/10.1021/acsomega.1c00732.
FPOP modifications (Table S1); list of Hpα and Hpβ peptides with a certain modification (Table S2); list of peptides separated using the ion mobility cell (Table S3); SDS-PAGE electrophoresis of haptoglobin (Figure S1); peptide map of haptoglobin (20 ng) (Figure S2); fragmentation spectra of the peptide NANFKFTDHLK (m/z 444.8847) (Figure S3); fragmentation spectra of the peptide 203–215 (m/z 738.8416) with RT 7.7 and 9.4 (Figure S4); fragmentation spectra of the peptide 271–277 (m/z 825.3568) with RT 5.6 and 6.5 (Figure S5); fragmentation spectra of the peptide 392–401 (m/z 610.3093) with RT 9.7, 10.4, and 12.4 (Figure S6); analysis reproducibility (Figure S7) (PDF)
Author Contributions
The manuscript was written through contributions of all authors. All authors have given approval to the final version of the manuscript.
The authors declare the following competing financial interest(s): Two of the authors, Peter Brechlin and Gary Kruppa are employees of Bruker Daltonics. All experiments have been generated in a collaboration of Petr Novak laboratory and Bruker Daltonics, where Bruker provided the access to a timsTOF Pro mass spectrometer.
Supplementary Material
References
- Aye T. T.; Low T. Y.; Sze S. K. Nanosecond Laser-Induced Photochemical Oxidation Method for Protein Surface Mapping with Mass Spectrometry. Anal. Chem. 2005, 77, 5814–5822. 10.1021/ac050353m. [DOI] [PubMed] [Google Scholar]
- Hambly D. M.; Gross M. L. Laser Flash Photolysis of Hydrogen Peroxide to Oxidize Protein Solvent-Accessible Residues on the Microsecond Timescale. J. Am. Soc. Mass Spectrom. 2005, 16, 2057–2063. 10.1016/j.jasms.2005.09.008. [DOI] [PubMed] [Google Scholar]
- Wang L.; Chance M. R. Structural Mass Spectrometry of Proteins Using Hydroxyl Radical Based Protein Footprinting. Anal. Chem. 2011, 83, 7234–7241. 10.1021/ac200567u. [DOI] [PMC free article] [PubMed] [Google Scholar]
- Liu X. R.; Zhang M. M.; Gross M. L. Mass Spectrometry-Based Protein Footprinting for Higher-Order Structure Analysis: Fundamentals and Applications. Chem. Rev. 2020, 4355. 10.1021/acs.chemrev.9b00815. [DOI] [PMC free article] [PubMed] [Google Scholar]
- Johnson D. T.; Di Stefano L. H.; Jones L. M. Fast Photochemical Oxidation of Proteins (FPOP): A Powerful Mass Spectrometry–Based Structural Proteomics Tool. J. Biol. Chem. 2019, 11969–11979. 10.1074/jbc.REV119.006218. [DOI] [PMC free article] [PubMed] [Google Scholar]
- Xu G.; Chance M. R. Hydroxyl Radical-Mediated Modification of Proteins as Probes for Structural Proteomics. Chem. Rev. 2007, 107, 3514–3543. 10.1021/cr0682047. [DOI] [PubMed] [Google Scholar]
- Liu X. R.; Zhang M. M.; Zhang B.; Rempel D. L.; Gross M. L. Hydroxyl-Radical Reaction Pathways for the Fast Photochemical Oxidation of Proteins Platform As Revealed by 18O Isotopic Labeling. Anal. Chem. 2019, 91, 9238–9245. 10.1021/acs.analchem.9b02134. [DOI] [PMC free article] [PubMed] [Google Scholar]
- Cornwell O.; Bond N. J.; Radford S. E.; Ashcroft A. E. Long-Range Conformational Changes in Monoclonal Antibodies Revealed Using FPOP-LC-MS/MS. Anal. Chem. 2019, 91, 15163–15170. 10.1021/acs.analchem.9b03958. [DOI] [PubMed] [Google Scholar]
- Liu X. R.; Rempel D. L.; Gross M. L. Protein Higher-Order-Structure Determination by Fast Photochemical Oxidation of Proteins and Mass Spectrometry Analysis. Nat. Protoc. 2020, 15, 3942–3970. 10.1038/s41596-020-0396-3. [DOI] [PMC free article] [PubMed] [Google Scholar]
- Silveira J. A.; Ridgeway M. E.; Park M. A. High Resolution Trapped Ion Mobility Spectrometery of Peptides. Anal. Chem. 2014, 86, 5624–5627. 10.1021/ac501261h. [DOI] [PubMed] [Google Scholar]
- Meier F.; Beck S.; Grassl N.; Lubeck M.; Park M. A.; Raether O.; Mann M. Parallel Accumulation-Serial Fragmentation (PASEF): Multiplying Sequencing Speed and Sensitivity by Synchronized Scans in a Trapped Ion Mobility Device. J. Proteome Res. 2015, 14, 5378–5387. 10.1021/acs.jproteome.5b00932. [DOI] [PubMed] [Google Scholar]
- Meier F.; Brunner A. D.; Koch S.; Koch H.; Lubeck M.; Krause M.; Goedecke N.; Decker J.; Kosinski T.; Park M. A.; Bache N.; Hoerning O.; Cox J.; Räther O.; Mann M. Online Parallel Accumulation–Serial Fragmentation (PASEF) with a Novel Trapped Ion Mobility Mass Spectrometer. Mol. Cell. Proteomics 2018, 17, 2534–2545. 10.1074/mcp.TIR118.000900. [DOI] [PMC free article] [PubMed] [Google Scholar]
- Sandow J. J.; Infusini G.; Dagley L. F.; Larsen R.; Webb A. I. Simplified High-Throughput Methods for Deep Proteome Analysis on the Tims TOF Pro. bioRxiv 2019, 657908. 10.1101/657908. [DOI] [Google Scholar]
- Stødkilde K.; Torvund-Jensen M.; Moestrup S. K.; Andersen C. B. F. Structural Basis for Trypanosomal Haem Acquisition and Susceptibility to the Host Innate Immune System. Nat. Commun. 2014, 5, 1–8. 10.1038/ncomms6487. [DOI] [PubMed] [Google Scholar]
- Xu C. F.; Chen Y.; Yi L.; Brantley T.; Stanley B.; Sosic Z.; Zang L. Discovery and Characterization of Histidine Oxidation Initiated Cross-Links in an IgG1 Monoclonal Antibody. Anal. Chem. 2017, 89, 7915–7923. 10.1021/acs.analchem.7b00860. [DOI] [PubMed] [Google Scholar]
- Cornwell O.; Radford S. E.; Ashcroft A. E.; Ault J. R. Comparing Hydrogen Deuterium Exchange and Fast Photochemical Oxidation of Proteins: A Structural Characterisation of Wild-Type and ΔN6 Β2-Microglobulin. J. Am. Soc. Mass Spectrom. 2018, 29, 2413–2426. 10.1007/s13361-018-2067-y. [DOI] [PMC free article] [PubMed] [Google Scholar]
- Chea E. E.; Jones L. M. Modifications Generated by Fast Photochemical Oxidation of Proteins Reflect the Native Conformations of Proteins. Protein Sci. 2018, 27, 1047–1056. 10.1002/pro.3408. [DOI] [PMC free article] [PubMed] [Google Scholar]
- Zhang M. M.; Rempel D. L.; Gross M. L. A Fast Photochemical Oxidation of Proteins (FPOP) Platform for Free-Radical Reactions: The Carbonate Radical Anion with Peptides and Proteins. Free Radical Biol. Med. 2019, 131, 126–132. 10.1016/j.freeradbiomed.2018.11.031. [DOI] [PMC free article] [PubMed] [Google Scholar]
- Perez-Riverol Y.; Csordas A.; Bai J.; Bernal-Llinares M.; Hewapathirana S.; Kundu D. J.; Inuganti A.; Griss J.; Mayer G.; Eisenacher M.; Pérez E.; Uszkoreit J.; Pfeuffer J.; Sachsenberg T.; Yilmaz Ş.; Tiwary S.; Cox J.; Audain E.; Walzer M.; Jarnuczak A. F.; Ternent T.; Brazma A.; Vizcaíno J. A. The PRIDE Database and Related Tools and Resources in 2019: Improving Support for Quantification Data. Nucleic Acids Res. 2019, 47, D442–D450. 10.1093/nar/gky1106. [DOI] [PMC free article] [PubMed] [Google Scholar]
- Hubbard S. J.; Thornton J.. NACCESS. Department of Biochemistry and Molecular Biology, University College: London: 1993. [Google Scholar]
- Lee B.; Richards F. M. The Interpretation of Protein Structures: Estimation of Static Accessibility. J. Mol. Biol. 1971, 55, 379. 10.1016/0022-2836(71)90324-X. [DOI] [PubMed] [Google Scholar]
Associated Data
This section collects any data citations, data availability statements, or supplementary materials included in this article.