Abstract
The elements of Bakken Petroleum System consist of two source rocks with high underlying burial depths for significant hydrocarbon generation. However, this deep hydrocarbon generation process is dependent on its kinetic properties, thermal maturity, and geochemical properties. The statistical compensation effect is a complicating factor in the kinetic analyses of the Bakken Formation. In this study, we experimentally determined the kinetics of the Bakken formation source beds, observed the presence of the residual compensation effect, and numerically established a correlation between the kinetic parameters, thermal maturity indices (Tmax), and the vitrinite reflectance (VRo) and bitumen reflectance (BRo). First, we conducted source rock analysis to determine kinetic properties and the organic geochemical assays of reactive kerogen in the Bakken source beds. Finally, we incorporated previous established studies to generate numerical correlation for Tmax in terms of VRo and BRo reflectance. Our kinetic results show evidence of the residual compensation effect in the Bakken Formation when samples are repeatedly analyzed. The simultaneous linear expression of the residual compensation effect and the regression analysis of the solutions to the Kissinger equation for heating rate, yielded a kinetic parameter solution that correlates with Tmax. Furthermore, recalculated Tmax values established a correlation between the kinetic parameters, Tmax, VRo, and BRo. The application of state-of-the-art numerical correlations to measure subsurface kinetics, source rock richness, and burial-depth temperatures will enhance the accuracy of reservoir exploration and hydrocarbon production within the Bakken Formation.
Introduction
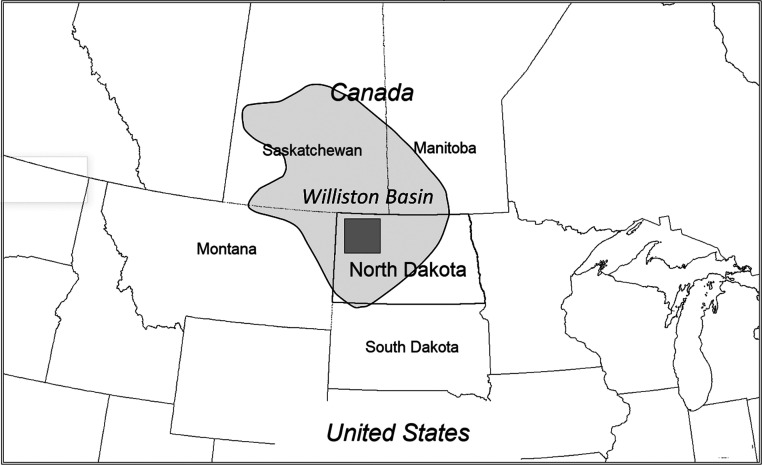
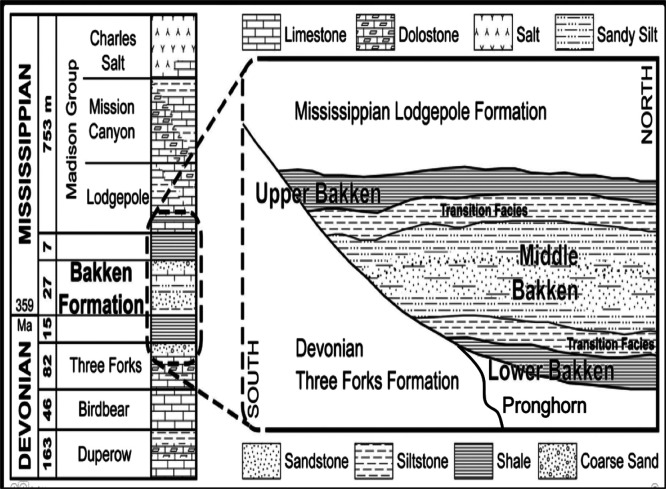
The Bakken Formation (Late Devonian to Early Mississippian) in the Williston Basin underlies parts of Montana, North Dakota, and the Canadian provinces of Saskatchewan and Manitoba (Figure 1). The Bakken Formation is subdivided into four members consisting of the Upper and Lower shale members, an intervening mixed siliciclastic and carbonate member (Figure 2). The fourth Pronghorn (or Bakken silt member) is a discontinuous unit that occasionally in places contains thin limestone as well as basal sandstone. The Bakken Formation lies on a regional unconformity with the underlying Three Forks Formation and is conformably overlain by the thick, tight Lodgepole Limestone.
Figure 1.
Location of the study area (dark fill) within the Williston Basin (light fill).
Figure 2.
Generalized stratigraphic column for the Bakken petroleum system in the Williston Basin, Modified from Webster,20 Kuhn et al.,21 and Johnson.22
The upper and lower shale within the Bakken are the core source rocks of the Bakken Petroleum System. Currently, over 12-million barrels of oil are being produced daily from reservoirs in the Middle and Pronghorn members of the Bakken Formation and the Upper Three Forks Formation. Based on the horizontal drilling and hydrofracture stimulation technology available in 2006, the U.S. Geological Survey estimated that there are 4.2 billion barrels of technically recoverable oil within the Bakken Formation.1 In 2014, an additional 3.73 billion barrels of technically recoverable Bakken sourced oil were identified in the underlying Three Forks Formation.2
The most unique aspect of the Bakken Petroleum System is that it is the first regional-scale example of oil production from a Basin-Centered Petroleum System.3 To illustrate, the basic component of these systems is the presence of an oil generating source bed that is encased in porous, though poorly permeable reservoir rocks that have interfacial capillary pore pressures preventing the escape and free migration of the generated oil. These ideal features resulted in accumulations that are largely independent of conventional structural and stratigraphic controls. This leads to a petroleum system that is dictated by buoyancy and attendant density contrasts between oil and formation waters. Consequently, basin-centered petroleum systems have the capability of efficiently retaining expelled oil in reservoirs that are immediately adjacent to the source beds. Therefore, understanding the oil generation process should be the key in defining where extractable oil is likely to be found.
The amount of Bakken exploration has immensely increased discoveries of reservoir zones within the Middle Bakken Member and underlying Three Forks. According to Dow;4 Schmoker and Hester;5 Webster;6 Meissner;7 and Price and LeFever,8 the estimated calculated basin-centered petroleum system for the Bakken source rocks may have expelled between 10 to 413 billion barrels of oil, charging both unconventional and conventional reservoirs. As Bakken reservoir zones are realized, an effort to understand the sub-basin petroleum systems requires modern techniques to evaluate the oil generation process and determine future production. The objective of this study is to experimentally determine the kinetics of the source beds within the Bakken Formation, in particular, in a sub-basin within the Williston Basin by demonstrating the equivalence between the following: kinetics, thermal maturity indices (Tmax), and vitrinite reflectance (VRo) (bitumen reflectance (BRo)).
Geologic Setting of the Bakken Formation
The Bakken Formation was deposited in the Williston Basin during the Late Devonian to Early Mississippian age. The Basin occupies a paleoposition at the center of a vast epicontinental sea, covering what is now the interior of western North America.9,10 During the Late Devonian in the Williston Basin, block fault movement along a basement structure accompanied by uplift along the Sweetgrass Arch established a restricted seaway connection to the western craton margin.11,12 At that time, uplift of the Transcontinental, Severn, and Wisconsin Arches redefined the eastern and northeastern margins of the basin. Structural deformation in the Devonian period of the Williston Basin was affected by tectonic forces arising from the Acadian orogeny. Furthermore, changes in the relative sea level (transgression and regression) influenced the depositional environment during sediment accommodation and accumulation.13−19 More importantly, the relative sea levels during the deposition of the Bakken Formation is an important aspect in determining the type of marine depositional environment that dominated the Williston Basin.
Organic material within source rocks consists of extremely complex macromolecules made largely of hydrogen, carbon structures, and a host of other minor components. The process of oil generation involves breaking bonds within these macromolecules to form mobile and soluble (in organic solvents) hydrocarbon fragments that together mix to form mobile crude oil and natural gas or immobile bitumen. Even though the processes and mechanisms of oil generation are exceedingly complex, there is general agreement that overall reaction rates are in agreement with the Arrhenius equation (eq 1).23 Additionally, in this expression, time, temperature and the kinetic properties of the reacting kerogen are capable of approximating rates of natural oil generation and conversely kerogen degradation.24,25 Furthermore, Connan26 described the Arrhenius equation as a theoretical expression of exponential temperature that defines the chemical reaction rate through the frequency factor, A, and activation energy, E.
Previous studies have used the Arrhenius equation to model the rate constants for oil generation.23,27−30 Additionally, these studies also show that high quality kinetic analysis is vital for these models based on the need to extrapolate from rapid heating rates at high temperatures to slow heating rates in the laboratory setting, and imitate relatively low temperatures found in nature.31 This study is focused on applying the Arrhenius equation (eq 1) to the problem of thermal maturity and oil generation rates in the Bakken Formation
| 1 |
Where:
K = rate constant (m.y.–1)
A = frequency factor (m.y.–1)
Ea = activation energy (kJ/mol)
T = temperature (K)
R = gas constant (kJ/mol–K)
Kissinger32 provided an exact solution to the Arrhenius equation for first order reactions under constant rates of nonisothermal heating. His method equates the shift in peak reaction temperature (Tp) at different heating rates (β) to the activation energy and frequency resulting in the following linear expression:
| 2 |
Tp = temperature corresponding to the maximum reaction rate (K).
β = heating rate (K/sec).
R = gas constant (kJ/mol–K).
Peak reaction temperatures found using different rates of constantly increasing temperatures when plotted as ln(β/Tp2) against Tp–1 produce lines with a slope equal to the ratio between the activation energy and the gas constant. The intercept of this line (ln(R/EaA) provides the corresponding value for the frequency factor.
Experimental errors in measuring Tp complicate the direct use of these variables in the Arrhenius equation, resulting in compensating errors in Ea and A. In general, kinetic parameters exhibit a strong linear relationship between Ea and the ln(A) (e.g.,28,30,33−37). This relationship is caused by small errors in experimental temperatures34,38,39 that produce solutions for Ea and ln(A) that fall within an extremely elongated error ellipse. Barrie38 suggested using the term statistical compensation effect for this behavior. At the temperatures used for source rock kinetics, the error ellipse enclosing the statistical compensation effect for some level of confidence is elongated, almost to the point of being a line.38 This permits with little error, replacement of the error ellipse by a line that coincides with its principal axis. This line describes the distribution of other solutions for all equivalent but error encumbered solutions to Ea and ln(A). Nielsen and Dahl,34 Barrie,38 and Nordeng39 show that the slope of the principal axis of the error ellipse in the Ea – ln(Aa) plane is equivalent to the product of the harmonic mean (TH) of the peak reaction temperatures (Tp) and the gas constant (R). The slope when combined with a given solution of Ea and ln(Aa) provides an expression (eq 3) for a line that contains other equivalent solutions with error as well as the “true” solution
| 3 |
Eaa = apparent activation energy
Aa = apparent A
This expression, however, cannot provide a unique, “true” solution for either Ea or A without first constraining one or both of these parameters.
Study Area and Methods
Eleven wells were used in this study based on the availability of cores and temperature profile control. The wells are centered in and around an apparent depocenter that lies along the eastern margin of the north–south trending Nesson anticline in Mountrail County North Dakota (Table 1).
Table 1. Summary of Kinetic Analysesa.
| well code | NDIC well number | Eaa (kJ/mol) | ln(Aa) -m.y | TH | C | No. | Eac (kJ/mol) | ln(Ac) -m.y | Eac1 (kJ/mol) | ln(Ac1) -m.y |
|---|---|---|---|---|---|---|---|---|---|---|
| A | 17,043 | 206.77 | 60.77 | 721.29 | –157.64 | 7 | 204.42 | 60.38 | 213.08 | 61.82 |
| B | 16,160 | 227.48 | 63.20 | 741.61 | –162.20 | 8 | 226.66 | 63.07 | 218.97 | 61.82 |
| C | 17,023 | 215.21 | 61.68 | 730.20 | –159.27 | 4 | 215.15 | 61.68 | 216.03 | 61.82 |
| D | 16,532 | 214.93 | 61.81 | 727.92 | –159.12 | 14 | 211.36 | 61.22 | 215.02 | 61.82 |
| E | 16,862 | 204.28 | 60.14 | 723.98 | –157.70 | 1 | 209.18 | 60.95 | 214.40 | 61.82 |
| F | 21,668 | 219.33 | 61.32 | 751.19 | –163.61 | 1 | 241.43 | 64.85 | 222.48 | 61.82 |
| G | 22,572 | 231.63 | 64.30 | 733.81 | –160.64 | 1 | 216.99 | 61.90 | 216.52 | 61.82 |
| H | 17,434 | 203.95 | 59.71 | 731.51 | –159.20 | 1 | 217.95 | 62.01 | 216.77 | 61.82 |
| I | 5088 | 216.89 | 61.59 | 736.98 | –160.47 | 4 | 223.96 | 62.74 | 218.32 | 61.82 |
| J | 13,098 | 237.32 | 64.36 | 736.97 | –157.01 | 14 | 237.31 | 64.36 | 221.77 | 61.82 |
| K | 8177 | 218.92 | 62.78 | 721.33 | –157.59 | 1 | 204.71 | 60.41 | 213.16 | 61.82 |
Eaa and ln(Aa) are solutions to the Kissinger equation found by including all experiments for each well combined into a single analysis. Each analysis contains seven experiments using 2, 2, 5, 10, 20, 50, and 50 °C/min. Heating Rates. The harmonic mean of the peak reaction temperatures (TH) for each set of analyses is used in eq 3to “correct” Eaa and ln(Aa) to Eac and ln(Ac) with eqs 5 and 7, respectively.
To estimate modern oil generations rates in the Bakken Formation and avoid poorly constrained variables, at a particular temperature, four parameters are required to use the Arrhenius equation: the kinetic properties of the kerogen, activation energy and frequency factor, together with the total reactive kerogen mass and temperature.
Kinetic Analysis
Values of activation energy (Eaa) and
the corresponding frequency factor (Aa) were obtained by programmed pyrolysis using
the University of North Dakota’s Source Rock Analyzer (Weatherford
Labs). Each determination used seven heating rates (2, 2, 5, 10, 25,
50, 50 °C/min) that ran from 250 °C to 650 °C. During
each experiment, the mass of evolved hydrocarbon vapor was measured
with a flame ionization detector and recorded with time and temperature.
Nonlinear interpolation of these data refined the peak generation
temperature, Tp, to within 0.1 °C.
Linear regression of the time–temperature data was used to
validate and refine the experimental heating rates. Linear regression
of  against
  provides the slope and intercept terms
that, from eq 2, yield
the apparent activation energies (Eaa)
and frequency factors (Aa) shown in Table 1.
VRo and BRo
VRo measures the percentage of incident light reflected from the surface of vitrinite particles in a sedimentary rock often referred to as %Ro (percentage of light reflected by oil). Vitrinite reflectance is a major maturity parameter, because of its persistence throughout the maturation process at any stage in geological time. Moreover, vitrinite is a standard method that has recognizable features and is homogenous when viewed under an incident light microscope. When vitrinite has been absent in particular shale formations, the relationship between the pyrolysis Tmax and vitrinite or BRo has been used. Shale is unique and has varying reflectance in relationship with Tmax. On the other hand, solid bitumen is not a kerogen component but exists as a secondary reaction product that is not present throughout the entire maturation process. For example, Thompson-Rizer40 and Jacob41 show that solid bitumen is a product of generation from kerogen which moves into pore spaces within mineral grains.
Prior authors have proposed an equation relating vitrinite reflectance to Tmax in the following shales: the Bakken Shale,42 the Barnett Shale,43 Duvernay Formation,44 and the Woodford Formation.45 For example, in the study of Abarghani et al.42 (Bakken Shale), where vitrinite was absent, the reflectance from particles of bitumen was converted to equivalent Vitrinite Ro % using an equation proposed by Liu et al.46 who originally applied this equation to the Coeval New Albany Shale. The results were compared to the Barnett shale in the United States and Devonian Duvernay shale in Canada, which indicates discrepancies between the Bakken vitrinite reflectance and Tmax relationship. While a number of equations have been published for correlating BRo and Tmax,(46−50) no unified method has been established. As a result, Gentzis and Goodarzi,51 and Dembicki52 discuss in their prior research that these kinds of equations should be applied cautiously. In this study, we showed that VRo and BRo equations from Liu et al.46 and Abarghani et al.,42 respectively, are directly related to the kinetic parameters (Ea and A) and Tmax.
Mass of Reactive Kerogen
This calculation estimates the total mass of reactive kerogen in a prism with a cross-sectional area of 1 cm2 that extends through the Upper and Lower Shale of Bakken Formation. This is done by analyzing the upper and lower source rocks for reactive kerogen mass per mass sample using the University of North Dakota’s Source Rock Analyzer (SRA), a Rock-Eval equivalent (technique is described in detail by Peters53) and converting this to a reactive mass per cm3 volume using bulk density logs (Table 2). The total mass of kerogen within the cm2 prism is found by multiplying the mass per volume term by the combined thickness of both source beds (Table 2).
| 4 |
X = mass of reactive kerogen (mg/cm2)S2 = mass thermally active kerogen (mg HC/g)
Table 2. The Thickness Column Is the Combined Thickness of the Upper and Lower Bakken Shalea.
| bulk density | |||||
|---|---|---|---|---|---|
| well code | thickness (m) | average (g/cm3) | variance | number of samples | kerogen mass (g/cm2) |
| A | 12.5 | 2.12 | 0.009 | 19 | 263.52 |
| B | 18.0 | 2.25 | 0.004 | 107 | 183.90 |
| C | 14.9 | 2.16 | 0.003 | 96 | 253.80 |
| D | 15.4 | 2.19 | 0.015 | 47 | 375.34 |
| E | 12.5 | 2.20 | 0.007 | 36 | 322.81 |
| F | 14.0 | 2.30 | 0.004 | 88 | 54.33 |
| G | 11.9 | 2.15 | 0.003 | 76 | 228.63 |
| H | 12.8 | 2.14 | 0.005 | 92 | 219.87 |
| J | 23.5 | 2.25 | 0.004 | 23 | 71.36 |
| K | 24.0 | 2.24 | 0.008 | 21 | 76.00 |
The average densities of the Bakken Shales are bulk density logs that are correlated to the sharp and distinct gamma ray excursions that mark the top and bottom of both shales. The kerogen mass is the product of the thickness, Average Density, and S2 mass from Table 2. This mass represents the total kerogen mass of a 1 cm2 prism that extends through both the Upper and Lower Shale.
ρB = bulk density (g /cm3).
The total mass of reactive kerogen was found using programmed pyrolysis using samples collected at one-foot intervals throughout the upper and lower source beds. Small (60 to 80 mg) samples were pyrolyzed in an inert (He) atmosphere at ambient pressures in an SRA. The heating schedule emulates the two-heating stage Rock Eval method that involves three minutes of isothermal heating at 300 °C followed by ramping the temperature from 300 to 650 °C at a constant rate of 25o C/min. Hydrocarbons released during the course of each experiment were measured with a flame ionization detector (FID).
The total hydrocarbon mass recorded during the initial isothermal phase is considered “free” hydrocarbons and defined as S1. The total mass of hydrocarbons released during the second nonisothermal phase is considered reactive kerogen with the mass recorded in Table 3 as S2. The temperature that corresponds to the maximum rate of hydrocarbon generation during this phase is recorded, after conversion to the established Rock Eval convention, as Tmax. The difference between the two is that Tmax is approximately 40 degrees lower than the recorded peak reaction temperature.
Table 3. Summary of the Organic Richness and Quantitya.
| HI | TOC (wt %) | Tmax (°C) | S2 (mg HC/g sample) | ||||||
|---|---|---|---|---|---|---|---|---|---|
| well code | average | variance | average | variance | average | variance | average | variance | number of samples |
| A | 622 | 3760.42 | 15.75 | 13.07 | 424.39 | 3.60 | 99.63 | 773.01 | 24 |
| B | 391 | 18147.50 | 11.59 | 8.66 | 441.18 | 5.32 | 45.43 | 365.50 | 47 |
| C | 533.768 | 3267.09 | 14.42 | 10.10 | 430.34 | 1.70 | 78.50 | 417.71 | 51 |
| D | 758.04 | 5360.07 | 14.72 | 13.74 | 433.68 | 4.37 | 75.74 | 755.08 | 71 |
| E | 804.43 | 23591.17 | 14.20 | 16.98 | 432.15 | 6.09 | 80.68 | 1606.81 | 51 |
| F | 146 | 325.10 | 11.43 | 3.97 | 449.21 | 7.97 | 16.82 | 16.40 | 43 |
| G | 566 | 3026.37 | 15.59 | 11.43 | 435.78 | 1.68 | 89.58 | 568.71 | 20 |
| H | 513.4706 | 3304.68 | 15.32 | 7.85 | 429.05 | 2.00 | 80.10 | 375.88 | 34 |
| I | 298.1429 | 3608.06 | 11.25 | 16.68 | 443.90 | 8.78 | 34.99 | 259.10 | 107 |
HI is the hydrogen index (S2/TOC × 100). TOC is the total organic carbon content in terms of weight percent and S2 is the mass of hydrocarbons per mass of sample released during programmed pyrolysis between 300 and 650 °C at a heating rate of 25 °C/min. Tmax is a thermal maturity indicator that is approximately 39.5 °C lower than the oven temperature that coincides with the maximum release of hydrocarbons during programmed pyrolysis at a heating rate of 25 °C/min.
Density and Thickness
The measured mass of reactive kerogen per mass sample is converted into a volumetric term by multiplication with the bulk density of the rock. This was done using bulk density logs that were run through the source rock interval shortly after drilling or just prior to drilling of the horizontal lateral.
The bulk density and gamma ray logs used in this study are from LASer (LAS) files available through the North Dakota Industrial Commission. Data in these logs are typically tabulated at 0.5 ft. (15.24 cm) intervals. The logs were depth corrected to match the cores by correlating the sharp change in gamma ray and density-neutron porosity logs to the corresponding visible contacts present in the core between the Lodgepole Formation, middle Bakken member, and Three Forks Formation. The bulk density through both shale members for each well was reduced to a simple mean and variance (Table 2) for calculation purposes. The total thickness of both members was also taken from these log-core correlations.
Bakken Formation Temperature
The North Dakota Geological Survey has temperature logged 19 temporarily abandoned wells across the Williston Basin that are as deep as the top of the Madison Group. These wells have been out of service for a minimum of six months and in most instances for more than 2 years prior to temperatures being recorded. Five wells out of the 19 wells from the North Dakota Geological Survey had continuous temperature profiles that extend from the surface to at least the top of the Madison Group providing excellent measures of equilibrium data.54
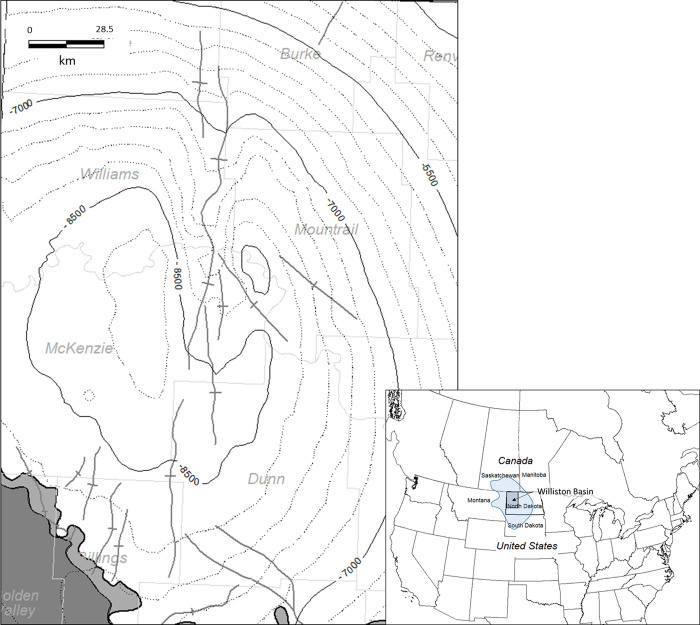
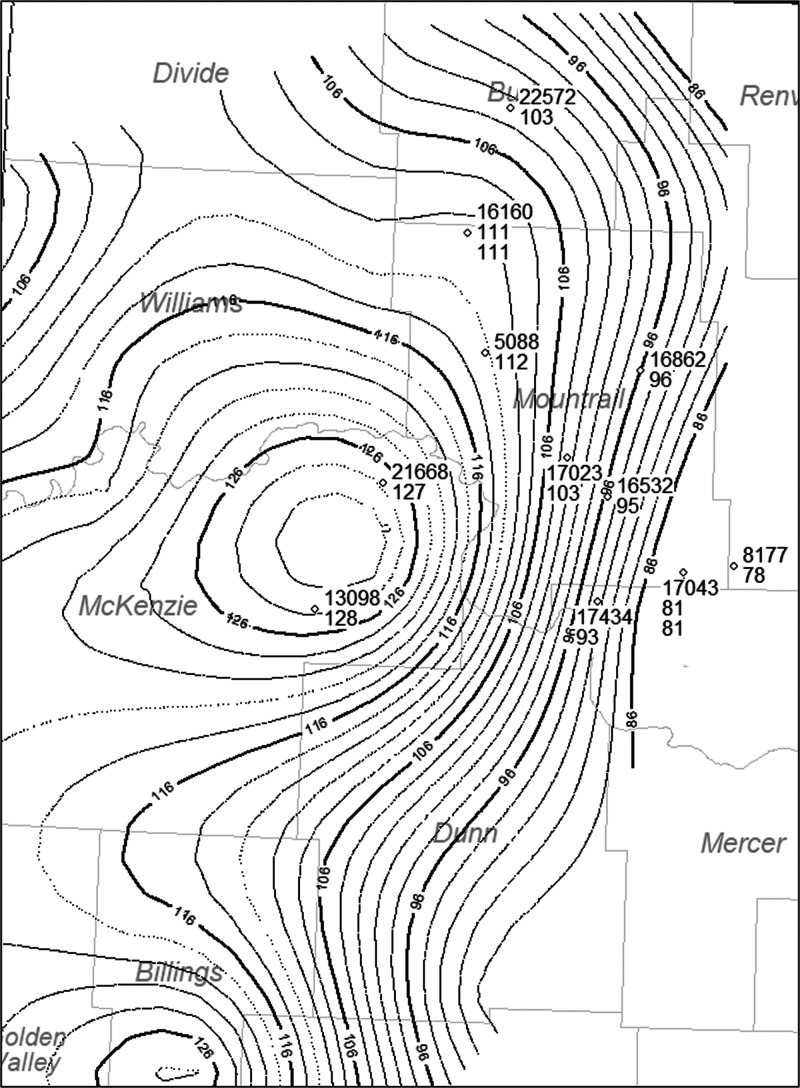
Additionally, prior research done by Nordeng55 applied a linear regression of temperature and a natural logarithm of depth between the top of the Greenhorn and the top of the Madison Group for all 19 wells. This resulted in the temperature of the six of these wells logged through the Bakken and that of 12 wells logged through the top of the Madison Group. However, four of these wells were not drilled deep enough to penetrate the Bakken. Thus, the structure drawn on the top of the Bakken Formation is used to estimate depth from the surface elevation of the well (Figure 3). Furthermore, current formation temperatures for 17 wells were either directly measured (North Dakota Geological Survey data) or found by extrapolating the regressions55 between the top of the Greenhorn and top of the Madison to the depth measured or inferred for the top of the Bakken Formation. The temperature estimates used to generate the map shown in Figure 4 provide the temperature for the Bakken Formation in the wells sampled for kinetic analysis (Table 4).
Figure 3.
Index map of the study area situated near the center of the Williston Basin in North Dakota, USA. Contour lines represent subsea depths in feet with anticlinal structures approximated with the heavy gray lines.
Figure 4.
Temperature map with temperatures from Nordeng39 mapped on to the wells with cores used in this study.
Table 4. Estimated Temperature Values and the Calculated Reaction Rate Index of the Bakken Formation.
| kinetics | kinetics 2 | ||||||
|---|---|---|---|---|---|---|---|
| well code | temperature | K c | rate c | my/cm | K c | rate c | my/cm |
| A | 81 | 1.17E-04 | 0.0375 | 26.67 | 2.63E-05 | 0.0084 | 119.13 |
| B | 111 | 3.70E-04 | 0.0825 | 12.12 | 1.18E-03 | 0.2635 | 3.80 |
| C | 103 | 8.06E-04 | 0.2480 | 4.03 | 7.03E-04 | 0.2164 | 4.62 |
| D | 95 | 3.95E-04 | 0.1795 | 5.57 | 2.19E-04 | 0.0995 | 10.05 |
| E | 96 | 7.43E-04 | 0.2907 | 3.44 | 3.23E-04 | 0.1263 | 7.92 |
| F | 127 | 4.45E-04 | 0.0293 | 34.09 | 6.38E-03 | 0.4205 | 2.38 |
| G | 103 | 5.59E-04 | 0.1550 | 6.45 | 6.02E-04 | 0.1669 | 5.99 |
| H | 93 | 6.89E-05 | 0.0184 | 54.43 | 8.36E-05 | 0.0223 | 44.88 |
Subsurface temperature profiles above the Bakken Formation in the North Dakota portion of the Williston Basin consist of roughly two or three sets of temperature gradients arranged in series. The upper two profiles are nearly linear and extend from approximately 100 m depth to the top of the Greenhorn Formation (Cretaceous) at a depth of about 1000 m. The third segment, from the top of the Greenhorn Formation to the top of the Bakken Formation, shows a general increase in temperature with depth that is consistent with a constant increase in thermal conductivity with depth.
Nordeng55 attributes this constant change in thermal conductivity to a subsurface change in lithology. For example, a transition from porous near surface clastic through mixed clastic to carbonate and evaporite that culminates with a thick nonporous marine limestone that rests on top of the Upper Bakken Shale.
Results and Discussions
Statistical Compensation and Empirical Compensation Effect
All of the kinetic analyses of samples from within a single well and those from within a single sample produce highly correlated linear trends between activation energies and frequency factors. These linear trends maintain a gradient between Eaa and ln(Aa) that is statistically the same as the product of the harmonic mean of the peak reaction temperatures and gas constant; a result that is attributable to small errors in measuring the peak reaction temperature. This behavior is statistical in nature and is the expected result when experimental imprecision is present and linear regression is used to evaluate the Kissinger equation. Not only is the statistical compensation effect present within analyses split from a common sample, but it is also present in almost all analyses of the Bakken shale samples taken at different stratigraphic positions from within the same well. Therefore, this study will assume that a single kinetic analysis adequately describes the kinetics of the formation as a whole within a given well. This is a reasonable approach given that kinetically equivalent analyses form a common statistical compensation effect and there appears to be no significant difference in the compensation effect within a given well based on the stratigraphic position.
Nordeng39 shows that the statistical compensation effect is present in the kinetic analyses of the Bakken Formation using the Kissinger equation. Simulations from Nordeng39 show that with normally distributed experimental error, the average of repeat experiments, approaches the error free value for Ea and ln(A).
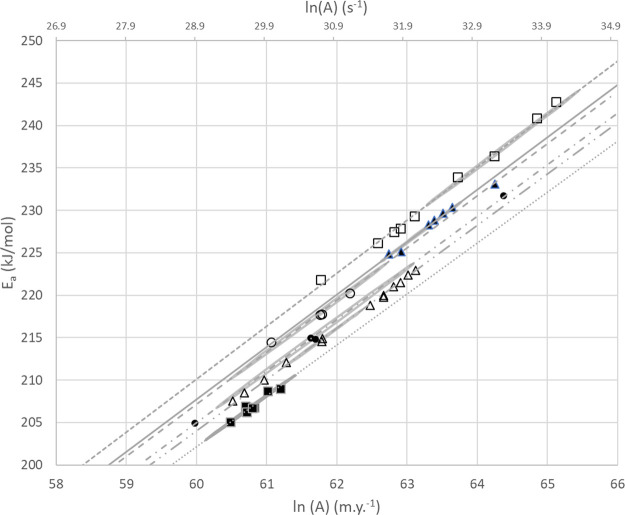
Figure 5, using the average within well values for Ea and ln (A) shown in Table 5, illustrates the presence of a second, highly correlated and linear compensation effect between Eaa and ln(Aa). This suggests that there is a residual compensation effect that may have a physiochemical basis as opposed to the statistical compensation implied by the linear trends in the within well kinetics (Figure 6).
Figure 5.
Diagram illustrating the statistical compensation effect present within individual wells and the corresponding 2 σ error ellipse for each well where all analyses for a particular well are used to find a single solution for Ea and ln(A) with the Kissinger equation. Well A, open triangle; Well B, filled triangle; Well C, open circle; Well D, filled circle; Well J, open square; Well I, filled square.
Table 5. Linear Regression Variables from the Lines that Relate Specific Values of Tmax to Ea and Ln(a) at the Point of Intersection with the Residual Compensation Effect Shown in Figure 6.
| regression coefficients | kinetic parameters | |||
|---|---|---|---|---|
| Tmax | slope | intercept | ln(A)-m.y | Ea (kJ/mol) |
| 385 | 2.610170267 | –145.762 | 55.84402 | 166.9629 |
| 415 | 2.373399229 | –140.028 | 58.99878 | 193.0354 |
| 435 | 2.215835989 | –136.223 | 61.47683 | 213.5152 |
| 455 | 2.058499472 | –132.432 | 64.33404 | 237.1287 |
| 475 | 1.901389188 | –128.654 | 67.66342 | 264.6443 |
| 495 | 1.744504651 | –124.891 | 71.59111 | 297.1047 |
Figure 6.
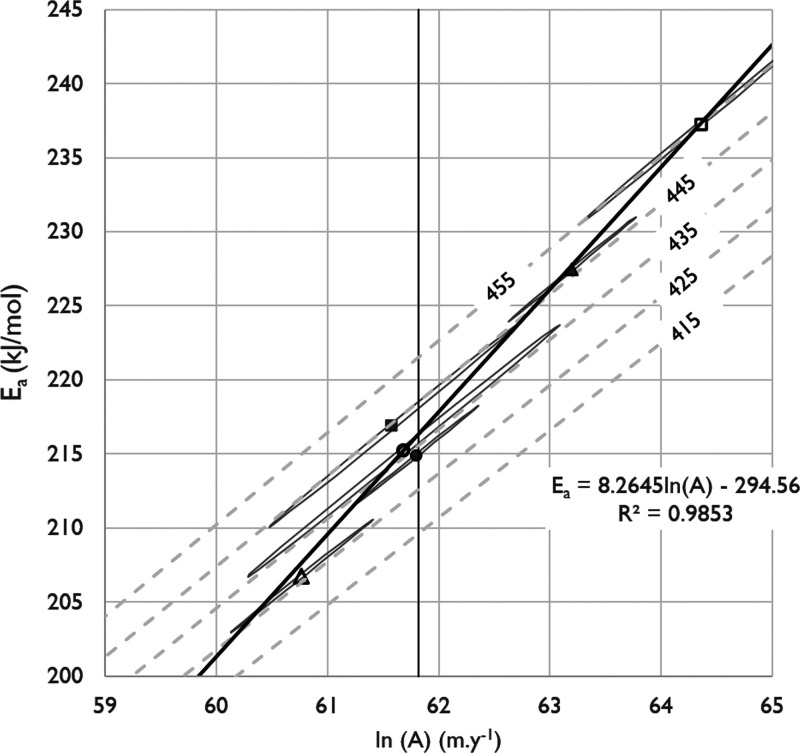
Diagram illustrating the distribution of kinetic solutions (symbols) from multiple analyses of single samples or samples from a single core. The light gray ellipses represent the statistical compensation effect with three standard deviation error bounds about the best fit solution (symbol). The dashed gray lines reflect the relationship between the Rock Eval Tmax and the kinetic parameters Ea and ln(A).
This is significant because it is inconsistent with the proposed kinetic distribution models that apply constant or nearly constant frequency factors. Failing to recognize or ignoring this residual compensation effect will likely lead to reaction rate errors that grow as the disparity between the assumed constant frequency factor and actual frequency factor increases. In those cases, where the two are nearly the same, errors may be trivial. In this study, the two frequency factors cross at a point close to the top of the oil window. Arguments that are largely supported by correlations with early oil generation could be consistent with both frequency factors. However, prior data indicate that extending the use of a constant frequency factor beyond the point consistent with a residual compensation effect will result in errors. These errors arise in Ea and A for both less mature and more mature source rocks.
The residual compensation effect when simultaneously solved with the linear expression for the statistical compensation effect provides a unique solution for both effects (Eq 3). This allows reduction of the raw kinetic analyses to a common, though in part empirical basis. Solutions for Ea and ln(A) at the intersection of the two compensation effects are shown in Table 4 and will be used to estimate the production rate index.
The regression analysis shown in Figure 6 provides the following empirical relationship (eq 5) between the activation energy Ea comp and the natural logarithm of the frequency factor ln(Acomp) from a composite analysis using all available analyses from a single core.
| 5 |
Setting the expression for the statistical compensation effect (eq 3) equal to the residual compensation effect in eq 5 provides a unique solution that satisfies both. These solutions will be referred to as Eac for “corrected activation energy” and ln(Ac) for the “corrected natural logarithm of the frequency factor”. The corrected values are found by rearranging eq 3 to solve for the intercept C as shown in eq 6 and inserting experimental values for Eaa, ln(Aa), TH, and the gas constant R. C, when inserted into eq 7 along with TH, gives ln(Ac) and the corresponding Eac is found by inserting ln(Ac) into eq 5.
| 6 |
| 7 |
The values of Eac and ln(Ac) presented in Table 1, lie at the intersection of the statistical compensation effect and the empirical relationship shown in Figure 5.
Regression analysis of the solutions to the Kissinger equation for the heating rate used to find Tmax shows these solutions to be linear (R2= 1). The linear coefficients, shown in Table 5, when solved simultaneously with the linear expression for the residual compensation effect yields the solutions for both Ea and ln(A) that correspond with Tmax.
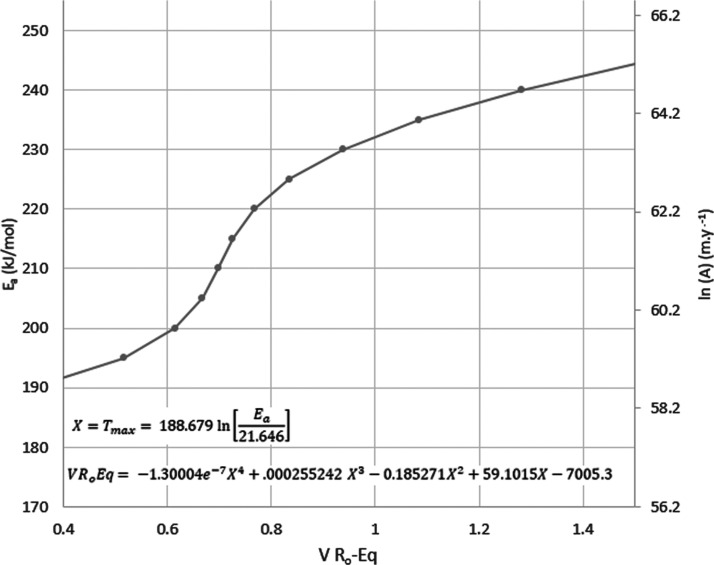
Regression of Tmax versus Ea shown in Figure 7 provides the relationship between Tmax and Ea (eq 8) and with the relationship between Ea and ln(A) (eq 9), a solution for ln(A) as well.
Figure 7.
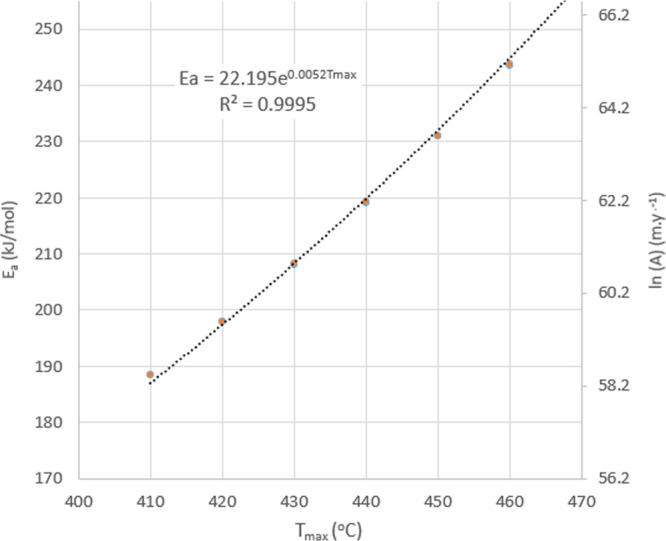
Regression (dotted line) of Ea and Tmax from the data shown in Table 5 (circles) using the residual compensation effect shown in Figure 6 and eq 8 provides a close approximation to the kinetic parameter Ea that corresponds to a given value of Tmax.
The approximate relationship between Ea and Tmax is:
| 8 |
And the relationship between Ea and ln(A) from Figure 6 is:
| 9 |
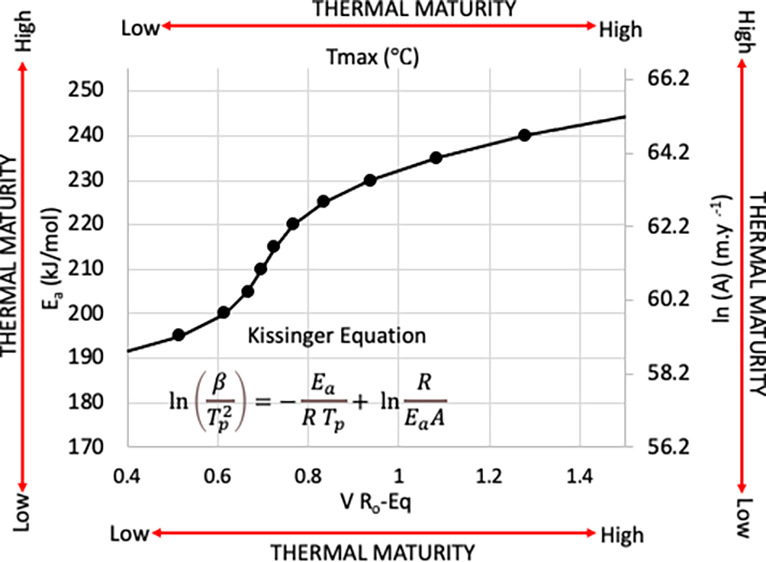
The residual compensation effect in samples of the Bakken Formation appears to be a function of differences in the distribution of kinetic parameters that progress with thermal maturity (Figure 6). This provides the solution that shows that Ea and A are directly related to Tmax, which is related to VRo and BRo using the equation from Abarghani et al.42
| 10 |
| 11 |
Setting X equal to the function of Ea that estimates Tmax and inserting it into the expression from Abarghani et al.42 yields the relationship between bitumen, equivalent vitrinite reflectance (VRoEq), Ea, and ln(A) (Figure 8).
Figure 8.
Curve relating the kinetic parameters of activation energy and frequency factor defined by the residual compensation effect to the BRo42 fourth order polynomial fit to VRoEq46 for the Bakken Shale.
Total Reactive Kerogen
Kerogen at elevated temperatures and pressures generates petroleum. The mass of kerogen is derived by the thickness of the source rock multiplied by the density of the source rock and S2 (mg HC/g of rock) from pyrolysis. The results presented in the Table 2 are an average of the calculated densities, thickness, and kerogen mass. Higher masses are dependent on the amount of crackable hydrocarbon present in the rock sample.
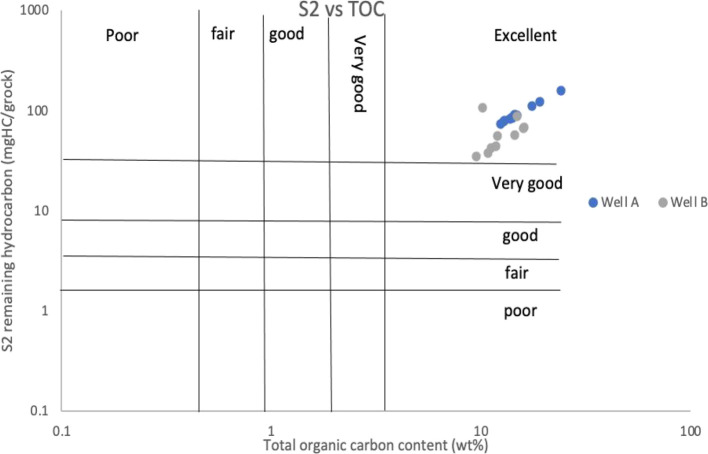
The data obtained from pyrolysis (Table 3) show that total organic carbon (TOC) content values are between 11 and 15 wt %, implying that they are excellent source rock. According to Peters and Cassa,56 rocks containing <0.5% TOC content are considered as poor source rocks. A TOC% value between 0.5 and 1% indicates fair source rock. A TOC% value between 1 and 2% indicates good source rocks. TOC% values above 2% often indicate a highly oxygen reducing environment and are excellent source rocks. The values from our analysis are confirmed from the plot of TOC (wt %) versus S2 (mg/HC) shown in Figure 9. Hydrogen index (HI) values indicate the hydrocarbon generation potential and can be used to differentiate between the types of organic matter.57 Kerogen with HI above 600 mg HC/g usually consists of type I or type II kerogen and has excellent potential to generate oil. Kerogen with HI between 300 and 600 mg HC/g contains a substantial amount of type II kerogen and has good potential for generating oil and minor gas. Kerogen with HI between 150 and 300 mg HC/g contains type III kerogen more than type II and can generate mixed gas and oil but mainly gas. HI <150 mg HC/g indicates a potential source for generating gas (mainly type III kerogen).
Figure 9.
Plot of S2 versus TOC. Well no A is immature well while well no B is mature. This shows that the study wells both immature and mature have an excellent TOC.
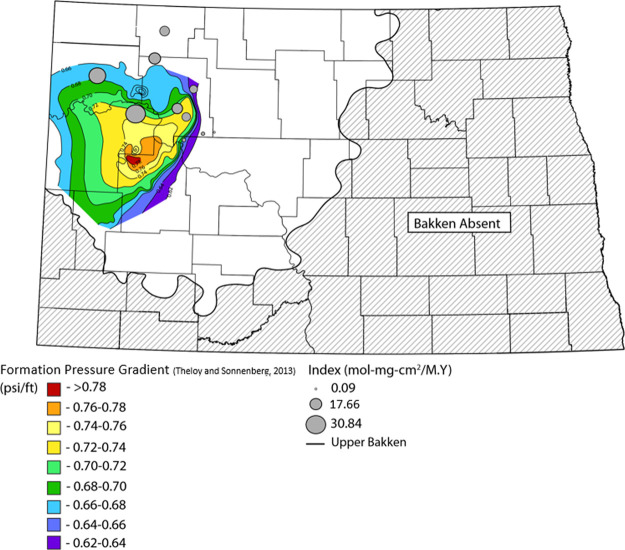
The HI values within the sampled locations ranged between 146 and 621 mg HC/g OC. HI <150 mg HC/g OC indicates a source is generating type III kerogen (gas prone). This is as a result of intense generation within the sampled location and HI has been consumed (found within the wells in the central basin showing highly mature to overmature). Samples with HI >300 contain a significant amount of type II kerogen and have the capability of producing oil and lesser gas primarily. Samples with HI >600 contain roughly type II kerogen and are an excellent source of oil. This is due to the immaturity of Bakken Shales in the sampled location; hence HI is preserved (found at the outer portion of the basin). Based on the discussion above, HI is higher in areas that are thermally matured showing production. The map (Figure 10) shows that there is no production at the basin margin where we have low pressure. Areas of high pressure correspond to high reaction rates.
Figure 10.
Map of formation pressure with the reaction rate bubble map placed on it. Formation pressure map modified from Theloy and Sonnenberg.58 Hydrostatic gradient indicating a normal pressure gradient ≈ 0.46 psi/ft.
Production Rate Index
The rate at which kerogen mass converts into oil was calculated using the Arrhenius equation. It combines all the variables involving the frequency factor (Ae), minimum energy required for the reaction to take place (Ea), the gas constant (R), temperature at the depth of formation (T), and the mass of reactive kerogen(X) into an index for comparison with the formation pressure map and the results are shown in Table 4.
In the mature areas, high Tmax and lower HI values compared with the results from the production rate calculation shows that wells at the interior basin have the highest reaction rate forty times (30.84 mol-mg-cm2/M.Y) higher than the immature areas. The higher rate is consistent with overpressure. Wells in the immature areas have the least reaction rate of 0.09 mol-mg-cm2/M.Y. The mechanism causing overpressure might be intense hydrocarbon generation from thermally matured and excellent quality source rock. The reaction rate calculated is consistent with current oil generation that may maintain overpressure. The map of reaction rate was placed on the overpressure map which was produced by Theloy and Sonnenberg58 showing that wells with the highest reaction rate are found within areas of overpressure.
Conclusions
The wells in this study range from immature to thermally mature. Breakdown of kerogen increases in the Bakken shales at the deeper portion of the Williston Basin. The maturity of Bakken is not uniform across the basin, and thus the areas of high hydrocarbon generation lie within the interior basin where the heat flow is deeper and hotter. Additionally, the immature and mature areas contain excellent TOC, which provides only semiquantitative scale of petroleum generation, supporting quantity and not the quality of the organic matter. These organic-rich source rocks could generate hydrocarbon in the presence of higher temperatures. Temperature and pressure are factors that drive the conversion of organic matter to oil and may be tied to production. Evaluating oil generation rate could better define the limits of resource play, and it will aid in the search for new resources. The thickness, thermal maturity, TOC contents, and source rock kinetics controlled the amount of oil generated and expelled from the shales. Data from the kinetic analysis suggest that when Bakken samples are repeatedly analyzed the “best” solutions to these data form a residual compensation effect that is distinct from the statistical compensation effect. This appears to be a function of differences in the distribution of kinetic parameters that progress with thermal maturity. The linear expression of the residual compensation effect when solved simultaneously with the regression analysis of the solutions to the Kissinger equation for the heating rate, yielded the solution for Ea and ln(A) that corresponds with Tmax. Finally, the values of Tmax recalculated in terms of VRo and BRo provided a relationship between the kinetic parameters (Ea and A), Tmax, VRo, and BRo. Tmax values measured within the Bakken Shale can be used to evaluate the “average” value of the kinetics as well as an estimate of the level of maturation roughly provided by VRo and BRo. Thus, of these different measures of maturity, Ea and ln(A) are the most capable of giving some measures as to how much observed reaction is occurring.
Acknowledgments
This work was financially supported by the North Dakota Industrial Commission. The authors wish to thank North Dakota Geological Survey, Core Library, for the provision of Bakken core samples, particularly Jeffrey Bader, petroleum geologist and director, and Kent Hollands, laboratory technician.
The authors declare no competing financial interest.
References
- Pollastro R. M; Cook T. A; Roberts Laura N. R; Schenk C. J; Lewan M. D; Lawrence A.O; Gaswirth S. B; Lillis P. G; Klett T. R; Charpentier R. R.. Assessment of undiscovered oil resources in the Devonian-Mississippian Bakken Formation; U.S. Geological Survey Fact Sheet: Williston Basin Province, Montana and North Dakota, 2008. [Google Scholar]
- Gaswirth S. B.; Marra K. R. U. S. Geological Survey: Assessment of undiscovered resources in the Bakken and Three Forks Formations of the U.S. Williston Basin Province. AAPG Bull 2013, 99, 639–660. [Google Scholar]
- Magoon L. B; Schmoker J. W.. The total petroleum system - The natural fluid network that constrains the assessment unit. U.S. Geological Survey World Petroleum Assessment,2000. [Google Scholar]
- Dow W. G. Application of Oil-Correlation and Source-Rock Data to Exploration in Williston Basin. AAPG Bull. 1974, 58, 1253–1262. 10.1306/83D91655-16C7-11D7-8645000102C1865D. [DOI] [Google Scholar]
- Schmoker J. W.; Hester T. C. Organic Carbon in Bakken Formation, United States Portion Of Williston Basin. AAPG Bull. 1983, 67, 2165–2174. 10.1306/AD460931-16F7-11D7-8645000102C1865D. [DOI] [Google Scholar]
- Webster R. L.Analysis of petroleum source rocks of the Bakken Formation (Devonian and Mississippian) in North Dakota: MSc., 1983.
- Meissner F. F.Petroleum Geology of the Bakken Formation Williston Basin, North Dakota and Montana. In Montana Geological Society Bakken Workshop; 1978.
- Price L. C.; Lefever J. Dysfunctionalism in the Williston Basin: the Bakken/mid-Madison petroleum system. Bull. Can. Pet. Geol. 1994, 42, 187–218. 10.35767/gscpgbull.42.2.187. [DOI] [Google Scholar]
- Van der voo R. Paleozoic paleogeography of North America, Gondwana, and intervening displaced terranes: Comparisons of paleomagnetism with paleoclimatology and biogeographical patterns. Bull. Geol. Soc. Am. 1988, 100, 311–324. . [DOI] [Google Scholar]
- Scotese C. R.; McKerrow W. S. Revised World maps and introduction. Geol. Soc. Mem. 1990, 12, 1–21. 10.1144/GSL.MEM.1990.012.01.01. [DOI] [Google Scholar]
- Gerhard L. C.; Anderson S. B. Geology of the Williston Basin (United States portion). In Sedimentary Cover—North American Craton: Boulder Colorado. Bull. Geol. Soc. Am. 1988, 2, 221–241. [Google Scholar]
- Richard B. C. Upper Kaskaskia sequence—uppermost Devonian and lower Carboniferous. CSPG Spec. Publ. 1989, 165–201. [Google Scholar]
- Johnson J. G.; Klapper G.; Sandberg C. A. Devonian eustatic fluctuations in Euramerica. Geol. Soc. Am. Bull. 1985, 96, 567–587. . [DOI] [Google Scholar]
- Thrasher L.; Holland F. D. Jr. Macrofossils of Bakken Formation (Devonian and Mississippian), Williston Basin, North Dakota. AAPG Bull. 1985, 67, 1358–1358. [Google Scholar]
- Bustin R. M.; Smith M. G.; Caplan M. L.. Sequence Stratigraphy of the Bakken and Exshaw Formations: A Continuum of Black Shale Formations in the Western Canada Sedimentary Basin. In Seventh International Williston Basin Symposium; 1995.
- Wignall P. B. Model for transgressive black shales?. Geology 1991, 19, 167–170. . [DOI] [Google Scholar]
- Wignall P. B.; Maynard J. R.. The sequence stratigraphy of transgressive black shales: Chapter 4. 1993, 35–47.
- Sandberg C. A.; Gutschick R. C.; Johnson J. G.; Poole F. G.; Sando W. J.. Middle Devonian to Late Mississippian event stratigraphy of Overthrust belt region; Ann. - Soc. Geol. Belgique: western United States, 1986. [Google Scholar]
- Ross C. A.; Ross J. R. Late Paleozoic depositional sequences are synchronous and worldwide. Geology 1985, 13, 194–197. . [DOI] [Google Scholar]
- Webster R. L. Petroleum Source Rocks and Stratigraphy of Bakken Formation in North Dakota: ABSTRACT. AAPG Bull. 1984, 68, 953–953. 10.1306/AD46166F-16F7-11D7-8645000102C1865D. [DOI] [Google Scholar]
- Kuhn P.; Di Primio R.; Horsfield B.. Bulk composition and phase behaviour of petroleum sourced by the Bakken Formation of the Williston Basin. In Petroleum Geology Conference Proceedings 2010, 7, 1065–1077.
- Johnson R.The Pronghorn Member of the Bakken Formation, Williston Basin, USA: Lithology, Stratigraphy, Reservoir Properties; Doctoral dissertation, Colorado School of Mines; 2013. [Google Scholar]
- Tissot B.; Espitalie J. Thermal evolution of organic-matter in sediments-application of a mathematical simulation-petroleum potential of sedimentary basins and reconstructing thermal history of sediments. J. French Pet. Inst. 1975, 30, 743–778. [Google Scholar]
- Habicht J. K. A.Comment on the history of migration in the Gifhorn Trough. In Proceedings of the Sixth World Petroleum Congress, Paper 19-PD2; 1964,1,480.
- Philippi G. T. On the depth, time and mechanism of petroleum generation. Geochim. Cosmochim. Acta 1965, 29, 1021–1049. 10.1016/0016-7037(65)90101-8. [DOI] [Google Scholar]
- Jacques C. Time-Temperature Relation in Oil Genesis: Geologic Notes. AAPG Bull 1974, 58, 2516–2521. 10.1306/83D91BEB-16C7-11D7-8645000102C1865D. [DOI] [Google Scholar]
- Tissot B. P.; Welte D. H.. From Kerogen to Petroleum. in Petroleum Formation and Occurrence; Springer: Berlin, Heidelberg,1978, 160–198. [Google Scholar]
- Wood D. A. Relationships between thermal maturity indices calculated using Arrhenius equation and Lopatin method: implications for petroleum exploration. AAPG Bull. 1988, 72, 115–134. [Google Scholar]
- Ungerer P. State of the art of research in kinetic modelling of oil formation and expulsion. Org. Geochem. 1990, 16, 1–25. 10.1016/0146-6380(90)90022-R. [DOI] [Google Scholar]
- Peters K. E.; Burnham A. K.; Walters C. C. Petroleum generation kinetics: Single versus multiple heatingramp open-system pyrolysis. AAPG Bull. 2015, 99, 591–616. 10.1306/11141414080. [DOI] [Google Scholar]
- Reynolds J. G.; Burnham A. K.; Mitchell T. O. Kinetic analysis of California petroleum source rocks by programmed temperature micropyrolysis. Org. Geochem. 1995, 23, 109–120. 10.1016/0146-6380(94)00121-G. [DOI] [Google Scholar]
- Kissinger H. E. Reaction kinetics in differential thermal analysis. Anal. Chem. 1957, 29, 1702–1706. 10.1021/ac60131a045. [DOI] [Google Scholar]
- Hunt J. M.; Lewan M. D.; Hennet R. J. C. Modeling oil generation with time-temperature index graphs based on the Arrhenius equation. AAPG Bull. 1991, 75, 795–807. [Google Scholar]
- Nielsen S. B.; Dahl B. Confidence limits on kinetic models of primary cracking and implications for the modelling of hydrocarbon generation. Mar. Pet. Geol. 1991, 8, 483–492. 10.1016/0264-8172(91)90070-H. [DOI] [Google Scholar]
- Stainforth J. G. Practical kinetic modeling of petroleum generation and expulsion. Mar. Pet. Geol. 2009, 26, 552–572. [Google Scholar]
- Burnham A. K. Obtaining reliable phenomenological chemical kinetic models for real-world applications. Thermochim. Acta 2014, 597, 35–40. 10.1016/j.tca.2014.10.006. [DOI] [Google Scholar]
- Waples D. W. Petroleum generation kinetics: Single versus multiple heating-ramp open-system pyrolysis: Discussion. AAPG Bull. 2016, 100, 683–689. 10.1306/01141615146. [DOI] [Google Scholar]
- Barrie P. J. The mathematical origins of the kinetic compensation effect: 1. the effect of random experimental errors. Phys. Chem. Chem. Phys. 2012, 14, 318–326. 10.1039/C1CP22666E. [DOI] [PubMed] [Google Scholar]
- Nordeng S. H. The statistical compensation effect in nonisothermal kinetics: Theory, simulations and experimental evidence. Org. Geochem. 2019, 127, 124–135. 10.1016/j.orggeochem.2018.11.005. [DOI] [Google Scholar]
- Thompson-Rizer C. L. Some optical characteristics of solid bitumen in visual kerogen preparations. Org. Geochem. 1987, 11, 385–392. 10.1016/0146-6380(87)90071-4. [DOI] [Google Scholar]
- Jacob H. Classification, structure, genesis and practical importance of natural solid oil bitumen (‘migrabitumen’). Int. J. Coal Geol. 1989, 11, 65–79. 10.1016/0166-5162(89)90113-4. [DOI] [Google Scholar]
- Abarghani A.; Ostadhassan M.; Gentzis T.; Carvajal-Ortiz H.; Ocubalidet S.; Bubach B.; Mann M.; Hou X. Correlating Rock-EvalTM T max with bitumen reflectance from organic petrology in the Bakken Formation. Int. J. Coal Geol. 2019, 205, 87–104. 10.1016/j.coal.2019.03.003. [DOI] [Google Scholar]
- Jarvie D. M.; Claxton B. L.; Henk F.; Breyer J. T. Oil and shale gas from the Barnett Shale, Fort Worth Basin, Texas. AAPG Annual Meeting Program 2001, 10, A100. [Google Scholar]
- Wust Raphael A. J.; Nassichuk B. R.; Brezovski R.; Hackley P. C.; Willment N.. Vitrinite reflectance versus pyrolysis Tmax data: Assessing thermal maturity in shale plays with special reference to the Duvernay shale play of the Western Canadian Sedimentary Basin, Alberta, Canada. In Soc. of Pet. Eng. - Asia Pacific Unconventional Resources Conference and Exhibition; 2013.
- Hackley P. C.; Cardott B. J. Application of organic petrography in North American shale petroleum systems: A review. Int. J. Coal Geol. 2016, 163, 8–51. 10.1016/j.coal.2016.06.010. [DOI] [Google Scholar]
- Liu B.; Schieber J.; Mastalerz M. Combined SEM and reflected light petrography of organic matter in the New Albany Shale (Devonian-Mississippian) in the Illinois Basin: A perspective on organic pore development with thermal maturation. Int. J. Coal Geol. 2017, 184, 57–72. 10.1016/j.coal.2017.11.002. [DOI] [Google Scholar]
- Jacob H. Disperse solid bitumens as an indicator for migration and maturity in prospecting for oil and gas. Erdoel Kohle, Erdgas, Petrochem.; (Germany, Fed. Repub. of) 1985, 38, 365. [Google Scholar]
- Riediger C. L. Solid bitumen reflectance and Rock-Eval Tmax as maturation indices: an example from the ‘Nordegg Member’, Western Canada Sedimentary Basin. Int. J. Coal Geol. 1993, 22, 295–315. 10.1016/0166-5162(93)90031-5. [DOI] [Google Scholar]
- Landis C. R.; Castaño J. R. Maturation and bulk chemical properties of a suite of solid hydrocarbons. Org. Geochem. 1995, 22, 137–149. 10.1016/0146-6380(95)90013-6. [DOI] [Google Scholar]
- Schoenherr J.; Littke R.; Urai J. L.; Kukla P. A.; Rawahi Z. Polyphase thermal evolution in the Infra-Cambrian Ara Group (South Oman Salt Basin) as deduced by maturity of solid reservoir bitumen. Org. Geochem. 2007, 38, 1293–1318. 10.1016/j.orggeochem.2007.03.010. [DOI] [Google Scholar]
- Gentzis T.; Goodarzi F.. A. review of the use of bitumen reflectance in hydrocarbon exploration with examples from Melville Island, Arctic Canada. In Applications of Thermal Maturity Studies to Energy Exploration; 1990.
- Dembicki H.Practical Petroleum Geochemistry for Exploration and Production. Practical Petroleum Geochemistry for Exploration and Production; Elsevier; 2016. [Google Scholar]
- Peters K. E. Guidelines for Evaluating Petroleum Source Rock using Programmed Pyrolysis. AAPG Bull. 1986, 70, 318–329. 10.1306/94885688-1704-11D7-8645000102C1865D. [DOI] [Google Scholar]
- McDonald M.; Gosnold W. D.; Nordeng S. H. Preliminary results of a heat flow study of the Williston Basin using temporarily abandoned oil wells, Western North Dakota. Geo. Resourc. Council Trans. 2015, 39, 627–634. [Google Scholar]
- Nordeng S. H. Estimating modern equilibrium temperatures in the Bakken Formation of North Dakota, USA: Application of an analytical solution to depth dependent changes in thermal conductivity. Mar. Pet. Geol. 2020, 116, 104313 10.1016/j.marpetgeo.2020.104313. [DOI] [Google Scholar]
- Peters K. E.; Cassa M. R.. Applied source rock geochemistry: Chapter 5: Part II. Essential elements; 1994.
- Waples D. W.Geochemistry in petroleum exploration. Inter. Human Resources and Develop. co., Boston, 1985, 232. [Google Scholar]
- Theloy C.; Sonnenberg S. A.. New Insights into the Bakken Play: What Factors Control Production; AAPG Annual Meeting: Pittsburgh, PA., 2013. [Google Scholar]


