

Abstract

Lattice constants such as unit cell edge lengths and plane angles are important parameters of the periodic structures of crystal materials. Predicting crystal lattice constants has wide applications in crystal structure prediction and materials property prediction. Previous work has used machine learning models such as neural networks and support vector machines combined with composition features for lattice constant prediction and has achieved a maximum performance for cubic structures with an average coefficient of determination (R2) of 0.82. Other models tailored for special materials family of a fixed form such as ABX3 perovskites can achieve much higher performance due to the homogeneity of the structures. However, these models trained with small data sets are usually not applicable to generic lattice parameter prediction of materials with diverse compositions. Herein, we report MLatticeABC, a random forest machine learning model with a new descriptor set for lattice unit cell edge length (a, b, c) prediction which achieves an R2 score of 0.973 for lattice parameter a of cubic crystals with an average R2 score of 0.80 for a prediction of all crystal systems. The R2 scores are between 0.498 and 0.757 over lattice b and c prediction performance of the model, which could be used by just inputting the molecular formula of the crystal material to get the lattice constants. Our results also show significant performance improvement for lattice angle predictions. Source code and trained models can be freely accessed at https://github.com/usccolumbia/MLatticeABC.
1. Introduction
The periodic structures of crystal materials can be summarized by their space group and the parallelepiped unit cell as shown in Figure 1. A unit cell is defined by six lattice parameters/constants including the lengths of three cell edges (a, b, c) and the angles between them (α, β, γ). The shape of the unit cell of a crystal material determines its crystal system out of seven possibilities: triclinic, monoclinic, orthorhombic, tetragonal, trigonal, hexagonal, and cubic. Lattice constants and their changes such as lattice distortion upon different pressures and temperatures are related to many interesting physical and chemical properties of the materials.1−3 Lattice mismatch between the films and the growth substrates is also known to cause major issues in fabricating large and high quality of heteroepitaxial films of semiconductors such as GaAs, GaN, and InP.4 Finding a new material with the desired matched lattice constant is then a big challenge for both experimental approach based on X-ray electron or neutron diffraction techniques and first-principles calculations for large-scale screening.
Figure 1.

Unit cell descriptors and lattice constants. (a) Unit cell and lattice constants: a, b, c and α, β, γ. (b) Cubic unit cell where a = b = c and α = β = γ = 90°
Computational prediction of lattice constants of crystal materials has wide applications in both materials property prediction and discovery,5 crystal structure prediction,6,7 and large screening of materials for materials fabrication.8 Lattice prediction models are very helpful for the crystal structure prediction algorithms, which can allow conducting mutagenesis experiments to examine how composition changes may affect the structural mutations in terms of lattice constant changes or symmetry breaking. Crystal structure prediction can also be used to augment the X-ray diffraction (XRD)-based crystal structure determination via space group identification or providing initial parameters for the XRD-based Rietveld refinement method for structure determination. During the past 15 years, a series of prediction approaches have been proposed for lattice constant prediction, which can be categorized by their input information used, the descriptors or features, the machine learning model, and the chemical system or materials family they are trained for. According to the input information of the prediction models, the approaches can be divided into composition (such as atomic properties of their constituent elements)-based lattice parameter prediction models4 and structure-based prediction models.9 While the majority of methods are based on composition information, the structure-based approaches can also bring interesting insights.8 In this paper,9 a deep learning method is proposed to predict lattice parameters in cubic inorganic perovskites based on Hirshfeld surface representations of crystal structures. They showed that two-dimensional Hirshfeld surface fingerprints contain rich information encoding the relationships between chemical bonding and bond geometry characteristics of perovskites.
Lattice prediction methods can also be classified by the machine learning models used. A variety of machine learning models have been applied for lattice constant prediction including conventional machine learning methods in the early stage such as linear regression,4,10 support vector machines,11,12 neural networks (NNs),10,13 gene expression programming,8 random forests (RFs),14 and Gaussian process regression.15 However, the performance difference among different machine learning algorithms has not been thoroughly evaluated.
A major difference among different lattice constant prediction studies is the chemical systems or materials families they focus on. The majority of the studies are focused on a special category of materials with fixed mole ratios, including the cubic perovskites ABX3,4,11,16−19 A2XY6,8 half-Heusler ternary compounds (XYZ),20 and binary body-centered cubic crystals.12 Most of such studies use an extremely small data set (<200 samples) coupled with selected elemental properties to achieve high accuracy (coefficient of determination (R2) > 0.95) as evaluated by the random hold-out or cross-validation methods. However, due to the high similarity (or redundancy) among the samples, these two evaluation methods tend to overestimate the prediction performance.21 Another reason for the reported high accuracy is because the space group and the structure topologies of the samples in their dataset are all identical and the variation among the lattice structures is only due to variations of some element’s properties.
On the other hand, few studies have been reported to predict lattice constants of generic crystal materials with varying mole ratios or a different number of elements. In 2017, Takahashi et al.12 calculated the lattice constants of 1541 binary body-centered cubic crystals using density functional theory and trained a prediction model using support vector regression (SVR) and feature engineering based on atomic number, atomic radius, electronegativity, electron affinity, atomic orbital, atomic density, and the number of valence electrons. They reported an R2 accuracy of 83.6%. In 2020, Liang et al.5 proposed a neural network called Cryspnet based on extended Magpie elemental descriptors22 for lattice constant prediction for materials with formulas of generic forms. They built a neural network model for each Bravais lattice type. For cubic (P, I, F) materials, their models achieve R2 scores of 0.85, 0.80, and 0.83. For other crystal systems, the R2 regression performance ranges from 0.11 to 0.77, with increasing scores for Bravais lattice types with higher symmetry.
While the choice of machine learning algorithms affects
the prediction
performance, it is found that the descriptors play a major role in
lattice parameter prediction. Fundamentally, any factor that contributes
to the change of lattice constants can be added to the descriptor
set of the prediction model. A large number of descriptors have been
used for lattice constant prediction even though some of them may
be specific to the form of the chemical compositions. For perovskite
lattice constant prediction, the following descriptors have been used:
valence electron,10,23 ionic radii (which reflects bond
lengths),8,23 tolerance factor (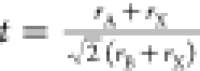 ) calculated
from ionic radii of the A-site
and B-site cations and rX, the ionic radius
of the anion,4 electronegativity,24,25 and ionic charge.26 In terms of ionic
radii, there are several ways to combine the values of the component
elements such as the sum, differences, or ratios. In the structure-based
lattice constant prediction,9 both graph
representations and two-dimensional (2D) fingerprints have been used
by measuring (di, de) at each point on the surface and then binning
them into a 2D histogram. In lattice constant prediction of binary
body-centered cubic crystals, Takahashi et al.12 recommended seven descriptors for predicting lattice constant a including the atomic number of element A and B, density,
atom orbital of elements A and B, difference in electronegativity
between A and B, and atomic orbital B + difference in the electronegativity
between A and B. When trained with 1541 samples, their SVR model achieved
a mean R2 score of 83.6% via cross-validation
and a maximum error of 4% when compared to experimentally determined
lattice constants.
) calculated
from ionic radii of the A-site
and B-site cations and rX, the ionic radius
of the anion,4 electronegativity,24,25 and ionic charge.26 In terms of ionic
radii, there are several ways to combine the values of the component
elements such as the sum, differences, or ratios. In the structure-based
lattice constant prediction,9 both graph
representations and two-dimensional (2D) fingerprints have been used
by measuring (di, de) at each point on the surface and then binning
them into a 2D histogram. In lattice constant prediction of binary
body-centered cubic crystals, Takahashi et al.12 recommended seven descriptors for predicting lattice constant a including the atomic number of element A and B, density,
atom orbital of elements A and B, difference in electronegativity
between A and B, and atomic orbital B + difference in the electronegativity
between A and B. When trained with 1541 samples, their SVR model achieved
a mean R2 score of 83.6% via cross-validation
and a maximum error of 4% when compared to experimentally determined
lattice constants.
In this work, we focus on the lattice edge length (a, b, c) prediction problem for generic crystal materials. Compared to previous work, our data sets are much larger (10–100 times), enabling us to achieve high performance for generic lattice parameter prediction. Our model has achieved exceptionally high accuracy for cubic systems with R2 reaching 0.973, of which the materials have a single edge length a as their lattice parameter. Cubic crystals consist of 18,325 or 14.63% of all 125,278 crystals deposited in the materials project database as of September 2020. Using a data set with 18,325 samples of cubic crystals in the Materials Project,27 we develop a RF model using a set of novel descriptors for generic crystal materials lattice edge length prediction of which the number of elements and the mole ratios are not stereotyped. Our experiments show that our MLatticeABC algorithm achieves a much better performance compared with previous methods with an R2 reaching as high as 97% for cubic materials.
Our contributions can be summarized as follows:
We propose a new descriptor set for generic lattice constant a, b, c prediction of crystal materials.
We conduct extensive experiments with different combinations of descriptors and transfer learning strategies and evaluate and compare the performances of different machine learning algorithms.
Our experiments show that our MLatticeABC algorithm based on RF achieves state-of-the-art prediction performance in generic lattice edge length prediction.
2. Experiments
2.1. Datasets
We used the Materials Project API to download the crystal lattice information of known inorganic materials deposited in the Materials Project database http://www.materialsproject.org. We observed that the direct use of MPDataRe- trievav.get_dataframe function with structure.lattice.a/b/c/α/β/γ leads to an inconsistent dataset because these lattices are the primitive lattice parameters. However, for cubic crystals, about 13,000 of the crystals’ primitives are smaller units with α/β/γ equal to 60° instead of 90°, while the remaining 5000 or so cubic crystals have a cubic unit cell representation with 90° for α/β/γ. To address this inconsistency issue, we instead downloaded all structural cif files of the crystals in the conventional_standard format and read the lattice parameters from them. In total, we got 125,278 materials on September 10, 2020, from the Materials Project database, which we call the MP dataset. These materials can be divided into seven groups by their crystal system types with corresponding sample numbers: triclinic (15,297), monoclinic (29,872), orthorhombic (26,801), tetragonal (14,654), trigonal (11,086), hexagonal (9243), and cubic (18,325). For these materials, the distribution of the lattice cell lengths a, b, c is shown in Figure 2. It can be found that most of the values of a and b are distributed between 2.5 and 17.5 Å and peaks are around 6 Å. The values of lattice parameter c are mainly distributed between 2 and 25 Å with a more flat distribution.
Figure 2.

Histogram of the lattice constant (edge length a/b/c) distribution. (a) Histogram of a, (b) Histogram of b, and (c) Histogram of c.
As one of the major focus areas of this study, we also show the lattice parameter a of cubic materials in Figure 3. Unlike the overall distribution of a in Figure 2, the number of cubic materials decreases obviously when their length a surpasses 12.5 Å. Also, most of the values of a are distributed between 2.5 and 15.0 Å in cubic materials. In addition, we show the distribution of samples in terms of element number in the crystals in our overall dataset in Table 1. It is found that most of the samples are ternary and quaternary followed by binary materials.
Figure 3.

Histogram of the lattice constant (edge length a) distribution for cubic materials.
Table 1. Distribution of Samples in Terms of Element Number in the Crystal.
| the number of elements in each crystal | 1 | 2 | 3 | 4 | 5 | 6 | ≥=7 |
|---|---|---|---|---|---|---|---|
| the number of crystal | 713 | 19123 | 58592 | 34866 | 10200 | 1601 | 183 |
| percentage | 0.57% | 15.26% | 46.77% | 27.83% | 8.14% | 1.28% | 0.15% |
3. Results
3.1. Prediction Performance of MLatticeABC for Cubic Materials
We ran random hold-out experiments 10 times and report the average and standard deviation of performance measures of these runs in terms of R2, root mean square error (RMSE), and mean absolute error (MAE). For our RF model with the enhanced mapgie + total atom number feature, the average R2, RMSE, and MAE for unit cell length a predictions for the cubic crystals are 0.973, 0.144, and 0.484, respectively, which are much better than the baseline results reported in ref (5). In their report (Table 4), the length a prediction performances are reported for three cubic Bravais lattices with R2 of 0.80, 0.83, and 0.85. Figure 4a shows the parity plot of one of our hold-out experiments for lattice a prediction of cubic materials, which is the performance of more than 3000 samples, accounting for about 20% of the total cubic materials, of the test set.
Table 4. Lattice Parameter Relationships for Materials of Different Lattice Systems.
| crystal system | edge lengths | axial angles | space groups |
|---|---|---|---|
| cubic | a = b = c | α = β = γ = 90 | 195–230 |
| hexagonal | a = b | α = β = 90, γ = 120 | 168–194 |
| trigonal | a = b ≠ c | α = β = 90, γ = 120 | 143–167 |
| tetragonal | a = b ≠ c | α = β = γ = 90 | 75–142 |
| orthorhombic | a ≠ b ≠ c | α = β = γ = 90 | 16–74 |
| monoclinic | a ≠ c | α = γ = 90, β ≠ 90 | 3–15 |
| triclinic | all other cases | all other cases | 1–2 |
Figure 4.

High prediction performance for lattice parameter a prediction for cubic materials and the key parameter, the total number of atoms. (a) True and predicted lattice constant parameter a by MLatticeABC where the descriptors include the enhanced Magpie feature + total atom number. (b) Correlation of total atom number with lattice a of cubic materials.
To understand why the number of atoms in a material is so critical to the prediction of lattice edge length a for cubic systems, we plot the parity plot of a against the total atom number in Figure 4. It shows that there is a strong correlation between the number of atoms in the unit cell and the lattice edge length a for cubic crystals. Due to the varying volume of atoms of different elements, for crystals with a specific lattice parameter a, the number of atoms also varies.
3.2. Prediction Performance of MLatticeABC for all Crystal Materials
We conduct extensive experiments to evaluate our model performance in predicting the a, b, c, and V over all crystal systems in the downloaded MP dataset using the same 10-repeats random hold-out test set validation evaluation approach. In each experiment, the training set and validation set are divided into 80 and 20%. The results are shown in Table 2. It is found that our RF model can achieve R2 of up to 0.973 in lattice parameter, a prediction for cubic materials using only composition as the input. The performances over other crystal systems except Monoclinic are also good ranging from 0.779 to 0.900. In general, the higher the symmetry, the better the prediction performance. It is also interesting to find that the prediction performance over lattice b and c are all lower than those on lattice a, with all R2 scores being between 0.498 and 0.757. In addition, we can see from the table that monoclinic lattice constant prediction has the worst performance: its R2 scores of a, b, c prediction are only 0.530, 0.498, and 0.518, respectively. Especially the prediction performance for predicting lattice constant a is far lower than its prediction performance for other crystal systems. This is because the crystal structure of monoclinic is relatively complex; the side lengths a, b, c are not equal, and the angle β has a big variation. Further feature engineering and more data are needed for improving the model performance. One interesting result we find is that, compared with orthorhombic and monoclinic, our model performs better for triclinic. This is because it has many isomers for a chemical formula, and the isomers from one formula can be divided into training sets and test sets at the same time, which improves the accuracy of prediction results.
Table 2. Prediction Performance of MLatticeABC in Terms of R2 Score for a, b, c, and V over Different Crystal Systems.
| crystal system | train set size | test set size | a | b | c | V |
|---|---|---|---|---|---|---|
| cubic | 14,660 | 3665 | 0.973 ± 0.007 | 0.793 ± 0.115 | ||
| hexagonal | 7394 | 1849 | 0.900 ± 0.013 | 0.757 ± 0.036 | 0.852 ± 0.117 | |
| trigonal | 8868 | 2218 | 0.838 ± 0.013 | 0.700 ± 0.075 | 0.898 ± 0.063 | |
| tetragonal | 11,723 | 2931 | 0.858 ± 0.011 | 0.677 ± 0.029 | 0.862 ± 0.033 | |
| orthorhombic | 21,440 | 5361 | 0.779 ± 0.012 | 0.603 ± 0.029 | 0.654 ± 0.022 | 0.787 ± 0.070 |
| monoclinic | 23,897 | 5975 | 0.530 ± 0.022 | 0.498 ± 0.015 | 0.518 ± 0.013 | 0.881 ± 0.076 |
| triclinic | 12,237 | 3060 | 0.788 ± 0.011 | 0.754 ± 0.021 | 0.664 ± 0.024 | 0.856 ± 0.103 |
However, unlike the edge length prediction, the volume predictions of cubic and hexagonal are not as good, which have an R2 score of 0.793 and 0.852, respectively. Although for monoclinic, the volume prediction is far better than its crystal length prediction, which is a little bit unexpected. Moreover, we present the results for the angle prediction of monoclinic and triclinic in Table 3. The R2 scores for α, β, γ predictions are only 0.187, 0.188, and 0.087 for triclinic. For monoclinic, R2 can reach 0.388, which is better than triclinic performance. However, our lattice angle prediction performance is a significant improvement compared to those of Cryspnet,5 whose scores are no more than 0.06 and 0.17 for monoclinic and triclinic angle prediction.
Table 3. Prediction Performance of MLatticeABC in Terms of R2 Score for α, β, and γ over Monoclinic and Triclinic.
| crystal system | train set size | test set size | α | β | γ |
|---|---|---|---|---|---|
| monoclinic | 23,897 | 5975 | 0.388 ± 0.006 | ||
| triclinic | 12,237 | 3060 | 0.187 ± 0.012 | 0.188 ± 0.011 | 0.087 ± 0.010 |
We also compare our model performance over all lattice systems with those of the baseline algorithm, Cryspnet,5 which is a neural network-based model for generic lattice parameter, crystal system, and space group prediction using composition as the only input. In this approach, Matminer library was used to generate descriptors, which are then fed into the neural network to predict the Bravais lattice, space group, and lattice parameters. The performance comparison is shown in Figure 5. We find that for all crystal systems, the performance of MLatticeABC is better, with significant improvements for triclinic crystals. The performance gap may be due to the fact that Cryspnet does not use global composition features such as the total atom number and the statistics of atoms of different elements.
Figure 5.

Performance comparison of MLatticeABC and Cryspnet for lattice constant (a, b, c) prediction in terms of R2. For Cryspnet, the shown scores are the average for crystal systems with multiple Bravais lattice types. Since there is no simple way to map trigonal crystals to the Cryspnet lattice-type models, their performances on this crystal system are not reported.
In order to see the relationship between descriptors and lattice constants, we calculated and ranked the top 20 features by their feature importance scores for some crystal systems when the RF with Magpie (the best classifier) is applied for classification in Figure 6. We find that the total atom number, maximum atom number, and mean atom number have a major impact, which explains why our model is so much better than models with only Magpie features as used in previous approaches.
Figure 6.

The top 20 important features for crystal length prediction for cubic, hexagonal, and trigonal crystals. The top features are also observed for other crystal systems. (a) Cubic a, (b) hexagonal a, (c) hexagonal c, and (d) trigonal a.
3.3. Prediction Performance of MLatticeABC with Data Augmentation
It is also known that crystals of different crystal/lattice systems have some special patterns in terms of their lattice parameters. Table 4 shows the relationship between lattice parameters of the crystals. In a previous work on generic lattice parameter prediction,5 a separate model is trained for each Bravais lattice type. However, we wonder if the training samples from other lattice systems can help to improve the performance. For example, can we build a more accurate model for lattice parameter a prediction of cubic materials by including other rectangular cuboid crystals as training samples since they are strongly related? To verify this hypothesis, we did the following experiments by first splitting the cubic samples into 80% training and 20% testing sets. Then, we use the 80% training plus the samples of tetragonal and orthorhombic to train the model and evaluate their performance on the original 20% test samples. We repeat this 10 times to get the average scores. The descriptor set and the machine learning model are the same as in MLatticeABC. The results are shown in Table 5. The crystal system in the parenthesis is the crystal type of the test set. We find that the performance of the ML model with extended training samples always decreases for lattice constant a prediction for both cubic (from line 2 to line 7) and orthorhombic crystals (from line 8 to line 11). This means that the data augmentation strategy which trains models with samples from other lattice systems has an adverse effect on the prediction performance, and it is wise to train separate lattice parameter prediction models for different crystal systems using samples of that specific crystal system only.
Table 5. Prediction Performance Comparison for Lattice Parameter a of Cubic Materials with Data Augmentation.
| descriptors | train sample no | test sample no | a |
|---|---|---|---|
| (cubic) | 14,660 | 3665 | 0.973 ± 0.007 |
| (cubic) + tetragonal | 29,314 | 3665 | 0.966 ± 0.008 |
| (cubic) + orthorhombic | 41,461 | 3665 | 0.920 ± 0.011 |
| (cubic) + tetragonal + orthorhombic | 56,115 | 3665 | 0.920 ± 0.019 |
| (cubic) + hexagonal + trigonal | 34,989 | 3665 | 0.955 ± 0.012 |
| (cubic) + tetragonal + orthorhombic + hexagonal + trigona | 76,444 | 3665 | 0.934 ± 0.010 |
| orthorhombic | 21,440 | 5361 | 0.779 ± 0.012 |
| orthorhombic + cubic | 39,765 | 5361 | 0.753 ± 0.017 |
| orthorhombic + cubic + tetragonal | 54,419 | 5361 | 0.708 ± 0.014 |
| orthorhombic + cubic + tetragonal + trigona | 65,505 | 5361 | 0.699 ± 0.012 |
3.4. Performance Comparison of Different Algorithms
Many different machine learning algorithms and descriptors have been used for lattice parameter prediction. Here, we evaluate how deep neural networks (DNNs), RF, and SVR perform with different feature sets. We use the cubic crystal dataset and repeat the hold-out experiments 10 times. The performance comparison is shown in Figure 7 and Table 6, which shows the baseline algorithm performance as reported in ref (5). First, from Figure 7, we find that the performances of the RF model in terms of both R2 and RMSE are always better than those of neural networks (NN), which are better than the performance of SVR. Second, it is found that the enhanced Magpie features can clearly boost the prediction performance. Moreover, the figure shows that the performance improvements due to the inclusion of atom number are significant. The parity plots in Figure 8 further show that the RF with our descriptor set has the best performance.
Figure 7.

Performance comparison of different algorithms for lattice constant a prediction. (a) Performance comparison in terms of R2 and (b) performance comparison in terms of RMSE.
Table 6. Prediction Performance Comparison with Baselines.
| algorithm | R2 | MAE | RMSE |
|---|---|---|---|
| SVR with Magpie | 0.560 ± 0.013 | 1.063 ± 0.021 | 1.969 ± 0.063 |
| DNN with Magpie | 0.691 ± 0.022 | 0.825 ± 0.030 | 1.678 ± 0.053 |
| RF with Magpie | 0.732 ± 0.017 | 0.802 ± 0.021 | 1.559 ± 0.055 |
| SVR with enhanced Magpie | 0.602 ± 0.016 | 1.023 ± 0.022 | 1.886 ± 0.065 |
| DNN with enhanced Magpie | 0.706 ± 0.015 | 0.739 ± 0.033 | 1.625 ± 0.047 |
| RF with enhanced Magpie | 0.830 ± 0.025 | 0.512 ± 0.029 | 1.227 ± 0.114 |
| SVR with element_atom_no_stat + enhanced Magpie | 0.951 ± 0.009 | 0.316 ± 0.005 | 0.656 ± 0.063 |
| DNN with element_atom_no_stat + enhanced Magpie | 0.960 ± 0.015 | 0.246 ± 0.029 | 0.592 ± 0.124 |
| RF with element_atom_no_stat + enhanced Magpie | 0.973 ± 0.007 | 0.144 ± 0.005 | 0.484 ± 0.076 |
Figure 8.

Parity plots of different algorithms for lattice constant a predictions for cubic materials. (a) DNN + complete descriptor set, (b) RF + complete descriptor set, and (c) SVR + complete descriptor set.
4. Discussion
Our extensive experiments show that the prediction performance is strongly affected by the available dataset including its size and sample distribution and also the descriptors used. Our data augmentation results show that including the samples from other lattice systems can deteriorate the prediction performance for the crystal system-specific ML models, which is contrary to the common practice of data augmentation or transfer learning. Here, it is more appropriate to train individual models using only samples of that lattice system.
To gain further understanding of how descriptor combinations affect the model performance, we compare the performances of different feature combinations using a set of ablation experiments. We evaluate the RF models only on the cubic system for simplicity. From Table 7, we first find that the element_atom_no_stat descriptor set is better than both Magpie and enhanced Magpie as proposed in ref (5) with an R2 score of 0.887 compared to 0.732 and 0.830 of Magpie and Enhanced Magpie, respectively. When combined with enhanced Magpie, the prediction performance of RF is greatly improved by including the element atom number statistics in the unit cell.
Table 7. RF Prediction Performance Comparison with Different Descriptor Combinations.
| feature sets | R2 | MAE | RMSE |
|---|---|---|---|
| Magpie | 0.732 ± 0.017 | 0.802 ± 0.021 | 1.559 ± 0.055 |
| enhanced Magpie | 0.830 ± 0.025 | 0.512 ± 0.029 | 1.227 ± 0.114 |
| element_atom_no_stat | 0.887 ± 0.007 | 0.675 ± 0.014 | 1.005 ± 0.039 |
| element_atom_no_stat + Magpie | 0.968 ± 0.015 | 0.150 ± 0.007 | 0.529 ± 0.136 |
| element_atom_no_stat + enhanced Magpie | 0.973 ± 0.007 | 0.144 ± 0.005 | 0.484 ± 0.076 |
We also compare our model performance with Roost,28 a powerful graph neural network-based prediction model using only composition as the input. In this approach, a composition formula is represented as a complete graph, which is then fed into a message-passing graph neural network for feature extraction and regression. This approach has been shown to have strong extrapolation performance compared to other composition features29 in formation-energy prediction. However, we find that since Roost does not use global composition features such as the total atom number, its performance is not good compared to our MLatticeABC. It achieves an R2 score of only 0.78 for lattice length a prediction of cubic materials.
5. Conclusions
Computational prediction of crystal unit cell lattice constants has wide applications in property investigation and crystal structure prediction. While previous studies have focused on models for specialized chemical systems with the same structure (a single space group) and identical anonymous formula and trained with small datasets, this study aims at developing a generic lattice constant predictor for crystal materials with more than 125,278 samples and 18,325 samples for the cubic system. We propose MLatticeABC, a RF machine learning model with a new feature set combined with the standard composition features such as Magpie descriptors for effective lattice constant (edge length) prediction. Extensive standard and ablation experiments show that our RF models with the new descriptors can achieve a high prediction performance with R2 as high as 0.97 for lattice length a prediction for the cubic system covering more than 18,000 samples. The lattice length prediction performance degrades with a decrease of the structure symmetry in general and is lower for lattice lengths b and c. The lattice angle prediction performances for monoclinic and triclinic are much lower compared to lattice length prediction but are much better than the previous state-of-the-art algorithm Cryspnet. These machine learning models along with our easy-to-use open-source code at https://github.com/usccolumbia/MLatticeABC can contribute to downstream tasks such as materials property prediction, materials screening, and crystal structure prediction.
6. Materials and Methods
6.1. Descriptors
In this work, we focus on developing lattice constant prediction models from materials composition only with the goal of downstream crystal structure prediction.6 Such composition-based models are also needed for large-scale screening of hypothetical materials composition datasets generated by generative machine learning models.30
In the baseline model for generic lattice constant prediction,5 Magpie descriptors plus a few new descriptors have been used. The Magpie predictor set22 is based on calculating the mean, average deviation, range, mode, minimum, and maximum of a set of elemental properties (weighted by the fraction of each element in the composition). The element properties included in the Magpie descriptor calculation include the atomic number, Mendeleev number, atomic weight, melting temperature, periodic table row and column, covalent radius, electronegativity, number of valence e–in each orbital (s, p, d, f, total), number of unfilled e–in each orbital (s, p, d, f, total), ground-state band gap energy, ground-state magnetic moment. Additionally, they have added the following descriptors including stoichiometry p-norm (p = 0,2,3,5,7), elemental fraction, fraction of electrons in each orbital, band center, and ion property (possible to form ionic compound, ionic charge).
Compared to the previous studies of lattice constant predictions for perovskites,11 one major difference of the generic lattice parameter prediction problem is the varying number of elements and the different mole ratios in the compositions of materials. For example, the following formulas are all included in our dataset which have different numbers of elements and stoichiometries: Sn4S4, Pr20S32, Ge4Sb4, Sm64Cd16Ni16, and Mg4Co16O32. While descriptors based on ionic radii, electronegativity, ionic charges, and so on have been defined for lattice constant prediction of perovskites, they need to be extended or adjusted to be applicable for formulas with a varying number of elements and different mole ratios.
In this work, we start with the Magpie descriptors and the baseline descriptors in Cryspnet5 and propose MLatticeABC, a RF lattice parameter (a/b/c) prediction model with a new set of descriptors. The feature set of our model includes the enhanced Magpie features as described in ref (5) (which includes the Magpie descriptors plus stoichiometry, valence orbitals, ion properties, band center, number of elements, and element fractions) and an additional descriptor set that characterizes the distribution of atom numbers of all elements in the formula. For inorganic compounds, different elements have different numbers of atoms. We added the maximum, minimum, average (all atoms divided by the number of element types), the variance of the atomic numbers, and the total atom number as our descriptors. We called the new descriptor set as the element_atom_no_stat descriptor set. The new descriptor set is inspired by the Magpie predictors, which consist of the minimum, maximum, mode, weighted average, and weighted average deviation of the corresponding element properties over a specific composition. This element_atom_no_stat descriptor set includes the statistics of the number of atoms of each element in the formula from which we calculate the minimum, maximum, mean, and variance. It also includes the number of total atoms in the unit cell, which is a key feature that we found to be important for lattice edge length prediction. We also compare the performance of our model with the Roost model28 in which a whole graph-based graph neural network is used to extract descriptors for composition-based property prediction. This model has achieved outstanding results in composition-based formation-energy prediction.29
6.2. Machine Learning Models: RF, DNNs, and SVR
In this study, we combine different descriptors with DNNs, RF, and SVR to identify the best model for lattice constant prediction.
We use the RF31 to create lattice prediction models. RF is a supervised ensemble learning algorithm that constructs a multitude of many decision trees at training time and outputs the average of the regression values of the individual trees. RF algorithms have demonstrated strong prediction performance when combined with composition features in our previous studies.13 In our RF regression models, “mse” was used as our criterion. The number of trees, max features, max depth, min samples split, and min samples leaf were set to 100, 70, 32, 8, and 1, respectively, in the RF algorithm which was implemented using the Scikit-Learn library in Python 3.6.
The deep neural network as shown in Figure 9 is composed of five fully connected layers with 249, 256, 128, 128, 64, and 1 nodes from the input layer to the output layer. The action functions for these layers are relu. After each layer, except the last layer, there is a dropout layer with 0.2 as the drop rate. The validation split and batch size are set as 0.2 and 80, respectively. We set the epochs as 2000 which have an early stopping with the patience of 200 and the monitor of “val rmse”. Standard gradient descent is used as the optimizer which has a learning rate of 0.002. The loss function is “mse”. The network parameters are optimized manually to achieve the best performance with a reasonable amount of trial-and-error fine-tuning. Before training the neural network, our data set was reprocessed by a standard scaler.
Figure 9.

Architecture of the deep neural network.
For comparison, we also include SVR32 models in our evaluation, which constructs one or a set of hyperplanes used for regression in a high-dimensional space. There are several unique benefits in SVR, such as working well in both high-dimensional and low-dimensional data and having excellent generalization capability. We use the Scikit-learn implementation of the SVR with the RBF kernel. In our experiment, the regularization parameter C is set to 10, and the gamma is “auto”. Our data set was reprocessed by a standard scaler to train the SVR model.
6.3. Evaluation Criteria
We evaluate model performance by splitting a whole dataset into 80% as training and 20% as testing and then train the model and make predictions. This process is repeated 10 times to get the average performance scores. As a standard regression problem, the following three performance criteria have been used to compare the performance of different models, including the RMSE, MAE, and R2.
| 1 |
| 2 |
 |
3 |
where aiexp denotes experimental lattice constant a/b/c of sample i, and ai is the predicted lattice constant value of a/b/c for sample i.
Acknowledgments
The research reported in this work was supported in part by NSF under grant 1940099 and 1905775 and by NSF SC EPSCoR Program under award number (NSF awards OIA-1655740 and GEAR-CRP 19-GC02). The views, perspectives, and content do not necessarily represent the official views of the SC EPSCoR Program nor those of the NSF.
Author Contributions
Conceptualization, J.H. and Y.L.; methodology, Y.L. and J.H.; software, Y.L. and J.H.; validation, Y.L. and J.H.; investigation, Y.L., J.H., R.D., and W.Y.; resources, J.H.; writing–and original draft preparation, J.H. and Y.L.; writing–review and editing, J.H and Y.L.; visualization, Y.L., J.H, R.D; supervision, J.H.; funding acquisition, J.H.
The authors declare no competing financial interest.
Notes
The data that support the findings of this study are openly available in the Materials Project database27 at http://www.materialsproject.org.
References
- Mccaffrey J. W.; Anderson J. R.; Papaconstantopoulos D. A. Electronic structure of calcium as a function of the lattice constant. Phys. Rev. B: Condens. Matter Mater. Phys. 1973, 7, 674–684. 10.1103/physrevb.7.674. [DOI] [Google Scholar]
- Pozzo M.; Alfè D.; Lacovig P.; Hofmann P.; Lizzit S.; Baraldi A. Thermal expansion of supported and freestanding graphene: lattice constant versus interatomic distance. Phys. Rev. Lett. 2011, 106, 135501. 10.1103/physrevlett.106.135501. [DOI] [PubMed] [Google Scholar]
- Wang X.; Cheng Z.; Khenata R.; Wu Y.; Wang L.; Liu G. Lattice constant changes leading to significant changes of the spin-gapless features and physical nature in a inverse heusler compound zr2mnga. J. Magn. Magn. Mater. 2017, 444, 313–318. 10.1016/j.jmmm.2017.08.040. [DOI] [Google Scholar]
- Jiang L. Q.; Guo J. K.; Liu H. B.; Zhu M.; Zhou X.; Wu P.; Li C. H. Prediction of lattice constant in cubic perovskites. J. Phys. Chem. Solids 2006, 67, 1531–1536. 10.1016/j.jpcs.2006.02.004. [DOI] [Google Scholar]
- Liang H.; Stanev V.; Kusne A. G.; Takeuchi I. Cryspnet: Crystal structure predictions via neural network. Phys. Rev. Mater. 2020, 4, 123802. 10.1103/physrevmaterials.4.123802. [DOI] [Google Scholar]
- Hu J.; Yang W.; Dong R.; Li Y.; Li X.; Li S.; Siriwardane E. M. D. Contact map based crystal structure prediction using global optimization. CrystEngComm 2021, 23, 1765–1776. 10.1039/d0ce01714k. [DOI] [Google Scholar]
- Hu J.; Yang W.; Siriwardane E. M.. Distance matrix based crystal structure prediction using evolutionary algorithms. 2020, arXiv preprint arXiv:2009.13955. [DOI] [PubMed] [Google Scholar]
- Amar M. N.; Ghriga M. A.; Seghier M.; Ouaer H. Prediction of lattice constant of a2xy6 cubic crystals using gene expression programming. J. Phys. Chem. B 2020, 124, 6037–6045. 10.1021/acs.jpcb.0c04259. [DOI] [PubMed] [Google Scholar]
- Williams L.; Mukherjee A.; Rajan K. Deep Learning Based Prediction of Perovskite Lattice Parameters from Hirshfeld Surface Fingerprints. J. Phys. Chem. Lett. 2020, 11, 7462–7468. 10.1021/acs.jpclett.0c02201. [DOI] [PubMed] [Google Scholar]
- Chonghe C.; Thing Y.; Zeng Y.; Wang C.; Wu P. Prediction of lattice constant in perovskites of gdfeo3 structure. J. Phys. Chem. Solids 2003, 64, 2147–2156. 10.1016/S0022-3697(03)00209-9. [DOI] [Google Scholar]
- Javed S. G.; Khan A.; Majid A.; Mirza A. M.; Bashir J. Lattice constant prediction of orthorhombic abo3 perovskites using support vector machines. Comput. Mater. Sci. 2007, 39, 627–634. 10.1016/j.commatsci.2006.08.015. [DOI] [Google Scholar]
- Takahashi K.; Takahashi L.; Baran J. D.; Tanaka Y. Descriptors for predicting the lattice constant of body centered cubic crystal. J. Chem. Phys. 2017, 146, 204104. 10.1063/1.4984047. [DOI] [PMC free article] [PubMed] [Google Scholar]
- Cao Z.; Dan Y.; Xiong Z.; Niu C.; Li X.; Qian S.; Hu J. Convolutional neural networks for crystal material property prediction using hybrid orbital-field matrix and magpie descriptors. Crystals 2019, 9, 191. 10.3390/cryst9040191. [DOI] [Google Scholar]
- Majid A.; Khan A.; Choi T.-S. Predicting lattice constant of complex cubic perovskites using computational intelligence. Comput. Mater. Sci. 2011, 50, 1879–1888. 10.1016/j.commatsci.2011.01.035. [DOI] [Google Scholar]
- Zhang Y.; Xu X. Machine learning lattice constants for cubic perovskite a2xy6 compounds. J. Solid State Chem. 2020, 291, 121558. 10.1016/j.jssc.2020.121558. [DOI] [Google Scholar]
- Moreira R. L.; Dias A. Comment on “prediction of lattice constant in cubic perovskites”. J. Phys. Chem. Solids 2007, 68, 1617–1622. 10.1016/j.jpcs.2007.03.050. [DOI] [Google Scholar]
- Majid A.; Khan A.; Javed G.; Mirza A. M. Lattice constant prediction of cubic and monoclinic perovskites using neural networks and support vector regression. Comput. Mater. Sci. 2010, 50, 363–372. 10.1016/j.commatsci.2010.08.028. [DOI] [Google Scholar]
- Ubic R.; Tolman K.; Talley K.; Joshi B.; Schmidt J.; Faulkner E.; Owens J.; Papac M.; Garland A.; Rumrill C.; et al. Lattice-constant prediction and effect of vacancies in aliovalently doped perovskites. J. Alloys Compd. 2015, 644, 982–995. 10.1016/j.jallcom.2015.04.213. [DOI] [Google Scholar]
- Ubic R.; Subodh G. The prediction of lattice constants in orthorhombic perovskites. J. Alloys Compd. 2009, 488, 374–379. 10.1016/j.jallcom.2009.08.139. [DOI] [Google Scholar]
- Ahmad R.; Gul A.; Mehmood N. Artificial neural networks and vector regression models for prediction of lattice constants of half-heusler compounds. Mater. Res. Express 2019, 6, 046517. 10.1088/2053-1591/aafa9f. [DOI] [Google Scholar]
- Xiong Z.; Cui Y.; Liu Z.; Zhao Y.; Hu M.; Hu J. Evaluating explorative prediction power of machine learning algorithms for materials discovery using k-fold forward cross-validation. Comput. Mater. Sci. 2020, 171, 109203. 10.1016/j.commatsci.2019.109203. [DOI] [Google Scholar]
- Ward L.; Agrawal A.; Choudhary A.; Wolverton C. A general-purpose machine learning framework for predicting properties of inorganic materials. npj Comput. Mater. 2016, 2, 16028. 10.1038/npjcompumats.2016.28. [DOI] [Google Scholar]
- Verma A. S.; Jindal V. K. Lattice constant of cubic perovskites. J. Alloys Compd. 2009, 485, 514–518. 10.1016/j.jallcom.2009.06.001. [DOI] [Google Scholar]
- Brik M. G.; Suchocki A.; Kamińska A. Lattice parameters and stability of the spinel compounds in relation to the ionic radii and electronegativities of constituting chemical elements. Inorg. Chem. 2014, 53, 5088–5099. 10.1021/ic500200a. [DOI] [PubMed] [Google Scholar]
- Brik M. G.; Kityk I. V. Modeling of lattice constant and their relations with ionic radii and electronegativity of constituting ions of a2xy6 cubic crystals (a= k, cs, rb, tl; x= tetravalent cation, y= f, cl, br,i). J. Phys. Chem. Solids 2011, 72, 1256–1260. 10.1016/j.jpcs.2011.07.016. [DOI] [Google Scholar]
- Kumar A.; Verma A. S. Lattice constant of orthorhomic perovskite solids. J. Alloys Compd. 2009, 480, 650–657. 10.1016/j.jallcom.2009.02.004. [DOI] [Google Scholar]
- Jain A.; Ong S. P.; Hautier G.; Chen W.; Richards W. D.; Dacek S.; Cholia S.; Gunter D.; Skinner D.; Ceder G.; et al. Commentary: The materials project: A materials genome approach to accelerating materials innovation. APL Mater. 2013, 1, 011002. 10.1063/1.4812323. [DOI] [Google Scholar]
- Goodall R.; Lee A. A.. Predicting materials properties without crystal structure: Deep representation learning from stoichiometry. 2019, arXiv preprint arXiv:1910.00617. [DOI] [PMC free article] [PubMed] [Google Scholar]
- Bartel C. J.; Trewartha A.; Wang Q.; Dunn A.; Jain A.; Ceder G. A. critical examination of compound stability predictions from machine-learned formation energies. npj Comput. Mater. 2020, 6, 97. 10.1038/s41524-020-00362-y. [DOI] [Google Scholar]
- Dan Y.; Zhao Y.; Li X.; Li S.; Hu M.; Hu J. Generative adversarial networks (gan) based efficient sampling of chemical composition space for inverse design of inorganic materials. npj Comput. Mater. 2020, 6, 84. 10.1038/s41524-020-00352-0. [DOI] [Google Scholar]
- Breiman L. Random forests. Mach. Learn. 2001, 45, 5–32. 10.1023/a:1010933404324. [DOI] [Google Scholar]
- Noble W. S. What is a support vector machine?. Nat. Biotechnol. 2006, 24, 1565–1567. 10.1038/nbt1206-1565. [DOI] [PubMed] [Google Scholar]