Abstract
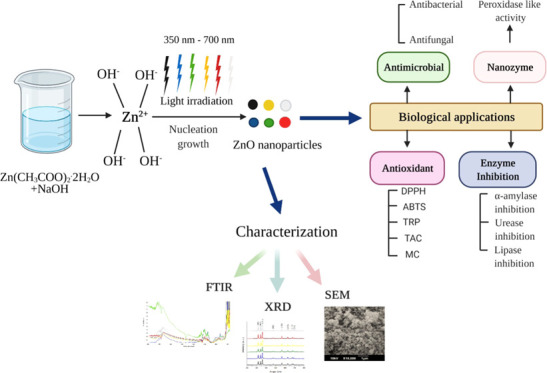
The photoinduced synthesis of zinc oxide nanoparticles (ZnO NPs) was carried out to unveil the effects of change in wavelength of photons. ZnO NPs were synthesized by the coprecipitation technique exposed to different light regimes [dark environment, daylight, and blue-, green-, yellow-, and red-colored light-emitting diodes (LEDs)] at room temperature. X-ray diffractogram (XRD) revealed the wurtzite structure of ZnO NPs. A small change in the size of ZnO NPs (17.11–22.56 nm) was observed with the variation in wavelength of lights from 350 to 700 nm. Spherical to hexagonal disks and rodlike surface morphologies were observed by scanning electron microscopy (SEM). The elemental composition and surface chemistry of NPs were studied by energy-dispersive X-ray diffractive (EDX) and Fourier transform infrared (FTIR) spectra. Maximum free radical quenching activity, cation radical scavenging, and total antioxidant capacity were found in ZnO NPs synthesized under green light (28.78 ± 0.18, 30.05 ± 0.21%, and 36.55 ± 2.63 μg AAE/mg, respectively). Daylight-synthesized NPs (DL-ZNPs) showed the greatest total reducing potential (15.81 ± 0.33 μg AAE/mg) and metal-chelating activity (37.77 ± 0.31%). Photoinduced ZnO NPs showed significant enzyme inhibitory effects on amylase, lipase, and urease by red-light NPs (87.49 ± 0.19%), green-light NPs (91.44 ± 0.29%), and blue-light NPs (92.17 ± 0.34%), respectively. Photoinduced ZnO NPs have been employed as nanozymes and found to exhibit intrinsic peroxidase-like activity as well. Blue-light-synthesized ZnO NPs displayed the strongest antibacterial activity (23 mm) against methicillin-resistant Staphylococcus aureus (MRSA). This study can be considered as a novel step toward the synthetic approach using LEDs to synthesize ZnO NPs with specific physicochemical properties and extends a great prospect in the environmental chemistry, food safety, and biomedical fields as nanozyme, antioxidant, antibacterial, anti-α-amylase, antiurease, and antilipase agents.
Introduction
Nanotechnology is a research hot spot in advanced material science. At the atomic level (1–100 nm), nanoparticles (NPs) are recognized as controlled or engineered particles. These engineered NPs have unpredictable activity, and currently, there is an increasing demand for nanostructured materials in conventional technologies and medical industrial sectors worldwide.1
There are different forms of metal oxides, which include titanium dioxide (TiO2), zinc oxide (ZnO), indium(III) oxide (In2O3), silicon dioxide (SiO2), and tin(IV) oxide (SnO2). Among them, ZnO has commonly produced metal oxides after TiO2 and SiO2. In the earth, ZnO occurs as the mineral zincite.2 Zinc oxide is an inorganic material with unique features, including its crystal size, a good aspect ratio of morphology and orientation, crystalline density with a direct band gap of 3.3 eV at ambient temperature, 60 meV high exciton binding energy, a wide radiation absorption range, semiconductor properties, and high catalytic activity,3 and finds application in diverse fields of science and technology.4−6 The smaller size of zinc oxide nanoparticles, which increases their chemical reactivity, has made them attractive for research in recent years. As a result, there is increased widespread use of ZnO nanoparticles in biomedicine, electronics, cosmetics, optics, food packaging, and agriculture.7,8 Moreover, ZnO nanoparticles have remarkable antimicrobial, antioxidant, and UV-blocking properties.9,10 The unique properties and functionality of ZnO pave the way to use multiple methods to synthesize different ZnO nanomaterials by modifying the synthesis parameters. Consequently, some physical and chemical parameters including precursors, temperature, pH, and type of solvent were also considered important. In a recent research work, ZnO nanowires were synthesized via the UV light decomposition process in the heterojunction of silver-loaded ZnO (AgxZn1–xO-ZnO nanowires). It has been reported that ZnO NPs have significant antibacterial activity against Escherichia coli under visible light or in the dark.11
The advent of photochemical synthesis of metallic nanoparticles dates back to the 18th century discovery when Schulze found that the irradiation of light darkened some silver salts. Recent developments in the metallic NP research area have led to the classic concept of photoreaction, a new use as a synthesis approach for functionalized nanostructures in UV-free light-emitting diodes (LEDs).12 Light-emitting diodes (LEDs) have properties of a relatively narrow band, low divergent angle, and high emission intensity and have also been used as sources of light excitation for the production of particular sizes and shapes of metallic NPs in photochemical reactions.13 Photochemical synthesis has many advantages: (i) it gives advantageous characteristics of photoinduced processing, i.e., versatile and clean process; (ii) in situ generation of reducing agents can be easily controlled; and (iii) photoirradiation can trigger the formation of nanoparticles. Recent advances in photochemistry and photoprocessing techniques for metallic NPs have allowed researchers to formulate different photoinduced synthetic approaches in a variety of conditions to obtain metal nanoparticles.12 The synthetic conditions for NP formulation are considered the most important for their specific size and shape.14 Therefore, the present study is carried out to understand the role of the synthetic condition of ZnO NP synthesis on its size, structure, and biological properties. The present work focuses on obtaining ZnO NPs with improved biological activities through a photoinduced synthetic route using different color LEDs, i.e., blue, green, yellow, and red LEDs. Zinc oxide NPs were also synthesized in daylight and dark environments. We have hypothesized that the different synthesis environments would influence the particle size and surface morphology, which would affect the antibacterial, antioxidant, enzyme inhibition, and enzymatic properties. However, to the best of our knowledge, no research work has yet been published that compares the properties of chemically synthesized photoinduced nanoparticles. Thus, the present investigation aimed to initially characterize chemically synthesized photoinduced ZnO nanoparticles and to compare their biological properties to identify their potential use in biomedical applications.
Materials and Methods
Materials
Zinc acetate dihydrate (Zn(CH3COO)2·2H2O), sodium hydroxide (NaOH), and ethanol were purchased from Aldrich. Nutrient Agar Media was procured from Merck. All of the reagents used were of analytical grade. Laboratory glassware was kept overnight in a 10% (v/v) HNO3 solution and then rinsed with deionized water.
Synthesis of ZnO Nanoparticles
Using the coprecipitation
method, ZnO nanoparticles were synthesized by dissolving 1 mM zinc
acetate into distilled water (DW).15 Then,
2 M NaOH solution was added dropwise into the zinc acetate solution
under consistent stirring at room temperature for 3 h. After the completion
of the reaction, a white milky solution was obtained. To produce the
photoinduced NPs, the NPs were synthesized in three different configurations:
(1) blue, green, yellow, and red monochromatic LED lights; (2) daylight;
and (3) a dark environment (nonirradiated), labeled as BL-ZNPs, GL-ZNPs,
YL-ZNPs, RL-ZNPs, DL-ZNPs, and DE-ZNPs, respectively. The power densities
of each light, day, and dark environments were measured by placing
the light meter at the place of a flask. From the power density, the
photon flux φ was calculated ( ) for the dark environment
(0.017 ×
1018 photon/(m2 s) at 350 nm), blue LED (0.068
× 1018 photon/(m2 s) at 450 nm), green
LED (7.29 × 10¹⁸ photon/(m2 s) at 510 nm),
yellow LED (2.64 × 10¹⁸ photon/(m2 s) at
570 nm), and red LED (6.22 × 10¹⁸ photon/(m2 s) at 650 nm). Besides that, the varying wavelengths of daylight
have a synergistic effect. The reaction mixture was stirred for 3
h at 800 rpm under different colored lights. Centrifugation was performed
at 2000g for 20 min to collect the white precipitates
followed by washing the precipitates repeatedly with distilled water
to remove any impurities. The final product was dried overnight at
60C in an oven. The final product powders were kept in labeled glass
vials with an airtight seal.
Characterization of Zinc Oxide Nanoparticles
To identify the size and crystal phases of nanoparticles, X-ray diffraction (XRD) analysis was performed by scattering Cu Kα radiations of wavelength 0.154 nm from the EMPYREAN diffractometer operated at 45 kV/40 mA over the 2θ range from 20 to 80°. Using the Debye–Scherrer formula (D = 0.9 × λ/β cos θ), the particle size was calculated. The SEM images were recorded at 100KX magnification operating with a 20 kV electron beam. Energy-dispersive X-ray spectroscopy was performed at the energy range of 0–20 kV and current of 1 × 10⁻⁹ A to analyze the elemental composition of zinc oxide NPs using TESCAN MIRA3 LMH Schottky FE-SEM. Fourier transform infrared (FTIR) spectra spectral analysis was carried out in the Perkin Elmer spectrum in the diffuse reflection mode operating at a resolution of 4 cm–1. The dried ZnO NPs were ground with KBr in the ratio 1:300 and pelletized using a hydraulic apparatus. The pellet was kept in the sample holder, and the spectrum was recorded between 4000 and 400 cm–1.
Biological Applications of Photoinduced Zinc Oxide NPs
Photoinduced zinc oxide nanoparticles were analyzed for their biological activities by suspending the zinc oxide NPs in dimethyl sulfoxide (DMSO) at 4 mg/mL. Before use, the suspension was sonicated for 10–15 min in a water sonicator.
Antioxidative Response of ZnO NPs
2,2-Diphenyl-1-picrylhydrazyl (DPPH) Assay (Free Radical Scavenging Assay; FRSA)
FRSA of photoinduced ZnO NPs was assessed by the 2,2-diphenyl-1-picrylhydrazyl (DPPH) reagent-based assay.16 A change in absorbance values is detected because antioxidants in test samples cause the production of hydrazine, which renders the discoloration of the purple color of the DPPH reagent. ZnO NPs (10 μL) were mixed with 190 μL of DPPH reagent (in methanol) in a 96-well plate. The mixture was incubated at 37 °C in the dark, and absorbance was recorded at 517 nm. Ascorbic acid was employed as a standard, and the % scavenging activity of photoinduced ZnO NPs was determined by the following formula: % scavenging = ((1 – sample absorbance/control absorbance) × 100).
Total Reducing Power (TRP) Evaluation
A well-elaborated procedure was adopted for determining the total reducing power of photoinduced ZnO NPs.16 Briefly, a 100 μL solution of NPs was combined with phosphate buffer (200 μL, 0.2 molar, pH 6.6) followed by mixing potassium ferricyanide (250 μL) in the respective Eppendorf tubes. After 20 min incubation at 50 °C in a water bath, 10% trichloroacetic acid (200 μL) was added. The mixture was centrifuged at 3000g for 10 min at room temperature. An aliquot (150 μL) from the supernatant was mixed with 0.1% FeCl3 (50 μL), and absorbance was read at 630 nm. Ascorbic acid (1 mg/mL) was employed as the standard (positive control). The resultant reducing power of photoinduced ZnO NPs was demonstrated as μg ascorbic acid equivalent.
Total Antioxidant Capacity (TAC) Evaluation
The phosphomolybdenum-based analysis technique was adopted for estimating the total antioxidant capacity of photoinduced ZnO NPs.17 From each sample, 100 μL was treated with the TAC reagent (1.67 g of sodium monobasic phosphate, 0.247 g of ammonium molybdate, and 1.63 mL of sulfuric acid dissolved in distilled water separately to have a final volume of 50 mL) of 900 μL in Eppendorf tubes. After 90 min incubation at 95 °C and cooling at room temperature, absorbance was measured at 630 nm. Ascorbic acid was employed as the positive control, and the total antioxidant capacity of all ZnO NPs is demonstrated as μg ascorbic acid equivalent.
Metal-Chelating (MC) Assay
Photoinduced ZnO NPs were analyzed for their metal-chelating abilities as described by Wang et al. with some modifications.18 An aliquot of 100 μL was mixed with 50 μL of 2 mM FeCI2 in a 96-well plate. After the addition of 200 μL of 5 mM ferrozine in respective wells, the plate was incubated at 37 °C for 10 min in the dark. Finally, absorbance was measured at 562 nm. The ferrous ion chelating ability of ZnO NPs—which can be determined by the following formula: metal-chelating ability % = (Abs control – Abs sample)/(Abs control) × 100 standard ethylenediaminetetraacetic acid (EDTA)-Na2—was employed as a reference standard and 100 μL of deionized water was taken as the negative and blank as well in place of the ferrozine solution.
ABTS Radical Scavenging Assay
The ABTS radical scavenging activity of photoinduced ZnO NPs was assessed by scavenging the 2,2′-azino-bis ethylbenzthiazoline-6-sulfonic acid (ABTS•+) radical cation.19 For the preparation of ABTS, 7 mM ABTS was mixed with 2.45 mM potassium persulfate solution in a 1:1 ratio. The solution was placed in the dark for 12–14 h at room temperature until the solution attained a stable absorbance of 0.700 ± 0.01 at 734 nm. From each stock solution of ZnO NPs, an aliquot of 10 μL was combined with 100 μL ABTS reagent in a 96-well plate and incubated at 37 °C for 10 min. Finally, the absorbance was checked at 734 nm. The percent scavenging activity of ZnO NPs can be determined by the following formula: ABTS• + % scavenging = ((AB – AA)/AB) × 100, where AB is the absorbance of the ABTS radical + methanol, AA is the absorbance of the ABTS radical + sample, and ascorbic acid was employed as the standard (positive) and dimethyl sulfoxide (DMSO) as a negative control.
Enzyme Inhibition Assays
α-Amylase Inhibition Assay
The α-amylase inhibition potential of the ZnO NPs was investigated according to the procedure described by Kim et al.20 Initially, 15 μL of phosphate buffer (pH 6.8) was poured into 96-well plates; then, 25 μL of α-amylase enzyme (0.14 U/mL), 10 μL of the test sample (4 mg/mL in DMSO), and 40 μL of the starch solution (2 mg/mL in potassium phosphate buffer) were added in subsequent steps. For 30 min, incubation of the reaction mixture was made at 50 °C with the subsequent addition of HCl (20 μL, 1 M) for the cessation of the reaction. The assay was further preceded by the addition of the iodine reagent (90 μL). The same procedure was followed for the preparation of the negative control just by replacing the test sample with an equal quantity of DMSO, whereas acarbose was added instead of a test sample in the case of the positive control. The blank was prepared without a test sample and amylase enzyme. Results were observed using a microplate reader, and readings were taken at 540 nm. The reaction percent enzyme inhibition of ZnO NPs was calculated using the following formula: % enzyme inhibition = ((Abs – Abn)/(Abb – Abn) × 100), where Abs is the absorbance of tested samples, Abb is the absorbance of the blank, and Abn is the absorbance of the negative control
Urease Inhibition Assay
The assay mixture contained 25 μL of urease, 50 μL of phosphate buffer ((3 mM, pH 4.5) containing 100 mM urea), and 10 μL of test samples (4 mg/mL in DMSO) and was incubated at 30 °C for 15 min in 96-well plates. Later, 45 μL of the phenol reagent (1% (w/v) phenol and 0.005% (w/v) sodium nitroprusside) and 70 μL of the alkali reagent (0.5% (w/v) NaOH and 0.1% NaOCl) were added to each well. The urease inhibition activity was measured by determining the ammonia production, which was evident by the pungent ammonia smell already described by Biglar et al.21 The plates were incubated for 50 min at 30 °C, and later, reading was taken at 630 nm using a UV spectrophotometer. Thiourea was used as a urease inhibitor and considered as the control, while for the blank, no test sample and control were used and contained 60 μL of buffer instead of 50 μL; the rest was the same as above. The reaction percent enzyme inhibition of ZnO NPs was calculated using the following formula: % enzyme inhibition = Abb – Abs ÷ Abb × 100, where Abb is the absorbance of the blank and Abs is the absorbance of a test sample.
Lipase Inhibition Assay
The assay was reported previously and was performed with few modifications.22 Lipase was dissolved in ultrapure water (10 mg/mL), and the supernatant was used after centrifugation at 16 000g for 5 min. Tris HCl buffer (100 mM; pH 8.2) was used as an assay buffer. Olive oil was used as the substrate (0.08% v/v dissolved in 5 mM sodium acetate (pH 5.0) containing 1% Triton X-100 heated in boiling water for 1 min to aid dissolution, mixed well, and cooled at room temperature for further use). For test samples, each Eppendorf contained 350 μL of buffer, 150 μL of lipase, and 50 μL of the test sample (4 mg/mL in DMSO); later, 450 μL of the substrate was added to initiate the reaction. Orlistat was used as a standard inhibitor, and an Eppendorf without any test sample was considered as the blank and contained 400 μL of buffer, 150 μL of lipase, and 450 μL of substrate. All of the samples were incubated at 37 °C for 2 h. The samples were then centrifuged at 16 000g for 1 min, and later, 200 μL was poured in the microtiter plate into respective wells. Reading was taken at 400 nm in a UV spectrophotometer. Results were also compared with standard inhibitors (Orlistat). The reaction percent enzyme inhibition of ZnO NPs was calculated using the following formula: % enzyme inhibition = Abb – Abs ÷ Abb × 100.
Peroxidase-like Nanozymatic Activity of ZnO NPs
The peroxidase-like activity of photoinduced ZnO NPs was measured using the method of Zhang et al. with few modifications.23 For the assay, each well was poured with 140 μL of NaAc-HAc buffer (0.2 M, pH 4.0); then, a 20 μL test sample was poured following H2O2 (6 mM, freshly prepared) and 20 μL of 3,3′,5,5′-tetramethylbenzidine (TMB) (3 mM, freshly prepared). The reaction mixture without the test sample was used as the control. Absorbance was taken using a microplate reader at 652 nm wavelength, and the following formula was used to express the enzymatic activity: A = ELC, where A is the sample absorbance, C is the enzyme concentration (mM/min/mg), E is the extinction coefficient (6.39 mM–1 cm–1), and L is the length of the wall (0.25 cm).
Antimicrobial Assays
The antimicrobial potential of ZnO NPs was determined by the disc diffusion protocol.16 The antibacterial activity of ZnO NPs was employed against E. coli (ATCC-25922), Pseudomonas aeruginosa (ATCC-15442), Klebsiella pneumoniae (ATCC-1705), Bacillus subtilis (ATCC-6633), and methicillin-resistant Staphylococcus aureus (MRSA). Then, 5 μL of each ZnO NP stock solution was loaded on autoclaved discs and settled on properly labeled seeded agar plates. Positive controls cefixime monohydrate and roxithromycin (5 μL from 4 mg/mL DMSO) were also infused on discs and placed on plates. Plates were incubated at 37 °C for 24 h, and then, the zone of inhibition (ZOI) was measured in millimeters (mm).
The fungal strains against which the samples were tested included Aspergillus niger (FCBP-0198), Aspergillus flavus (FCBP-0064), Fusarium solani (FCBP-0291), Aspergillus fumigatus (FCBP-66), and Mucor species (FCBP-0300). For the antifungal assay, Petri plates having sterile sabouraud dextrose agar (20–25 mL) were swabbed with 100 μL of refreshed inoculum. From each ZnO NP sample, 5 μL of the solution (4 mg/mL DMSO) was infused on discs of filter paper (sterilized) and then placed on properly labeled seeded agar plates. Sterile filter discs infused with 5 μL of DMSO and clotrimazole (4 mg per mL of DMSO) each were also placed on plates. The plates were incubated at 37 °C for 36–48 h, and then, the zone of inhibition (mm) was examined.
Statistical Analysis
All of the assays were performed in triplicate, and the results are reported as mean with standard deviation. The means were further analyzed using analysis of variance (ANOVA) and least significant difference (LSD) at the probability level p < 0.05. All data were analyzed using SAS statistical software Version 9.1.2 (SAS, 2004).
Results and Discussion
In this study, photoinduced ZnO nanoparticles were synthesized under different LEDs, in the daylight, and in the dark. Different colors of LEDs have different photon fluxes and deposited different energies. This difference in the flux of LED light affected the size, surface morphology, and other physiochemical and biological properties of ZnO NPs (Figure 1).
Figure 1.
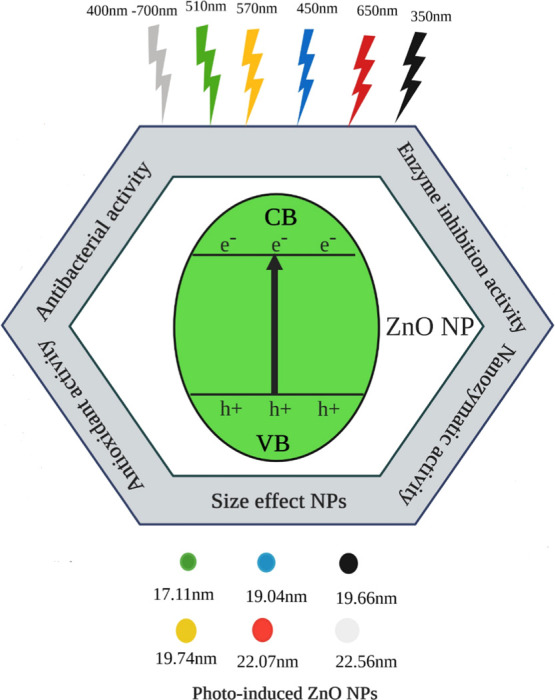
Mechanism of photoinduced ZnO NPs synthesized under different light conditions. A small change in the size of ZnO NPs (17.11–22.56 nm) was observed with the variation in the wavelength of lights (350–700 nm).
The growth of zinc oxide in NaOH may be simplified as follows
| 1 |
| 2 |
| 3 |
Characterization of ZnO NPs
XRD Analysis
The XRD patterns of coprecipitated synthesized ZnO nanoparticles in different LED lights are shown in Figure 2. The peaks in XRD spectra corresponding to the planes 100, 002, 101, 102, 110, 103, 112, and 201 are observed at angles (2θ) of 31.69, 34.33, 36.18, 47.47, 56.55, 62.79, 67.89, and 69.01°, respectively. All of the detected peaks are indexed, and it corresponds to the wurtzite (hexagonal) structure of ZnO. The diffraction peaks’ broadening is an indication of the small nanocrystals in the samples. All samples have the strongest peak corresponding to the (101) plane, which is excellent confirmation with the (JCPDS) card No. 36-1451.24 The XRD patterns of the obtained nanoparticles did not display any peaks except for ZnO, which indicates the purity of the prepared ZnO nanoparticles.
Figure 2.
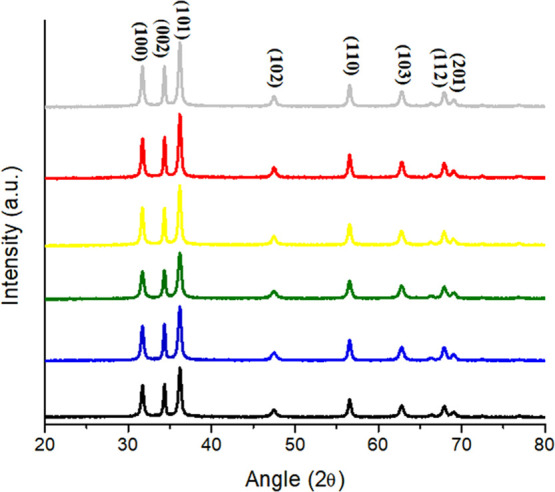
X-ray diffractogram (XRD) spectra of the DE-ZNPs, DL-ZNPs, BL-ZNPs, GL-ZNPs, YL-ZNPs, and RL-ZNPs.
The diameter of the ZnO nanoparticle was calculated using the Debye–Scherrer formula
| 4 |
where 0.9 is Scherrer’s constant, λ is the wavelength of X-rays, θ is the diffraction angle, and β is the full width at half-maximum (FWHM) of the diffraction peak corresponding to the (101) plane. The average particle size of the sample was found to be 16.35 nm, which is derived from the FWHM of a more intense peak corresponding to the (101) plane located at 36.1°. The calculated unit cell parameters for the ZnO nanoparticles are a = b = 3.2566 Å and c = 5.2185 Å (Table 1).
Table 1. Average Crystallite Size and Lattice Parameters of Photoinduced ZnO NPs.
| ZnO NPs (prepared in) | size (nm) | d (101) (Å) | a = b (Å) | c (Å) |
|---|---|---|---|---|
| dark λ = (350 nm) | 19.66 | 2.4795 | 3.2560 | 5.2176 |
| daylight λ = (400–700 nm) | 22.56 | 2.4802 | 3.2567 | 5.2184 |
| blue LED λ = (450 nm) | 19.04 | 2.4806 | 3.2568 | 5.2192 |
| green LED λ = (510 nm) | 17.11 | 2.4803 | 3.2564 | 5.2193 |
| yellow LED λ = (570 nm) | 19.74 | 2.4807 | 3.2577 | 5.2201 |
| red LED λ = (650 nm) | 20.07 | 2.4793 | 3.2553 | 5.21652 |
Scanning Electron Microscopy (SEM)
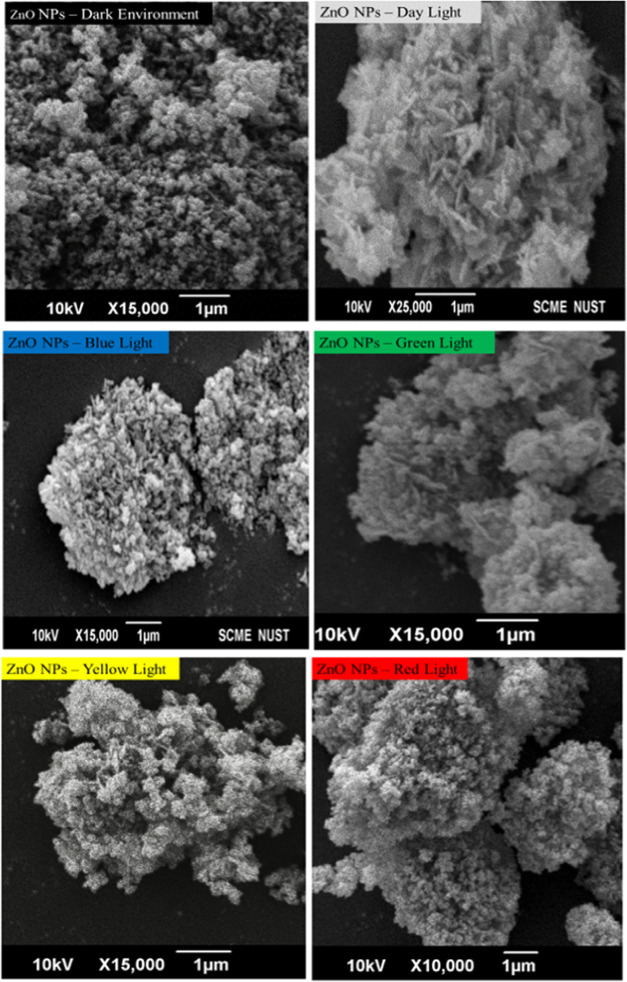
Figure 3 shows the general morphologies of the photoinduced ZnO nanoparticles from spherical to hexagonal disks and nanorods with the change in light wavelength (nm). Under SEM examination, a large quantity of one-dimensional (1D) hexagonal ZnO nanorods was observed under the visible-light range.
Figure 3.
Scanning electron microscopy of photoinduced DE-ZNPs, DL-ZNPs, BL-ZNPs, GL-ZNPs, YL-ZNPs, and RL-ZNPs.
DE-ZNPs of Figure 3 show that nanoparticles are spherical with a narrow size distribution. However, there are some larger aggregates in the sample because of the high surface energy of ZnO nanoparticles, which results in aggregation, especially when the synthesis is carried out in an aqueous medium. On the other hand, DL-ZNPs showed a distinct morphology with a complex superstructure assembled by hexagonal disks and nanorods.25 Well-dispersed BL-ZNPs were observed clearly with hexagonal disks and nanorods. Despite the aggregation, the smallest-size GL-ZNPs exhibited a spherical-like shape, with a few of them having a rodlike structure. When the size of the particle is very small, the ratio of the atoms on the surface to all of the atoms in the particle increases. In this situation, the surface atoms can affect the morphology of the particle.26 However, YL-ZNPs that agglomerated without any specific shape coexisted with a smaller number of nanorods. It is well-known that nanoparticles are prone to aggregation due to the surface-area-to-volume ratio.27,28 Change in the surface morphology from a rodlike structure to a mixture of hexagonal disks and roughly spherical structures of ZnO NPs can be interfered with as a change in the wavelengths of different lights used.
Energy-Dispersive X-ray Diffraction
The energy-dispersive X-ray diffraction (EDX) study was performed for photoinduced ZnO nanostructures (Table 2) to determine the elemental composition. The EDX data of ZnO NPs revealed that synthesized ZnO NPs were composed of zinc and oxygen, which confirmed the purity of photoinduced ZnO nanoparticles.
Table 2. Energy-Dispersive X-ray Analysis of Photoinduced ZnO NPs.
| element (wt %) | DE-ZNPs | DL-ZNPs | BL-ZNPs | GL-ZNPs | YL-ZNPs | RL-ZNPs |
|---|---|---|---|---|---|---|
| Zn | 78.56 | 80.73 | 81.20 | 84.08 | 77.87 | 76.15 |
| O | 21.44 | 19.27 | 18.80 | 15.92 | 22.13 | 23.85 |
Fourier Transform Infrared (FTIR) Spectroscopy
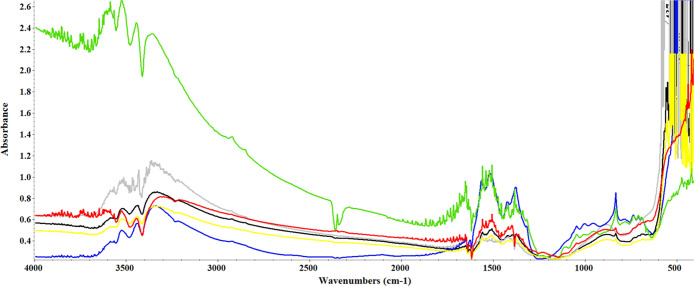
Figure 4 shows the FTIR spectra of the as-prepared ZnO nanostructures synthesized using different light environments. As shown, the FTIR spectra of the products involve characteristic peaks at 409–494 and 501–588 cm–1 corresponding to metal–oxygen (M–O) vibrational bands, in the ZnO nanostructures,29 and also indicated that the morphology of the particle changes from spherical to a rodlike (1D) shape. This difference in wavenumber may be due to a difference in particle sizes and the wavelength of light used. These stretching mode peaks are indicative of the successful synthesis of ZnO nanoparticles. Yuvakkumar et al. reported that Zn–O stretching vibrations were found in the region between 400 and 600 cm–1.30 Generally, metal oxides exhibit absorption bands well below 1200 cm–1 arising due to interatomic vibrations. The absorptions at 879 cm–1 (DL-ZNPs) and 832 cm–1 (DE-ZNPs, BL-ZNPs, GL-ZNPs, YL-ZNPs, and RL-ZNPs) are due to the formation of tetrahedral coordination of Zn.31 The bands at 1506–1508 cm–1 (all ZnO nanostructures) and 1395 cm–1 (DE-ZNPs, YL-ZNPs, and RL-ZNPs) resemble the asymmetric and symmetric C=O stretching in acetate groups. The peaks at 1418 cm–1 (DL-ZNPs and GL-ZNPs), 1374–1378, and 1558 cm–1 (all ZnO nanostructures) correspond to COO– (carboxylate group), C=O, and C–C bonds, respectively.31 The peaks in the regions of 1627–1635 cm–1 showed N–H stretching vibrations, while peaks observed at 1652 cm–1 are due to the asymmetrical and symmetrical stretchings of the zinc carboxylate.32 The peaks at about 2349 and 2284 cm–1 for GL-ZNPs are observed due to the vibration of atmospheric CO2 on the metallic cations. However, this peak was not observed in other photoinduced ZnO nanostructures. Moreover, absorption bands at 3362–3513 cm–1 were observed to represent −OH stretching vibrations from NaOH (precursor) in all ZnO nanostructures, suggesting that the hydroxyl functional groups are occupied by ZnO nanoparticles. The obtained functional information from FTIR justifies that the prepared nanostructures have a good chemical property, and this is consistent with the SEM and XRD pattern data.
Figure 4.
FTIR absorbance spectra of photoinduced DE-ZNPs, DL-ZNPs, BL-ZNPs, GL-ZNPs, YL-ZNPs, and RL-ZNPs.
Biological Applications of Photoinduced ZnO NPs
Antioxidant Properties
The photoinduced ZnO NPs exhibited significant antioxidant activities. These ZnO NPs demonstrated TRP and TAC. Similarly, it has been revealed that these photoinduced NPs also showed ABTS, metal chelation, and DPPH free radical scavenging activities. The DPPH technique is a method that permits the reactivity of radical DPPH with the functional moieties present on the surface of zinc oxide nanoparticles. These photoinduced zinc oxide NPs showed a modest DPPH free radical scavenging activity in the range of 5.56–28.78% (Table 3) as the maximum scavenging (28.78%) was observed in GL-ZNPs. The antioxidant capacity of photoinduced NPs could be due to the transfer of electron density located at the oxygen to the odd electron located at the nitrogen atom in DPPH. This capacity is based on the structural configuration of an oxygen atom and revealed the thermal stability of nanoparticles by its available free energy of oxides.33 In the case of the ABTS radical scavenging assay, antioxidant entities (functional groups on the NP surface) quench the color and induce discoloration of the reaction mixture. The reaction is quick and the endpoint is stable, and it is used as a qualitative and a quantitative measure for evaluating the antioxidant capacity. The maximum scavenging activity was observed in GL-ZNPs (30.05%) followed by YL-ZNPs (26.86%).
Scheme: Formation of stable radical ABTS• and its reaction with antioxidant entities (AOH).
Table 3. Free Radical Scavenging Activity (FRSA), Total Reducing Power Potential (TRP), Total Antioxidant Activity (TAC), Metal Chelating (MC), and ABTS Scavenging Values of Photoinduced ZnO NPsa.
| ZnO NPs | DPPH (%) | TRP (μg AAE/mg) | TAC (μg AAE/mg) | MC (%) | ABTS (%) |
|---|---|---|---|---|---|
| DE-ZNPs | 27.98 ± 0.17a | 15.27 ± 0.32a | 23.13 ± 0.6d | 26.81± 0.28d | 11.97 ± 0.23e |
| DL-ZNPs | 26.54 ± 0.13b | 15.81 ± 0.33a | 36.02 ± 0.54a | 37.77 ± 0.31a | 20.21 ± 0.38c |
| BL-ZNPs | 16.95 ± 0.22c | 13.32 ± 0.58b | 32.95 ± 0.6b | 22.17 ± 0.25e | 17.95 ± 0.19d |
| GL-ZNPs | 28.78 ± 0.18a | 15.60 ± 0.42a | 36.55 ± 2.63a | 32.05 ± 0.18b | 30.05 ± 0.21a |
| YL-ZNPs | 5.56 ± 0.14e | 15.16 ± 0.49a | 26.99 ± 0.6c | 26.61 ± 0.22d | 26.86 ± 0.46b |
| RL-ZNPs | 7.71 ± 0.35d | 15.62 ± 0.58a | 26.02 ± 1.06c | 29.43 ± 0.32c | 18.35 ± 0.25d |
The different letters within the column mean statistical difference between treatments by the LSD test (p ≤ 0.05).
The free radical chain reaction is broadly recognized as a normal mechanism of lipid peroxidation. Through direct reactions, the radical scavengers reduce peroxide radicals for terminating peroxidation chain reactions that play the main role in the pathological events ultimately involved in different diseases.34 The antioxidant capacity of photoinduced ZnO NPs was examined by applying the phosphomolybdenum-based technique (colorimetric analysis) by which ZnO NPs were evaluated by measuring the formation of the green-colored complex. Antioxidant entities present on the NP surface make phosphomolybdate ions to get reduced themselves. The maximal antioxidant capacity was observed in GL-ZNPs (36.55 μg AAE/mg) followed by DL-ZNPs (36.02 μg AAE/mg). These results indicated that the GL-ZNPs showed the highest scavenging activity in terms of the ABTS assay, the DPPH assay, and the TAC assay (Table 3). The maximal activity might be due to the smaller size and surface area of GL-ZNPs. The increase in surface area increases the number of atoms on the NP surface, resulting in increased biological (antioxidative) activities.35 Our results are in close agreement with previous studies of antioxidant activities of ZnO NPs.14,33,36
The total reducing efficacy of ZnO NPs was explored in this study so that supporting assumptions can be drawn regarding the antioxidant powers of our photoinduced ZnO NPs. Their antioxidant reaction is revealed by their reaction with peroxides, thus preventing peroxide formation, and they are also known to terminate the free radical chain by donating a hydrogen atom (Figure 5). This approach involves the investigation of reductants. The table shows the TRP values of the photoinduced ZnO NPs, which are found to be almost the same in all of the tested ZnO nanoparticles except for BL-ZNPs. However, the maximum value for reducing power was observed in DL-ZNPs with 15.81 μg AAE/mg. The obtained results were compared with the earlier data, and it was found that reductants present in the photoinduced ZnO NPs cause the reduction of the ferricyanide (Fe3+) complex to the ferrous form (Fe2+).37
Figure 5.
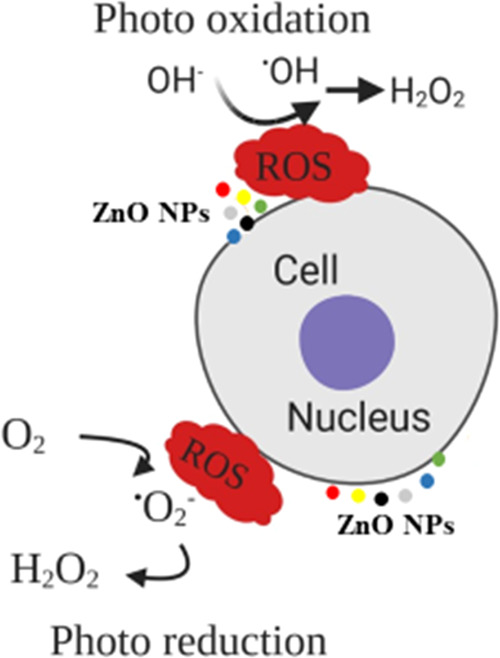
Mechanistic behavior of photoinduced ZnO NPs for the production of reactive oxygen species (ROS) in the cell.
Reactive oxygen species (ROS) are often formed as essential intermediates of metal-catalyzed oxidation reactions. The transition-metal ions Fe2+ can promote the generation of free radicals by loss or gain of electrons. Therefore, the chelation of metal ions with chelating agents can be induced by the reduction of ROS formation. The assessment of the chelation power of photoinduced ZnO NPs was conducted by a metal-chelating assay. The results of the metal-chelating activity (Table 3) illustrated that ZnO NPs could reduce the ferric ion (Fe3+) to ferrous ion (Fe2+). It indicated that ZnO NPs had some proton- and electron-donating properties of antioxidant efficacy. The standard control solution was used as EDTA and showed the maximum Fe2+-ion-chelating activity of 78.62% at the concentration of 10 mg/mL DW. Among the photoinduced ZnO NPs, the highest metal-chelating ability was observed in DL-ZNPs with the corresponding activity of 37.77% followed by GL-ZNPs with 32.05%. This work documented that these ZnO NPs have effective ligand abilities for chelating metal ions, thus suppressing the hydroxyl radical formation by Fenton’s reaction.38
Enzyme Inhibition Activities
In this study, the enzyme inhibition activities of photoinduced ZnO NPs were studied specifically, the results of which show that these nanoparticles bind to the enzyme (amylase, urease, and lipase) as enzyme inhibitors, prevent the substrate from entering the catalytic site, and formed the enzyme–inhibitor complex, resulting in enzyme inhibition (Figure 6). The role of metallic NPs in the metabolism of glucose has been documented in many studies.39 In this work, photoinduced ZnO NPs were used to study the α-amylase inhibitory effect by comparing them with the standard α-amylase inhibitor drug, acarbose. α-Amylase is one of the major digestive enzymes in the pancreas involved in the breakdown of oligosaccharides into monosaccharides. Therefore, upon α-amylase inhibition, less sugar will be available for assimilation, thus helping in treating diabetes.40 Photoinduced ZnO NPs showed a significant inhibition percentage, and the results are documented in Table 4. The results demonstrated that percent inhibition of the enzyme is increased by increasing the wavelength of LEDs. In this regard, RL-ZNPs showed maximum inhibition of the enzyme with 87.4%, followed by YL-ZNPs and GL-ZNPs with 57.8 and 38.2%, respectively. These findings suggested that RL-ZNPs showed an α-amylase inhibitory activity similar to that of standard acarbose (95.8%) to pave the way for the use of this nontoxic, inorganic material in the biomedicine domain.
Figure 6.
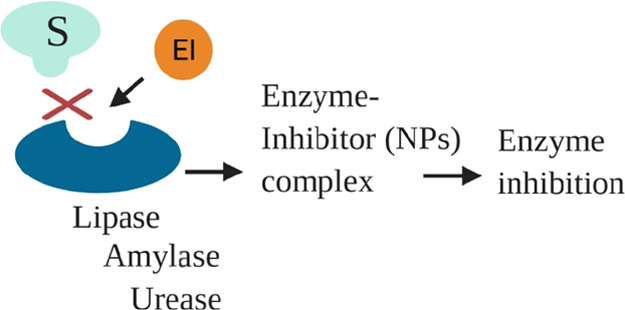
Enzyme inhibition activity of photoinduced ZnO NPs.
Table 4. Enzyme Inhibition (%) Activities and Peroxidase-like Activity (mM/min/mg) of Photoinduced ZnO NPsa.
| ZnO NPs | amylase | urease | lipase | peroxidase-like activity |
|---|---|---|---|---|
| DE-ZNPs | 12.17 ± 0.22d | 90.15 ± 0.25b | 63.19 ± 0.15e | 0.8 ± 0.1b |
| DL-ZNPs | 11.28 ± 0.24d | 83.91 ± 0.52d | 59.73 ± 0.33f | 0.7 ± 0.2b |
| BL-ZNPs | 12.83 ± 0.36d | 92.17 ± 0.34a | 79.37 ± 0.47d | 0.8 ± 0.1b |
| GL-ZNPs | 38.25 ± 0.21c | 77.48 ± 0.61e | 91.44 ± 0.29a | 0.8 ± 0.2b |
| YL-ZNPs | 57.86 ± 0.31b | 67.83 ± 0.33f | 85.28 ± 0.52b | 1.4 ± 0.2a |
| RL-ZNPs | 87.49 ± 0.19a | 87.45 ± 0.28c | 83.66 ± 0.23c | 0.8 ± 0.1b |
The different letters within the column mean statistical difference between treatments by the LSD test (p ≤ 0.05).
The effects of photoinduced ZnO NPs on the activity of the enzyme were specifically analyzed, the results of which indicate the noteworthy inhibitory effects of ZnO NPs on the urease enzyme. BL-ZNPs exhibited a potent activity of 92.1%, which is comparatively higher than thiourea, the standard urease inhibitor. Thiourea significantly inhibited urease with the release of 90.3% ammonia. Urease catalyzes the hydrolysis of urea into ammonia. Nessler’s reagent reacts explicitly with ammonia, resulting in the red color of the reaction solution. The significant percentage of ammonia produced by urea showed that the urease enzyme was responsible for the hydrolysis of urea into ammonia. The NPs that react with the −SH group of cysteine are observed as strong urease inhibitors.41 The urease inhibition activity by these photoinduced ZnO NPs is summarized in Table 4.
The behavior of pancreatic lipase (PL) was monitored by a colorimetric assay that measures p-nitrophenol release. PL is the main enzyme responsible for the absorption of lipids. We tested photoinduced ZnO NPs for the inhibitory action against PL and confirmed that these NPs can significantly act as a lipase inhibitor. The application of ZnO NPs at a concentration of 4 mg/mL resulted in the inhibition of 59.7–91.4% enzyme activity during 2 h of incubation (Table 4). GL-ZNPs and orlistat showed maximum inhibition of 91.4% pancreatic lipase activity, whereas YL-ZNPs and RL-ZNPs also showed significant PL inhibitions of 85.2 and 83.6%, respectively. Orlistat, the standard lipase inhibitor, can inhibit PL with 91.4% p-nitrophenol release. One of the most commonly studied pathways for assessing the possible effectiveness of NPs as antiobesity agents is PL inhibition.
Peroxidase-like Nanozymatic Activity of Photoinduced ZnO NPs
Artificial enzymes have become an increasingly important area of research owing to their many advantages over natural protein enzymes that are costly, unable to survive in harsh conditions, and difficult to isolate. The use of metal nanoparticles as artificial enzymes, recognized as nanozymes that demonstrate peroxidase-like activity, enabled these NPs to catalyze the oxidation of substrate TMB (colorless) in the presence of H2O2 into TMB ox (blue-color product), providing a colorimetric response (Figure 7).42 All of the photo-ZnO-based nanozymes exhibited significant peroxidase-like activity, but the YL-ZNPs exhibited the maximum mimetic activity for catalyzing the H2O2-TMB system (Table 4). Based on the featured mimetic operation, ZnO NPs have been widely developed to enhance human health, from diagnosis to antibacterial and cancer treatment, engineer the environment for pollutant monitoring and elimination, and improve the performance of the chemical industry.43−45
Figure 7.
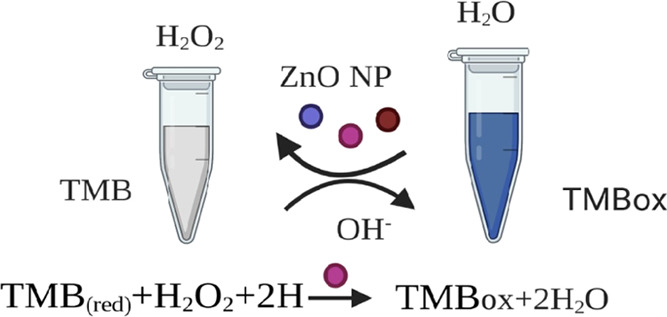
Peroxidase-like nanozymatic activity of photoinduced ZnO NPs.
Antimicrobial Activity
The antibacterial activity of photoinduced ZnO NPs, which was tested by the disc diffusion method, was significant against bacterial strains (E.coli, P. aeruginosa, K. pneumonia, MRSA, B. subtilis) employed in terms of the zone of inhibition (mm ± SD), as shown in Table 5. The antibacterial property of these NPs is attributed to the cation affinity of microbial protein constituents, and when protein contents precipitate as insoluble proteinates, cell death occurs.46
Table 5. Antibacterial Activity of ZnO NPs Synthesized under Different Lightsa.
| zone
of inhibition (mm) |
|||||
|---|---|---|---|---|---|
| ZnO NPs | E. coli | P. aeruginosa | K. pneumoniae | MRSA | B. subtilis |
| DE-ZNPs | 8 ± 0.5* | 14 ± 0.5*** | 9 ± 0.5* | 14 ± 1*** | 12 ± 0.5** |
| DL-ZNPs | 8 ± 1* | 10 ± 1* | 8 ± 0.5* | 18 ± 1*** | 12 ± 1** |
| BL-ZNPs | 10 ± 0.6* | 13 ± 0.5*** | 8 ± 0.5* | 23 ± 0.5*** | 11 ± 1** |
| GL-ZNPs | 8 ± 0.5** | 13 ± 0.7*** | 7 ± 0.5* | 21 ± 0.5*** | 12 ± 0.5** |
| YL-ZNPs | 9 ± 0.5* | 12 ± 1** | 7 ± 1* | 20 ± 0.5*** | 14±0.5*** |
| RL-ZNPs | 10 ± 0.5* | 12 ± 0.5** | 9 ± 1* | 20 ± 0.5*** | 12 ± 1** |
| Controls | |||||
| roxithromycin | — | — | — | 12 ± 0.5** | 14 ± 0.5*** |
| cefixime | 10 ± 1* | 15 ± 0.5*** | 7 ± 1* | — | |
| DMSO | — | — | — | — | |
— No activity, the final concentration of ZnO NPs, and the standard was 4 mg/disc; values for ZnO NPs are presented as ZOI ± SD as a result of the triplicate analysis. ***, more significant; **, significant; *, less significant.
Among all of the tested strains, MRSA was found to be the most susceptible bacterial strain with a maximum zone of inhibition against BL-ZNPs (23 mm), and K. pneumonia was observed as the most resistant strain with 7 mm ZOI against GL-ZNPs and YL-ZNPs. K. pneumoniae and P. aeuroginosa showed maximum susceptibility toward DE-ZNPs with 9 mm and 14 mm, respectively. B. subtilis showed maximum susceptibility toward YL-ZNPs with a 14 mm zone of inhibition. RL-ZNPs proved to be the most potent against E. coli, showing a maximum zone of inhibition (10 mm). Overall, BL-ZNPs proved to be the most potent antibacterial agents, showing clear zones of inhibition of 23, 13, 11, 10, and 8 mm against MRSA, P. aeruginosa, B. subtilis, E. coli, and K. pneumonia, respectively. Blue light has recently gained attention as a novel phototherapy-based antimicrobial agent that has significant antimicrobial activity against a broad range of bacterial and fungal pathogens with less chance of resistance development compared to antibiotics.47,48 Thus, it can be concluded that these photoinduced ZnO nanoparticles could be used as therapeutic tools for serving against MDR microorganisms, and specifically, BL-ZNPs can be used for dermatology purposes in the case of MRSA infection. The results are similar in range to that of a previous work dealing with the antibacterial activity of photoinduced ZnO NPs.33 ZnO NPs release Zn ions (Zn2+) with the generation of reactive oxygen species, which could lead to damage of the bacterial machinery and occurrence of cell death (Figure 8).
Figure 8.
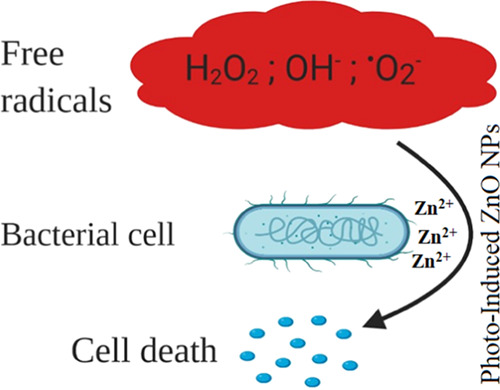
Mechanism of action of Zn2+ on the bacterial cell.
By employing the disc diffusion method, the results of the antifungal analysis revealed that photoinduced ZnO NPs did not show any activity against the tested fungal strains.
Conclusions
In the present study, we synthesized photoinduced ZnO NPs using a chemical approach by the coprecipitation method, under the exposure of different lights. The varying wavelengths, versatilities, and efficiencies of lights were the main objectives of this study. The size, surface morphology, and other physiochemical, biological, and nanozymatic properties of ZnO NPs were all influenced by the different colors of LEDs, which had different photon fluxes and deposited different energies. Consequently, the varying wavelengths of daylight have a synergistic influence. Characterization studies of ZnO NPs were carried out by XRD, FTIR, and SEM. XRD patterns revealed the wurtzite structure of ZnO. Crystalline peaks indicated the purity of the prepared ZnO nanoparticles. FTIR spectra of the ZnO NPs involve characteristic peaks corresponding to metal–oxygen (M–O) vibrational bands, confirming the formation and purity of the ZnO structure. SEM was performed for the microstructure study and to determine agglomeration results, indicating that photoinduced ZnO NPs act as efficient and robust antioxidants, antibacterials, enzyme inhibitors as well as peroxidase mimetics and can be explored further for their efficiency in therapeutic strategies in in vivo models. These findings revealed that the advancement in optical technique will provide researchers with new strategies to produce varying sizes and shapes of nanoparticles wide a wide range of new possible applications in biomedical sciences, environmental sciences, and bioanalytical chemistry.
Author Contributions
All authors contributed equally to the experimental design, performance, and writing of the manuscript.
Financial assistance was not received from any source for this work.
The authors declare no competing financial interest.
References
- Sirelkhatim A.; Mahmud S.; Seeni A.; Kaus N. H. M.; Ann L. C.; Bakhori S. K. M.; Hasan H.; Mohamad D. Review on zinc oxide nanoparticles: antibacterial activity and toxicity mechanism. Nano-Micro Lett. 2015, 7, 219–242. 10.1007/s40820-015-0040-x. [DOI] [PMC free article] [PubMed] [Google Scholar]
- Piccinno F.; Gottschalk F.; Seeger S.; Nowack B. Industrial production quantities and uses of ten engineered nanomaterials in Europe and the world. J. Nanopart. Res. 2012, 14, 1109 10.1007/s11051-012-1109-9. [DOI] [Google Scholar]
- Wu C.; Qiao X.; Chen J.; Wang H.; Tan F.; Li S. A novel chemical route to prepare ZnO nanoparticles. Mater. Lett. 2006, 60, 1828–1832. 10.1016/j.matlet.2005.12.046. [DOI] [Google Scholar]
- Rajiv P.; Rajeshwari S.; Venckatesh R. Bio-Fabrication of zinc oxide nanoparticles using leaf extract of Parthenium hysterophorus L. and its size-dependent antifungal activity against plant fungal pathogens. Spectrochim. Acta, Part A 2013, 112, 384–387. 10.1016/j.saa.2013.04.072. [DOI] [PubMed] [Google Scholar]
- Anbuvannan M.; Ramesh M.; Viruthagiri G.; Shanmugam N.; Kannadasan N. Synthesis, characterization and photocatalytic activity of ZnO nanoparticles prepared by biological method. Spectrochim. Acta, Part A 2015, 143, 304–308. 10.1016/j.saa.2015.01.124. [DOI] [PubMed] [Google Scholar]
- Sharma D.; Sharma S.; Kaith B. S.; Rajput J.; Kaur M. Synthesis of ZnO nanoparticles using surfactant free in-air and microwave method. Appl. Surf. Sci. 2011, 257, 9661–9672. 10.1016/j.apsusc.2011.06.094. [DOI] [Google Scholar]
- Kołodziejczak-Radzimska A.; Jesionowski T. Zinc oxide—from synthesis to application: a review. Materials 2014, 7, 2833–2881. 10.3390/ma7042833. [DOI] [PMC free article] [PubMed] [Google Scholar]
- Newman M. D.; Stotland M.; Ellis J. I. The safety of nanosized particles in titanium dioxide–and zinc oxide–based sunscreens. J. Am. Acad. Dermatol. 2009, 61, 685–692. 10.1016/j.jaad.2009.02.051. [DOI] [PubMed] [Google Scholar]
- Gunalan S.; Sivaraj R.; Rajendran V. Green synthesized ZnO nanoparticles against bacterial and fungal pathogens. Prog. Nat. Sci.: Mater. Int. 2012, 22, 693–700. 10.1016/j.pnsc.2012.11.015. [DOI] [Google Scholar]
- Saikia J. P.; Paul S.; Konwar B. K.; Samdarshi S. K. Nickel oxide nanoparticles: a novel antioxidant. Colloids Surf., B 2010, 78, 146–148. 10.1016/j.colsurfb.2010.02.016. [DOI] [PubMed] [Google Scholar]
- Wu J. M.; Kao W. T. Heterojunction nanowires of Ag x Zn1–x O–ZnO photocatalytic and antibacterial activities under visible-light and dark conditions. J. Phys. Chem. C 2015, 119, 1433–1441. 10.1021/jp510259j. [DOI] [Google Scholar]
- Sakamoto M.; Fujistuka M.; Majima T. Light as a construction tool of metal nanoparticles: Synthesis and mechanism. J. Photochem. Photobiol., C 2009, 10, 33–56. 10.1016/j.jphotochemrev.2008.11.002. [DOI] [Google Scholar]
- Ha S. W.; Lee J. K.; Beck G. R. Jr Synthesis of pH stable, blue light-emitting diode-excited, fluorescent silica nanoparticles and effects on cell behavior. Int. J. Nanomed. 2017, 12, 8699–8710. 10.2147/IJN.S139562. [DOI] [PMC free article] [PubMed] [Google Scholar]
- Soren S.; Kumar S.; Mishra S.; Jena P. K.; Verma S. K.; Parhi P. Evaluation of antibacterial and antioxidant potential of the zinc oxide nanoparticles synthesized by aqueous and polyol method. Microb. Pathog. 2018, 119, 145–151. 10.1016/j.micpath.2018.03.048. [DOI] [PubMed] [Google Scholar]
- Shankar S.; Teng X.; Li G.; Rhim J. W. Preparation, characterization, and antimicrobial activity of gelatin/ZnO nanocomposite films. Food Hydrocolloids 2015, 45, 264–271. 10.1016/j.foodhyd.2014.12.001. [DOI] [Google Scholar]
- Khan K.; Fatima H.; Taqi M. M.; Zia M.; Mirza B. Phytochemical and in vitro biological evaluation of Artemisia scoparia Waldst. & Kit for enhanced extraction of commercially significant bioactive compounds. J. Appl. Res. Med. Aromat. Plants 2015, 2, 77–86. 10.1016/j.jarmap.2015.04.002. [DOI] [Google Scholar]
- Prieto P.; Pineda M.; Aguilar M. Spectrophotometric quantitation of antioxidant capacity through the formation of a phosphomolybdenum complex: specific application to the determination of vitamin E. Anal. Biochem. 1999, 269, 337–341. 10.1006/abio.1999.4019. [DOI] [PubMed] [Google Scholar]
- Wang T.; Jonsdottir R.; Ólafsdóttir G. Total phenolic compounds, radical scavenging and metal chelation of extracts from Icelandic seaweeds. Food Chem. 2009, 116, 240–248. 10.1016/j.foodchem.2009.02.041. [DOI] [Google Scholar]
- Re R.; Pellegrini N.; Proteggente A.; Pannala A.; Yang M.; Rice-Evans C. Antioxidant activity applying an improved ABTS radical cation decolorization assay. Free Radical Biol. Med. 1999, 26, 1231–1237. 10.1016/S0891-5849(98)00315-3. [DOI] [PubMed] [Google Scholar]
- Kim J. S.; Kwon C. S.; Son K. H. Inhibition of alpha-glucosidase and amylase by luteolin, a flavonoid. Biosci., Biotechnol., Biochem. 2000, 64, 2458–2461. 10.1271/bbb.64.2458. [DOI] [PubMed] [Google Scholar]
- Biglar M.; Soltani K.; Nabati F.; Bazl R.; Mojab F.; Amanlou M. A preliminary investigation of the jack-bean urease inhibition by randomly selected traditionally used herbal medicine. Iran. J. Pharm. Res. 2012, 11, 831. [PMC free article] [PubMed] [Google Scholar]
- McDougall G. J.; Kulkarni N. N.; Stewart D. Berry polyphenols inhibit pancreatic lipase activity in vitro. Food Chem. 2009, 115, 193–199. 10.1016/j.foodchem.2008.11.093. [DOI] [Google Scholar]
- Zhang W.; Niu X.; Meng S.; Li X.; He Y.; Pan J.; Qiu F.; Zhao H.; Lan M. Histidine-mediated tunable peroxidase-like activity of nanosized Pd for photometric sensing of Ag+. Sens. Actuators, B 2018, 273, 400–407. 10.1016/j.snb.2018.06.071. [DOI] [Google Scholar]
- Chung F. H. Quantitative interpretation of X-ray diffraction patterns of mixtures. I. Matrix-flushing method for quantitative multicomponent analysis. J. Appl. Crystallogr. 1974, 7, 519–525. 10.1107/S0021889874010375. [DOI] [Google Scholar]
- Kołodziejczak-Radzimska A.; Markiewicz E.; Jesionowski T. Structural characterisation of ZnO particles obtained by the emulsion precipitation method. J. Nanomater. 2012, 2012, 656353 10.1155/2012/656353. [DOI] [Google Scholar]
- Hosokawa M.; Nogi K.; Naito M.; Yokoyama T.. Nanoparticle Technology Handbook; Elsevier, 2007. [Google Scholar]
- Alias S. S.; Ismail A. B.; Mohamad A. A. Effect of pH on ZnO nanoparticle properties synthesized by sol–gel centrifugation. J. Alloys Compd. 2010, 499, 231–237. 10.1016/j.jallcom.2010.03.174. [DOI] [Google Scholar]
- Sivakumar K.; Kumar V. S.; Muthukumarasamy N.; Thambidurai M.; Senthil T. S. Influence of pH on ZnO nanocrystalline thin films prepared by sol–gel dip coating method. Bull. Mater. Sci. 2012, 35, 327–331. 10.1007/s12034-012-0305-7. [DOI] [Google Scholar]
- Khan M.; Naqvi A. H.; Ahmad M. Comparative study of the cytotoxic and genotoxic potentials of zinc oxide and titanium dioxide nanoparticles. Toxicol. Rep. 2015, 2, 765–774. 10.1016/j.toxrep.2015.02.004. [DOI] [PMC free article] [PubMed] [Google Scholar]
- Yuvakkumar R.; Suresh J.; Saravanakumar B.; Nathanael A. J.; Hong S. I.; Rajendran V. Rambutan peels promoted biomimetic synthesis of bioinspired zinc oxide nanochains for biomedical applications. Spectrochim. Acta, Part A 2015, 137, 250–258. 10.1016/j.saa.2014.08.022. [DOI] [PubMed] [Google Scholar]
- Chithra M. J.; Sathya M.; Pushpanathan K. Effect of pH on crystal size and photoluminescence property of ZnO nanoparticles prepared by chemical precipitation method. Acta Metall. Sin. 2015, 28, 394–404. 10.1007/s40195-015-0218-8. [DOI] [Google Scholar]
- Xiong G.; Pal U.; Serrano J. G.; Ucer K. B.; Williams R. T. Photoluminesence and FTIR study of ZnO nanoparticles: the impurity and defect perspective. Phys. Status Solidi C 2006, 3, 3577–3581. 10.1002/pssc.200672164. [DOI] [Google Scholar]
- Stan M.; Popa A.; Toloman D.; Silipas T. D.; Vodnar D. C. Antibacterial and antioxidant activities of ZnO nanoparticles synthesized using extracts of Allium sativum, Rosmarinus officinalis and Ocimum basilicum. Acta Metall. Sin. 2016, 29, 228–236. 10.1007/s40195-016-0380-7. [DOI] [Google Scholar]
- Ak T.; Gülçin İ. Antioxidant and radical scavenging properties of curcumin. Chem.-Biol. Interact. 2008, 174, 27–37. 10.1016/j.cbi.2008.05.003. [DOI] [PubMed] [Google Scholar]
- Das D.; Nath B. C.; Phukon P.; Dolui S. K. Synthesis of ZnO nanoparticles and evaluation of antioxidant and cytotoxic activity. Colloids Surf., B 2013, 111, 556–560. 10.1016/j.colsurfb.2013.06.041. [DOI] [PubMed] [Google Scholar]
- Raajshree K. R.; Durairaj B. Evaluation of The Antityrosinase and Antioxidant potential of Zinc Oxide Nanoparticles synthesized from the brown seaweed–Turbinaria conoides. Int. J. Appl. Pharm. 2017, 9, 116–120. 10.22159/ijap.2017v9i5.20847. [DOI] [Google Scholar]
- Ali A.; Ambreen S.; Javed R.; Tabassum S.; Ul Haq I.; Zia M. ZnO nanostructure fabrication in different solvents transforms physio-chemical, biological and photodegradable properties. Mater. Sci. Eng., C 2017, 74, 137–145. 10.1016/j.msec.2017.01.004. [DOI] [PubMed] [Google Scholar]
- Deetae P.; Parichanon P.; Trakunleewatthana P.; Chanseetis C.; Lertsiri S. Antioxidant and anti-glycation properties of Thai herbal teas in comparison with conventional teas. Food Chem. 2012, 133, 953–959. 10.1016/j.foodchem.2012.02.012. [DOI] [Google Scholar]
- Jeevanandam J.; K. Danquah M.; Debnath S.; S Meka V.; S Chan Y. Opportunities for nano-formulations in type 2 diabetes mellitus treatments. Curr. Pharm. Biotechnol. 2015, 16, 853–870. 10.2174/1389201016666150727120618. [DOI] [PubMed] [Google Scholar]
- Kandra L. α-Amylases of medical and industrial importance. J. Mol. Struct.: THEOCHEM 2003, 666–667, 487–498. 10.1016/j.theochem.2003.08.073. [DOI] [Google Scholar]
- Sadeghi K. S.; Shareghi B.; Salavati M. Urease Activity Protection With EDTA Against Nanoparticles (Fe2O3 and Fe3O4) Inactivation. J. Nanostruct. 2014, 2, 217–226. [Google Scholar]
- Sloan-Dennison S.; Laing S.; Shand N. C.; Graham D.; Faulds K. A novel nanozyme assay utilising the catalytic activity of silver nanoparticles and SERRS. Analyst 2017, 142, 2484–2490. 10.1039/C7AN00887B. [DOI] [PubMed] [Google Scholar]
- Chen Z.; Ji H.; Liu C.; Bing W.; Wang Z.; Qu X. A Multinuclear Metal Complex Based DNase-Mimetic Artificial Enzyme: Matrix Cleavage for Combating Bacterial Biofilms. Angew. Chem. 2016, 128, 10890–10894. 10.1002/ange.201605296. [DOI] [PubMed] [Google Scholar]
- Cheng H.; Zhang L.; He J.; Guo W.; Zhou Z.; Zhang X.; Nie S.; Wei H. Integrated nanozymes with nanoscale proximity for in vivo neurochemical monitoring in living brains. Anal. Chem. 2016, 88, 5489–5497. 10.1021/acs.analchem.6b00975. [DOI] [PubMed] [Google Scholar]
- Sun A.; Mu L.; Hu X. Graphene oxide quantum dots as novel nanozymes for alcohol intoxication. ACS Appl. Mater. Interfaces 2017, 9, 12241–12252. 10.1021/acsami.7b00306. [DOI] [PubMed] [Google Scholar]
- Hatamie S.; Nouri M.; Karandikar S. K.; Kulkarni A.; Dhole S. D.; Phase D. M.; Kale S. N. Complexes of cobalt nanoparticles and polyfunctional curcumin as antimicrobial agents. Mater. Sci. Eng., C 2012, 32, 92–97. 10.1016/j.msec.2011.10.002. [DOI] [Google Scholar]
- Dai T. The antimicrobial effect of blue light: what are behind?. Virulence 2017, 8, 649–652. 10.1080/21505594.2016.1276691. [DOI] [PMC free article] [PubMed] [Google Scholar]
- Akram F. E.; El-Tayeb T.; Abou-Aisha K.; El-Azizi M. A combination of silver nanoparticles and visible blue light enhances the antibacterial efficacy of ineffective antibiotics against methicillin-resistant Staphylococcus aureus (MRSA). Ann. Clin. Microbiol. Antimicrob. 2016, 15, 48 10.1186/s12941-016-0164-y. [DOI] [PMC free article] [PubMed] [Google Scholar]


