Abstract
Xanthine oxidase (XO), which can catalyze the formation of xanthine or hypoxanthine to uric acid, is the most important target of gout. To explore the conformational changes for inhibitor binding, molecular dockings and molecular dynamics simulations were performed. Docking results indicated that three inhibitors had similar pose binding to XO. Molecular dynamics simulations showed that the binding of three inhibitors influenced the secondary structure changes in XO. After binding to the inhibitor, the peptide Phe798-Leu814 formed different degrees of unhelix, while for the peptide Glu1065-Ser1075, only a partial helix region was formed when allopurinol was bound. Through the protein structure analysis in the simulation process, we found that the distance between the active residues Arg880 and Thr1010 was reduced and the distance between Glu802 and Thr1010 was increased after the addition of inhibitors. The above simulation results showed the similarities and differences of the interaction between the three inhibitors binding to the protein. MM-PBSA calculations suggested that, among three inhibitors, allopurinol had the best binding effect with XO followed by daidzin and puerarin. This finding was consistent with previous experimental data. Our results can provide some useful clues for further gout treatment research.
1. Introduction
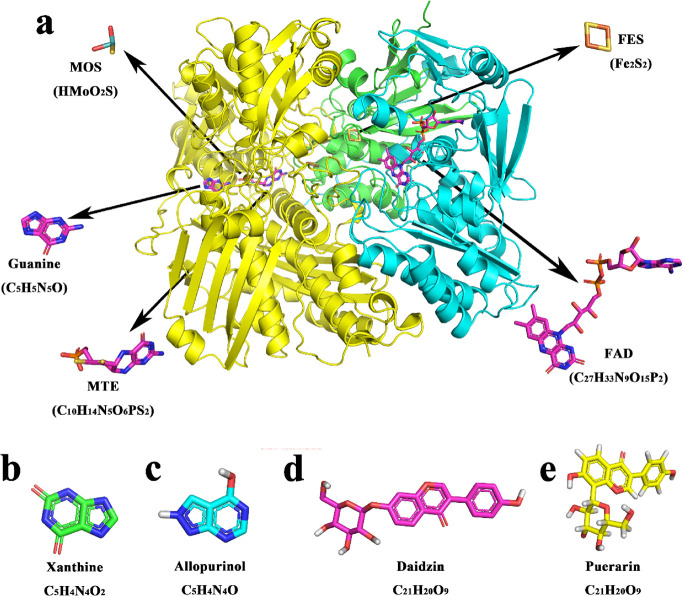
Xanthine oxidase (XO, EC1.17.3.2) (Figure 1a) is an enzyme with low specificity. It can catalyze the formation from hypoxanthine to xanthine (Figure 1b).1−5 Molybdenum in the enzyme exists in the form of molybdopterin cofactor, which is the active site of the enzyme (Figure 1a). The overall structure of XO contained a reductive half-reaction where the substrate was oxidatively hydroxylated at the molybdenum center (Figure 1a). It also included intervening Fe–S centers, where the reducing equivalents were removed from the enzyme with its flavin adenine dinucleotide (FAD).1 XO can be found in livers and kidneys of animals and in bacteria. The substrate of the enzyme, xanthine, is shown in Figure 1b. When the activity of XO in the body is high, the production of uric acid will increase sharply, leading to hyperuricemia and even gout.1,3,4 Hence, XO is the most important target for the treatment of hyperuricemia, gout, and other related diseases.6
Figure 1.
(a) 3D structure of XO structure. Chain A, chain B, and chain C were colored in green, cyan, and yellow, respectively, and the structure of FAD, MTE, guanine, MOS, and FES. (b–e) 3D structure of xanthine, allopurinol, daidzin, and puerarin, respectively.
Allopurinol (the 3D structure is shown in Figure 1c) is a drug that is widely used to treat gout, and it is catalyzed to alloxanthine by xanthine oxidase in vivo.7−9 Allopurinol is a very effective inhibitor and is often used as a positive control in the development of xanthine oxidase inhibitors.10,11 As a commercial drug, allopurinol is highly active against XO but has various serious side effects. The most common side effect is gastrointestinal reaction; after taking the drug, patients may present with increased stools, nausea, vomiting, and abdominal pain. Some patients also present with itching, rash, urticarial, and other symptoms.12,13 Therefore, it is of great significance to study new XO inhibitors with low toxicity and high safety. XO inhibitors derived from natural products have low toxicity and high safety, and they do not easily cause allergic reactions and have a wide range of sources. Some of them can even be used in the daily diet, leading to their popularity.13
Lately, flavonoids that have also been reported to fight against several diseases, such as cardiovascular diseases and cancer, could alleviate the metabolic syndromes related to hyperuricemia and gout.14,15 The abovementioned results suggested that the flavonoids could improve the metabolic syndromes related to hyperuricemia.14,15 Hypoxanthine analogues such as allopurinol described above and flavonoid are all belongs to competitive inhibitors.16 Pueraria is a common Chinese medicine; the dried root of kudzu is used as medicine.17 Daidzin (Figure 1d) and puerarin (Figure 1e) extracted from Pueraria are isoflavone compounds that have mild inhibitory effect on XO.18 The above two types of inhibitors, namely, substrate analogs and flavonoids, have inhibitory effects on xanthine oxidase.18 Puerarin and daidzin, although less active in lowering uric acid levels than allopurinol used clinically, have the ability to enhance antioxidant activity and scavenge oxygen free radicals in the body.10,11 It is very helpful to search for new anti-gout drugs with good activity and less side effect.
In this study, molecular docking and molecular dynamics simulations were performed to explore the binding pose and the conformational changes for inhibitor binding. Our results will provide new ideas for the design, development, and screening of XO inhibitors.
2. Results and Discussion
2.1. The Binding Pose of Three Inhibitors to XO
We re-docked guanine which located in XO (PDB ID: 3NVW)1 to XO with AutoDock Vina software.19 The docking pose was shown in Figure S1a. The RMSD between the docking site and the reference guanine site was 0.49 Å, indicating that the complexes formed by AutoDock Vina was reliable and can be used for further study. The interaction of guanine docked pose and the reference guanine is shown in Figure S1b and Figure S1c, respectively.
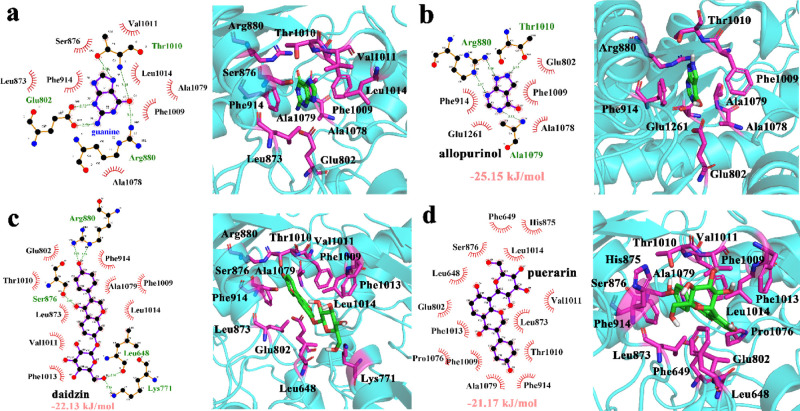
We showed the active binding pocket of guanine in the primitive protein structure, whose PDB ID is 3NVW (Figure 2a).1Figure 2b–d shows the active residues of XO bound to allopurinol, daidzin, and puerarin, respectively. From the results, we can see that all the inhibitors bind to the active pocket of XO. Three inhibitors were located at the active pocket. In Figure 2b, Arg880, Thr1010, Phe914, Glu802, Glu1201, Phe1009, and Ala1078 were the most important residues for allopurinol binding. Arg880 made two hydrogen bonds with allopurinol. Ala1079 and Thr1010 made one hydrogen bond with allopurinol. Figure 2c shows that Arg880, Glu802, Ser876, Leu873, Val1011, Phe1013, Lys771, Leu648, Leu1074, Ala1079, and Phe914 were related to daidzin binding for XO. Meanwhile, for puerarin (Figure 2d), the most important residues binding to XO were Phe649, His875, Ser876, Leu1014, Leu648, Val1011, Glu802, Leu873, Phe1013, Thr1010, Pro1076, Phe1009, Ala1079, and Phe914. We also estimated the free energies of binding for XO-allopurinol, XO-daidzin, and XO-puerarin, which were −25.15, −22.13, and −21.17 kJ/mol, respectively. The three complexes were stable and can be used for further study.
Figure 2.
Binding pocket of (a) guanine (3NVW), (b) allopurinol, (c) daidzin, and (d) puerarin.
2.2. The System Stability and Rigidity of Molecular Dynamics Simulations
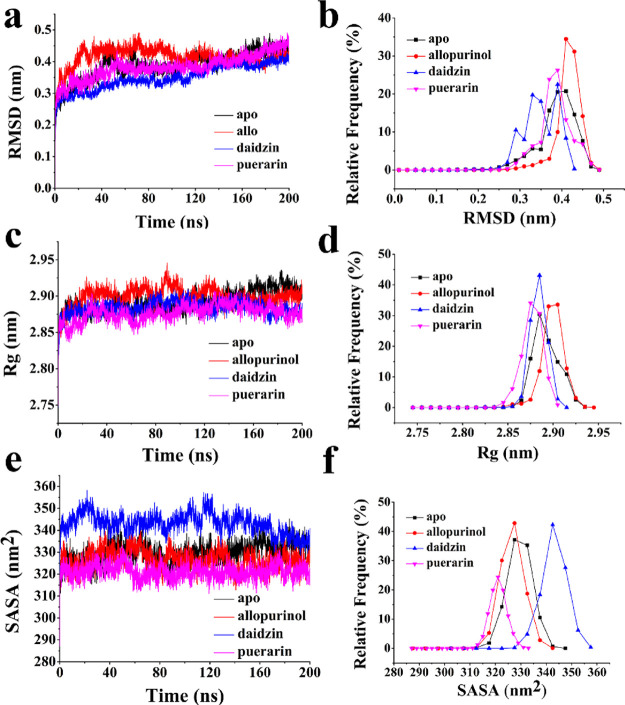
To check the stability of MD simulations, we investigated the average protein Cα backbone root mean square deviation (RMSD) plots and RMSD relative frequency plots (Figure 3a,b). The dynamic behaviors of free protein simulation and XO with allopurinol, daidzin, and puerarin were examined to evaluate the effects of XO modification on dynamic stability, mobility profiles, and geometry changes of these structures. MD simulation for XO without binding inhibitor during trajectories of 200 ns called “apo” in the following figures and with an RMSD value of ∼0.40 nm was used as a reference. From curves where XO combined with allopurinol, the value of RMSD became the highest value of ∼0.43 nm, XO with daidzin had the value of ∼0.35–0.39 nm, and that for XO-puerarin is ∼0.39 nm. Our results indicated that the conformational changes in the null protein were less than that occurred in a protein with allopurinol, more than OX-puerarin and XO-daidzin.
Figure 3.
(a) RMSD for the backbone atoms and (b) the corresponding frequency of the four systems. (c) Radius of gyration (Rg) plot and (d) its corresponding frequency. (e) Average SASA plot and (f) its corresponding frequency. The free XO is represented in red, XO-allopurinol is represented in black, XO-daidzin is represented in blue, and XO-puerarin is represented in pink.
The rigidity of the protein system was examined using Rg values. The Rg plot of the α-carbon atoms versus time at 300 K, and the relative frequency were obtained (Figure 3c,d). During the 200 ns MD simulation time, the Rg value can show the stability of the system. The Rg value for XO was stable at about 2.88 nm and served as a reference. The XO-allopurinol complex had the highest value at approximately 2.92 nm. The XO-puerarin complex had the lowest value of about 2.87 nm, and XO-daidzin had the roughly similar value with XO. The above results showed that the binding of allopurinol caused the protein structure to swell even more, and the binding of puerarin compacted the protein structure.
The rapid and accurate calculation of solvent accessible surface area (SASA) is extremely useful in the energetic analysis of biomolecules. For example, SASA models can be used to estimate the transfer of free energy associated with biophysical processes and, when combined with coarse-grained simulations, can be particularly useful for accounting for solvation effects within the framework of implicit solvent models. The overall conformational changes were further validated by the SASA graph, which was plotted against the MD simulation time (Figure 3e). The probabilities based on the SASA plots (Figure 3f) indicated that, in the XO, SASA values were stable at approximately 326 nm2, and this result was similar to that for the XO-allopurinol complex. XO-puerarin had the lowest value of approximately 320 nm2, whereas XO-daidzin had the highest value of about 342 nm2.
As shown in the abovementioned results, the XO-allopurinol complex had the highest value for RMSD and Rg, indicating that allopurinol binding to XO loosened the structure of the protein compared with the other systems.17,18
2.3. The Protein Fluctuations and Secondary Structure Changes for the Binding of Three Inhibitors
Root mean square fluctuations (RMSFs) were calculated to evaluate the protein residues flexibilities when it combines with nothing or with each inhibitor (Figure 4). To study the mobility changes induced by each inhibitor, the fluctuation of the individual amino acid residues can be explained based on the RMSF values obtained from the 200 ns MD simulation for the four systems. A plot of the RMSF values vs the amino acid residue number was shown. The observed fluctuations were local and limited to the modification sites, as shown in the black boxes in Figure 4. The low average RMSF value suggested that individual amino acid residues exhibited stability in the dynamic state of the protein during the MD simulation. The figure indicated that, in free protein, amino acid residues at the positions of 750–826 and 1042–1075 fluctuated relative to the others in comparison with the other curves. The protein showed more flexibility compared with the XO-inhibitor complex. The amino acid residues fluctuation for combined inhibitor protein were similar during the MD simulation.
Figure 4.
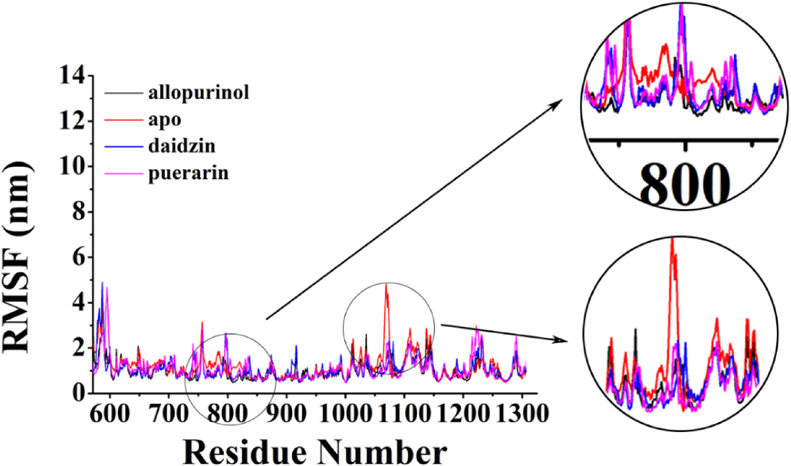
RMSF for the backbone atoms of the four systems. The free XO with the prosthetic group is represented in red, XO-allopurinol is represented in black, XO-daidzin is represented in blue, and XO-puerarin is represented in pink.
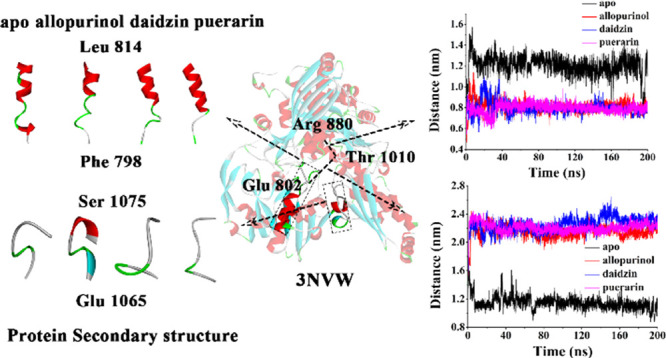
To explore the secondary structure changes for the binding of three inhibitors, secondary structures during MD simulations were calculated (Figure S2). Figure 5a shows the location of residue Phe798 to Leu814 and Glu1065 to Ser1075. The conformational changes caused by three inhibitors were investigated and compared with those caused in the null XO. To investigate the conformational changes, we obtained the difference in the secondary structure (DSSP) by using the do_dssp command of the GROMACS 5.1.4 package. The DSSP of Phe798 to Leu814 residues in XO differed from that in XO-inhibitor systems. The DSSP of Glu1065 to Ser1075 residues in XO-allopurinol differed from those in the others. Figure 5b depicts the DSSP for these two fragments of peptide. Different colors represented various secondary structures. Red and purple denotes the helixes, whereas blue indicates a turn. As shown in Figure 5c, residue Phe798 to Leu814 in XO-inhibitor systems had various degrees of unwinding. However, these residues of null XO were more about forming helix than other structures. Residue Glu1065 to Ser1075 in XO-allopurinol formed a part of helix, and the others were totally loops.
Figure 5.
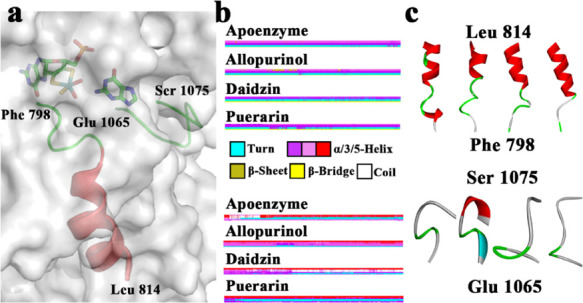
(a) Location of residue Phe798 to Leu814 and Glu 1065 to Ser1075. (b) Differences in the secondary structures of residues Phe798 to Leu814 of the four systems (up) and residues Glu 1065 to Ser1075 (down). (c) Structure of Phe798 to Leu814 (up) and Glu 1065 to Ser1075 (down).
We also calculated the four systems’ probability to form a helix. Among them, we showed the most different regions, which are presented in Table 1. In residue Gly800-Glu802, XO had a probability of 54.89%, whereas the probabilities of the other systems were almost zero. In residue Pro1072-Ser1074, XO-allopurinol had a probability of 90.44%, whereas zero probability was found for the other systems.
Table 1. Probability Table of the α-Helix of the Four Models.
| residue no. | XO | XO-allopurinol | XO-daidzin | XO-puerarin |
|---|---|---|---|---|
| Gly800 | 54.89 | 0.06 | 0 | 0 |
| Lys801 | 54.89 | 0.07 | 0 | 0 |
| Glu802 | 54.82 | 0.07 | 0 | 0 |
| Pro1072 | 0 | 90.44 | 0 | 0 |
| Asn1073 | 0 | 90.44 | 0 | 0 |
| Ser1074 | 0 | 90.44 | 0 | 0 |
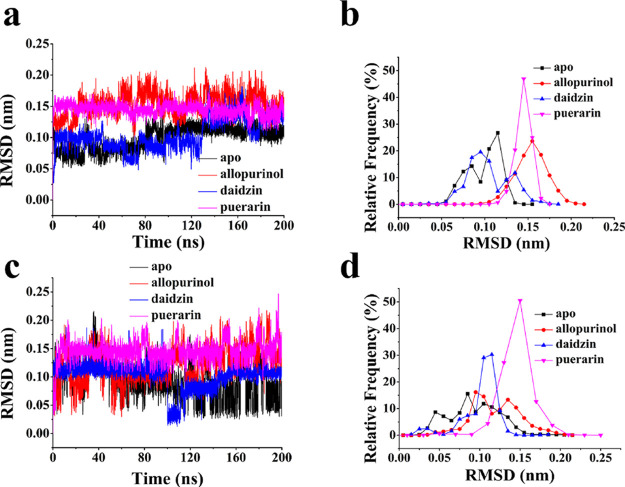
The RMSD curve of this part was considered; for residue Gly800 to Glu802 (Figure 6a,b), XO-allopurinol had the highest RMSD value (∼0.17 nm). The RMSD values are ∼0.12, ∼0.10, and ∼0.15 nm for XO, XO-daidzin, and XO-puerarin, respectively. This phenomenon suggested that the addition of inhibitors made residue Gly800 to Glu802 more volatile. For residue Pro1072 to Ser1074 (Figure 6c,d), XO and XO-allopurinol stayed roughly within the 0.07 and 0.10 nm RMSD value. The RMSD value of XO-puerarin stabilized at 0.15 nm. However, the RMSD value of daidzin was kept at 0.12 nm, showing that XO and XO-allopurinol had less deviation at Pro1072-Ser1074.
Figure 6.
(a) RMSD of the location of residue Gly800-Glu802 and (b) its relative frequency. (c) RMSD of the location of residue Pro1072-Ser1074 and (d) its relative frequency.
2.4. Principal Component and Free Energy Landscape Analysis
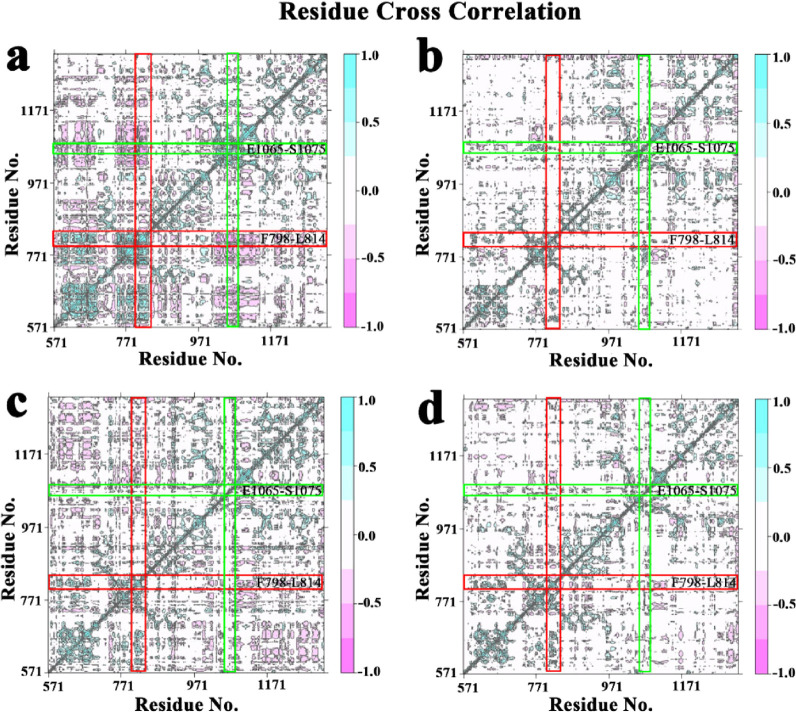
Cross-correlation analysis was carried out to probe the internal dynamics of different system, and the results are depicted in Figure 7. Four systems exhibited obvious difference in the correlated extents of protein motion. The positive regions (pink) indicated the strongly correlated motions of residues, while the negative regions (cyan) were associated with the anti-correlated movements. The movement of the residue itself generally pulls the surrounding atoms in the same direction, so the diagonal regions show highly positively correlated structural motion. For the two peptides we focused on above, the phenomenon was significantly pronounced that free protein displayed the strongest correlated motions (Figure 7a), and the weaker correlated motions were shown in XO-allopurinol (Figure 7b), XO-daidzin (Figure 7c), and XO-puerarin (Figure 7d). The above results indicate that when XO combined with an inhibitor, the correlated motions were reduced.
Figure 7.
Cross-correlation matrix of the fluctuations of each of the x, y, and z coordinates of the Cα atoms from their average during 200 ns MD for (a) the Free XO with the prosthetic group, (b) XO-allopurinal, (c) XO-daidzin, and (d) XO-puerarin.
Principal component analysis (PCA) was performed to study the collective motions of the four systems. Hence, a collective atomic motion of a particular protein is used as a parameter to understand the stability of the protein. PCA is used to investigate the global motions of protein into a few principal motions characterized by eigenvectors and eigenvalues. In order to further clarify the specific movement trend of each region, the first principal component (PC1) was visualized to describe the main movement during the 200 ns MD simulation through arrows, as shown in Figure 8. Only the arrows at the position of residues with an RMSD greater than 0.1 nm are shown in the figure. By observing the PC1 of the empty protein, it could be found that there was a slight movement, the overall tendency to gather in the pocket, maintaining the density of XO during the simulation (Figure 8a). Similarly, the amplitudes of XO-daidzin (Figure 8c) and XO-puerarin (Figure 8d) were also small, and the trend was similar to that of empty protein. In contrast, in the XO-allopurinol system, the movement trend at the inhibitor binding pocket was much stronger than that of the empty protein, and these motions may be related to the effect of the allopurinol that is better than those of daidzin and puerarin.
Figure 8.
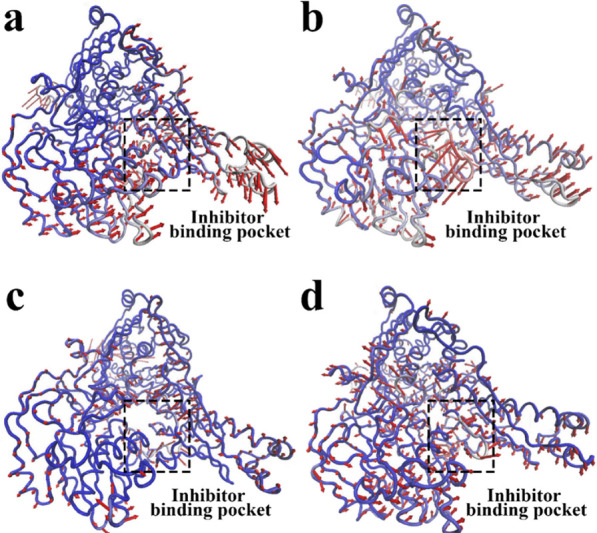
Motions based on the first PC for (a) the free XO with the prosthetic group, (b) XO-allopurinal, (c) XO-daidzin, and (d) XO-puerarin.
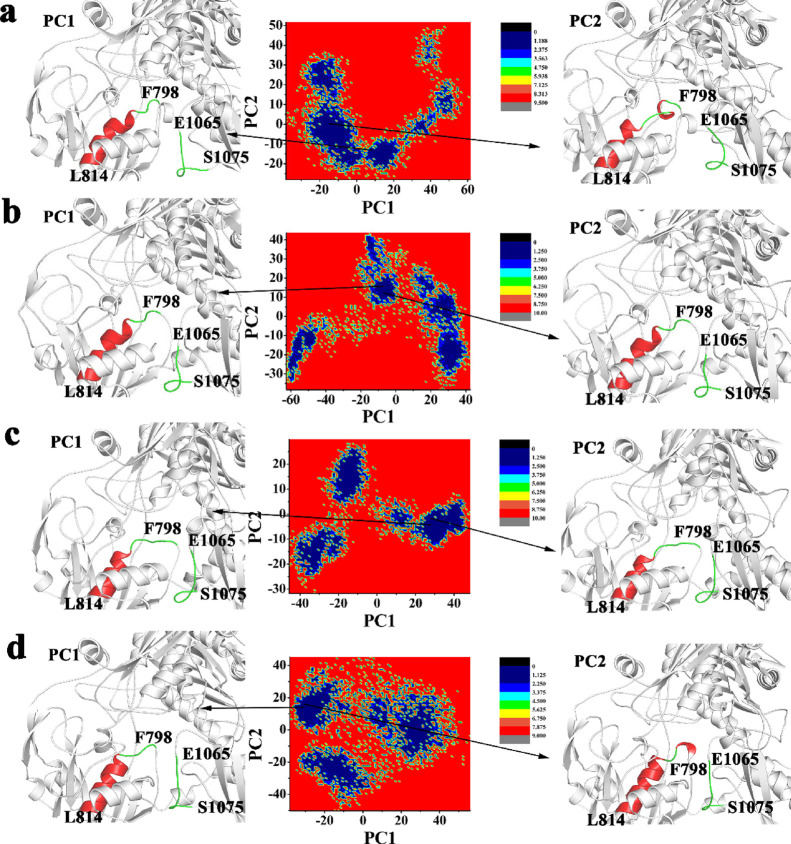
The Gibbs free energy landscape (FEL) was calculated using the first two principal components as reaction coordinates. Using PCA, Helmholtz free energy change was calculated, and the FELs obtained from the simulations were plotted, as shown in Figure 9. The FEL can provide remarkable information about the different conformational states accessible to the protein in the simulation. The energy minima of the landscape were visualized. The results showed that the free energy landscape maps formed in XO (Figure 9a), XO-allopurinol (Figure 9b), XO-daidzin (Figure 9c), and XO-puerarin (Figure 9d) all had two minimum energy values in the single lowest energy basin, and the free energy analysis values were below 1.188, 1.250, and 1.125 kJ /mol, indicating that the three systems had good stability, and their PC1 and PC2 were very representative and are shown in the figure. This energy minimum corresponded to a structure with some loss of irregular secondary structures such as coils and turns. Table 2 lists the probabilities of PC1 and PC2 of the four systems, and the two most stable conformations of the XO structure in the four systems are shown in the left and right panels of Figure 9. It can be seen that the sum of the proportion of variance of PC1 and PC2 is close to half or more than half, indicating that the system shows a certain stability, and the principal components have plenty of the characteristics to represent the whole trajectory. The whole curves about eigenvalue rank vs proportion of variance are shown in Figure S3 and are sufficient to provide a useful description while still retaining most of the variance in the original distribution.
Figure 9.
Free energy landscape (FEL) analysis and structures of the residue Phe798-Leu814 and Glu1065-Ser1075 colored by secondary structures for (a) the free XO with the prosthetic group, (b) XO-allopurinol, (c) XO-daidzin, and (d) XO-puerarin.
Table 2. Probability of PC1 and PC2 during MD Simulation.
| system | principal component (PC) | proportion of variance (%) |
|---|---|---|
| XO | PC1 | 29.36 |
| PC2 | 15.83 | |
| XO-allopurinol | PC1 | 47.04 |
| PC2 | 14.81 | |
| XO-daidzin | PC1 | 43.54 |
| PC2 | 8.72 | |
| XO-puerarin | PC1 | 27.67 |
| PC2 | 16.91 |
2.5. Interaction between the Ligand and Protein at Stable Time and Distances between Important Residues during Simulations
In this study, the similar structures of the trajectories of the four systems were divided into different groups using the RMSD-based clustering method (Figure S4).20 The cutoff was set as 0.2 nm. Through cluster analysis, we can get the most representative structure, which we chose to obtain prospective ligand–protein interactions to compare the binding affinities of different ligands. Nodes were colored according to the secondary structure of the residue as follows: pink for loop, blue for helix, and yellow for sheet. With the simulation, the inhibitor binding site changed slightly. For XO-allopurinol (Figure 10a), Ala1079, Gly1006, and Gly913 had main chain interaction with allopurinol. Ser1080, Ala1079, Phe1005, Glu1261, Ile1007, Pro1262, Phe1009, and Phe914 had side chain interaction with allopurinol. For XO-daidzin (Figure 10b), Ser774, Phe649, Gly647, and Leu648 had main chain interaction with daidzin, and Ser774, Phe649, Phe775, Leu648, and Asn650 had side chain interaction with daidzin. For XO-puerarin (Figure 10c), Ser1074 had main chain interaction with puerarin, and Phe1013, Pro1076, Asn1073, Phe649, Leu648, Ser1075, Leu1014, and Leu873 had side chain interaction with puerarin. Allopurinol binds most closely to proteins. The protein was weakly bound to daidzin and puerarin.
Figure 10.
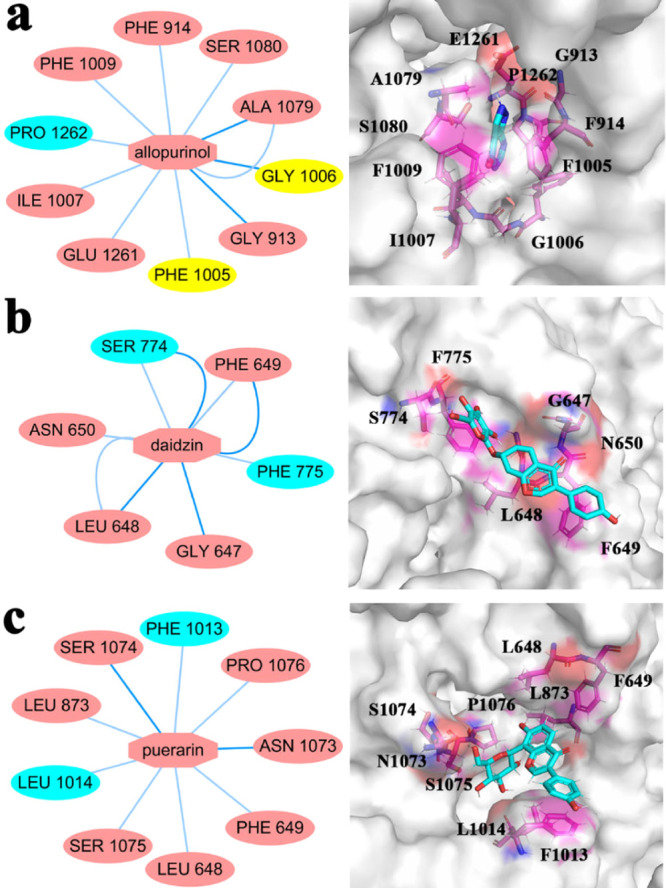
Subnetwork analysis of the protein–ligand interaction. (a) Subnetwork between protein and allopurinol; (b) subnetwork between protein and daidzin; (c) subnetwork between protein and puerarin.
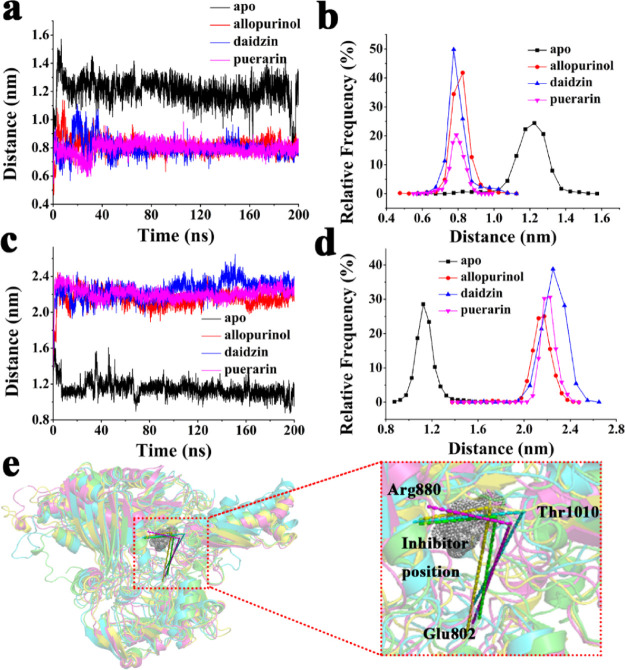
To further understand the spatial structure of the protein, we calculated the distances between residues according to the important residues in the active pocket of the protein in the PDB database. The curves of distance changes and relative frequencies between Arg880 and Thr1010 and between Glu802 and Thr1010 are displayed in Figure 11a–d, and the positions of these residues and ligands are displayed in Figure 11e. The distance between Arg880 and Thr1010 decreased with the addition of an inhibitor. The distance between Glu802 and Thr1010 increased with the addition of an inhibitor. Glu802 and Arg880 are important residues for xanthine oxidase to play a catalytic role. From the structural morphology of the protein, the surrounding peptides of Arg880 and Thr1010 are at the bottleneck of the active site, possibly because the binding of the inhibitor tightens the active pocket to better display the inhibitory effect. However, Glu802 is on the other side of the inhibitor, and the addition of the inhibitor will increase the distance between Glu802 and Thr1010 due to steric hindrance.
Figure 11.
(a) Distance plots between Arg880 and Thr1010 and (b) relative frequency. (c) Distance plots between Glu802 and Thr1010 and (d) relative frequency. (e) Position of Glu802, Arg880, Thr1010. and inhibitor.
2.6. MM-PBSA Calculations
We performed MMPBSA on the trajectories after the systems stabilized during the simulation. If the results show that the lower the binding energy is, the more stable the ligand binds to the protein, and it is not easy to disengage. G-mmpbsa methodology was used to calculate the binding affinity of ligands. By calculating potential energy in a vacuum, van der Waals, electrostatic interactions, and net non-bonded potential energy between the protein and ligands were calculated, as shown in Table 3. An average binding energy equal to −79.91 ± 1.04 kJ/mol was the lowest achieved for XO-allopurinol, indicating that the interaction between allopurinol and XO was the strongest. The average binding energy of XO-daidzin was lower than that of XO-puerarin, which were −77.58 ± 1.18 kJ/mol and −53.65 ± 1.19 kJ/mol, respectively. In the existing experimental study, Dr. Tang et al. determined the IC50 values of puerarin and daidzin on XO inhibition, which were 30.8 and 5.31 μg mL–1, respectively.21 Other researchers have also reported the XO inhibition effects of these two compounds.22,23 At the same time, Dr. Tang et al. also proved that the quenching mode of daidzin and puerarin combined with XO can be considered as static quenching. Therefore, they gave the binding constants, which were 5.08 for daidzin and 4.31 for puerarin, indicating that daidzin has stronger binding ability than puerarin. This result indicated that daidzin had stronger binding ability than puerarin, which confirmed our results.
Table 3. Calculated Binding Free Energies by the MM-PBSA Method (All in kJ/mol).
| allopurinol | daidzin | puerarin | |
|---|---|---|---|
| van der Waals energy | –94.37 ± 0.85 | –125.74 ± 1.47 | –78.92 ± 1.39 |
| electrostatic energy | –8.91 ± 0.65 | –12.96 ± 1.01 | –10.48 ± 1.07 |
| polar solvation energy | 31.28 ± 0.56 | 72.61 ± 1.30 | 46.53 ± 1.44 |
| SASA energy | –7.78 ± 0.05 | –11.64 ± 0.15 | –10.74 ± 0.18 |
| binding energy | –79.91 ± 1.04 | –77.58 ± 1.18 | –53.65 ± 1.19 |
3. Materials and Methods
3.1. Preparation of Simulation System
The initial structure of the protein was XO (PDB ID: 3NVW) from the Protein Data Bank (PDB).1 The enzyme has been found to be a homodimer, with each subunit containing four active sites: the polypeptide domain, an active site molybdenum center, a pair of spinach ferredoxin-like [2Fe-2S] clusters, and FAD domain, respectively, and we used a monomeric variant in this simulation.1 In 3NVW, guanine was used to define the binding site and removed before the docking.
The 3D structures of allopurinol, daidzin, and puerarin were downloaded from the Chemspider database. In this study, AutoDock Vina19 was used to construct both XO-allopurinol, XO-daidzin, and XO-puerarin complexes. In the AutoDock Vina configuration files, the parameter num_modes was set to 9 Å. We identified the receptor binding pocket based on the point of the substrate binding to the XO. Hence, we kept all the rotatable bonds in ligands flexible during the docking procedure, and we kept all the protein residues inside the binding pockets rigid. The Kollman charges were used to convert all receptors and ligands to the PDBQT format using the AutoDockTools package.24
3.2. Molecular Dynamics Simulations
MD simulation of all protein systems was performed using the Gromacs 5.1.4 package followed by subsequent analysis.25 We selected amber99SB-ILDN26 as the force field of the simulations because it accurately described many protein structural and dynamic properties. The parameterization of allopurinol, daidzin, and puerarin was performed by the PRODRG2.5 server.27 The complexes were solvated using the TIP3P water model,28 neutralized by adding Na+ and Cl–ions, and then minimized for 5000 steps using the steepest descent method. After system minimization, constant number of particles, volume, and temperature and constant number of particles, pressure, and temperature were maintained in the MD simulations.29 The production simulations were performed at 300 K for 200 ns in the four systems, namely, those that included XO with just the prosthetic group, XO-allopurinol, XO-daidzin, and XO-puerarin. The LINCS (linear constraint solver) algorithm was applied to constrain covalent bonds, the hydrogen atoms were constrained using the SHAKE algorithm, and the electrostatic interactions were processed using the particle mesh Ewald (PME) method.29,30 A time step of 2 fs was selected for the simulations. The MD trajectories were recorded every 10 ps. MD trajectories can be visualized in the visual molecular dynamics (VMD) 1.9.1 software. The structural parameters of the four systems were accessed through the root-mean-square-deviation (RMSD), all-to-all RMSD, root-mean square-fluctuation (RMSF), radius of gyration (Rg), and solvent accessible surface area (SASA) analyses.31,32
3.3. Principal Component and Free Energy Landscape Analysis
Principal component analysis (PCA) was performed using Bio3D version 2.3.0 to study the collective motions in 200 ns of XO-allopurinol, XO-daidzin, and XO-puerarin.33,34 This method uses the calculation and diagonalization of the covariance matrix. The covariance matrix is calculated as follows:
where xi/xj is the coordinate of the ith/jth atom of the systems, and ⟨ ⟩ represents an ensemble average. Free energy landscape (FEL) is a map of all possible conformations of molecular entities and can be used to understand the stability, folding, and function of the protein.35 The FEL can be constructed as follows:
where KB is the Boltzmann constant, T is the temperature of simulation systems, and 300 K is set in the current calculations. P(X) is the probability distribution of the molecular system along the PCs.
3.4. Protein Interaction Networks
Computer-aided models of biological networks are the cornerstone of systems biology. Residue interaction networks (RINs) are networks based on 3D structures in which nodes represent amino acids, and edges represent interactions among the detected amino acids.36 Cytoscape is an open-source software project for integrating biomolecular interaction networks with high-throughput expression data and other molecular states into a unified conceptual framework.37 A network is visually integrated with expression spectrum, phenotype, and other molecular states and is connected with the functional annotation database. The core can be extended with a simple plug-in architecture that allows the rapid development of additional computational analysis and features. The mean structure was derived from the 200 nanosecond trajectory, and the RINs of the strain were constructed using the system of XO-allopurinol, XO-daidzin, and XO-puerarin. The parameters of generation networks were as follows: the overlap cutoff was −0.4 Å; and the distance cutoff was 5.0 Å.
3.5. MM-PBSA Calculations
Molecular mechanics Poisson–Boltzmann surface area (MM/PBSA) is a popular method to calculate the binding free energy between protein and ligands; it is more accurate than most scoring functions of molecular docking and less computationally demanding than alchemical free energy methods.38−40 The formula is as follows:
g_mmpbsa is an open-source package for Gromacs and can be used to calculate binding energies of biomolecular complexes from the MD trajectories.41 g_mmpbsa can choose different types of atomic radius to calculate polar solvation energy. The tool also provides options for nonpolar solvation models. Finally, the calculated total binding energy can be decomposed into contributions per residue using g_mmpbsa. In this study, we calculated 200 points uniformly in the balanced trajectory.
4. Conclusions
Allopurinol was added to loosen the structure of the protein as a whole, and the fluctuation, torsion were increased. The effect of daidzin on protein was very small. Puerarin could reduce the fluctuation of carbon skeleton, torsion and surface area of protein. The addition of different inhibitors had different local effects on the protein. In Phe798-Leu814, the addition of inhibitors reduce the protein helix. Allopurinol had the greatest influence followed by daidzin and puerarin. The binding of allopurinol caused XO to form a stable helix from Glu1065 to Ser1075, but the effects of daidzin and puerarin were not significant. The addition of inhibitors brought the binding pocket residues closer together, among which allopurinol bound the protein most closely, leading to the close proximity of the active pocket residues, and allopurinol has the lowest binding energy. The above results showed that the allopurinol combined with XO is the best and consisted with the allopurinol highly efficient high toxicity experiment results. Puerarin and daidzin, as mild inhibitors, had little effect on the motions of protein and lower binding energy to protein. We could able to predict inhibitor efficacy by observing secondary structure changes of protein residues Phe798-Leu814 and Glu1065-Ser1075 and pocket tightness in the computer-simulated inhibitor-protein complex, which may provide a basis for future gout treatment and drug design.
Acknowledgments
This work was supported by the Overseas Cooperation Project of Jilin Province [20200801069GH] and the National Natural Science Foundation of China [31870201]. This work was performed at the High-performance Computing Center of Jilin University.
Supporting Information Available
The Supporting Information is available free of charge at https://pubs.acs.org/doi/10.1021/acsomega.1c00968.
Original and re-docked position of guanine and the interactions around the guanine in XO, secondary structure profile, percentage of eigenvalue, and cluster analysis data (PDF)
The authors declare no competing financial interest.
Supplementary Material
References
- Cao H.; Hall J.; Hille R. Substrate orientation and specificity in xanthine oxidase: crystal structures of the enzyme in complex with indole-3-acetaldehyde and guanine. Biochemistry 2014, 53, 533–541. 10.1021/bi401465u. [DOI] [PubMed] [Google Scholar]
- Cao H.; Pauff J. M.; Hille R. X-ray crystal structure of a xanthine oxidase complex with the flavonoid inhibitor quercetin. J. Nat. Prod. 2014, 77, 1693–1699. 10.1021/np500320g. [DOI] [PubMed] [Google Scholar]
- Dong C.; Montes M.; Al-Sawai W. M. Xanthine oxidoreductase inhibition – A review of computational aspect. J. Theor. Comput. Chem. 2020, 19, 2040008. 10.1142/S0219633620400088. [DOI] [Google Scholar]
- Kumar R.; Joshi G.; Kler H.; Kalra S.; Kaur M.; Arya R. Toward an Understanding of Structural Insights of Xanthine and Aldehyde Oxidases: An Overview of their Inhibitors and Role in Various Diseases. Med. Res. Rev. 2018, 38, 1073–1125. 10.1002/med.21457. [DOI] [PubMed] [Google Scholar]
- Schwarz G. Molybdenum cofactor and human disease. Curr. Opin. Chem. Biol. 2016, 31, 179–187. 10.1016/j.cbpa.2016.03.016. [DOI] [PubMed] [Google Scholar]
- Zhang B.; Dai X.; Bao Z.; Mao Q.; Duan Y.; Yang Y.; Wang S. Targeting the subpocket in xanthine oxidase: Design, synthesis, and biological evaluation of 2-[4-alkoxy-3-(1H-tetrazol-1-yl) phenyl]-6-oxo-1,6-dihydropyrimidine-5-carboxylic acid derivatives. Eur. J. Med. Chem. 2019, 181, 111559. 10.1016/j.ejmech.2019.07.062. [DOI] [PubMed] [Google Scholar]
- Liu C. W.; Chang W. C.; Lee C. C.; Shau W. Y.; Hsu F. S.; Wang M. L.; Chen T. C.; Lo C.; Hwang J. J. The net clinical benefits of febuxostat versus allopurinol in patients with gout or asymptomatic hyperuricemia - A systematic review and meta-analysis. Nutr., Metab. Cardiovasc. Dis. 2019, 29, 1011–1022. 10.1016/j.numecd.2019.06.016. [DOI] [PubMed] [Google Scholar]
- Ju C.; Lai R. W. C.; Li K. H. C.; Hung J. K. F.; Lai J. C. L.; Ho J.; Liu Y.; Tsoi M. F.; Liu T.; Cheung B. M. Y.; Wong I. C. K.; Tam L. S.; Tse G. Comparative cardiovascular risk in users versus non-users of xanthine oxidase inhibitors and febuxostat versus allopurinol users. Rheumatology 2020, 59, 2340–2349. 10.1093/rheumatology/kez576. [DOI] [PubMed] [Google Scholar]
- Yang Y.; He J.; Yuan M.; Tse G.; Zhang K.; Ma Z.; Li J.; Zhang Y.; Gao Y.; Zhang Y.; Wang R.; Li G.; Liu T. Xanthine oxidase inhibitor allopurinol improves atrial electrical remodeling in diabetic rats by inhibiting CaMKII/NCX signaling. Life Sci. 2020, 259, 118290. 10.1016/j.lfs.2020.118290. [DOI] [PubMed] [Google Scholar]
- Nile S. H.; Nile A.; Oh J.-W.; Kai G. Soybean processing waste: Potential antioxidant, cytotoxic and enzyme inhibitory activities. Food Biosci. 2020, 38, 100778. 10.1016/j.fbio.2020.100778. [DOI] [Google Scholar]
- Xing Z. H.; Ma Y. C.; Li X. P.; Zhang B.; Zhang M. D. Research progress of puerarin and its derivatives on anti-inflammatory and anti-gout activities. China J. Chin. Mater. Med. 2017, 42, 3703–3708. 10.19540/j.cnki.cjcmm.20170907.003. [DOI] [PubMed] [Google Scholar]
- El-Sheikh A.; Abdelzaher W.; Gad A.; Abdel-Gaber S. Purine versus non-purine xanthine oxidase inhibitors against cyclophosphamide-induced cardiac and bone marrow toxicity in rats. Hum. Exp. Toxicol. 2020, 39, 249–261. 10.1177/0960327119883412. [DOI] [PubMed] [Google Scholar]
- Orhan I. E.; Deniz F. S. S. Natural Products and Extracts as Xantine Oxidase Inhibitors - A Hope for Gout Disease?. Curr. Pharm. Des. 2021, 27, 143–158. 10.2174/1381612826666200728144605. [DOI] [PubMed] [Google Scholar]
- Mehmood A.; Zhao L.; Wang C.; Hossen I.; Nadeem M. Stevia residue extract alone and combination with allopurinol attenuate hyperuricemia in fructose-PO-induced hyperuricemic mice. J. Food Biochem. 2020, 44, e13087 10.1111/jfbc.13087. [DOI] [PubMed] [Google Scholar]
- Mohos V.; Fliszár-Nyúl E.; Poór M. Inhibition of Xanthine Oxidase-Catalyzed Xanthine and 6-Mercaptopurine Oxidation by Flavonoid Aglycones and Some of Their Conjugates. Int. J. Mol. Sci. 2020, 21, 3256. 10.3390/ijms21093256. [DOI] [PMC free article] [PubMed] [Google Scholar]
- Luna G.; Dolzhenko A. V.; Mancera R. L. Inhibitors of Xanthine Oxidase: Scaffold Diversity and Structure-Based Drug Design. ChemMedChem 2019, 14, 714–743. 10.1002/cmdc.201900034. [DOI] [PubMed] [Google Scholar]
- Wang S.; Zhang S.; Wang S.; Gao P.; Dai L. A comprehensive review on Pueraria: Insights on its chemistry and medicinal value. Biomed. Pharmacother. 2020, 131, 110734. 10.1016/j.biopha.2020.110734. [DOI] [PubMed] [Google Scholar]
- Ma X.; Yan L.; Zhu Q.; Shao F. Puerarin attenuates cisplatin-induced rat nephrotoxicity: The involvement of TLR4/NF-κB signaling pathway. PLoS One 2017, 12, e0171612 10.1371/journal.pone.0171612. [DOI] [PMC free article] [PubMed] [Google Scholar]
- Nguyen N. T.; Nguyen T. H.; Pham T. N. H.; Huy N. T.; Bay M. V.; Pham M. Q.; Nam P. C.; Vu V. V.; Ngo S. T. Autodock Vina Adopts More Accurate Binding Poses but Autodock4 Forms Better Binding Affinity. J. Chem. Inf. Model. 2020, 60, 204–211. 10.1021/acs.jcim.9b00778. [DOI] [PubMed] [Google Scholar]
- Gomez A.; Vöhringer-Martinez E. Conformational sampling and polarization of Asp26 in pKa calculations of thioredoxin. Proteins: Struct., Funct., Bioinf. 2019, 87, 467–477. 10.1002/prot.25668. [DOI] [PubMed] [Google Scholar]
- Tang X.; Xiao A.; Mei S.; Tang P.; Ren L.; Liu L. Pueraria lobata Root Constituents as Xanthine Oxidase Inhibitors and Protective Agents against Oxidative Stress Induced in GES-1 Cells. J. Braz. Chem. Soc. 2020, 31, 2071–2081. 10.21577/0103-5053.20200108. [DOI] [Google Scholar]
- Liu L.; Xiao A.; Ma L.; Li D. Analysis of Xanthine Oxidase Inhibitors from Puerariae flos Using Centrifugal Ultrafiltration Coupled with HPLC-MS. J. Braz. Chem. Soc. 2016, 28, 360–366. 10.5935/0103-5053.20160185. [DOI] [Google Scholar]
- Mo S. F.; Zhou F.; Lv Y. Z.; Hu Q. H.; Zhang D. M.; Kong L. D. Hypouricemic action of selected flavonoids in mice: structure-activity relationships. Biol. Pharm. Bull. 2007, 30, 1551–1556. 10.1248/bpb.30.1551. [DOI] [PubMed] [Google Scholar]
- Morris G. M.; Huey R.; Lindstrom W.; Sanner M. F.; Belew R. K.; Goodsell D. S.; Olson A. J. AutoDock4 and AutoDockTools4: Automated docking with selective receptor flexibility. J. Comput. Chem. 2009, 30, 2785–2791. 10.1002/jcc.21256. [DOI] [PMC free article] [PubMed] [Google Scholar]
- Agrahari A. K.; Doss G. P. C.; Siva R.; Magesh R.; Zayed H. Molecular insights of the G2019S substitution in LRRK2 kinase domain associated with Parkinson’s disease: A molecular dynamics simulation approach. J. Theor. Biol. 2019, 469, 163–171. 10.1016/j.jtbi.2019.03.003. [DOI] [PubMed] [Google Scholar]
- Somavarapu A. K.; Kepp K. P. The Dependence of Amyloid-β Dynamics on Protein Force Fields and Water Models. ChemPhysChem 2015, 16, 3278–3289. 10.1002/cphc.201500415. [DOI] [PubMed] [Google Scholar]
- Eslami H.; Mojahedi F.; Moghadasi J. Molecular dynamics simulation with weak coupling to heat and material baths. J. Chem. Phys. 2010, 133, 084105 10.1063/1.3474951. [DOI] [PubMed] [Google Scholar]
- Nguyen T. T.; Viet M. H.; Li M. S. Effects of water models on binding affinity: evidence from all-atom simulation of binding of tamiflu to A/H5N1 neuraminidase. Sci. World J. 2014, 2014, 1–14. 10.1155/2014/536084. [DOI] [PMC free article] [PubMed] [Google Scholar]
- O’Driscoll P.; Merényi E.; Karmonik C.; Grossman R.. SOM and MCODE methods of defining functional clusters in MRI of the brain. In 2014 36th Annual International Conference of the IEEE Engineering in Medicine and Biology Society;IEEE: 2014, 2014, 734–737. [DOI] [PubMed]
- Laino T.; Hutter J. Notes on ″Ewald summation of electrostatic multipole interactions up to quadrupolar level″ [J. Chem. Phys. 119, 7471 (2003)]. J. Chem. Phys. 2008, 129, 074102 10.1063/1.2970887. [DOI] [PubMed] [Google Scholar]
- Yu Z.; Han J.; Liu Y.; Zhu J.; Tian X.; Han W. Molecular Dynamics Simulations and Steered Molecular Dynamics Simulations of Glabridin Bound to Wild Type and V30A Mutant Transthyretin: Ligand-linked Perturbation of Tertiary Conformation. Chem. Res. Chin. Univ. 2018, 34, 995–1003. 10.1007/s40242-018-8085-2. [DOI] [Google Scholar]
- Zhu J.; Li C.; Yang H.; Guo X.; Huang T.; Han W. Computational Study on the Effect of Inactivating/Activating Mutations on the Inhibition of MEK1 by Trametinib. Int. J. Mol. Sci. 2020, 21, 2167. 10.3390/ijms21062167. [DOI] [PMC free article] [PubMed] [Google Scholar]
- Grant B. J.; Rodrigues A. P. C.; ElSawy K. M.; McCammon J. A.; Caves L. S. D. Bio3d: an R package for the comparative analysis of protein structures. Bioinformatics 2006, 22, 2695–2696. 10.1093/bioinformatics/btl461. [DOI] [PubMed] [Google Scholar]
- Amir M.; Mohammad T.; Kumar V.; Alajmi M. F.; Rehman M. T.; Hussain A.; Alam P.; Dohare R.; Islam A.; Ahmad F.; Hassan M. I. Structural Analysis and Conformational Dynamics of STN1 Gene Mutations Involved in Coat Plus Syndrome. Front. Mol. Biosci. 2019, 6, 41. 10.3389/fmolb.2019.00041. [DOI] [PMC free article] [PubMed] [Google Scholar]
- Singh A.; Somvanshi P.; Grover A. Pyrazinamide drug resistance in RpsA mutant (Δ438A) of Mycobacterium tuberculosis: Dynamics of essential motions and free-energy landscape analysis. J. Cell. Biochem. 2019, 120, 7386–7402. 10.1002/jcb.28013. [DOI] [PubMed] [Google Scholar]
- Doncheva N. T.; Klein K.; Domingues F. S.; Albrecht M. Analyzing and visualizing residue networks of protein structures. Trends Biochem. Sci. 2011, 36, 179–182. 10.1016/j.tibs.2011.01.002. [DOI] [PubMed] [Google Scholar]
- Shannon P.; Markiel A.; Ozier O.; Baliga N. S.; Wang J. T.; Ramage D.; Amin N.; Schwikowski B.; Ideker T. Cytoscape: a software environment for integrated models of biomolecular interaction networks. Genome Res. 2003, 13, 2498–2504. 10.1101/gr.1239303. [DOI] [PMC free article] [PubMed] [Google Scholar]
- Wang E.; Sun H.; Wang J.; Wang Z.; Liu H.; Zhang J. Z. H.; Hou T. End-Point Binding Free Energy Calculation with MM/PBSA and MM/GBSA: Strategies and Applications in Drug Design. Chem. Rev. 2019, 119, 9478–9508. 10.1021/acs.chemrev.9b00055. [DOI] [PubMed] [Google Scholar]
- Genheden S.; Ryde U. The MM/PBSA and MM/GBSA methods to estimate ligand-binding affinities. Expert Opin. Drug Discovery 2015, 10, 449–461. 10.1517/17460441.2015.1032936. [DOI] [PMC free article] [PubMed] [Google Scholar]
- Chen F.; Liu H.; Sun H.; Pan P.; Li Y.; Li D.; Hou T. Assessing the performance of the MM/PBSA and MM/GBSA methods. 6. Capability to predict protein-protein binding free energies and re-rank binding poses generated by protein-protein docking. Phys. Chem. Chem. Phys. 2016, 18, 22129–22139. 10.1039/C6CP03670H. [DOI] [PubMed] [Google Scholar]
- Kumari R.; Kumar R.; Lynn A.; Lynn A. g_mmpbsa—A GROMACS Tool for High-Throughput MM-PBSA Calculations. J. Chem. Inf. Model. 2014, 54, 1951–1962. 10.1021/ci500020m. [DOI] [PubMed] [Google Scholar]
Associated Data
This section collects any data citations, data availability statements, or supplementary materials included in this article.


