

Abstract

Nanocomposite hydrogels are attracting significant interest due to their potential use in drug delivery systems and tissue scaffolds. Stimuli-responsive hydrogel nanocomposites are of particular interest due to sustained release of therapeutic agents from the hydrogel. However, challenges such as controlled release of therapeutic agents exist because of limited understanding of the interactions between the therapeutic agent and the hydrogel. To investigate the interaction, we synthesize a hydrogel nanocomposite by crosslinking the hydrogel precursors (tetrazine-modified polyethylene glycol and norbornene-modified hyaluronic acid) using click chemistry while bovine serum albumin-capped silver nanoparticles were encapsulated in situ in the matrix. The interaction between the nanoparticles and the hydrogel was studied by a combination of spectroscopic techniques. X-ray photoelectron spectroscopy results suggest that the hydrogel molecule rearranges so that polyethylene glycol is pointing up toward the surface while hyaluronic acid folds to interact with bovine serum albumin of the nanoparticles. Hyaluronic acid, facing inward, may interact with the nanoparticle via hydrogen bonding. The hydrogel nanocomposite showed antibacterial activity against Gram-positive/Gram-negative bactericides, supporting time-based nanoparticle release results. Our findings about interactions between the nanoparticles and the hydrogel can be useful in the formulation of next generation of hydrogel nanocomposites.
1. Introduction
In recent years, there has been continued interest in synthesizing topical formulations that can prevent infections in large wounds and inhibit biofilm formation in biomedical devices/implants. The conventional wound formulations containing antibiotics have served these needs for several decades because of their distinct positive attributes such as broad antibacterial activity against a range of Gram-negative and Gram-positive bacteria. However, conventional antibiotics are not effective in the case of antibiotic-resistant bacterial strains, particularly methicillin-resistant Staphylococcus aureus (MRSA). The cost associated with treating bacterial infections can be especially expensive. For example, it has been noted that, in the US, bacterial infections can cost the economy up to $33 billion a year.1
Recently, a three-dimensional gel (natural or synthetic hydrogel) or polymeric scaffold that can encapsulate silver nanoparticles2−7 and release nanoparticles in the presence of an external stimulii, has drawn special attention for treating MRSA bacterial infections. This is due to silver nanoparticles’ potency toward nearly 650 microorganisms and natural hydrogels’ ease in achieving tunable viscoelasticity and desirable biological outcomes. Additionally, natural hydrogels formulated with hyaluronic acid (HA) can be viscoelastic and non-toxic. HA is known to be involved in a variety of biological functions,8 such as signaling molecules in cell mortality,9 inflammation,10 and wound healing,11 and can be found primarily in the extracellular matrix of all connective tissues.12
HA can be used to formulate HA-based hydrogels with the desired mechanical properties and degradation rates while maintaining their native biological functions by controlling chemical modification and crosslinking of hydrogels. Click chemistry has been used to synthesize crosslinked hydrogels of HA due to high chemoselectivity and fast reaction kinetics in aqueous media.13 Synthesis of crosslinked hydrogels involves the use of copper-free chemistries such as strain-promoted azide-alkyne cycloaddition (SPAAC), and the reaction involves inverse electron demand Diels–Alder reactants such as tetrazine and norbornene.14 By tuning the crosslinker concentration in the formulation of hydrogels, the properties of the hydrogels can be modulated.15,16 Additionally, the incorporation of nanoparticles in the hydrogel can impact the overall properties of the hydrogel. The concept, design, and applications of the nanocomposite hydrogel for biomedical applications has been described by Thoniyot et al.17 Dispersion of nanoparticles in the hydrogel and the interaction between nanoparticles and crosslinked hydrogels, i.e., strong or weak interactions, can affect the overall performance of the nanocomposite hydrogel. A weak interaction can have little effect on the mechanical properties of the nanocomposite hydrogels with limited possibility of enhancement in stimuli responses and antimicrobial properties.18 On the other hand, a tunable interaction between the nanoparticles and the hydrogel19 can assist in modulating the swelling behavior, stimuli responses of nanoparticles toward pH, temperature, and ionic media, etc. The exact interaction between nanoparticles and crosslinked hydrogel has not been well studied. More importantly, the interaction between protein-stabilized silver nanoparticles, i.e., BSA-conjugated silver nanoparticles (Ag/BSA)20 (promising anti-bacterial activity against drug-resistant strains), and HA has not been investigated.
A recent report indicate that free BSA can bind with HA even at a pH far greater than BSA’s isoelectric point (pH 4.7).21 This is because several localized patches of positive domains within the negatively charged protein can participate in BSA–HA electrostatic interaction.22,23 Interactions between proteins and polysaccharides can also include nonspecific interactions such as van der Waals, hydrophobic interactions, or hydrogen bonding. These interactions are largely dictated by pH, ionic strength, polysaccharide linear charge density, protein surface charge density, rigidity of the polysaccharide chain, and protein/polysaccharide ratio.24−26 Although the phenomenon of protein–polysaccharide interaction has been studied for several decades,27 its application in the release of bioconjugated nanoparticles (protein outer layer) from a polysaccharide matrix (hydrogel matrix) has not been fully investigated and utilized in the field of nanocomposite hydrogels. Understanding the interactions between the nanoparticles and the hydrogel can assist in the regulated release of nanoparticles from the hydrogel as a function of external stimuli. Scheme 1 provides an idealized representation of the nanoparticle-encapsulated hydrogel matrix.
Scheme 1. Idealized Representation of the Encapsulated Ag/BSA Nanoparticle-Loaded Hydrogel Matrix.

The objective of this study is to synthesize and characterize hydrogel precursors, investigate the interactions between the Ag/BSA nanoparticles and the HA-PEG based hydrogel in the nanocomposite hydrogel using X-ray photoelectron spectroscopy (XPS) and Fourier transform infrared (FTIR), and quantify the release of Ag/BSA nanoparticles from the hydrogel nanocomposite and assess the antibacterial activity of the nanocomposite hydrogel. Previous reports discuss the multifunctional characteristics of neat silver nanoparticles in the hydrogel as it relates to bacterial disinfection and fibroblast cell growth28 in the presence and absence of serum albumin. However, there has been limited or no report of the characteristics of BSA-conjugated nanoparticle-loaded HA-PEG hydrogels and the evaluation of biological properties of the nanocomposite hydrogel. Tetrazine-modified polyethylene glycol and norbornene-modified hyaluronic acid were used as precursors to form the crosslinked hydrogel.29 The pre-formed nanoparticles were incorporated into the hydrogel by simply mixing the nanoparticles with the precursor macromolecules as opposed to mixing the nanoparticles to the swollen preformed hydrogel.30 The antibacterial activity of the nanocomposite was compared with that of the neat hydrogel. One of the important findings of the research was that Gram-negative bacteria were more susceptible than Gram-positive bacteria toward synthesized hydrogel nanocomposites.
2. Experimental Section
2.1. Materials
4-(Aminomethyl)benzonitrile hydrochloride, acetonitrile, triethylamine, glutaric anhydride, MgSO4, formamidine acetate salt, anhydrous hydrazine, anhydrous N,N-dimethylformamide (DMF), 2-(1H-7-azabenzotriazol-1-yl)-1,1,3,3-tetramethyl uronium hexafluorophosphate (HATU), ethyl acetate, hexane, acetic acid, dichloromethane, diethyl ether, tetrabutylammonium salt, dimethyl sulfoxide, sodium hydroxide, 5-norbornene-2-carboxylic acid (a mixture of endo and exo isomers), 4-(dimethylamino)pyridine, di-tert-butyl dicarbonate (Boc2O), acetone, sodium nitrite, BSA, sodium borohydride, and Dowex 50W proton exchange resin were all purchased from Sigma Aldrich and were used as received. The sodium salt of hyaluronic acid (HA) 69K was purchased from Lifecore Biomedical, and glacial acetic acid and Spectrum Spectra/Por Biotech Cellulose Ester Dialysis Membrane Tubing (100–100,000 Da) were purchased from Fisher Scientific.
2.2. Synthesis of 5-(4-(Cyano)benzylamino)-5-oxopentanoic Acid, 5-(4-(1,2,4,5-Tetrazin-3-yl)benzylamino)-5-oxopentanoic Acid, and PEG-Tz Macromer
The Alge et al. method was slightly modified (as outlined in Scheme 2) to synthesize 5-(4-(cyano)benzylamino)-5-oxopentanoic acid (compound 1) by dissolving 4-(aminomethyl)benzonitrile hydrochloride (11.32 g) and glutaric anhydride (7.66 g) in a dry, nitrogen-purged round-bottom flask with acetonitrile (500 mL) and triethylamine (10.29 mL).31 The reaction mixture was refluxed in a closed system (using a balloon) at 85 °C for 15 h. Upon removal of acetonitrile by rotary evaporation, the crude mixture was dissolved in 100 mL of deionized water, acidified to pH 3, and extracted 3 x 500 mL with ethyl acetate. The combined organic layers were then washed with brine, dried over MgSO4, and evaporated to dryness to yield a white solid product (∼85%).
Scheme 2. Reaction Scheme for the Synthesis of 5-(4-(Cyano)benzylamino)-5-oxopentanoic Acid (Compound 1), 5-(4-(1,2,4,5-Tetrazin-3-yl)benzylamino)-5-oxopentanoic Acid (Compound 2), and PEG-Tz Macromonomer 1(Compound 3).

Scheme 2 also outlines the synthesis of 5-(4-(1,2,4,5-tetrazin-3-yl)benzylamino)-5-oxopentanoic acid (compound 2). Compound 1 (4.7 g) was mixed with formamidine acetate salt (7.9 g), and elemental sulfur (0.6 g) in a round-bottom flask. Anhydrous hydrazine (11.0 mL) was then added slowly to the mixture in the flask. The orange slurry was then stirred at room temperature for 20 h. Glacial acetic acid (just enough to dissolve the mixture) was slowly added to the cold slurry (∼5 °C), while the solution was stirred after which the suspension was filtered through a glass frit. Sodium nitrite (6.6 g) was initially dissolved in cold deionized water (15.0 mL) and added dropwise over a span of 45 min to the orange solution, which was maintained at 0 °C, and the solution turned bright pink with vigorous gas evolution. Once the gas evolution ceased, the pink solution was cooled in an ice bath, mixed with dichloromethane (1:1), and neutralized with 1 M NaOH by dropwise addition until the formation of a separate aqueous layer. Then, the dichloromethane layer was separated and rotovapped at 40 °C. Dichloromethane addition, neutralization, and drying was repeated until the neutralized solid product was recovered. The recovered compound was dissolved in 2% hydrochloric acid, extracted in dichloromethane, and rotovapped to dryness to produce acidified crude compound 2. Compound 2 was washed with brine, dried over MgSO4, concentrated by a rotavapor, and purified by column chromatography with a mobile phase composed of 99% ethyl acetate/hexanes (3:1) + 1% methanol to yield a pink solid.
In a nitrogen-purged flask, compound 2 (0.03 g) and anhydrous DMF (∼2 mL) were placed and activated with 2-(1H-7-azabenzotriazol-1-yl)-1,1,3,3-tetramethyl uronium hexafluorophosphate (HATU) (0.2 g) along with triethylamine (1.0 mL). The mixture was stirred for approximately 15 min. The activated compound 2 was gradually transferred to another nitrogen-purged flask containing PEG-(NH2)2 (0.25 g) (MW 20K) and ∼3 mL of anhydrous N,N-dimethylformamide (DMF). The contents in the flask were allowed to react at room temperature for 20 h. The reaction mixture was then precipitated in cold diethyl ether, and crude TZ-COO-PEG macromer (compound 3) was recovered. The supernatant was freed of diethyl ether followed by the addition of fresh cold diethyl ether to precipitate remnants of the compound from the slurry. The precipitate from multiple trials was dissolved in dichloromethane (maximum 5 mL) and centrifuged to remove the salt byproducts, and the organic layer was evaporated to recover TZ-COO-PEG macromer (compound 3).
2.3. Synthesis of Norbornene-Modified Hyaluronic Acid (NorHA) Macromer
The slightly modified Gramlich et al. method was adopted (as outlined in Scheme 3) to synthesize compound 4.32 Hyaluronic acid tetrabutylammonium salt (HATBA) was synthesized by dissolving NaHA in deionized water at 2 wt % and exchanging with the Dowex 50W proton exchange resin (3 g resin per 1 g NaHA) for nearly 5 h and subsequently collecting the filtrate. The filtrate was titrated to a pH of 7.00 with TBA-OH (1.4 TBA per HA repeat unit), and the entire solution was frozen at −80 °C and lyophilized. Recovered HA-TBA was then redissolved in anhydrous DMSO (2 wt %). A 3 M ratio of 5-norbornene-2-carboxylic acid (mixture of endo and exo isomers) to 1.5 M ratio of (4-(dimethylamino)pyridine) to 1 M ratio of HATBA repeat units under a N2 atmosphere was mixed. The mixture was heated to 45 °C, and di-tert-butyl dicarbonate (Boc2O) was gradually syringed to the contents in the flask at a ratio of 0.4 M ratio to HATBA repeat units. After 20 h, cold water was used to quench the reaction and the solution was purified for 3 days by dialysis using the cellulose membrane to remove DMSO in the synthesized compound. After dialysis, NaCl was added (1 g NaCl per 100 mL of solution) to the modified HA present in solution and the mixture was precipitated using 10-fold excess cold (4 °C) acetone. The recovered norbornene-modified hyaluronic acid (compound 4) was dissolved in deionized H2O, frozen at −80 °C, lyophilized, and stored at −20 °C until further use.
Scheme 3. Reaction Scheme for the Synthesis of Norbornene-Modified Hyaluronic Acid (NorHA).

2.4. Synthesis of the Hydrogel and Nanocomposite Hydrogel
Scheme 4 provides a method used to formulate the hydrogel. For the highly crosslinked nanocomposite hydrogel, 75 mg of norbornene-modified hyaluronic acid (NorHA) was added to 700 μL of 1500 ppm freshly prepared Ag/BSA nanoparticle solution. Details regarding the synthesis of the nanoparticles can be found elsewhere.33 The entire mixture was vortexed for 2 min so that the nanoparticles were dispersed in the NorHA solution. In a separate vessel, 100 mg of TZ-COO-PEG was dissolved in 500 μL of deionized water. Both the solutions were mixed via vortex and then placed at a temperature of 37 °C for 2 h to react. For the lightly crosslinked matrix, 10 mg of norbornene-modified hyaluronic acid (NorHA) was dissolved in 500 μL of the silver BSA nanoparticle suspension and it was mixed with 100 mg of TZ-COO-PEG using the aforementioned procedure. Similarly, the neat hydrogel was formulated by adopting an aforementioned protocol except by substituting the nanoparticle suspension with deionized water in the dissolution stage of Nor-HA. The hydrogel and the nanocomposite hydrogel were characterized by scanning electron microscopy (SEM), transmission electron microscopy (TEM), X-ray photoelectron spectroscopy (XPS), thermogravimetric analysis (TGA), and atomic absorption spectrometry (AAS) prior to use for desorption study and antimicrobial measurements.
Scheme 4. Reaction Scheme Used to Form Crosslink Hydrogels.

2.5. Characterization of Hydrogel and Nanocomposite Hydrogel
The thermograms of the hydrogel and Ag/BSA nanoparticle-filled hydrogel were obtained using a Seiko TG/DTA 320 in a nitrogen atmosphere (flow rate of 100 mL/min). The dried samples (8–10 mg) were heated from room temperature to 100 °C and then maintained at this temperature for 30 min to remove physisorbed water and finally heated from 100 to 800 °C at a heating rate of 10 °C/min under a nitrogen atmosphere.
For SEM measurements, hydrogel and nanocomposites were cryofractured by placing the samples in liquid nitrogen for over 5 min. The fractured samples were mounted on an Al stub with the fractured surface facing outward for imaging, and gold was coated on the sample so as to enhance the samples’ conductivity during imaging. SEM micrographs of the fractured samples were collected at several magnifications by operating with a 15 kV accelerating voltage in secondary electron mode and a working distance of 6.8 mm. Imaging was conducted on a Zeiss Merlin high-resolution SEM in the Electron Microscopy Laboratory at the Materials Research Lab at MIT. Some fractured samples were characterized using a Hitachi SU-70 FEG SEM and Tescan GAIA FEG SEM at the Advanced Imaging and Microscopy Laboratory at University of Maryland, College Park, MD. Also, drops of diluted nanoparticle solution were placed on silicon wafer and freeze-dried prior to SEM imaging.
To prepare the TEM samples, a 20 μL droplet of a diluted aqueous solution of Ag/BSA was spotted on a 200 mesh carbon coated copper grid (Electron Microscopy Science, PA). The droplet on the grid was air-dried at room temperature. TEM micrographs were collected with a JEOL 2100 at an accelerating voltage of 80 kV at the Materials Research Laboratory in the Electron Microscopy Laboratory at MIT. TEM images were also taken with a JEOL-2010 Advance High Performance transmission electron microscope (JEOL, Akishima, Tokyo, Japan) at an accelerating voltage of 80 kV.
XPS data was collected on a Kratos Axis 165 X-ray photoelectron spectrometer operating in hybrid mode using monochromatic Al Kα X-rays (280 W). Charge neutralization was required to minimize sample surface charging, and parameters were optimized to give peak with the narrowest FWHM (full width at half maximum). Survey and high-resolution spectra were taken at pass energies of 160 and 40 eV, respectively. Samples were mounted using double-sided copper tape on glass coverslips to isolate them from the sample ground. All data was collected at an instrument pressure of <1 × 10⁻⁸ torr. Data analysis was done using CASAXPS software, and quantification was determined after subtraction of a Shirley background using relative sensitivity factors from the Kratos Vision software. The following procedure was used for binding energy referencing: for the Ag/BSA and composite samples, Ag 3d5/2 was set to 368.3 eV, and the position of the C–O/C–N peak in the C 1s spectrum of the pure hydrogel was set to 286.7 eV to coincide with the same peak position in the composite after the Ag 3d calibration. Peak fitting was done using peak shapes with 70%/30% Gaussian/Lorentzian product function. For each region, peaks fit to within that region were constrained to have the same FWHM except for the overlapping Na KLL peak in the O 1s region, which was fixed to have a FWHM of 3.0 eV. Four peaks were fit to the C 1s region for both the hydrogel and composite, and their positions were fixed relative to the intense C–O/C–N peak with C–C/C–H fixed to be 1.5 eV lower binding energy and amide/O–C–O and COOR set to 1.4 and 2.5 eV to higher binding energy, respectively.
1H NMR spectra of hydrogel precursors were recorded using a Bruker AVANCE 400 spectrometer (400 MHz). Chemical shifts were given in parts per million (δ) relative to tetramethylsilane (TMS). Fourier transform infrared (FTIR) spectra of the precursor, hydrogel, and nanoparticle-filled hydrogel were obtained with a Perkin Elmer FTIR 100 Plus spectrometer.
Accurate mass determination of compound 2 was carried out using a mass spectrometer (Agilent 6224 Accurate-Mass TOF LC/MS system, flow rate: 0.5 mL/min); the following conditions were used for separation: mobile phase A: 100% water and mobile phase B: 0.1% formic acid in acetonitrile, isocratic: 50%, and 0.1% formic acid in acetonitrile. The column used was an Agilent Poroshell 120EC-C18 2.7 micron (3.0 × 5.0 mm). LC-MS analysis was conducted using an ESI detector and software mass hunter.
2.6. Desorption Study and Determination of Silver Content in the Nanocomposite
Twenty milligrams of the hydrogel and nanocomposite was soaked in separate containers containing 10 mL of deionized water. At predetermined time intervals, the samples were retrieved from deionized water and transferred to fresh deionized water. The amount of silver ions or nanoparticles released from the gel into deionized water (leachate) was quantified by AAS measurement. To quantify the concentration of silver ions or nanoparticles in the leachate, the leachate was transferred into a Teflon beaker and digested in 10 mL of 2% v/v nitric acid at 165 °C for 25 min, as per the modified EPA protocol. An additional 5 mL volume of 2% v/v nitric acid was added, and the leachate was further digested for additional 15 min. Then, the mixture was cooled to room temperature and the solution was diluted to a final volume of 25 mL with 2% v/v nitric acid. The solution was analyzed by flame atomic absorption spectrometry (AAnalyst 800, Perkin Elmer) precisely at 328.1 nm at a slit width of 0.7 nm using a hollow cathode lamp (Cathodeon Ltd., UK) for silver content. Standard solutions of soluble silver salts in the range of 1.25–10 ppm were prepared and analyzed to obtain the calibration curves. Absorbance of the digested samples was compared with the calibration curve to establish the silver concentration in the leachate and eventually establish the Ag/BSA content in the leachate.
2.7. Antimicrobial Activity Measurements: Kirby–Bauer Disk Diffusion Assay
The Kirby–Bauer method/disk diffusion assay was used to investigate the antimicrobial activity of the Ag/BSA nanoparticles released from the hydrogel. Initially, Escherichia coli 0157:H7, Listeria monocytogenes 7644, and Shigella sonnei 9290 were grown on brain-heart infusion (BHI) broth and transferred to brain-heart infusion agar (BHIA) plates at 37 °C for 18 h in an incubator. Each of the bacterial strains was suspended using sterile saline solution before adjusting to 1 × 10⁸ CFU/mL using a 0.5 McFarland standard (Remel) and teased on the Mueller-Hinton and BHIA plates. The plates were left at room temperature to dry and inverted and placed in the incubator. Hydrogel nanocomposite samples with varying masses (5 mg, 2.5 mg, and 1.25 mg) were placed using sterile tweezers with a space between each sample and incubated at 37 °C for 48 h. The diameter of the zone of inhibition of the experimental sample was measured to assess the extent of antimicrobial activity of the individual sample. The zone of inhibition was also recorded as a function of mass of the hydrogel. Additionally, several controls were tested alongside the Ag/BSA-loaded hydrogel samples. The neat hydrogel samples served as negative controls, while Ag/BSA nanoparticles and gentamicin served as positive controls. All studies were pre-formed in triplicate, and Student’s t test was conducted at a 95% confidence level.
3. Results and Discussion
3.1. Synthesis of the Hydrogel and Hydrogel Nanocomposite
Synthesis of 5-(4-(cyano)benzylamino)-5-oxopentanoic acid, compound 1, was the first step toward formulating the HA-PEG-based hydrogel. 1H NMR of compound 1 in DMSO-d6 showed peaks at δ = 12.05 (s, 1H), δ = 8.44 (t, 1H), δ = 7.78 (d, 2H), δ = 7.42 (d, 2H), δ = 4.33 (d, 2H), δ = 2.26–2.15 (m, 4H), and δ = 1.79–1.69 (m, 2H), which are consistent with published literature values.31 1,2,4,5-Tetrazin-3-yl)benzylamino)-5-oxopentanoic acid (compound 2 or Tz-COOH) was synthesized by adding compound 1 to formamidine acetate salt, elemental sulfur, and anhydrous hydrazine and reacting it with sodium nitrite in glacial acetic acid. 1H NMR of the recovered compound 2 showed several peaks at δ = 12.03 (b, 1H) δ = 10.58 (s, 1H), δ = 8.52–8.40 (m, 3H), δ = 7.53 (d, 2H), δ = 4.40 (d, 2H), δ = 2.28–2.17 (m, 4H), δ = 1.77 (2H). In particular, the peak at δ = 10.58 (s, 1H) was a strong indication of the presence of the tetrazine pendant group in the synthesized compound. Additionally, FTIR characterization of compound 1 and compound 2 showed significant similarities, with the exception of a weak peak at 1665 cm–1, assigned to C=N for imine in compound 2, and a medium sharp peak at 2231.89 cm–1 (the C≡N group) for compound 1.34 These results were further corroborated by performing LC-MS analysis. A quasi-molecular ion (M + H) peak was observed for Tz-COOH at 302.125 m/z, calculated 302.12 [C14H15O3N5 + H]+, and the dimer (2M + H) compound at 603.24 m/z, calculated 603.24 [2(C14H15O3N5) + H]+, which is in line with the molar mass of synthesized compound 2.
Optimization study was performed to maximize the yield of compound 2 by varying a range of operating parameters such as pH, solvent extraction, and temperature. An experimental yield of 27% was obtained which was found to be 1.5 times greater than that reported in the literature for a similar synthetic procedure adopted to synthesize Tz-COOH.35 The enhanced recovery was attributed to the successful work up of the neutralization of glacial acetic acid with NaOH and the use of multiple solvent extraction steps with methylene chloride followed by concentration of the extracts at a moderate temperature of 50 °C. Details of the improved recovery procedure can be found elsewhere.36 TZ-COOH was then coupled to multifunctional PEG-NH2 to yield a clickable TZ-COO-PEG macromer. 1H NMR of TZ-COO-PEG macromer showed peaks corresponding to δ = 10.58 (s), 8.42 (m), 7.85 (t), 7.53 (d), 4.9 (d), which can be assigned to TZ-COOH, while the peak between 3.70 and 3.37 (m, [CH2CH2]n) can be assigned to the PEG chain.
For preparing the desired hydrogel, an HA macromer was synthesized by conjugating an appropriate dienophile norbornene to HA (NorHA). After the exchange of NaHA with the Dowex resin, HA was solubilized in TBA to make it soluble in organic solvents such as DMSO for the subsequent derivation step. 1H NMR of HA showed a peak at δ = 2.0 corresponding to the methyl protons of HA and peaks between δ = 3.4 and δ = 3.8 corresponding to the protons of the polysaccharide ring backbone of HA.37 On the other hand, 1H NMR of HA-TBA showed new peaks at δ = 2.5 and δ = 1.7, δ = 1.3, and δ = 0.8 due to CH2 on N–(CH2), CH2 on N–CH2–(CH2) and N–CH2–CH2–(CH2), and CH3 on N–CH2–CH2–CH2–(CH3) protons of TBA, respectively, which strongly suggests that HA has reacted with TBA. Another indication of the successful exchange of HA with TBA is the improved solubility of HA-TBA in DMSO. HA-TBA was then subsequently reacted with 5-norbornene-2-carboxylic acid and 4-(dimethylamino)pyridine under an inert atmosphere followed by the addition of di-tert-butyl dicarbonate (Boc2O) to yield NorHA. 1H NMR of NorHA showed characteristic peaks at δ = 6.33 and δ = 6.02, which can be attributed to the vinylic protons of the endo configuration, while the peaks at δ = 6.26 and δ = 6.23 can be attributed to the vinylic protons of the exo configuration. The peaks at δ = 1.57–1.27 ppm can be attributed to protons on the bridge and ring of norbornene. This strongly suggests that norbornene is indeed attached to the HA moiety. 1H NMR and FTIR of TZ-PEG and HA-Nb are shown in Figure S1.
For synthesizing the nanocomposite, either the nanoparticles could be added to the newly formed hydrogel or to the hydrogel precursors during gelation or both nanoparticles and the hydrogel could be formed in situ simultaneously. Instead of synthesizing nanoparticles in situ while the hydrogel precursors are being crosslinked, in this study, the Ag/BSA nanoparticles were independently prepared and added to the hydrogel precursors followed by gelation of the mixture. We resorted to this approach because the reducing agents used in nanoparticle synthesis, such as sodium borohydride (NaBH4), can pose significant biological risks if traces of sodium borohydride remained in the synthesized nanocomposites. The gelation time for formulation of the nanocomposite and hydrogel (free of nanoparticles) was kept constant for the duration of the experiment. Figure S2 illustrates the images of the hydrogel and hydrogel nanocomposites. The physical observation of the nanocomposite suggests that the nanoparticles were indeed incorporated into the hydrogel as observed by the coloration of the hydrogel nanocomposite that resembled that of nanoparticles.
3.2. Characterization of Ag/BSA Nanoparticles
Figure 1 shows the SEM micrograph coupled with energy-dispersive X-ray (SEM/EDAX) spectroscopic analysis of the nanoparticles. A representative number of nanoparticles (at least 10 nanoparticles) were analyzed to get the size and morphology of particles. The nanoparticles are generally spherical with a broad range in diameter of 12.08 ± 3.36 nm. EDAX analysis of the nanoparticles provides the elemental composition of nanoparticles. As expected, the nanoparticles showed the presence of C, O, Ag, and N with C, N, S, and O originating from BSA while the origin of silver is from the silver component of nanoparticles.
Figure 1.

SEM and EDAX analysis of Ag/BSA nanoparticles.
The freshly synthesized Ag/BSA nanoparticles were also characterized for their morphology and composition by TEM. Figure 2 shows the TEM micrographs of Ag/BSA nanoparticles. TEM images shown are representative of a minimum of three collected images. The nanoparticles were found to have an average size of 10.56 nm ± 7.42 nm. More importantly, the inset to Figure 3 provides clear evidence of two distinct regions in the synthesized bioconjugated nanoparticles. The edge of nanoparticles having a different contrast and texture than the center, i.e., the outer shell is lighter compared to the inner core, suggesting that the edge may be rich in one of the components of the nanoparticles while the core region may be richer in the other component of the nanoparticles.
Figure 2.

TEM lower resolution image of a group of Ag/BSA nanoparticles and inset with a higher resolution image of a single Ag/BSA nanoparticle.
Figure 3.

SEM of the neat hydrogel (left) and hydrogel nanocomposite (right). The nanocomposite shows bright spots dispersed in the matrix.
In general, the SEM and TEM results are in agreement with Gebregeorgis et al. observtion.33 In a previous XPS characterization study of argon ion-sputtered Ag/BSA nanoparticles, it was established that the center and the edge of the nanoparticle were compositionally different. The XPS composition of the nanoparticles before and after 40 s argon ion sputtering was compared with the XPS results of pure BSA (which served as the control for the study). It was elucidated that the shell of the Ag/BSA nanoparticle was rich in BSA component and the core of the nanoparticle was rich in Ag.33,38
3.3. Characterization of Hydrogel Nanocomposites
Figure 3 shows the SEM image of the hydrogel and hydrogel nanocomposite. Neat hydrogel and hydrogel nanocomposite showed significant similarity in the physical structure of the matrix. Both the neat hydrogel and hydrogel nanocomposite showed a porous construct of varying pore dimensions. Porous morphology is expected to play an important role in the diffusion of encapsulated molecules because these structures allow the trapped particles (nanoparticles) to move outward of the 3D polymer network. Also, the pores in the hydrogel can facilitate the diffusion of nutrients into the bulk matrix and promote the growth of cells in the interior of the matrix.39,40 Some of the pores in the hydrogel were collapsed in select regions of the samples, and this may be due to the freeze-drying process adopted. At a higher magnification (data not shown), the hydrogel surface was rather smooth with wrinkled structures. However, the morphology of the hydrogel after Ag/BSA nanoparticle incorporation showed bright spots predominantly near the pores in the matrix. The estimated size of the bright spots was in general agreement with the size of nanoparticles, suggesting that the bright spots may be the nanoparticles dispersed in the hydrogel matrix. For a more definitive assessment of the bright spots, EDAX analysis was performed, more specifically point analysis, on and around the bright spots. Point analysis of the bright spots was difficult because the hydrogel was prone to electron beam damage. Despite that, EDAX analysis of the bright spots showed a high atomic percent of C and O followed by Na and lesser amounts of N and P and a smaller percent of Ag. The presence of Ag during point analysis of bright spots is in line with expectations that the nanoparticles are present in the hydrogel nanocomposite. For comparison, EDAX analysis of neat hydrogel, without nanoparticles, showed a high atomic percent of C and O followed by Na, N, and P and no detection of Ag. Na may have originated from the brine solution and/or the starting compound of sodium hyaluronate.41 These results were further confirmed by analyzing multiple bright spots in the nanocomposite samples. These findings support the successful incorporation of nanoparticles in the hydrogel.
TGA analysis of the nanocomposite and neat hydrogel was performed to determine the percentage weight loss of the neat hydrogel and estimate the percentage of silver nanoparticles incorporated in the hydrogel matrix. Figure 4 shows the thermograms of the neat hydrogel and nanocomposite hydrogel. The neat hydrogel follows a two-step degradation process with the first step occurring between 200 and 400 °C and the second step occurring from 400 to 800 °C with 16% of the char residue left over upon completion of thermal degradation. Similarly, in the case of the nanocomposite hydrogel, two-step degradation was noticed before 800 °C, and only 18% of the char residue remained upon completion of thermal degradation of the nanocomposite. Assuming that the difference in weight loss between the hydrogel and nanocomposite originates from the nanoparticles in the hydrogel nanocomposite, the Ag/BSA nanoparticle content in the nanocomposite sample was estimated to be approximately 2% by mass.
Figure 4.

Thermograms of the neat hydrogel and Ag/BSA-encapsulated hydrogel.
3.4. Interaction of Nanoparticles and the Hydrogel in the Nanocomposite
SEM-EDAX and TGA results established that the nanoparticles are indeed incorporated into the hydrogel. In order to probe the interaction between the nanoparticles and the hydrogel in the nanocomposite, FTIR, XPS, and desorption studies were performed for the nanocomposite and the neat hydrogel. Figure 5 shows FTIR spectra of the hydrogel and Ag/BSA nanoparticle-filled hydrogel samples. Both samples showed a broad absorption band at 3200–3400 cm–1 attributed to O–H stretching. In addition, there was band present at about 2885 cm–1, which was assigned to the C–H stretching vibration of aliphatic hydrocarbons.42 A sharp peak at 1108 cm–1 in the hydrogel was assigned to the C–OH stretching vibrations, and the broad band at 1625 cm–1 can be related to the asymmetric vibration of the carbonyl group and C=O (amide I) stretching band in the hydrogel. When Ag/BSA nanoparticles were added to the HA-based hydrogel, it is conceivable that HA can either interact with the oxidized Ag ion of nanoparticles or it can interact with BSA of the encapsulated nanoparticles.
Figure 5.

FTIR of the neat hydrogel and hydrogel nanocomposite. The inset shows select regions of the IR spectrum where peak shifts were observed.
FTIR peaks of the Ag/BSA nanoparticle-filled hydrogel were compared with the neat hydrogel to establish the interaction between BSA of nanoparticles and HA of the hydrogel. The O–H peak in the nanocomposite was broader compared to the neat hydrogel, suggesting that hydrogen bonding may be facilitating the interaction between nanoparticles and the hydrogel. The N–H stretching band assigned to the amine groups in the hydrogel shifted from 3284 to 3272 cm–1 in the nanocomposite. Additionally, the peaks at 1672 and at 1561 cm–1, assigned to the amide I and amide II bands of the hydrogel, shifted to lower frequencies, 1650 and 1544 cm–1 in the nanocomposite (refer to the inset of Figure 5), indicating a potential interaction between the hydrogel and bioconjugated nanoparticles. The spectrum also showed a band at 1726 cm–1 corresponding to the stretching of the carbonyl group in hyaluronic acid, which was shifted to 1710 cm–1 in the nanocomposite. The red shift in the IR peaks observed for the nanocomposite is in line with a previous report where a shift of 26 cm–1 was noticed upon the complexation of HA-BSA.43 Finally, the band at 1104 cm–1 assigned to O–H out of plane bending of carboxylic acid in HA was also found to be red shifted to 1087 cm–1 in hydrogel nanocomposites (refer to the inset of Figure 5), suggesting the potential interaction between nanoparticles and the hydrogel. These results suggest that Ag/BSA nanoparticles may interact with the hydrogel via the BSA shell of the nanoparticles possibly by HA–BSA interaction.44
XPS measurements of the nanoparticles, pure hydrogel, and nanocomposite were performed to further establish that there is an interaction between nanoparticles and the hydrogel. Figure 6 shows the XPS survey spectra of the pure hydrogel, the Ag/BSA nanoparticles, and the hydrogel nanocomposite. Table 1 shows elemental quantification calculated from XPS data. The wide spectrum for the hydrogel was dominated by a signal from C, N, and O as would be expected, and there was also evidence of some unexpected signal from Na, Cl, F, and P, which we believe are residues from HATU (P and F), brine solution (Cl), and sodium hyaluronate (Na) used in the synthesis process. The spectrum from the Ag/BSA nanoparticles contains, as expected, C, N, O, S, and Ag.
Figure 6.

XPS survey spectra of the Ag/BSA-loaded hydrogel, neat hydrogel, and Ag/BSA nanoparticle. The inset shows the high-resolution spectra of the Ag 3d region for the Ag/BSA-loaded hydrogel, neat hydrogel, and Ag/BSA nanoparticle.
Table 1. Elemental Quantification Calculated from XPS Data.
| sample | C | O | N | Ag | Cl | F | Na | P | S |
|---|---|---|---|---|---|---|---|---|---|
| Ag/BSA | 69.02 | 15.88 | 13.03 | 1.06 | 0.14 | 0.51 | 0.36 | ||
| composite | 61.97 | 25.82 | 2.23 | 0.03 | 2.14 | 5.01 | 2.35 | 0.46 | |
| hydrogel | 62.63 | 22.11 | 2.04 | 3.65 | 5.94 | 3.07 | 0.57 |
The survey spectrum, Figure 6, from the nanocomposite shows a combination of the elements found in the pure hydrogel and Ag/BSA, with a clear Ag 3d peak from the nanoparticles, with an atomic percent concentration of approximately 30 times less when compared to pure Ag/BSA (Table 1) as to be expected due to dilution from mixing with the hydrogel. It can also be noted that the small signal for sulfur that was seen in the Ag/BSA spectrum is not present in the composite spectrum as its concentration has dropped below the sensitivity limit (∼0.1 atomic percent) of XPS. Also noted is that the relative concentration of the Na, Cl, F, and P residual reaction species has also dropped due to the dilution effect in the composite compared to the hydrogel due to the incorporation of the Ag/BSA nanoparticles.
The inset to Figure 6 shows the high-resolution XPS peaks of Ag 3d core levels in the pure Ag/BSA and composite samples and the clear lack of signal in this region for the hydrogel sample. The Ag 3d5/2 peaks for the Ag/BSA nanoparticles and nanocomposite hydrogel were used for energy reference and set to be 368.3 eV, and the region consisting of a single spin orbit split component with a spin orbit-splitting of 6.0 eV and an area ratio of 0.6 to 0.4 for 5/2 to 3/2, respectively, is consistent with the literature45 and confirms the presence of silver in the nanocomposite.46−48
Figure 7 shows the curve fit high-resolution spectra C 1s, O 1s, and N 1s for the hydrogel, Ag/BSA-loaded hydrogel, and Ag/BSA nanoparticles. BSA from the Ag/BSA nanoparticles is a protein composed of chains of amino acids joined by peptide (amide) bonds with the most predominant (accounting for almost 50% of the amino acids residues) being glutamic acid, lysine, leucine, and aspartic acid.49 The C 1s, O 1s, and N 1s regions for the Ag/BSA nanoparticles show a signal consistent with the expected functional groups (amines, amides, ammonium cations, and carboxylic acids), i.e., C–C/C–H bonding (C 1s, 284.8 eV), C–O/C–N/C–S (C 1s, 286.2 eV), amide (C 1s, 287.9 eV), carboxylic acid (C 1s, 288.9 eV), amine/amide (N 1s, 399.9 eV) and RNH3+ in lysine (N 1s, 401.3 eV), O=C—N/C=O (O 1s, 531.3 eV), C–O–R (O 1s, 532.8 eV), and a small peak due to AgO bonding (O 1s, 529.6 eV) due to some oxidation of the Ag nanoparticle surface and binding of BSA to Ag.
Figure 7.

XPS high-resolution C 1s, O 1s, and N 1s for the (a) hydrogel, (b) Ag/BSA-loaded hydrogel, (c) and Ag/BSA nanoparticles.
The C 1s and O 1s high-resolution spectra for the hydrogel are expected to be dominated by features of PEG and HA, which are both in significantly higher concentration compared to the norbornene tetrazine linkers, and this is reflected by the strong C–O peak at 286.7 eV peak in C 1s and the dominating peak due to C–O in O 1s at 532.9 eV. The N 1s signal at 400.1 eV is largely due to amides present in the HA with some contribution also from the amides of the norbornene tetrazine linkers, and the higher binding energy peak at 401.8 eV is assigned to C=N—N protonated amines or oxidized amines could also fall at this binding energy. The other signal in C 1s is due to amides (288.0 eV), carboxylic acids (289.1 eV), and C–C/C–H bonding (285.1 eV). The peak at a higher binding energy (∼535 eV) in O 1s is due to overlap with a Na KLL Auger peak. The functional groups and peak positions are consistent with PEG50 and HA51 spectra previously reported.
The high-resolution XPS for the composite (Figure 7b) revealed that the spectra are very similar to that of the hydrogel with N 1s and O 1s signals almost indistinguishable in terms of both binding energy and relative area of components. The most striking difference when comparing the XPS of the pure hydrogel with the composite can be seen in the C 1s spectrum when comparing the C–O to C–C/C–H ratio, which is ∼4.4 in the composite compared to ∼2.4 in the pure hydrogel, which we suggest is evidence of structural rearrangement of the hydrogel in the presence of the BSA-coated nanoparticles. It could be argued that the C–C/C–H peak intensity may be highly sensitive to variations in adventitious hydrocarbon (hydrocarbon contamination originating from the atmosphere) but other more subtle changes in relative amounts of functional groups also support this notion. For example, although there is a high proportion of C–O bonding in both PEG and the HA, PEG is made up entirely of C–O bonding whereas hyaluronic acid has other types of carbon bonding particularly the amide groups and O–C–O, which both contribute to the peak at 287.9 eV, the ratio of the C–O:amide/O–C–O peak area also increases in the composite compared to the pure hydrogel, increasing from ∼5.1 to 5.7, respectively, despite the incorporation of the BSA-coated nanoparticles that one would expect to lead to a decrease in the C–O:amide/O–C–O ratio. It has been postulated that the large increase in C–O bonding at the surface relative to the hydrocarbon and amide in the composite would be consistent with the hydrogel molecule rearranging so that the PEG part is pointing up toward the surface while hyaluronic acid folds around to interact with BSA. It should be noted that the presence of the contaminants F, Cl, and Na remains approximately constant (apart from a small reduction due to dilution by the nanoparticles) in both the hydrogel and the composite and that high-resolution spectra of both Cl 2p and F 1s are consistent with inorganic Cl (from brine solution) and PF6 for F (from HATU), neither of these elements should therefore affect the C–O:C–C/C–H ratio. Moreover, if we were simply to add the BSA nanoparticles to the hydrogel and there was no interaction, we would expect a reverse effect in the C–O:C–C/C–H and C–O:amide/O–C–O ratios.
To further establish that the nanoparticles are indeed interacting with the hydrogel, a systematic desorption study was conducted as a function of time to see the extent of release of nanoparticles from the hydrogel nanocomposite. The hydrogel was immersed in aqueous medium for a prolonged duration with the expectation that the silver nanoparticles would be released quickly from the gel if there was poor interaction between the nanoparticles and the hydrogel matrix and if there was significant swelling of the hydrogel. To study the release, the leachate was removed at predetermined time intervals and was replaced with fresh aqueous medium. The amount of silver nanoparticles released from the nanocomposite matrix at a given time was measured by digesting the nanoparticles present in the leachate followed by quantifying the silver ions in solution by AAS. The absorbance of the digested leachate was compared to the calibration curve of silver ions in silver standard solution to obtain the concentration of nanoparticles in the leachate. Figure 8 shows the silver ion concentration in the lightly and highly crosslinked hydrogel matrix, labeled (A) and (B), respectively, for the 14 day desorption conducted in aqueous medium at pH 7. It appears that the nanoparticles were released from the hydrogel matrix in multiple stages. In the first stage, an initial burst release effect was noticed, i.e., a portion of the nanoparticles is released within the first 3 h; this release of the nanoparticles is probably due to the dislodging of localized nanoparticles from the hydrogel surface. In the second stage of desorption, the diffusion influences the nanoparticle release and it happens at a gradual release rate. It is believed that the hydrophilic properties of the hydrogel promote swelling of the matrix in aqueous media that facilitates the diffusion of nanoparticles through the loose polymeric network and subsequent release of nanoparticles into the aqueous media. In the last stage of nanoparticle release, it is the combination of diffusion and degradation of the hydrogel network that facilitates the release of the nanoparticles from the bulk hydrogel matrix.
Figure 8.
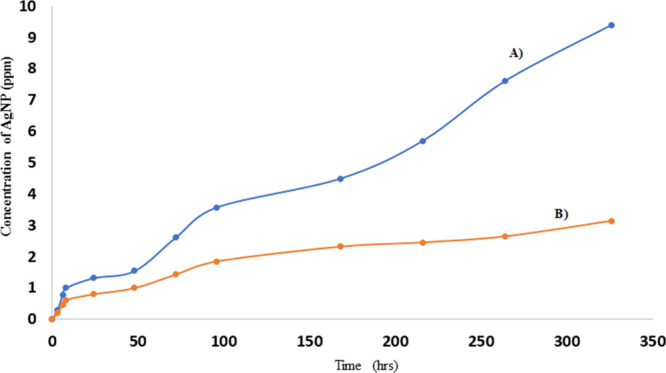
Release profile of Ag nanoparticles from the (A) lightly and (B) highly crosslinked hydrogel matrix.
To establish that the swelling of the matrix indeed influences the release of nanoparticles from the matrix, the nanoparticles released from the lightly and the highly crosslinked nanocomposites were investigated. As expected, both systems showed an initial burst release of the nanoparticles from the matrix. However, the second phase differs greatly with a significant amount of nanoparticles being released from the lightly crosslinked matrix and fewer nanoparticles being released from the highly crosslinked matrix. This was expected because the highly crosslinked matrix showed less swelling compared to the lightly crosslinked matrix. As stated earlier, more nanoparticles diffuse out of the lightly crosslinked matrix and the results validate the expected trend. For example, the data shows that for similar nanoparticle loading, the lightly crosslinked hydrogel releases 0.974 ± 0.45 ppm/day of nanoparticles compared to 0.33 ± 0.24 ppm/day of nanoparticles from the highly crosslinked matrix during the second stage of desorption.
We establish the amount of nanoparticles remaining in the matrix after 14 days of desorption by performing mass balance analysis of the nanoparticles initially loaded in the hydrogel and accounting for the nanoparticles released from the matrix over the three phases of desorption. The data showed that 51% and 83% of the loaded nanoparticles remained in the lightly and highly crosslinked hydrogel matrix, respectively, after 14 days of desorption. These observations suggest that a significant amount of nanoparticles remain in the matrix possibly because of the interactions between the nanoparticles and the hydrogel, which modulates the nanoparticles release. These results are consistent with the XPS and FTIR observations of the nanocomposites and neat hydrogel. pH-dependent studies of the lightly and highly crosslinked nanocomposites are underway to further confirm the existence of interactions between the nanoparticles and the hydrogel and potentially establish hydrogen bonding as one of the sources promoting the interaction between the nanoparticles and the hydrogel.
3.5. Biological Study of Nanocomposites
Here, Escherichia coli 0157:H7, Listeria monocytogenes 7644, and Shigella sonnei 9290 were used as the model bacteria to investigate the antimicrobial properties of Ag/BSA nanoparticle-loaded hydrogels. E. coli and S. sonnei represent Gram-negative bacteria while L. monocytogenes represents Gram-positive bacteria. To obtain information about the antimicrobial activity of nanoparticle-loaded hydrogels against various strains, disk diffusion assay was preformed to determine the zone of inhibition. Figure 9 shows the zone of inhibition for the various samples when exposed to E. coli 0157:H7, L. monocytogenes 7644, and S. sonnei 9290. The neat hydrogel, negative control, exhibited no zone of inhibition (poor antibacterial activity). The positive control, Ag/BSA nanoparticles and gentamicin, showed excellent antimicrobial activity, with the exception of gentamicin showing no anti-microbial activity against S. sonnei 9290. The nanocomposite hydrogels showed excellent bactericidal activity against the three kinds of bacteria, indicating that the observed antimicrobial properties are a direct result of the nanoparticles present in the hydrogel. The study shows that, across all three bacterial strains, as the mass of the nanocomposite hydrogel increases so does the zone of inhibition, reflecting improved antibacterial activity. When comparing the hydrogel nanocomposite samples with the gentamicin controls, for E. coli 0157:H7, all three masses of the nanocomposite hydrogel showed a similar or greater zone of inhibition than gentamicin. L. monocytogenes 7644, on the other hand, showed that gentamicin has a greater zone of inhibition than all three masses of the nanocomposite hydrogel.
Figure 9.

Plot of zone of inhibition diameters of the Ag/BSA-loaded hydrogel upon exposure to E. coli 0157:H7, L. monocytogenes 7644, and S. sonnei 9290 bacterial lawn.
The initial observation is that the nanocomposites showed varying degrees of zones of inhibition for both Gram-positive and Gram-negative bacteria. The difference in the recorded zone of inhibition of E. coli 0157:H7, L. monocytogenes 7644, and S. sonnei 9290 for all the loadings can be explained based on the differences in the cell wall structures for the three bacteria; L. monocytogenes, a Gram-positive bacterium, has a thick cell wall made of peptidoglycan and an inner cell membrane,52 while E. coli 0157:H7 and S. sonnei, Gram-negative bacteria, have a thinner outer membrane, thinner peptidoglycan layer, and a plasma membrane that are thinner than the Gram-positive bacterium’s cell membrane and cell wall. Additionally, the silver nanoparticles induce oxidative stress species that are more toxic to the outer and cellular membranes of Gram-negative bacteria than Gram-positive bacteria.53
Additionally, we noticed that the Ag nanoparticle-filled hydrogel nanocomposite is more effective against Gram-negative bacteria than Gram-positive bacteria. Our results are consistent with our previously published results7 and Zarei et al. findings.54 This might be a result of the ability of nanoparticles to form holes on the cell membrane and enter the bacterium. Our unpublished microscopic evidence seems to support the puncturing of holes in the cell membrane by silver nanoparticles. Alternatively, the nanoparticles have been noted to interact/bind with proteins and ribosomes upon penetrating the cell membrane via thiol groups.55 The silver nanoparticle-assisted processes of damaging the membrane are less likely to occur in Gram-positive bacteria, which contains a thicker peptidoglycan layer in the cell wall and an inner cell membrane.56 On the other hand, our results suggest that gentamicin show improved antimicrobial activity against L. monocytogenes than E. coli. Our results are consistent with Sarvaş et al. findings.57 Gentamicin is able to gain entrance into the Gram-positive cell by binding to the anionic sites on the Gram-positive cell wall via teichoic acids and phospholipids.58 More detailed studies are needed to validate our findings in terms of silver nanoparticles’ improved potency toward Gram-positive bacteria and gentamicin’s improved potency toward Gram-negative bacteria.
4. Conclusions
Nanocomposite hydrogels are advanced biomaterials that can potentially be used for various biomedical and pharmaceutical applications. In this work, an approach to formulate nanocomposites by encapsulating bioconjugated silver nanoparticles in a hyaluronic acid cross-linked hydrogel matrix was described. The in situ encapsulation of well-dispersed nanoparticles in a hydrogel is a burgeoning subject of study. The sizes of the nanoparticles were ascertained by scanning electron microscopy and transmission electron microscopy and were consistent with the previously reported data. Both the neat hydrogel and hydrogel nanocomposite showed porous constructs of varying pore dimensions with the presence of spherical nanoparticles on the surface and pores of the nanocomposite. Point analysis using scanning electron microscopy-energy-dispersive X-ray spectroscopy of the spherical nanoparticles in the nanocomposite established the silver composition of the nanoparticles. Thermogravimetric analysis showed silver nanoparticle loading (nearly 2%) in the nanocomposite. Antimicrobial studies of the neat hydrogel against Escherichia coli 0157:H7, Listeria monocytogenes 7644, and Shigella sonnei 9290 showed poor antibacterial activity, while the nanocomposites showed excellent bactericidal activity against the three kinds of bacteria, indicating that the observed antimicrobial properties are a direct result of the nanoparticles present in the hydrogel. The antibacterial activity was influenced by the mass of hydrogel nanocomposites. Additionally, it was observed that Gram-negative bacteria were more susceptible to the hydrogel nanocomposite than Gram-positive bacteria.
The interaction between hyaluronic acid chains and bioconjugated silver nanoparticles was studied by the use of a combination of spectroscopic techniques. The stretching and out of plane bending O–H peak of the hydrogel was found to have broadened in the nanocomposites compared to the neat hydrogel, suggesting possible hydrogen bonding interaction in the nanocomposite. The striking difference in XPS of the pure hydrogel and nanocomposite was observed in the C 1s spectrum when comparing the C–O to C–C/C–H ratio, which is 4.4 in the composite compared to 2.4 in the pure hydrogel, an evidence of structural rearrangement of the hydrogel in the presence of the bovine serum albumin-coated nanoparticles. The large increase in C–O bonding at the surface relative to hydrocarbon in the composite would be consistent with the hydrogel molecule rearranging so that the polyethylene glycol part is pointing up toward the surface while the ends with the sugar/carbohydrate interact with bovine serum albumin. Additionally, approximately 50% and 20% of nanoparticles were desorbed from the lightly and highly crosslinked hydrogel matrix, respectively, after 14 days of desorption study, suggesting the role of nanostructure in controlling the diffusion of nanoparticles from the hydrogel matrix. Future studies will focus on the current understanding of the existence of interactions between polymeric chains and nanoparticles and the importance of nanostructures in influencing the properties of the nanocomposite hydrogels for required applications.
Acknowledgments
The authors gratefully acknowledge the financial support from the U.S. Army Research Office (5710003423) through ISN at MIT, Boston, MA. D.R. also acknowledges the financial support from the WBHR-LSAMP Program (NSF HRD-1000286) for material purchase. Additionally, the authors would like to thank the assistance of the MIT Materials Research Laboratory, specifically Mr. Patrick Boisvert and Dr. Yong Zhang in the Electron Microscopy Laboratory for their assistance with SEM and TEM. The authors would like to acknowledge the Howard Nanoscale Science and Engineering Facility (HNF), specifically Dr. Gary Harris, Mr. James Griffin, Mr. Crawford Taylor, and Mr. Anthony Gomez, for their assistance with hydrogel sample preparation and hydrogel analysis. Finally, the authors would like to acknowledge the assistance of Dr. Paul Wang and Mr. Stephen Lin from the Molecular Imaging Laboratory at Howard University’s College of Medicine for their assistance with DLS analysis.
Supporting Information Available
The Supporting Information is available free of charge at https://pubs.acs.org/doi/10.1021/acsomega.1c00834.
(Figure S1) 1H NMR of the hydrogel precursors and (Figure S2) pictorial representation of the hydrogel and nanoparticle-filled hydrogel synthesized in the laboratory (PDF)
(PDF)
Author Contributions
% B.Z. and O.A. contributed equally to this work.
The authors declare no competing financial interest.
Supplementary Material
References
- Yang K.; Han Q.; Chen B.; Zheng Y.; Zhang K.; Li Q.; Wang J. Antimicrobial Hydrogels: Promising Materials for Medical Application. Int. J. Nanomed. 2018, Volume 13, 2217–2263. 10.2147/IJN.S154748. [DOI] [PMC free article] [PubMed] [Google Scholar]
- Asharani P. V.; Low Kah Mun G.; Hande M. P.; Valiyaveettil S. Cytotoxicity and Genotoxicity of Silver Nanoparticles in Human Cells. ACS Nano 2009, 3, 279–290. 10.1021/nn800596w. [DOI] [PubMed] [Google Scholar]
- Varaprasad K.; Mohan Y. M.; Ravindra S.; Reddy N. N.; Vimala K.; Monika K.; Sreedhar B.; Raju K. M. Hydrogel-Silver Nanoparticle Composites: A New Generation of Antimicrobials. J. Appl. Polym. Sci. 2010, 115, 1199–1207. 10.1002/app.31249. [DOI] [Google Scholar]
- Kim H. D.; Valentini R. F. Retention and Activity of BMP-2 in Hyaluronic Acid-Based Scaffolds in Vitro. J. Biomed. Mater. Res. 2002, 59, 573–584. 10.1002/jbm.10011. [DOI] [PubMed] [Google Scholar]
- Zhang X.; Yao M.; Chen M.; Li L.; Dong C.; Hou Y.; Zhao H.; Jia B.; Wang F. Hyaluronic Acid-Coated Silver Nanoparticles As a Nanoplatform for in Vivo Imaging Applications. ACS Appl. Mater. Interfaces 2016, 8, 25650–25653. 10.1021/acsami.6b08166. [DOI] [PubMed] [Google Scholar]
- Wee S. F.; Gombotz W. R. Protein Release from Alginate Matrices. Adv. Drug Delivery Rev. 1998, 31, 267–285. [DOI] [PubMed] [Google Scholar]
- Bakare R. A.; Bhan C.; Raghavan D. Synthesis and Characterization of Collagen Grafted Poly(hydroxybutyrate–valerate) (PHBV) Scaffold for Loading of Bovine Serum Albumin Capped Silver (Ag/BSA) Nanoparticles in the Potential Use of Tissue Engineering Application. Biomacromolecules 2014, 15, 423–435. 10.1021/bm401686v. [DOI] [PubMed] [Google Scholar]
- Varghese O. P.; Kisiel M.; Martínez-Sanz E.; Ossipov D. A.; Hilborn J. Synthesis of Guanidinium-Modified Hyaluronic Acid Hydrogel. Macromol. Rapid Commun. 2010, 31, 1175–1180. 10.1002/marc.200900906. [DOI] [PubMed] [Google Scholar]
- Hall C. L.; Turley E. A. Hyaluronan: RHAMM Mediated Cell Locomotion and Signaling in Tumorigenesis. J. Neuro-Oncol. 1995, 26, 221–229. 10.1007/BF01052625. [DOI] [PubMed] [Google Scholar]
- Ialenti A.; Di Rosa M. Hyaluronic Acid Modulates Acute and Chronic Inflammation. Agents Actions 1994, 43, 44–47. 10.1007/BF02005763. [DOI] [PubMed] [Google Scholar]
- Weigel P.; Frost S.; McGary C.; LeBoeuf R. The Role of Hyaluronic Acid in Inflammation and Wound Healing. Int. J. Tissue React. 1988, 10, 355–365. [PubMed] [Google Scholar]
- Kim J.; Kim I. S.; Cho T. H.; Lee K. B.; Hwang S. J.; Tae G.; Noh I.; Lee S. H.; Park Y.; Sun K. Bone Regeneration Using Hyaluronic Acid-Based Hydrogel with Bone Morphogenic Protein-2 and Human Mesenchymal Stem Cells. Biomaterials 2007, 28, 1830–1837. 10.1016/j.biomaterials.2006.11.050. [DOI] [PubMed] [Google Scholar]
- Jewett J. C.; Bertozzi C. R. Cu-Free Click Cycloaddition Reactions in Chemical Biology. Chem. Soc. Rev. 2010, 39, 1272–1279. 10.1039/b901970g. [DOI] [PMC free article] [PubMed] [Google Scholar]
- Desai R. M.; Koshy S. T.; Hilderbrand S. A.; Mooney D. J.; Joshi N. S. Versitile Click Alginate Hydrogels Crosslinked via Tetrazine–Norbornene Chemistry. Biomaterials 2015, 50, 30–37. 10.1016/j.biomaterials.2015.01.048. [DOI] [PubMed] [Google Scholar]
- Aimetti A. A.; Machen A. J.; Anseth K. S. Poly(ethylene glycol) Hydrogels Formed by Thiol-ene Photopolymerization for Enzyme-Responsive Protein Delivery. Biomaterials 2009, 30, 6048–6054. 10.1016/j.biomaterials.2009.07.043. [DOI] [PMC free article] [PubMed] [Google Scholar]
- Shih H.; Lin C.-C. Cross-Linking and Degradation of Step-Growth Hydrogels Formed by Thiol-ene Photoclick Chemistry. Biomacromolecules 2012, 13, 2003–2012. 10.1021/bm300752j. [DOI] [PMC free article] [PubMed] [Google Scholar]
- Thoniyot P.; Tan M. J.; Karim A. A.; Young D. J.; Loh X. J. Nanoparticle-Hydrogel Composites: Concept, Design, and Applications of These Promising, Multi-Functional Materials. Adv. Sci. 2015, 2, 1400010. 10.1002/advs.201400010. [DOI] [PMC free article] [PubMed] [Google Scholar]
- Gaharwar A. K.; Peppas N. A.; Khademhosseini A. Nanocomposite Hydrogels for Biomedical Applications. Biotechnol. Bioeng. 2014, 111, 441–453. 10.1002/bit.25160. [DOI] [PMC free article] [PubMed] [Google Scholar]
- Wu C.-J.; Gaharwar A. K.; Schexnailder P. J.; Schmidt G. Development of Biomedical Polymer-Silicate Nanocomposites: A Materials Science Perspective. Materials 2010, 3, 2986–3005. 10.3390/ma3052986. [DOI] [Google Scholar]
- Friedli G.Interaction Of Deamidated Soluble Wheat Protein (SWP) With Other Food Proteins And Metals. PhD Thesis, University of Surrey, Guildford, England, 1996. [Google Scholar]
- Lenormand H.; Vincent J.-C. pH effects on the hyaluronan hydrolysis catalysed by hyaluronidase in the presence of proteins: Part II. The electrostatic hyaluronan – Protein complexes. Carbohydr. Polym. 2011, 85, 303–311. 10.1016/j.carbpol.2011.02.007. [DOI] [Google Scholar]
- Phan H. T. M.; Bartelt-Hunt S.; Rodenhausen K. B.; Schubert M.; Bartz J. C. Investigation of Bovine Serum Albumin (BSA) Attachment onto Self-Assembled Monolayers (SAMs) Using Combinatorial Quartz Crystal Microbalance with Dissipation (QCM-D) and Spectroscopic Ellipsometry (SE). PLoS One 2015, 10, e0141282 10.1371/journal.pone.0141282. [DOI] [PMC free article] [PubMed] [Google Scholar]
- Edelman R.; Assaraf Y. G.; Levitzky I.; Shahar T.; Livney Y. D. Hyaluronic Acid-Serum Albumin Conjugate-Based Nanoparticles for Targeted Cancer Therapy. Oncotarget 2017, 8, 24337–24353. 10.18632/oncotarget.15363. [DOI] [PMC free article] [PubMed] [Google Scholar]
- Elgadir M. A.; Akanda M. J. H.; Ferdosh S.; Mehrnoush A.; Karim A. A.; Noda T.; Sarker Z. Mixed Biopolymer Systems Based on Starch. Molecules 2012, 17, 584–597. 10.3390/molecules17010584. [DOI] [PMC free article] [PubMed] [Google Scholar]
- Bergfeldt K.; Piculell L.; Tjerneld F. Phase Separation Phenomena and Viscosity Enhancements in Aqueous Mixtures of Poly(styrenesulfonate) with Poly(acrylic acid) at Different Degrees of Neutralization. Macromolecules 1995, 28, 3360–3370. 10.1021/ma00113a041. [DOI] [Google Scholar]
- Harding S.; Hill S.; Mitchell J.. Biopolymer mixtures; Nottingham University Press: Nottingham, 1995. [Google Scholar]
- Lee J.Physical Properties of Polysaccharides and Their Interactions with Protein at Multi-Length Scales. PhD Thesis, Rutgers University, New Brunswick, New Jersey, United States of America, 2008. [Google Scholar]
- Grade S.; Eberhard J.; Neumeister A.; Wagener P.; Winkel A.; Stiesch M.; Barcikowski S. Serum Albumin Reduces the Antibacterial and Cytotoxic Effects of Hydrogel-Embedded Colloidal Silver Nanoparticles. RSC Adv. 2012, 2, 7190–7196. 10.1039/c2ra20546g. [DOI] [Google Scholar]
- Famili A.; Rajagopal K. Bio-Orthogonal Cross-Linking Chemistry Enables In Situ Protein Encapsulation and Provides Sustained Release from Hyaluronic Acid Based Hydrogels. Mol. Pharmaceutics 2017, 14, 1961–1968. 10.1021/acs.molpharmaceut.7b00067. [DOI] [PubMed] [Google Scholar]
- Haraguchi K.; Farnworth R.; Ohbayashi A.; Takehisa T. Compositiona Effects on Mechanical Properties of Nanocomposite Hydrogels Composed of Poly(N,N-dimethylacrylamide) and Clay. Macromolecules 2003, 36, 5732–5741. 10.1021/ma034366i. [DOI] [Google Scholar]
- Alge D. L.; Azagarsamy M. A.; Donohue D. F.; Anseth K. S. Synthetically Tractable Click Hydrogels for Three-Dimensional Cell Culture Formed Using Tetrazine-Norbornene Chemistry. Biomacromolecules 2013, 14, 949–953. 10.1021/bm4000508. [DOI] [PMC free article] [PubMed] [Google Scholar]
- Gramlich W. M.; Kim I. L.; Burdick J. A. Synthesis and Orthogonal Photopatterning of Hyaluronic Acid Hydrogels with Thiol-Norbornene Chemistry. Biomaterials 2013, 34, 9803–9811. 10.1016/j.biomaterials.2013.08.089. [DOI] [PMC free article] [PubMed] [Google Scholar]
- Gebregeorgis A.; Bhan C.; Wilson O.; Raghavan D. Characterization of Silver/Bovine Serum Albumin (Ag/BSA) Nanoparticles Structure: Morphological, Compositional, and Interaction Studies. J. Colloid Interface Sci. 2013, 389, 31–41. 10.1016/j.jcis.2012.08.041. [DOI] [PubMed] [Google Scholar]
- Phil, Beauchamp. Spectroscopy Tables. Cal Poly Pomona. December 2009. https://www.cpp.edu/~psbeauchamp/pdf/spec_ir_nmr_spectra_tables.pdf (Accessed May 2019)
- Alge D. L.; Donohue D. F.; Anseth K. S. Facile and Efficient Lewis Acid Catalyzed Synthesis of an Asymmetric Tetrazine Useful for Bio-Orthogonal Click Chemistry Applications. Tetrahedron Lett. 2013, 54, 5639–5641. 10.1016/j.tetlet.2013.08.010. [DOI] [PMC free article] [PubMed] [Google Scholar]
- Zewde B.; Atoyebi O.; Raghavan D. An Efficient Metal Catalyst Free Approach to Synthesize 5-(4-(1,2,4,5 tetrazin-3-yl)benzylamino)-5-oxopentanoic Acid. Tetrahedron Lett. 2018, 59, 3100–3103. 10.1016/j.tetlet.2018.06.071. [DOI] [Google Scholar]
- Snyder T. N.; Madhavan K.; Intrator M.; Dregalla R. C.; Park D. A Fibrin/Hyaluronic Acid Hydrogel for the Delivery of Mesenchymal Stem Cells and Potential for Articular Cartilage Repair. J. Biol. Eng. 2014, 8, 1–11. 10.1186/1754-1611-8-10. [DOI] [PMC free article] [PubMed] [Google Scholar]
- Bhan C.; Mandlewala R.; Gebregeorgis A.; Raghavan D. Adsorption-Desorption Study of BSA Conjugated Silver Nanoparticles (Ag/BSA NPs) on Collagen Immobilized Substrates. Langmuir 2012, 28, 17043–17052. 10.1021/la303539n. [DOI] [PubMed] [Google Scholar]
- Köse G. T.; Kenar H.; Hasırcı N.; Hasırcı V. Macroporous poly(3-hydroxybutyrate-co-3-hydroxyvalerate) matrices for bone tissue engineering. Biomaterials 2003, 24, 1949–1958. 10.1016/S0142-9612(02)00613-0. [DOI] [PubMed] [Google Scholar]
- Liu H.; Raghavan D.; Melaku S.; Stubbs J. III Biological Response of Osteoblast-Like UMR-106 Cells to the Modified PHBV Matrix- Effects of Porosity and Collagen Dip Coating. J. Biomed. Mater. Res., Part A 2010, 92A, 922–930. 10.1002/jbm.a.32427. [DOI] [PubMed] [Google Scholar]
- Bastos-Arrieta J.; Muñoz M.; Ruiz P.; Muraviev D. N. Morphological Changes of Gel-Type Functional Polymers After Intermatrix Synthesis of Polymer Stabilized Silver Nanoparticles. Nanoscale Res. Lett. 2013, 8, 1–4. 10.1186/1556-276X-8-255. [DOI] [PMC free article] [PubMed] [Google Scholar]
- Sajomsang W.; Gonil P.; Tantayanon S. Antibacterial Activity of Quaternary Ammonium Chitosan Containing Mono or Disaccharide Moieties: Preparation and Characterization. Int. J. Biol. Macromol. 2009, 44, 419–427. 10.1016/j.ijbiomac.2009.03.003. [DOI] [PubMed] [Google Scholar]
- Ma R.; Epand R. F.; Zhitomirsky I. Electrodeposition of Hyaluronic Acid and Hyaluronic Acid-Bovine Serum Albumin Films from Aqueous Solutions. Colloids Surf., B 2010, 77, 279–285. 10.1016/j.colsurfb.2010.02.002. [DOI] [PubMed] [Google Scholar]
- Yonese M.; Xu S.; Kugimiya S.; Sato S.; Miyata I. In Progress in Colloid & Polymer Science; Kawasaki K., Lindman B., Okabayashi H., Eds.; Formation and Dynamics of Self-Organized Structures in Surfactants and Polymer Solutions, Vol. 106; Steinkopff: Germany, 1997; 252–256. [Google Scholar]
- Moulder J.; Stickle W.; Sobol P.; Bomben K. In Handbook of X-ray Photoelectron Spectroscopy: A Reference Book of Standard Spectra for Identification and Interpretation of XPS Data ,Chastain J., Eds.; Physical Electronics Division, Perkin-Elmer Corporation: Eden Prairie, MN, 1992. [Google Scholar]
- Akhavan O.; Abdolahad M.; Asadi R. Storage of Ag Nanoparticles on Pore-Arrays of SU-8 Matrix for Antibacterial Applications. J. Phys. D: Appl. Phys. 2009, 42, 135416. 10.1088/0022-3727/42/13/135416. [DOI] [Google Scholar]
- Ang T. P.; Chin W. S. Dodecanethiol-Protected Copper/Silver Bimetallic Nanoclusters and Their Surface Properties. J. Phys. Chem. B 2005, 109, 22228–22236. 10.1021/jp053429r. [DOI] [PubMed] [Google Scholar]
- Han S. W.; Kim Y.; Kim K. Dodecanethiol-Derivatized Au/Ag Bimetallic Nanoparticles: TEM, UV/VIS, XPS, and FTIR Analysis. J. Colloid Interface Sci. 1998, 208, 272–278. 10.1006/jcis.1998.5812. [DOI] [PubMed] [Google Scholar]
- Spahr P. F.; Edsall J. T. Amino Acid Composition of Human and Bovine Serum Mercaptalbumins. J. Biol. Chem. 1964, 239, 850–854. 10.1016/S0021-9258(18)51668-9. [DOI] [PubMed] [Google Scholar]
- Louette P.; Bodino F.; Pireaux J.-J. Poly(ethylene oxide) (PEO) XPS Reference Core Level and Energy Loss Spectra. Surf. Sci. Spectra 2005, 12, 59–63. 10.1116/11.20050912. [DOI] [Google Scholar]
- Woehl M. A.; Ono L.; Vidotti I. C. R.; Wypych F.; Schreiner W. H.; Sierakowski M. R. Bioactive Nanocomposites of Bacterial Cellulose and Natural Hydrocolloids. J. Mater. Chem. B 2014, 2, 7034–7044. 10.1039/C4TB00706A. [DOI] [PubMed] [Google Scholar]
- Hwang E. T.; Lee J. H.; Chae Y. J.; Kim Y. S.; Kim B. C.; Sang B.-I.; Gu M. B. Analysis of the Toxic Mode of Action of Silver Nanoparticles Using Stress-Specific Bioluminescent Bacteria. Small 2008, 4, 746–750. 10.1002/smll.200700954. [DOI] [PubMed] [Google Scholar]
- Flores C. Y.; Miñán A. G.; Grillo C. A.; Salvarezza R. C.; Vericat C.; Schilardi P. L. Citrate-Capped Silver Nanoparticles Showing Good Bactericidal Effect Against Both Planktonic and Sessile Bacteria and a Low Cytotoxicity to Osteoblastic Cells. ACS Appl. Mater. Interfaces 2013, 5, 3149–3159. 10.1021/am400044e. [DOI] [PubMed] [Google Scholar]
- Zarei M.; Jamnejad A.; Khajehali E. Antibacterial Effect of Silver Nanoparticles Against Four Foodborne Pathogens. Jundishapur J. Microbiol. 2014, 7, e8720 10.5812/jjm.8720. [DOI] [PMC free article] [PubMed] [Google Scholar]
- Medici S.; Peana M.; Nurchi V. M.; Zoroddu M. A. Medical Uses of Silver: History, Myths, and Scientific Evidence. J. Med. Chem. 2019, 62, 5923–5943. 10.1021/acs.jmedchem.8b01439. [DOI] [PubMed] [Google Scholar]
- Ciobanu C. S.; Iconaru S. L.; Chifiriuc M. C.; Costescu A.; Le Coustumer P.; Predoi D. Synthesis and Antimicrobial Activity of Silver-Doped Hydroxyapatite Nanoparticles. BioMed Res. Int. 2013, 2013, 916218. 10.1155/2013/916218. [DOI] [PMC free article] [PubMed] [Google Scholar]
- Sarvaş E.; Tavşanlı H.; Çapanoğlu E.; Tamer C. E. The Antimicrobial and Antioxidant Properties of Garagut: Traditional Cornelian Cherry (Cornus Mas) Marmalade. Qual. Assur. Saf. Corps Foods 2020, 12, 12–23. 10.15586/qas.v12i2.627. [DOI] [Google Scholar]
- Taber H. W.; Mueller J. P.; Miller P. F.; Arrow A. S. Bacterial uptake of aminoglycoside antibiotics. Microbiol. Rev. 1987, 51, 439–457. 10.1128/MR.51.4.439-457.1987. [DOI] [PMC free article] [PubMed] [Google Scholar]
Associated Data
This section collects any data citations, data availability statements, or supplementary materials included in this article.