Abstract
Hyperglycemia is considered to be a driving factor for advanced glycated end products (AGEs) formation. Inhibition of this process plays a vital role in reducing the problems of diabetes. This study aimed to explore the in vitro antiglycation and in vivo antidiabetic effect of thiamine. Human serum albumin (HSA) was used as a model protein to delineate the antiglycation potential of thiamine. Fructosamine levels were low in the presence of thiamine, implying the inhibition of early stages of glycation by thiamine. Furthermore, HSA–glucose assays depict the inhibition of post-Amadori products by thiamine. CD spectroscopy suggested fewer alterations in the secondary structure in the presence of thiamine. It was found that the administration of thiamine to diabetic rats leads to an increase in hexokinase activity and increased insulin secretion coupled with glycolysis utilization of glucose. Moreover, the activity of glucose-6-phosphatase and fructose- 1-6-phosphatase (increased in the liver and kidney of diabetic rats) is restored to near-normal levels upon thiamine administration. Histopathological studies also advocated that thiamine supplementation decreases the pathological abnormalities associated with diabetes in the liver and kidney. This study provides a rationale that vitamins can be implicated in controlling diabetes.
1. Introduction
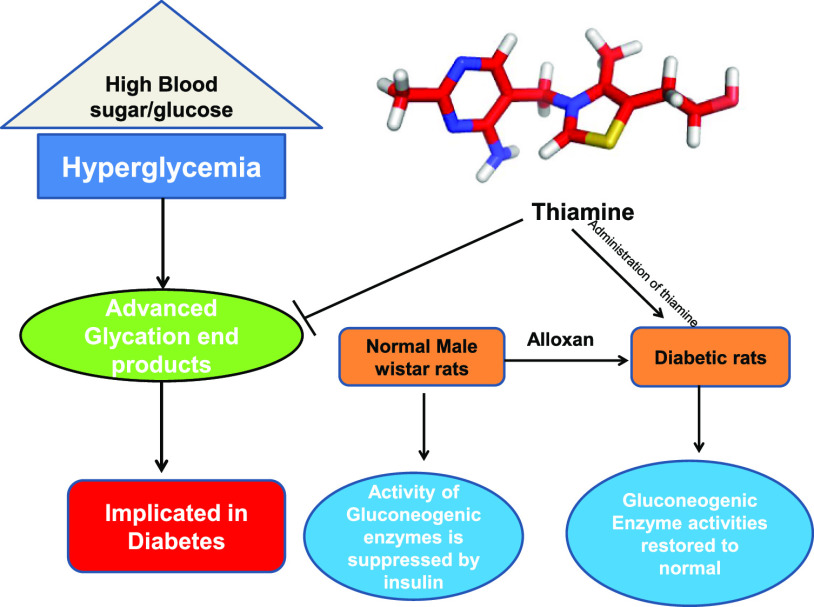
Diabetes mellitus (DM) is a key health concern worldwide and affects almost all age groups.1 Type 2 diabetes is the most prevalent form, with type 1 contributing to 5–10% of all diabetic cases. Type 2 diabetes is symptomized by insulin resistance coupled with insulin deficiency and obesity in most cases.2 Much research evidence has shown that hyperglycemia-induced oxidative stress leads to varying degrees of testicular dysfunction3 and disruptions in the cell membrane’s biochemical structures as the reactive oxygen species (ROSs) have a high affinity to polyunsaturated fatty acids.4 To date, no successful therapy has been developed to cure DM. The antidiabetic drugs currently present in the market address the symptoms of diabetes but not the causes that lead to the generation of this disorder. Researchers worldwide aim to develop safer, novel, and more effective antihyperglycemic agents, especially in long-term therapy. Research reports indicate that the consumption of natural products like fruits and vegetables, especially rich in polyphenols and vitamins, leads to the positive management of diabetes.5 Various vitamins and natural products have been analyzed against diabetes through both in vitro and in vivo studies in our laboratory.6 The primary aim of this study is to examine the antiglycation effect of vitamin B1 on glucose-induced glycation of human serum albumin (HSA) under in vitro conditions and further enhance the antioxidant potential of the animal system to combat the complications associated with diabetes. HSA is usually deployed as a model protein for glycation studies and investigations of the antiglycation potential of molecules. HSA is a globular protein and a vital drug carrier in the body.7 Vitamin B1 (thiamine), a water-soluble vitamin, has a dietary reference intake of 1.1 mg per day for females and 1.3 mg per day for males for normal healthy adults. Thiamine deficiency can affect the cardiovascular, nervous, and immune systems and is commonly observed in wet beriberi, dry beriberi, or as Wernicke–Korsakoff syndrome. When thiamine stores are depleted (about 4 weeks after stopping intake), there is an appearance of symptoms. If the CNS is involved, there is an occurrence of dry beriberi, and this is in the instances of poor uptake. The other variation of dry beriberi is Wernicke encephalopathy. For wet beriberi, the cardiovascular system is involved, and there is a failure in the heart function, causing edema and retention of the fluid. Thiamine mainly exerts its physiological function in the form of TPP, which is the cofactor for the cytosolic enzyme of the pentose phosphate pathway and the mitochondrial pyruvate dehydrogenase and ketoglutarate dehydrogenase (aKDH) of the citric acid cycle.8 Various research studies support the connection between thiamine and DM. According to a research article published, it was found that the plasma thiamine concentration decreased 76% in type 1 diabetic patients and 75% in type 2 diabetic patients, implying that low plasma thiamine concentration is prevalent in patients with type 1 and type 2 diabetes, associated with increased thiamine clearance.9 A research study by Olsen et al. (2007) suggests that external supplementation of a high thiamine dose amended the clinical symptoms of the disease, including a reduction or cessation in the need for exogenous insulin in these patients.10 In various experimental studies, it was suggested that thiamine supplementation increases the excretion of adducts formed due to the oxidation, nitration, and glycation of various proteins and prevents tissue accumulation.11 All these research studies highlighted the importance of thiamine in DM. Hence, this study aimed to gain insight into the in vitro antiglycation and in vivo antidiabetic effect of thiamine. Antiglycation potential of thiamine was depicted by using HSA as a model protein. Moreover, diabetic rat models were used to see the effect of thiamine administration to gain insight into its effect on diabetes in terms of different enzymatic activities.
2. Results and Discussion
2.1. UV–Visible Spectroscopy
After completing the glycation period, all the samples were preliminarily assessed by recording the UV–visible absorption spectra. The native HSA sample exhibited a characteristic peak at 280 nm, as shown in Figure 1. The glycated HSA showed more than two times hyperchromicity compared to native HSA. The changes in absorbance at λmax indicate the structural and conformational changes resulting from glycation. The HSA samples incubated with thiamine showed a dose-dependent decrease in absorption at λmax. This is a primary indication that the treatment of thiamine protected HSA from structural changes.
Figure 1.
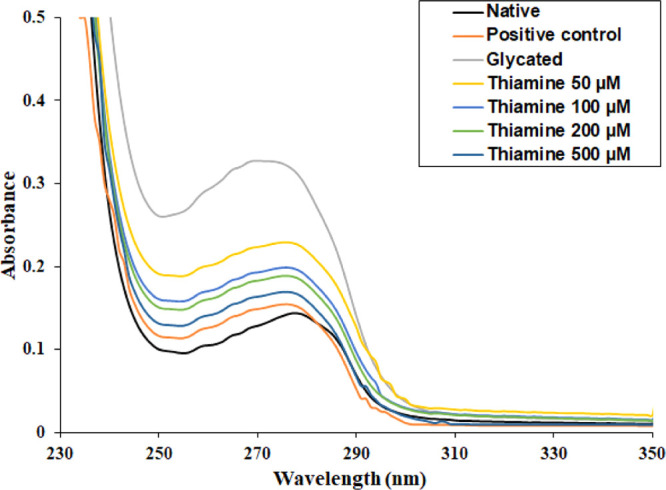
UV–visible spectra of native, glycated, and thiamine-treated HSA after 28 days. (Aminoguanidine is the positive control). The protein concentration in each sample was 5 μM.
2.2. AGE-Specific Fluorescence
Advanced glycated end products (AGEs) contribute significantly to the pathogenicity of some age-related issues and cardiovascular complications in diabetic subjects. For the detection of AGEs, AGE-specific fluorescence is routinely used. The native HSA exhibited minimum fluorescence under AGE-specific excitation. There was an approximately four-times enhancement in the AGE-specific fluorescence in glycated HSA compared to native HSA. There was a concentration-dependent effect of thiamine on AGE-specific fluorescence. Treatment with 50, 100, 200, and 500 μM thiamine resulted in 19.32, 52.46, 59.45, and 72.56% decrease in the fluorescence intensity, respectively, as shown in Figure 2.
Figure 2.
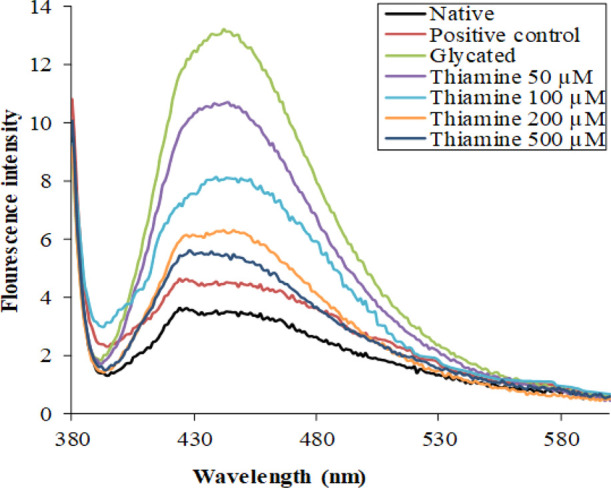
Fluorescence emission spectra of native HSA, glycated HSA, and HSA with different concentrations of thiamine. The inhibitory effect of thiamine in the formation of fluorescent AGEs. The protein concentration in each sample was 3 μM.
2.3. Estimation of Glycation
The binding of glucose to serum proteins results in fructosamine formation; therefore, its level indicates the overall glucose concentration and early glycation products in blood. The experiment was performed to check the efficacy of thiamine in reducing the early-stage products of glycation and the results obtained are presented in Figure 3. The fructosamine level in glycated HSA was found to be more than 10 times compared to that in native HSA. This shows that elevated levels of glucose increase the formation of fructosamine. Treatment with 50, 100, 200, and 500 μM thiamine resulted in 13.57, 19.37, 40.97, and 54.06% decrease in fructosamine content than glycated HSA. The reduction in fructosamine content by thiamine indicates its ability to inhibit the early products of nonenzymatic glycation of serum albumin.
Figure 3.
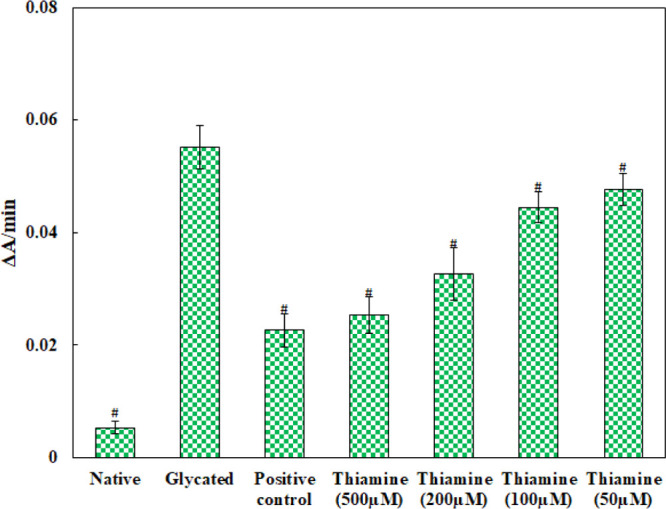
Extent of glycation in different protein samples. Aminoguanidine is the positive control; # indicates significantly different from the glycated group sample at p ≤ 0.05.
2.4. Free-Lysine Content
The free amino groups (ε-amino acids) of lysine residues are glycated to form carboxymethyl lysine, carboxyethyl lysine, and vesper lysine. Figure 4 depicts that glycation of HSA leads to 74.05% modification of lysine residues, and in the presence of 500 μM thiamine, the modification was decreased to 24.77%.
Figure 4.
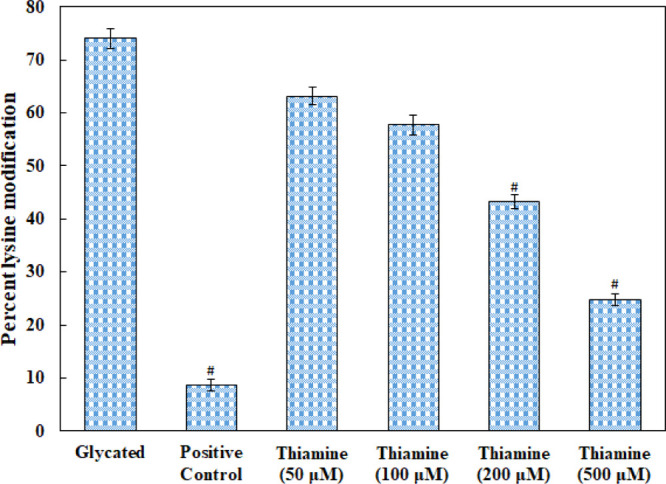
Effect of thiamine on the free ε-NH2 group of lysine determined by TNBSA assay in native HSA, glycated HSA, and thiamine-treated HSA. (Aminoguanidine is the positive control). # indicates significantly different from the diabetic group at p ≤ 0.05.
2.5. Evaluation of Structural Alterations by Circular Dichroism spectroscopy
The inhibitory effect of thiamine upon the changes in the secondary structure of HSA caused by glycation was studied by circular dichroism spectroscopy. The CD spectra of native, glycated, and thiamine-treated HSA are shown in Figure 5 and the α-helical content is depicted in Table 1. The α-helical content in native HSA was found to be 57.16%. In glycated HSA, the % α-helix decreased to 31.64, which might be due to secondary structural transitions. In the presence of 200 and 500 μM thiamine, the α-helical content was restored to 47.44 and 51.66%, respectively. The results decipher that there was a dose-dependent effect of thiamine on glycation-induced secondary structural alteration.
Figure 5.
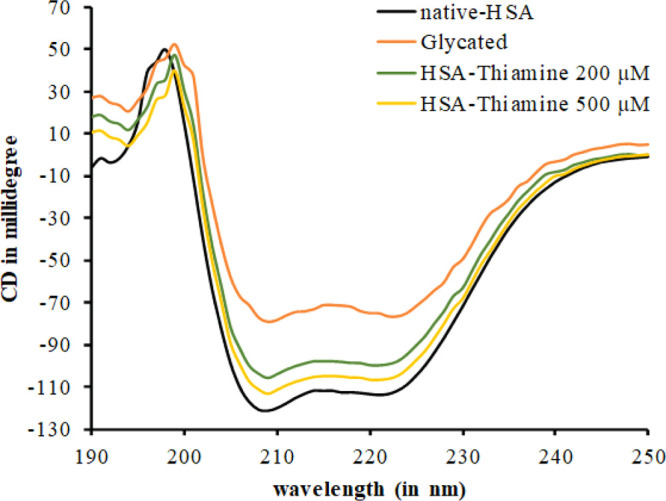
Far UV-CD spectra of native, glycated, and thiamine-treated HSA. The protein concentration was 0.3 mg/mL. Each spectrum represents the average of three scans.
Table 1. α-Helical Contents in Native HSA, Glycated HSA, and Thiamine-Treated HSA Estimated from the CD Data.
| samles | % α-helix |
|---|---|
| native HSA | 57.16710875 |
| glycated HSA | 31.64456233 |
| 200 μM thiamine | 47.44768641 |
| 500 μM thiamine | 51.66814029 |
2.6. Sodium Dodecyl Sulfate-Polyacrylamide Gel Electrophoresis
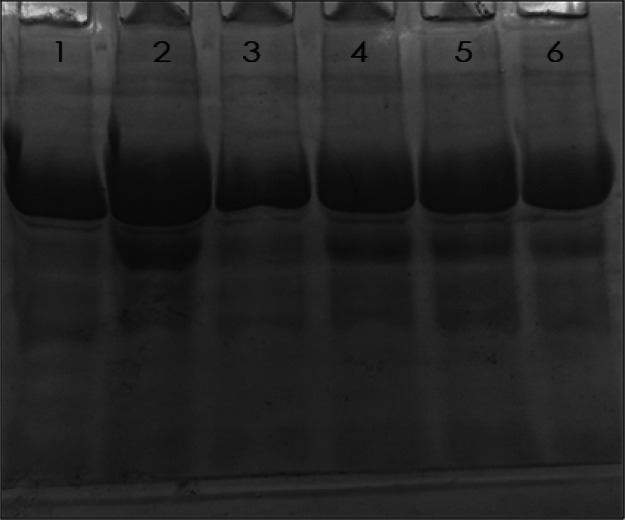
The electrophoretic mobility of native, glycated, aminoguanidine-treated, and thiamine-treated HSA samples was assessed on 10% polyacrylamide gel. The migration pattern of different HSA samples is shown in Figure 6. Native HSA showed a single parental band, while glycated HSA exhibited multiple bands. The other bands were of lower molecular weight which may include the fragments of HSA generated by the ROSs. Moreover, the mobility in the case of the parental band of glycated HSA is also reduced due to the attachment of glucose molecules. The samples treated with thiamine exhibited reduced fragmentation compared to glycated HSA. Moreover, the migration of the parental band was also restored toward native HSA. The results show a protective effect of thiamine against ROS-mediated fragmentation of HSA.
Figure 6.
SDS-PAGE of different HSA samples on 10% polyacrylamide gel. The electrophoresis was performed for 3 h at 100 V. Protein samples (12 μg in each lane) were loaded in wells. Lanes: (1) native HSA; (2) glycated HSA; (3) aminoguanidine; (4) 100; (5) 200; and (6) 500 μM thiamine.
2.7. Transmission Electron Microscopy Analysis
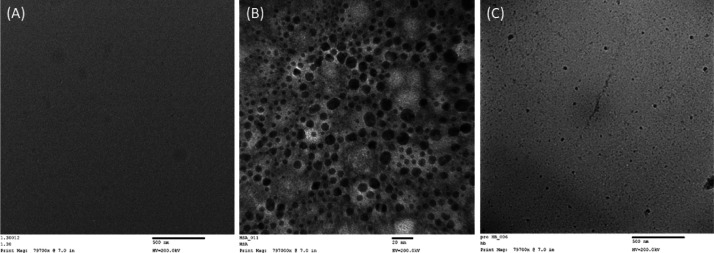
It is known that glycation leads to the aggregation of proteins. Therefore, the effect of thiamine on the glycation-induced aggregation of HSA was also accessed as evident from the transmission electron microscopy (TEM) micrograph; no aggregates or fibril-like patches were found in native HSA, although in glycated HSA, there were clear patches of aggregates in HSA (Figure 7). The treatment with thiamine remarkably reduced the aggregate-like formation. The results show protection by thiamine against the formation of glycation-induced aggregates in HSA.
Figure 7.
Transmission electron micrographs of native HSA (A), glycated HSA (B), and 500 μM thiamine-treated HSA (C) after 28 days of in 10 mM phosphate buffer at pH 7.4. 10 μL of each sample was kept on the TEM grid, and images were recorded at 200 kV.
2.8. α-Glucosidase
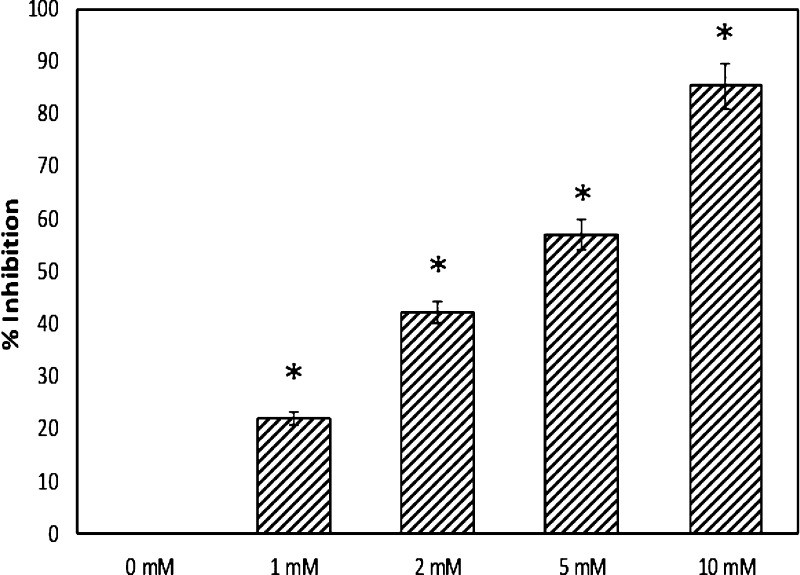
The mammalian α-glucosidases are primarily located on the surface membrane of intestinal cells, in which they catalyze the final stage of carbohydrate digestion. These enzymes break 1,4-α linkages, resulting in the formation of α-d-glucose from the nonreducing end of the sugars. In the presence of 1, 2, 5, and 10 mM thiamine, there was 21.94, 42.20, 56.80, and 85.28% inhibition of α-glucosidase activity, respectively (Figure 8). The result shows the potential of thiamine in inhibiting the α-glucosidase activity. This could be a mechanism for lowering the blood glucose level; inhibition of α-glucosidase activity prevents the dissociation of oligosaccharides into free glucose molecules.
Figure 8.
Inhibition of α-glucosidase by thiamine. # indicates significantly different from the diabetic group at p ≤ 0.05.
2.9. Docking
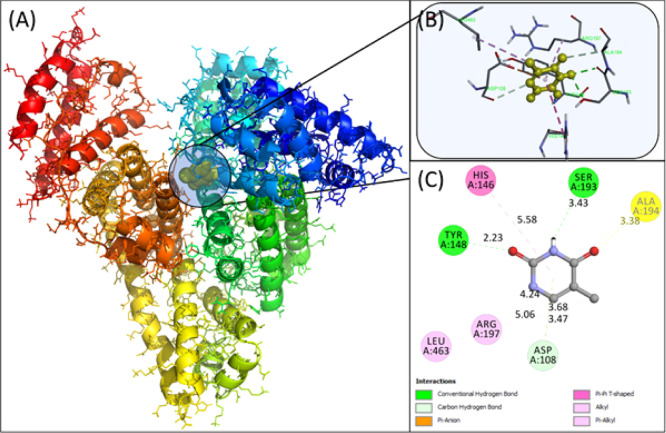
Molecular docking was employed to obtain a closer look at the binding site of thiamine in HSA. HSA contains 585 amino acids divided into three domains, that is, domain I, domain II, and domain III, with further subdivision of each domain as subdomain A and B.12 Subdomain IIA and subdomain IIIA are the most common binding pockets in HSA. AutoDock-vina yielded nine conformations with increasing energy order, and the best conformation having the lowest energy is discussed below. Molecular docking of the lowest binding conformation depicted the binding energy to be −5.5 kcal mol–1, as shown in Figure 9. Asp108, Tyr148, and Ser 193 of HSA formed hydrogen bonds with thiamine at a distance of 3.47, 2.23, and 3.43 Å, respectively. Moreover, His146, Arg197, and Leu463 formed hydrophobic interactions with thiamine. The masking of arginine and lysine residues might be one of the possible modes of action of thiamine. The solvent-accessible surface area (SASA) was also calculated. The SASA for free HSA was found to be 28074.127 Å2, while for the thiamine–HSA complex, it was reduced to 27968.719 Å2. There was a 105.408 Å2 decrease in the total SASA. It was found that in Asp108, His146, Ser193, Arg197, and Gln459, there was more than 10 Å2 reduction in the SASA, further validating the docking studies.
Figure 9.
Molecular models of HSA complexed with thiamine. (A) Detailed view of the docking poses of the HSA–thiamine complex; selected protein side chains are shown as ribbons. (B) Thiamine surrounded by interacting amino acids. (C) 2D view in Discovery Studio 2017.
2.10. Fasting Blood Glucose and Oral Glucose Tolerance Test
Results of fasting blood glucose (FBG) levels in treated and diabetic groups show significant variation. The levels of blood glucose were found to be elevated in the diabetic group (213.33 ± 9.71 mg/dL), which validates the establishment of diabetes compared to the control group (110.66 ± 16.44 mg/dL) and normal group supplemented with the high dose of thiamine (116.33 ± 10.50 mg/dL) Figure 10A. The diabetic rats treated with thiamine at 10 mg/kg body weight and 15 mg/kg body weight had an improved FBG profile in a dose-dependent manner. Thiamine at 10 and 15 mg/kg body weight significantly reduces the FBG level to 178 ± 12.76 mg/dL and 142.66 ± 11.59 mg/dL, respectively. Similarly, an oral glucose tolerance test (OGTT) was performed, and the level of blood glucose was persistently high in the diabetic group, as shown in Figure 10B. In contrast, groups treated with thiamine (10 and 15 mg/kg body weight) showed preventive effects against glucose-induced hyperglycemia. The glucose levels in thiamine-supplemented diabetic animals were considerably lower than those in the diabetic group and decreased mildly during the 2 h experiment.
Figure 10.
(A) FBG levels and (B) glucose tolerance test in the normal, diabetic, thiamine-supplemented normal, and thiamine-supplemented diabetic group of rats. # is p-value ≤ 0.05 compared to the diabetic group.
2.11. Effect of Thiamine on Glucose Metabolic Enzymes
Hexokinase catalyzes the first reaction of the glycolytic pathway. It plays a vital role in glucose breakdown by phosphorylation, and hence, it is assayed. Figure 11A shows the activity of hexokinase in the control and diabetic animal system. Supplementation of thiamine in the diabetic animals led to the recovery of hexokinase activity, which was decreased in the diabetic sample (liver, kidney, and pancreas). Another vital enzyme of glucose metabolism is G6Pase which catalyzes the removal of a phosphate group and increases the free blood glucose in the gluconeogenesis and glycogenolysis metabolic pathway. Figure 11B depicts an increased activity of G6Pase in a diabetic sample of the liver, kidney, and pancreas, which was reduced meaningfully upon the supplementation of thiamine in a dose-dependent manner. FBPase is also the gluconeogenesis pathway enzyme that catalyzes the reverse step of glycolysis catalyzed by phosphofructokinase. It plays a vital role in regulating blood glucose levels and hence is assayed. Post thiamine administration, the activity of FBPase was restored to normal, as depicted in Figure 11C.
Figure 11.
Dose-dependent effect of thiamine on glucose metabolic enzymes in alloxan-induced diabetic rats. (A) Hexokinase, (B) FBPase, and (C) G6Pase activities were measured in normal, diabetic, thiamine-supplemented normal, and thiamine-supplemented diabetic groups. # is p-value ≤ 0.05 compared to the diabetic group.
2.12. Effect of Thiamine on Lipid Peroxidation
The extent of lipid peroxidation was estimated by the Malondialdehyde (MDA) levels, which is considered a final product of the oxidation of lipids due to ROS production. The MDA level in the diabetic group was enhanced by more than twofold in the liver and pancreas, and a 93% increase of the same was observed in the kidney (Figure 12). Supplementation of thiamine with a higher dose in diabetic groups shows a significant recovery of 78% in the pancreas, which is the maximum among all the three organs. In comparison, 72% recovery was observed in the kidney and 66% in the liver.
Figure 12.
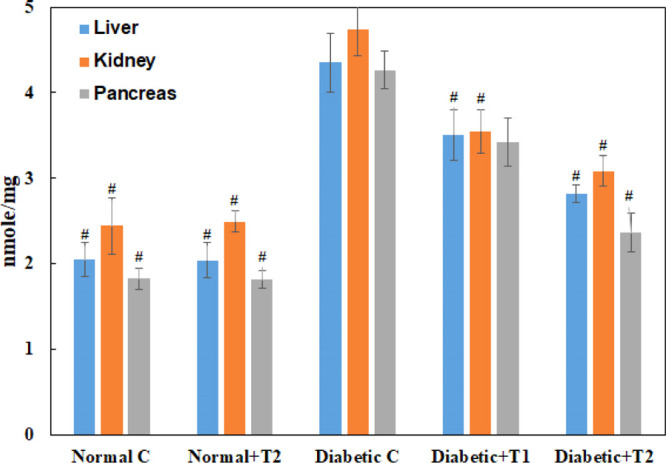
MDA levels in the liver, kidney, and pancreas of the normal, diabetic, thiamine-supplemented normal, and thiamine-supplemented diabetic group of rats. T1 is thiamine treatment at 10 mg/kg body weight and T2 is thiamine treatment at 15 mg/kg body weight. Results presented are mean ± SD of three independent treatments. # is p-value ≤ 0.05 compared to the diabetic group.
2.13. Effect of Thiamine on the Lipid Profile
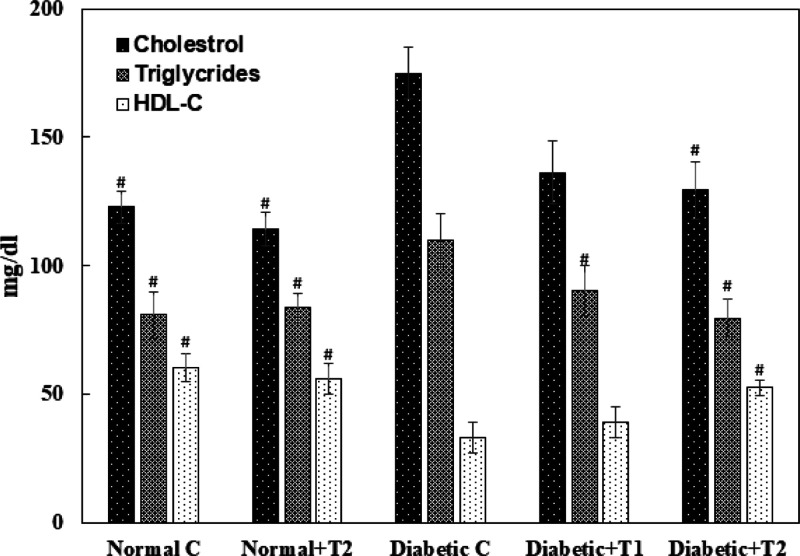
The lipid profile (HDL-C, cholesterol, and triglyceride) plays a vital role in the advancement of insulin resistance; diabetic patients have high chances of developing secondary complications such as cardiovascular diseases, stroke, and so forth, due to the abnormal increase in their threshold levels. There is a significantly decreased level of HDL-C in the serum of diabetic animals compared to the control group, which was restored upon the supplementation of thiamine in a dose-dependent manner. The serum levels of cholesterol and triglycerides were hiked in the diabetic group compared to the normal control. Post thiamine administration, the serum cholesterol and triglycerides levels in the diabetic rats were restored to normal (Figure 13).
Figure 13.
Lipid profile of the normal, diabetic, thiamine-supplemented normal, and thiamine-supplemented diabetic group of rats. T1 is thiamine treatment at 10 mg/kg body weight and T2 is thiamine treatment at 15 mg/kg body weight. Results presented are mean ± SD of three independent treatments. # is p-value ≤ 0.05 compared to the diabetic group.
2.14. Effect of Thiamine on Urea and Liver-Function Markers in Serum
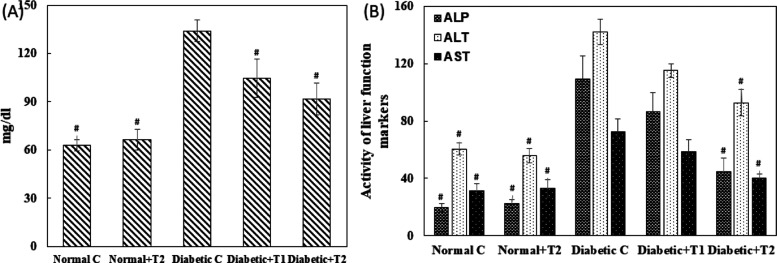
Diabetic animals showed an abnormal increase of more than two fold in the urea level, evident of kidney-function impairment. Upon supplementation with the higher dose, the urea levels were restored by 59% in the serum of treated animals Figure 14A. The level of aspartate transaminase (AST), alanine transaminase (ALT), and alkaline phosphatase (ALP) was estimated in the serum sample as liver-function markers, as shown in Figure 14B. An increase of more than twofold in the AST level was found in the diabetic group, while a recovery of 33% in 10 mg/kg body weight and 78% in 15 mg/kg body weight was seen in thiamine-supplemented groups. ALT was increased by 134% in the diabetic group, while a recovery of 60% was observed in the treated group at a higher dose of thiamine. There was an increase of more than fivefold in the ALP level in the diabetic group; supplementation of thiamine at 15 mg/kg body weight showed 72% recovery in the serum levels of ALP.
Figure 14.
(A). Liver-function markers and (B) urea levels in serum. Urea was measured as a kidney-function marker. ALT, AST, and ALP were measured as liver-function markers in the serum of the normal, diabetic, thiamine-supplemented normal, and thiamine-supplemented diabetic group of rats. T1 is thiamine treatment at 10 mg/kg body weight and T2 is thiamine treatment at 15 mg/kg body weight. Results presented are mean ± SD of three independent treatments. # is p-value ≤ 0.05 compared to the diabetic group.
2.15. Inhibition of Intracellular ROS by Thiamine Treatment
A sensitive fluorescent probe, that is, DCFH-DA, was used to quantify the intracellular ROSs produced in the lymphocytes. DCFH-DA is nonfluorescent, crosses the cell membrane, reacts with ROSs present in the cell, and gets converted to 2,7 dichlorofluorescein (DCF), making the cell fluorescent. The lymphocytes isolated from normal rats lack fluorescence and hence were not visible (Figure 15A). In contrast, the lymphocytes isolated from the diabetic group had bright fluorescence owing to the ROSs produced in vivo (Figure 15B). Interestingly, the lymphocytes treated with thiamine exhibited weaker fluorescence, implying the effect of thiamine in reducing the level of intracellular ROS production, thereby validating the antioxidant property of thiamine Figure 15C,D.
Figure 15.
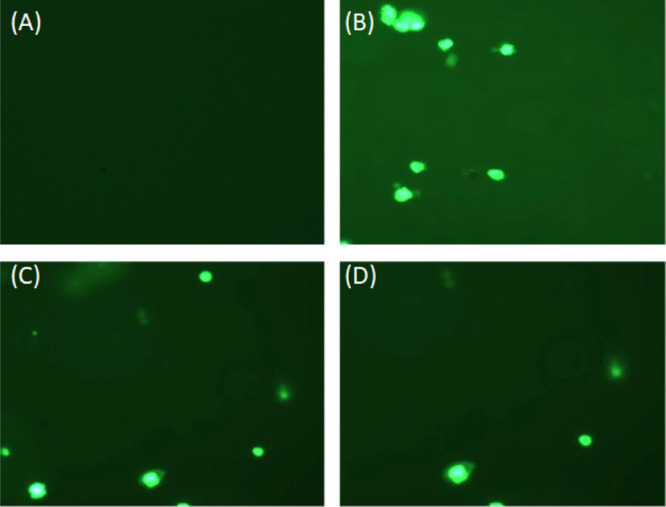
Intracellular production of ROS in lymphocytes. Representative fluorescent microscopic images of lymphocytes isolated from (A) normal rats, (B) diabetic rats, (C) diabetic rats treated with the lower dose of thiamine, and(D) diabetic rats treated with the higher dose of thiamine.
2.16. Histopathological Studies
The histopathological analysis of the liver (Figure 16A) and kidney (Figure 16B) isolated from the normal control, diabetic rats, and thiamine-supplemented diabetic rats suggested the accumulation of lipid droplets, increased fibrous content, destruction of the bile duct, and hepatocytic degeneration. On the contrary, in the kidneys, there was a significant thickening of the glomerular basement membrane, edema of the proximal convoluted tubule, hyaline deposition, degeneration of the distal convoluted tubule, and tubule–interstitial inflammation. All these pathological liver and kidney abnormalities were decreased significantly upon administering thiamine.
Figure 16.
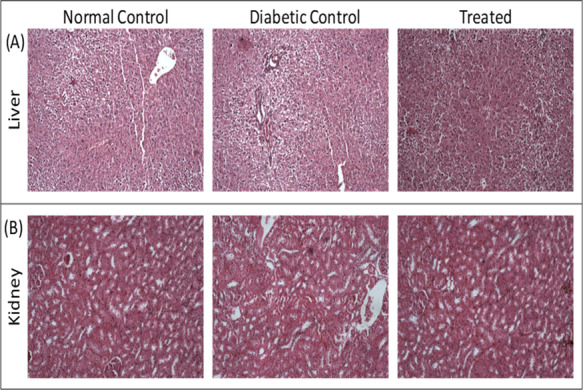
Histograms of the liver and kidney. Haematoxylin and eosin-stained sections of rat (A) liver and (B) kidney. Thiamine treatment is at 15 mg/kg body weight.
3. Conclusions
The present study targeted thiamine to inhibit glucose-induced glycation under in vitro conditions and diabetes in an animal model. After careful evaluation of the results, it was found that this member of the vitamin B complex was effective against various tested parameters. For antiglycation activity, thiamine was found to be most effective as it inhibited glucose-induced glycation. It was also proven to be most potent in modulating the FBG levels and controlling the hyperglycemic state in animal models in the best possible manner. Therefore, it is concluded that supplementation of thiamine will help diabetic subjects but with strict and proper monitoring of blood glucose levels.
4. Materials and Methods
4.1. Materials
Fatty acid and globulin-free HSA and 2,4,6-trinitrobenzene sulfonic acid (TNBSA) were obtained from Sigma-Aldrich, USA. Thiamine and 5,5-dithiobis(2-nitrobenzoic acid) were purchased from Sisco Research Laboratories, India. 2,4-dinitrophenylhydrazine was obtained from HiMedia Laboratories (India). All the other chemicals used were of analytical grade.
4.2. In Vitro Glycation of HSA
The glycation assay was performed under in vitro conditions as per previously published protocols.13
4.3. Glycation Assessment
The extent of glycation in protein samples was assessed using the modified nitro blue tetrazolium method with few modifications as described earlier.14
4.4. Fluorometric Analysis of AGEs
The protein samples were diluted to 3 μM in phosphate buffer to detect fluorescent AGEs and fluorescence emission. The profile was recorded using a RF-5301 spectrofluorometer, Shimadzu, Japan, as per previously published studies.12 The protein solutions were excited at 370 nm, and the fluorescent emission spectra were recorded in the 375–600 range. The silt width was kept at 5 nm for excitation and emission. The percent inhibition of fluorescent AGEs was determined from eq 1(6)
| 1 |
FIg, FIt, and FIn are fluorescent intensities of the glycated sample, thiamine-treated sample, and native HSA samples, respectively.
4.5. Estimation of Free Lysine
The relative amount of free lysine in glycated and thiamine-treated HSA was determined using TNBSA.15
4.6. Determination of the Secondary Structure of a Protein by Circular Dichroism
To study the effect of thiamine on the secondary motif of HSA, circular dichroism spectra of samples were recorded using a JASCO spectropolarimeter (J-815) as per previously published reports.16 The results presented are given as mean residue ellipticity (MRE) in deg cm2 dmol–1, which was determined using the following eq 2
| 2 |
where n is the number of amino acids, Cp is the concentration of the protein, and l is the path length of the cuvette. The amount of the α-helix was calculated from MRE values at 208 nm using eq 3.
| 3 |
where MRE208 is MRE at 208 nm, 4000 is the MRE of the random coil and β-form at 208 nm, and 33,000 is the MRE value of a pure α-helix at 208 nm.
4.7. Transmission Electron Microscopy
The transmission electron micrograph of native, glycated, and treated HSA was obtained using a transmission electron microscope (JOEL-2100, Tokyo, Japan) as per previously published studies.17
4.8. Inhibition of α-Glucosidase Activity
The α-glycosidase activity was determined using p-nitrophenyl d-glycopyranoside as the substrate, as described previously18 The product formed (p-nitrophenol) was determined spectrophotometrically at 405 nm. The concentration of p-nitrophenol was calculated using 17,800 M–1 cm–1 as a molar extinction coefficient.19
4.9. Molecular Docking
The AutoDock-vina program was used to perform molecular docking. This software has been reported to perform faster and more accurate docking calculations than AutoDock 4.20 The three-dimensional crystal structure of HSA was obtained from the RCSB Protein Data Bank [PDB: 1AO6]. All water molecules were deleted to avoid hindrance in docking. All the nonpolar hydrogen atoms were merged, and Kollman charges were added. The coordinate file was then saved into PDBQT format using MGL Tools-1.5.6.21 The size of the grid was set to 74 × 62 × 84 Å with a maximum spacing of 1 Å to cover the entire active-site residues. The center of the grid was at x = 29.535, y = 31.826, and z = 23.500. The 3D structure of thiamine was downloaded from https://pubchem.ncbi.nlm.nih.gov [CID: 1052] in SDF format. The ligand was made flexible and saved into PDBQT format. All other docking parameters are left as default. Postmodeling analysis was performed using PyMOL 2.0 and Discovery Studio 2017 R2 Client.
4.10. Ethical Approval
Ethical approval for using animals in experimental research was obtained from the Institutional Animal Ethics Committee of Department of Biochemistry, Faculty of Life Sciences, AMU, Aligarh, India (order no: D.no. 4165) authorized by the Ministry of Environment and Forests, Government of India, under registration no. 714/GO/Re/S/02/CPCSEA issued by CPCSEA.
4.11. Experimental Animals
6 month-old adult male Wistar rats (30), weighing 100–120 g, were obtained from the Animal Facility of Jamia Hamdard University, New Delhi, India. They were sheltered in wide cages and managed under the required sterile conditions as per the Departmental Experimental Research Ethical Committee’s guideline. Room temperature at 25 ± 2 °C and a 12 h day and night cycle were maintained. These rats were acclimatized on standardized dietary pellets and clean drinking water ad libitum for a week before the commencement of the experiment.
4.12. Diabetes Induction and Thiamine Treatment
Diabetes was induced by a single intraperitoneal dose of alloxan (120 mg/kg of body weight). Peripheral blood was withdrawn from the tail vein after 1 week, and the FBG level was examined by using an Accu-chek Active glucometer (Roche, Diagnostics GmbH, Germany). Animals with FBG levels of 250 mg/dL were considered to be diabetic. After the development of diabetes, the rats were randomly divided into groups for thiamine treatment for 30 days. Thiamine was dissolved in distilled water, and a dose of 10 and 15 mg/kg/day was prepared. Five groups, each consisting of six rats, were taken for the experiment. Group 1 consisted of normal healthy rats (control) maintained on a regular diet and water. Group 2 consisted of normal healthy rats and was given thiamine at a dose of 15 mg/kg body weight with a regular diet and water. Group 3 comprised diabetic rats fed with a normal diet and water (diabetic control). Group IV consisted of diabetic rats treated with thiamine at a dose of 10 mg/kg of body weight, and group-V, diabetic rats treated with thiamine at 15 mg/kg body weight.
4.13. Sample Preparation
After completing the experimental protocol, the rats of each group were starved overnight, and the next day, they were sacrificed by cervical prolapse. The blood samples (2–3 mL) were collected in sterilized centrifuge tubes and centrifuged at 1000g for 15 min, and serum was obtained. Immediately on the same day, the serum parameters were analyzed. The kidney, liver, and pancreas tissue samples were also stored in Hepes’s buffer at −20 °C for further use.
4.14. Isolation of Rat Peripheral Blood Lymphocytes
Blood (5 mL) was withdrawn from rats of all groups by cardiac puncture. The peripheral blood lymphocytes were isolated by diluting the blood in Ca2+- and Mg2+-free phosphate-buffered saline using Histopaque 1077. Isolated lymphocytes were used immediately. The trypan blue exclusion test checked the viability of lymphocytes before the start of the reaction.22
4.15. Estimation of FBG
Fasting glucose levels were checked by the glucose oxidase–peroxidase method using a Ranbaxy diagnostic kit. Insulin levels were approximated using a kit manufactured by Span Diagnostics Limited, India.
4.16. Oral Glucose Tolerance Test
After 30 days of treatment, OGTTs were performed on both diabetic and normal (control) rats. The animals were fasted overnight (12 h). Post fasting, they were administered an oral dose of 30% glucose solution. Blood samples were collected from the tail vein at 0, 30, 60, and 120 min after feeding and measured with an Accu-chek Active blood glucose meter (model: GU Accu-chek is a trademark Roche, Mannheim, Germany).
4.17. Glucose Metabolic Enzymes
4.17.1. Hexokinase Activity and Glucose-6-Phosphatase (G6Pase) Activity
The activity of enzyme hexokinase was measured using the method of Crane and Sols,23 which has been discussed in detail in previously published studies.24 The protocol given by Shull25 was followed for measuring the activity of G6Pase.
4.17.2. Fructose–Bisphosphatase Activity (FBPase)
The fructose–bisphosphatase activity was assessed by the protocol of Freedland and Harper26 and has been discussed in detail in previously published studies24
4.18. Estimation of Lipid Peroxidation
The lipid peroxidation was estimated following Buege and Aust27 by measuring the total malondialdehyde (MDA) yields. The level was expressed in n moles of MDA formed per mg of the protein using a molar extinction coefficient of 1.56 × 10⁻⁵/M/cm.
4.19. Lipid Profile
The serum lipid profile (total cholesterol, TG, and HDL-C) was determined on the day of sample collection using a semiautomated chemistry analyzer (Lab Life Chem Master, model no. BTR-830).
4.20. Estimation of the Kidney-Function Marker
Urea as a kidney-function marker was estimated using a commercially available kit (Span Diagnostics Limited, India); the urea concentration was indicated in mg/dL of the serum.
4.21. Estimation of Liver-Function Markers
4.21.1. AST or Glutamate Oxaloacetate Transaminase
Glutamate oxaloacetate transaminase (GOT) was estimated following the method proposed by Reitman and Frankel28 using a commercially available kit (Span Diagnostics Limited, India). The activity of GOT was expressed in units/mL.
4.21.2. Glutamate Pyruvate Transaminase or ALT
Glutamate pyruvate transaminase (GPT) was estimated using a commercially available kit (Span Diagnostics Limited, India) based on the protocol of Reitman and Frankel 28The activity of GOT was expressed in units/mL of the sample.
4.21.3. Alkaline Phosphatase
The ALP activity was determined by King and King’s method29 using a commercial kit (Span Diagnostics Limited, India).
4.22. Histopathological Studies
The liver and kidney tissues obtained from thiamine-treated and untreated rats were washed with chilled saline and fixed in 10% formalin in separate vials. Fixed tissue blocks (10 × 5 × 3 mm) were embedded in paraffin. Serial sections (5 mm thick) were cut, deparaffinized, and stained with hematoxylin and eosin for histological examination. Stained slides were studied with an Olympus BX40 Japan microscope by a pathologist unaware of the treatment to assess the degree of damage to the liver and kidney.
4.23. Statistical Analysis
Various groups were compared, and statistical significance was determined by Students’ t-test using Microsoft Excel 2016. p-Value ≤ 0.05 was considered to be statistically significant. All data are expressed as mean ± SD for all continuous variables. The experiments were repeated at least thrice to check the reproducibility of the results..
Acknowledgments
The authors are highly grateful to Aligarh Muslim University for providing the necessary facilities. K.M.A. is also indebted to Jain University.
A.S. is highly grateful to the Centre of Medical and Bio-Allied Health Sciences Research, Ajman University, for providing the same.
The authors declare no competing financial interest.
References
- Lupascu F. G.; Giusca S.-E.; Caruntu I.-D.; Anton A.; Lupuşoru C. E.; Profire L. The safety profile of new antidiabetic xanthine derivatives and their chitosan based formulations. Eur. J. Pharm. Sci. 2019, 127, 71–78. 10.1016/j.ejps.2018.10.015. [DOI] [PubMed] [Google Scholar]
- Lin C.-H.; Shih Z.-Z.; Kuo Y.-H.; Huang G.-J.; Tu P.-C.; Shih C.-C. Antidiabetic and antihyperlipidemic effects of the flower extract of Eriobotrya japonica in streptozotocin-induced diabetic mice and the potential bioactive constituents in vitro. J. Funct. Foods 2018, 49, 122–136. 10.1016/j.jff.2018.08.005. [DOI] [Google Scholar]
- Kanter M.; Aktas C.; Erboga M. Protective effects of quercetin against apoptosis and oxidative stress in streptozotocin-induced diabetic rat testis. Food Chem. Toxicol. 2012, 50, 719–725. 10.1016/j.fct.2011.11.051. [DOI] [PubMed] [Google Scholar]
- Shoorei H.; Khaki A.; Khaki A. A.; Hemmati A. A.; Moghimian M.; Shokoohi M. The ameliorative effect of carvacrol on oxidative stress and germ cell apoptosis in testicular tissue of adult diabetic rats. Biomed. Pharmacother. 2019, 111, 568–578. 10.1016/j.biopha.2018.12.054. [DOI] [PubMed] [Google Scholar]
- Landrault N.; Poucheret P.; Azay J.; Krosniak M.; Gasc F.; Jenin C.; Cros G.; Teissedre P.-L. Effect of a polyphenols-enriched chardonnay white wine in diabetic rats. J. Agric. Food Chem. 2003, 51, 311–318. 10.1021/jf020219s. [DOI] [PubMed] [Google Scholar]
- Abdullah K. M.; Qais F. A.; Ahmad I.; Naseem I. Inhibitory effect of vitamin B3 against glycation and reactive oxygen species production in HSA: An in vitro approach. Arch. Biochem. Biophys. 2017, 627, 21–29. 10.1016/j.abb.2017.06.009. [DOI] [PubMed] [Google Scholar]
- Shamsi A.; Ahmed A.; Khan M. S.; Al Shahwan M.; Husain F. M.; Bano B. Understanding the binding between Rosmarinic acid and serum albumin: In vitro and in silico insight. J. Mol. Liq. 2020, 311, 113348. 10.1016/j.molliq.2020.113348. [DOI] [Google Scholar]
- Ciszak E. M.; Korotchkina L. G.; Dominiak P. M.; Sidhu S.; Patel M. S. Structural basis for flip-flop action of thiamin pyrophosphate-dependent enzymes revealed by human pyruvate dehydrogenase. J. Biol. Chem. 2003, 278, 21240–21246. 10.1074/jbc.m300339200. [DOI] [PubMed] [Google Scholar]
- Thornalley P. J.; Babaei-Jadidi R.; Al Ali H.; Rabbani N.; Antonysunil A.; Larkin J.; Ahmed A.; Rayman G.; Bodmer C. W. High prevalence of low plasma thiamine concentration in diabetes linked to a marker of vascular disease. Diabetologia 2007, 50, 2164–2170. 10.1007/s00125-007-0771-4. [DOI] [PMC free article] [PubMed] [Google Scholar]
- Olsen B. S.; Hahnemann J. M.; Schwartz M.; Østergaard E. Thiamine-responsive megaloblastic anaemia: a cause of syndromic diabetes in childhood. Pediatr. Diabetes 2007, 8, 239–241. 10.1111/j.1399-5448.2007.00251.x. [DOI] [PubMed] [Google Scholar]
- Berrone E.; Beltramo E.; Solimine C.; Ape A. U.; Porta M. Regulation of intracellular glucose and polyol pathway by thiamine and benfotiamine in vascular cells cultured in high glucose. J. Biol. Chem. 2006, 281, 9307–9313. 10.1074/jbc.m600418200. [DOI] [PubMed] [Google Scholar]
- Shamsi A.; Ahmed A.; Khan M. S.; Husain F. M.; Bano B. Rosmarinic acid restrains protein glycation and aggregation in human serum albumin: multi spectroscopic and microscopic insight-possible therapeutics targeting diseases. Int. J. Biol. Macromol. 2020, 161, 187–193. 10.1016/j.ijbiomac.2020.06.048. [DOI] [PubMed] [Google Scholar]
- Qais F. A.; Alam M. M.; Naseem I.; Ahmad I. Understanding the mechanism of non-enzymatic glycation inhibition by cinnamic acid: an in vitro interaction and molecular modelling study. RSC Adv. 2016, 6, 65322–65337. 10.1039/c6ra12321j. [DOI] [Google Scholar]
- Iqbal S.; Qais F. A.; Alam M. M.; Naseem I. Effect of glycation on human serum albumin–zinc interaction: a biophysical study. J. Biol. Inorg. Chem. 2018, 23, 447–458. 10.1007/s00775-018-1554-8. [DOI] [PubMed] [Google Scholar]
- Kakade M. L.; Liener I. E. Determination of available lysine in proteins. Anal. Biochem. 1969, 27, 273–280. 10.1016/0003-2697(69)90032-3. [DOI] [PubMed] [Google Scholar]
- Shamsi A.; Ahmed A.; Bano B. Probing the interaction of anticancer drug temsirolimus with human serum albumin: Molecular docking and spectroscopic insight. J. Biomol. Struct. Dyn. 2018, 36, 1479–1489. 10.1080/07391102.2017.1326320. [DOI] [PubMed] [Google Scholar]
- Shamsi A.; Shahwan M.; Husain F. M.; Khan M. S. Characterization of methylglyoxal induced advanced glycation end products and aggregates of human transferrin: biophysical and microscopic insight. Int. J. Biol. Macromol. 2019, 138, 718–724. 10.1016/j.ijbiomac.2019.07.140. [DOI] [PubMed] [Google Scholar]
- Taslimi P.; Gulçin İ. Antidiabetic potential: In vitro inhibition effects of some natural phenolic compounds on α-glycosidase and α-amylase enzymes. J. Biochem. Mol. Toxicol. 2017, 31, e21956 10.1002/jbt.21956. [DOI] [PubMed] [Google Scholar]
- Yasmeen S. Biophysical insight into the binding of triprolidine hydrochloride to human serum albumin: Calorimetric, spectroscopy and molecular docking approaches. J. Mol. Liq. 2017, 233, 55–63. 10.1016/j.molliq.2017.02.099. [DOI] [Google Scholar]
- Pandya P.; Agarwal L. K.; Gupta N.; Pal S. Molecular recognition pattern of cytotoxic alkaloid vinblastine with multiple targets. J. Mol. Graph. Model. 2014, 54, 1–9. 10.1016/j.jmgm.2014.09.001. [DOI] [PubMed] [Google Scholar]
- Morris G. M.; Goodsell D. S.; Halliday R. S.; Huey R.; Hart W. E.; Belew R. K.; Olson A. J. Automated docking using a Lamarckian genetic algorithm and an empirical binding free energy function. J. Comput. Chem. 1998, 19, 1639–1662. . [DOI] [Google Scholar]
- Kim H. H.; Kang Y.-R.; Lee J.-Y.; Chang H.-B.; Lee K. W.; Apostolidis E.; Kwon Y.-I. The postprandial anti-hyperglycemic effect of pyridoxine and its derivatives using in vitro and in vivo animal models. Nutrients 2018, 10, 285. 10.3390/nu10030285. [DOI] [PMC free article] [PubMed] [Google Scholar]
- Crane R. K.; Sols A. The association of hexokinase with particulate fractions of brain and other tissue homogenates. J. Biol. Chem. 1953, 203, 273–292. 10.1016/s0021-9258(19)52639-4. [DOI] [PubMed] [Google Scholar]
- Alam M. M.; Meerza D.; Naseem I. Protective effect of quercetin on hyperglycemia, oxidative stress and DNA damage in alloxan induced type 2 diabetic mice. Life Sci. 2014, 109, 8–14. 10.1016/j.lfs.2014.06.005. [DOI] [PubMed] [Google Scholar]
- Shull K. H.; Ashmore J.; Mayer J. Hexokinase, glucose-6-phosphatase and phosphorylase levels in hereditarily obese-hyperglycemic mice. Arch. Biochem. Biophys. 1956, 62, 210–216. 10.1016/0003-9861(56)90104-7. [DOI] [PubMed] [Google Scholar]
- Freedland R. A.; Harper A. E. Metabolic adaptations in higher animals. 5. The study of metabolic pathways by means of metabolic adaptation. J. Biol. Chem. 1959, 234, 1350–1354. 10.1016/s0021-9258(18)70010-0. [DOI] [PubMed] [Google Scholar]
- Buege J.; Aust S.. Microsomal lipid peroxidation. In Packer Leds Methods in Enzymelogy; Fleischer S., Ed.; Academic Press: London, 1978. [DOI] [PubMed] [Google Scholar]
- Reitman S.; Frankel S. A colorimetric method for the determination of serum glutamic oxalacetic and glutamic pyruvic transaminases. Am. J. Clin. Pathol. 1957, 28, 56–63. 10.1093/ajcp/28.1.56. [DOI] [PubMed] [Google Scholar]
- Kind P. R. N.; King E. J. Estimation of plasma phosphatase by determination of hydrolysed phenol with amino-antipyrine. J. Clin. Pathol. 1954, 7, 322. 10.1136/jcp.7.4.322. [DOI] [PMC free article] [PubMed] [Google Scholar]


