Abstract
Reservoir rock wettability has been linked to the adsorption of crude fractions on the rock, with much attention often paid to the bulk mineralogy rather than contacting minerals. Crude oil is contacted by different minerals that contribute to rock wettability. The clay mineral effect on wettability alterations is examined using the mineral surface charge. Also, the pH change effect due to well operations was investigated. Clay mineral surface charge was examined using zeta potential computed from the particle electrophoretic mobility. Clay minerals considered in this study include kaolinite, montmorillonite, illite, and chlorite. Results reveal that the clay mineral charge development is controlled by adsorption of ionic species and double layer collapse. Also, clay mineral surface charge considered in this study shows that their surfaces become more conducive for the adsorption of hydrocarbon components due to the presence of salts. The salt effect is greater in the following order: NaHCO3 < Na2SO4 < NaCl < MgCl2 < CaCl2. Furthermore, different well operations induce pH environments that change the clay mineral surface charge. This change results in adsorption prone surfaces and with reservoir rock made up of different minerals, and the effect of contacting minerals is critical as shown in our findings. This is due to the contacting mineral control wettability rather than the bulk mineralogy.
1. Introduction
Asphaltene is the most polar crude oil fraction and has been a cause for concern due to its precipitation and deposition in the reservoir.1 Asphaltene deposition in petroleum reservoirs has been a great concern in industry and academia due to the enormous impact it has on crude oil production. This is due to the mystery that surrounds its deposition in fields that are considered safe from asphaltene problems.2 Some other fields that have high-asphaltene-content crude oil and that are expected to pose production challenges are still free of deposition, which then begs the question of what mechanism of phenomena is responsible for asphaltene deposition. Identified production impairment mechanisms due to asphaltene include wettability and permeability alterations where the most dominant is wettability alterations because of asphaltene molecule adsorption on the rock surface.3−5 Different minerals that make up the reservoir rocks have their properties dependent on chemical foundation, geometric arrangements of ions and atoms, and the electrical forces that bind them together.6 These minerals and clays hold properties (surface charges) that are affected by the pH of the environment and the interactions that they undergo.7 More so, the electrokinetic and chemical properties of these minerals and clays in aqueous solutions such as reservoir brine are significant in demystifying inorganic and organic species adsorption mechanisms at interfaces.8
Asphaltene deposition and adsorption due to fluid–fluid interaction are well documented in the literature;6,9−13 however, scarce in the literature is the clay mineral effect on asphaltene molecule adsorption. The influence of rock minerals on asphaltene adsorption is a subject in another publication of ours;14 however, of concern in this paper are the contributions and influence of clay minerals in asphaltene adsorption. Sandstone is said to be predominantly quartz, and often, when researchers address sandstone, reference is made to quartz. Interestingly, sandstone has a negative surface charge owing to factors such as pH, fluid ionic strength, composition, and concentration and so does asphaltene molecule. Thus, this begs the question of why asphaltene adsorbs on sandstone if they have a similar charge type. It is upon this question that this research work stands as we believe asphaltene deposition and adsorption occur in sandstone formations because quartz is not the only crude contacting mineral in the rock. More so, clay minerals are believed to be detrimental to the reservoir because they plug the pore throat in the form of bridges, films, and plates, thus reducing the reservoir quality.15 Furthermore, the presence of clay minerals do not only provide a large surface area for molecular adsorption but also aid accelerated porosity loss in limestone formation. So, since sandstone does have clays and other minerals like the iron minerals (pyrite, magnetite, hematite, and ankerite),14 these minerals could be the contacting minerals that provide the adsorption prone surface for asphaltene deposition and wettability alteration; thus, we seek to understand the behavior of clay minerals in different pH environments to provide insight into their contribution to the asphaltene adsorption problem.
Clays are hydrous aluminum silicates with a sheet-like structure and small particle size that provides a surface area that contains a significant amount of alkaline earth or alkali metals and iron.16 Clays can be generally classified into three-layer types depending on the number and arrangements of tetrahedral and octahedral sheets in their structure, which further separates into five groups (chlorite, fine-grained mica, kaolinite, smectite, and vermiculite) based on their net charges.6 The kaolinite group with the formula Al2Si2O5(OH)4 has three members, which are kaolinite, nacrite, and dickite, whereas the illite group has the formula (K, H) Al2(Si, Al)4O10(OH)2. XH2O is represented by the mineral illite and has a structure similar to montmorillonite.17 The chlorite group is often not considered as clay but a separate phyllosilicate group, which has members such as chamosite, mesite, daphnite, and cookeite with varying structures and formula.18
Several literature works exist on clay surface chemistry.15,16,19−22 Avadiar et al.23 reported the pH dependence of the kaolinite alumina, silica sheet, and edge charges via ζ-potential (ZP) measurements. The authors concluded that the charge development of kaolinite is controlled by the silica sheet due to the low charge density on the alumina sheet. However, only the effect of cations was investigated. Chorom and Rengasamy24 investigated the pH effect and electrolyte concentration of illite, kaolinite, and smectite in a flocculation process using ζ-potential measurements. The authors observed that the percentage of clay dispersion exhibited a positive correlation with the solution pH but differed from clay to clay.
Electrochemical properties of illite have been long investigated with the charge development of illite clay attributed to the adsorption of H+/OH– ions on the mineral surface. However, studies25,26 have not reported illite clay surface charge due to salt interactions. Chlorite clay mineral kinetics and dissolution have been inferred to be due to Al3+ and H+ concentrations.27 Similarly, Gustafsson and Puigdomenech28 reported the chlorite dissolution rate at 25 °C using kinetic experiments. The minimum dissolution rates were observed at neutral pH, which agrees with reports by Jones,29 Silvester et al.,30 and Pan et al.31 Thus, to foresee conditions that promote adsorption on clay minerals owing to surface charge, their interactions need to be further studied.
Rock surface charge and its wettability have been correlated with ζ-potential, with the wettability predominantly determined via contact angle measurements.32 The ζ-potential value indicates the nature (positive or negative) of the surface charge as well as particle stability in a medium. It is the potential at the shear plane of the electric double layer and is related to the thickness of the double layer. It also indicates the charge at the interface between the mineral and its surrounding medium; thus, a ζ-potential change quantitatively represents a change in surface wettability and charge.33−35 So, water wetting surfaces possess highly negative ζ-potential values, whereas oil wetting surfaces have low negative and positive ζ-potential values.33 This is due to interactions and adsorption of ionic species on mineral surfaces.15
Since reservoir rocks contain clays that may be contacting minerals to the crude oil and have their surface chemistry dependent on reservoir conditions (brine composition and pH), it is imperative to understand the dynamics of such interactions. Clay minerals in different environments possess different surface chemistry (charge) due to electrostatic interaction or dissolution of ions. The surface charge of the clay minerals and the fact that they provide a large surface area make them susceptible to adsorption by polar constituents of the crude oil. Different well operations, which include drilling, waterflooding, gas, and surfactant injection, have the potential to change the surface chemistry of clays present in the reservoir. For adsorption to occur, the clays and the polar crude oil constituents must possess opposite charges, with charge reversal reported in the literature.36 Thus, this paper aims to establish the effect of pH on the surface charge development of clays as well as identify conditions that could induce asphaltene adsorption to clay minerals via measurement of the clay particles’ electrophoretic mobility.
2. Results and Discussion
2.1. X-ray Diffraction
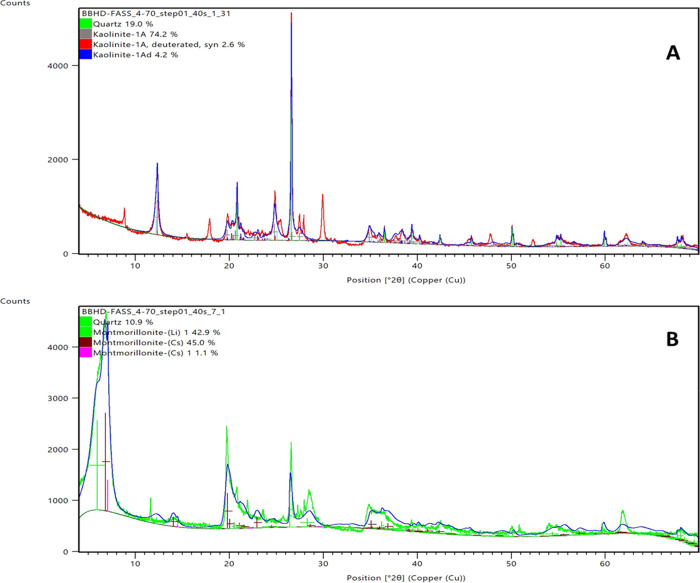
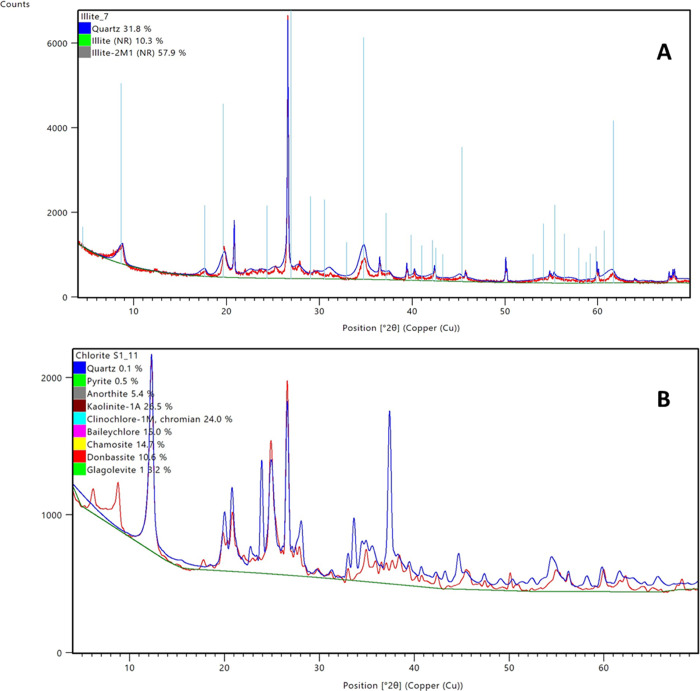
X-ray diffraction (XRD) analysis was conducted to ascertain the purity of the clay samples as natural samples have the presence of other crystalline phases. Mineral particle X-ray diffractograms were matched using the International Center for Diffraction Database (PDF-4 + 2021), with the data fitted using Rietveld. Figures 1–4 show the diffractogram data of all the crystalline phases present in the samples analyzed; thus, the lines represents peaks. Figure 1 shows the result of kaolinite (a) and montmorillonite clays (b), and from the XRD results, other crystalline phases exist. For the kaolinite sample (Figure 1A), peaks of different structural kaolinite (81%) and quartz (19%) are identified, which is a characteristic of natural clay samples. Figure 1B, which presents the XRD of montmorillonite, reveals that the sample contains 10.9% quartz and 89.9% montmorillonite. Like the kaolinite samples, different structural monoclinic montmorillonites exist. Figure 2 shows the XRD peaks of illite (Figure 2A) and chlorite (Figure 2B) samples with the illite sample having 31% quartz and 68.2% illite of different structural configuration. Figure 2B shows the different peaks depicting the chlorite mineral composition, which has varying percentages of quartz, pyrite, anorthite, kaolinite, clinochlore, baileychlore, chamosite, donbassite, and glagolevite.
Figure 1.
X-ray diffractograms showing crystalline phases present in samples. (a) Kaolinite and (b) montmorillonite.
Figure 4.
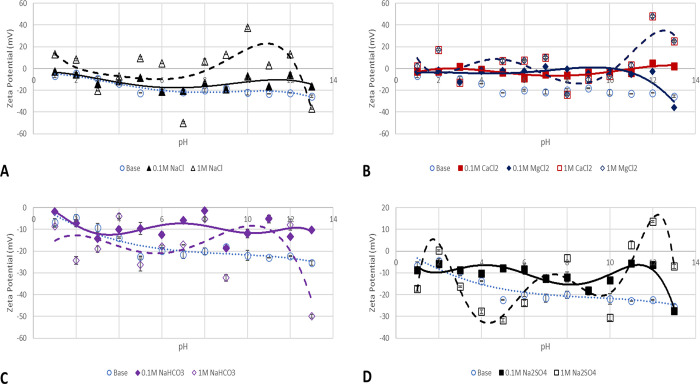
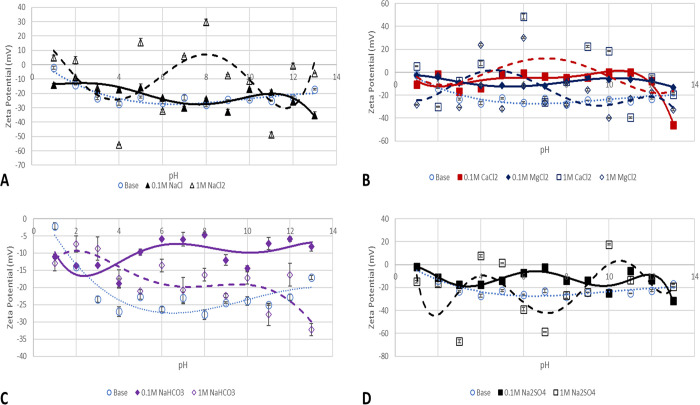
ZPs of kaolinite particles in salt solutions of 0.1 (continuous line) and 1 M (broken line). (A) NaCl effect, (B) CaCl2 and MgCl2 effect, (C) NaHCO3, and (D) Na2SO4 effect.
Figure 2.
X-ray diffractograms showing crystalline phases present in samples. (a) Illite and (b) chlorite.
2.2. ζ-Potential Measurement
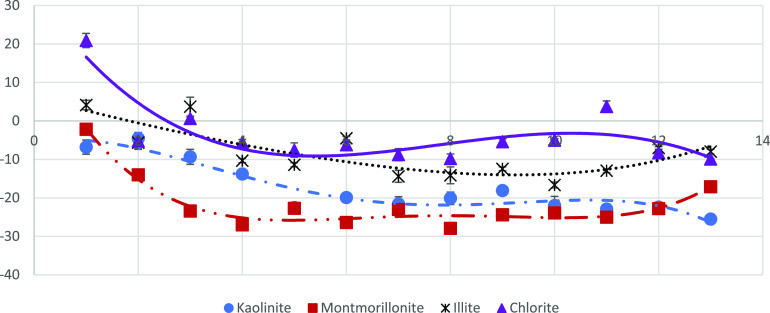
Figure 3 shows the base case ζ-potential values for the clay minerals studied. The base case represents the ζ-potential values without salt interactions for kaolinite, montmorillonite, illite, and chlorite clays. An all negative ζ-potential value for kaolinite clay without salt interactions is observed, with the suspended particles having an approximately −22 mV ζ-potential between pH of 5 to 13. A decrease in ζ-potential is observed in the acidic pH region with a decrease in pH and can be attributed to H+ adsorption on the interlayer hydroxyl group on the mineral lattices. On the other hand, an increase in the ζ-potential value is observed in the alkaline pH region with an increase in pH from 12 to 14; however, this is due to the presence of OH– as pH increases. This observation is congruent with a report by Tomb́cz and Szekeres,37 who studied the surface charge development of kaolinite and montmorillonite. Furthermore, the charge development of kaolinite is complicated by its nonuniform surface charge densities due to its anisotropic features and with the kaolinite basal plane having a permanent negative charge. The permanent negative charge is attributed to the isomorphous substitution (Al3+ for Si4+ and Mg2+ for Al3+) in the silica tetrahedral and the alumina octahedra, respectively. The only pH-dependent effect on the surface charge is at the edges, which can carry a positive or negative charge. Thus, the pH effect observed at pH values of 1 to 3 is due to edge charge development, whereas at the alkaline region, it is dominated by the basal charge.38
Figure 3.
Base case ZPs for kaolinite, montmorillonite, illite, and chlorite.
The face charge of montmorillonite clay like kaolinite is independent of pH, whereas the edge surface charge is pH-dependent and arises due to broken and hydrolyzed Al–O and Si–O bonds.22 The base case (Figure 3), which presents montmorillonite particles in buffer solutions of varying pH without salt interaction, shows an all negative surface charge. An average ζ-potential value of −25 mV is observed at pH 4–11, which can be attributed to the dominant face charge effect, whereas in the extreme pH (1–4 and 12–13) conditions, the effect of the edge charge development is pronounced. The effect of adsorption of the H+ ion is seen in the extreme acidic pH region; however, double layer collapse is observed at the extreme alkaline pH values due to an increase in the OH– ion charge density because of the pH increase. On the other hand, low negative ζ-potential is observed at low pH owing to H+ adsorption.39 The illite clay base case trend (Figure 3) shows a ζ-potential reduction at the acidic pH region with a positive surface charge at pH 1 due to H+ adsorption on the mineral surface. At the alkaline pH region (pH 10–13), reduction in the ζ-potential value is due to double-layer compression owing to the OH–.
The surface charge of the chlorite particle stems from the permanently charged basal plane and the amphoteric edges whose charges are pH-dependent.30 So, the net charge of the chlorite particle depends on the edge/face ratio, the pH of the solution, and the adsorption of ions. The basal line possesses a permanent negative charge, which is unaffected by medium pH and due to substitution (Al3+ for Si4+). However, modification is possible via cation adsorption. The edges are amphoteric, permitting positive and negative charge formation. The chlorite particle base case ζ-potential (Figure 3), which depicts chlorite ζ-potential with no salt interactions, shows a decreased value in both the acidic and alkaline pH regions. This is due to the release of Mg and Si at acidic pH values and release of Si and Fe at alkaline pH values. At the neutral pH range, only Si is released; thus, the constant ζ-potential value is observed. These observations suggest instability of the chlorite particle in acidic media and agree with the report of Gustafsson and Puigdomenech,28 who investigated the pH dependence of chlorite charge using inductively coupled plasma emission spectroscopy normalized to the Brunauer–Emmett–Teller (BET) surface area.
Furthermore, chlorite dissolution is controlled by the silica dissolution regime, which is a function of H+ and Al3+ concentrations.27 Dissolution of chlorite in buffer solutions is a function of the solution pH, and as reported, the product of this dissolution contains ions such as Mg, Si, Al, and Fe. Furthermore, the dissolution of chlorite is a protonation reaction that attacks the lattice aluminum–oxygen bonds to release Al3+, leaving a hydrolyzed silica surface whose rate of dissolution decreases with increasing pH up to pH 7 and thereafter increases afterward.
2.2.1. Effect of Salt Interactions
Reservoir rock mineral surface charges are significantly affected by the presence of ionic species that adsorb on their surfaces.14 These ionic species are from the reservoir brine, which has a varying concentration of ions with the propensity to adsorb on the clay mineral surface. The effect of 0.1 and 1 M salt concentrations is investigated to ascertain the degree of influence on clay mineral charge development. The effects of 0.1 and 1 M salt concentrations are represented by solid and broken lines, respectively.
2.2.1.1. Kaolinite
Figure 4 shows the experimentally measured values of kaolinite particles’ ζ-potential in a medium of pH 1–13 as well as the effect of the salt solution concentration. Figure 4–DA presents the effect of NaCl, CaCl2 and MgCl2, NaHCO3, and Na2SO4 salts of 0.1 and 1 M concentrations, respectively. The effect of 0.1 M NaCl solution (solid line) is depicted in Figure 4A, and a reduction in ζ-potential values is recorded; however, the surface charge remains all negative. A similar trend of ζ-potential values is recorded with the kaolinite base case (Figure 3) around the acidic pH region; however, at the alkaline pH region, the wave-like pattern of the increase and decrease in ζ-potential can be attributed to competing edge and basal charges due to the H+/Na+ exchange effect with the formation of either Na+–OH– or H+–OH– bonds at the edges. Generally, the introduction of the NaCl salt solution compromises the stability of the colloids using a stability criterion of −30 mV. In the base case, particles can be said to be stable at pH values of 5 to 13; however, a significant reduction is observed with the introduction of 0.1 M NaCl solution. This effect is what results in the precipitation of kaolinite from feldspar minerals.40
The effect of 0.1 M divalent cations on kaolinite surface charge is depicted in Figure 4B, and as can be observed, low values result in due to the substitution of the divalent cations (Ca and Mg) in the lattice. This observation agrees with the conclusions of Bolland,41 who reported that the variation of surface charge of kaolinite as a function of pH is due to cation substitution in the lattice and not the pH as many would assume. More so, it is not due to the oxide-like charge on the kaolinite surface. Furthermore, this mechanism does not only reduce the ζ-potential values to near zero but also compromises the kaolinite particle colloidal stability, which may result in the development of adsorption-prone surfaces for polar components of crude oil (asphaltene and resin). Charge reversal is observed at the alkaline pH region for 0.1 M CaCl2 (pH 11–13) and is due to double-layer collapse. This is due to the hydrolysis of ions or the double layer collapse around the particles. At a pH of 13, an increase in the colloidal stability of the particles (−35 mV) is observed, which is congruent with the report by Lauzon,21 who investigated the effect of CaCl2 and AlCl3 on montmorillonite and kaolinite using electrophoresis. The author highlighted that in the case of steric stabilization, ζ-potential does not correlate with colloidal stability measurement. This means that across all pH, due to the low negative ζ-potential values, the surface of kaolinite presents an oil-wet surface even though the surface has mostly negative surface charge.42
Figure 4C,D presents the effect of 0.1 M salt solutions of NaHCO3 and Na2SO4, respectively, on kaolinite clay minerals, and as can be observed, they both have similar trend patterns, which could mean that the same mechanism acts on the suspended particles. The wave-like pattern, which repeats cross the pH, can be attributed to competing mechanisms of adsorption of the HCO3– and SO42– on the surface with the presence of H+ and OH– as well as the double-layer collapse around the particle. Also, the screening effect of the positively charged edges relative to the negatively charged faces of the kaolinite could be responsible for the observed trend. Generally, the presence of the HCO3– and SO42– ions did not improve the colloidal stability of kaolinite particles.
The effect of an increase in the salt solution ionic strength is depicted in Figure 4 with broken lines. As clearly seen from Figure 4A, charge reversal from negative to positive is observed and can be attributed to Na+ adsorption on the surface. Similar charge reversal and near-zero ζ-potential values are recorded in the case of 1 M salt solutions of CaCl2 and MgCl2 (Figure 4B), with an almost insignificant difference in the case of 0.1 and 1 M salt solutions of Na2SO4 and NaHCO3 (Figure 4C,D, respectively). The divalent ion (Mg2+ and Ca2+) effect on kaolinite surface charge is predominantly controlled by the silica sheets compared to the alumina sheets.23 This is evident in the ζ-potential-pH and yield stress-pH trend reported by Lauzon.21 To corroborate our observation of an oil wetting and adsorption prone kaolinite surface due to pH and salt interactions, Unal et al.43 investigated the effect of clay types (illite and kaolinite) on asphaltene deposition in the steam-assisted gravity drainage process of bitumen extraction and asserted that the reduction in oil production recorded was due to the change in wettability of the surfaces owing to the presence of kaolinite clay.
2.2.1.2. Montmorillonite
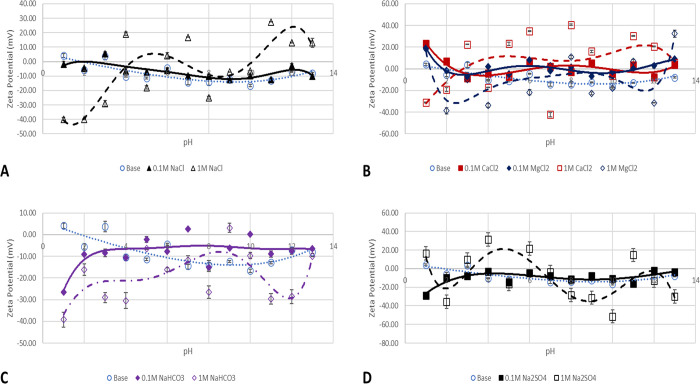
Salt effects on the ζ-potential values of montmorillonite particles are depicted in Figure 5. A little reduction in the ζ-potential value is observed due to the introduction of NaCl solution at pH 1–9, depicted in Figure 5A (solid line). However, between pH 9 and 10, double later compression is observed owing to OH– as pH increases. Thereafter, the adsorption of the OH– on the surface increases the ζ-potential value and colloidal stability. Reduction in colloidal stability of the montmorillonite is observed due to adsorption of divalent cations (Figure 5B). This results in near-zero ζ-potential and the development of an adsorption-prone surface, which would promote wettability alteration.44 Contrary to the observation of oil wetness of montmorillonite, Hoxha et al.42 asserted that montmorillonite possesses water wet characteristics that are congruent with our base case without salt interactions; however, in the presence of divalent cations, this argument of water wetness may not hold as depicted in Figure 5B. The effect of NaHCO3 and Na2SO4 is depicted in Figure 5C,D, respectively. The figures show wave-like pattern adsorption of H+ at acidic pH regions and the double layer collapse between pH 4 and 7, thereafter competing for adsorption of OH– and the HCO3– and SO42– results in negative ζ-potentials and reversal due to double-layer compression.
Figure 5.
ZPs of montmorillonite particles in salt solutions of 0.1 (continuous line) and 1 M (broken line). (A) NaCl effect, (B) CaCl2 and MgCl2 effect, (C) NaHCO3, and (D) Na2SO4 effect.
The effect of the salt solution ionic strength increase on the montmorillonite particle ζ-potential is shown in Figure 5 (broken lines), with the H+ ion adsorption and double layer collapse mechanisms dominant in the NaCl effect (Figure 5A). Divalent cations (Figure 5B) show the more pronounced effect of charge adsorption and result in a positive surface. However, the adsorption of NaHCO3 (Figure 5C) results in a somewhat constant negatively charged surface across all pH values. The ζ-potential change in the case of Na2SO4 (Figure 5D) is more pronounced with adsorption and charge reversal resulting in positive surface charges. So, generally, charge development of montmorillonite can be said to be due to the charge shielding effect, and the adsorption of cations on its surface results in its colloidal destabilization due to extensive and strong interparticle bridging in the montmorillonite particle.45 In other words, montmorillonite has a pH-dependent charge due to proton adsorption/desorption on the hydroxyl groups and a structural charge resulting from isomorphous substitution in the clay structure, thus resulting in negative electrophoretic mobility and cation exchange properties.46 Cation adsorption is due to the formation of covalent bonds with functional groups on the edges or electrostatic attractions on the basal planes.
2.2.1.3. Illite
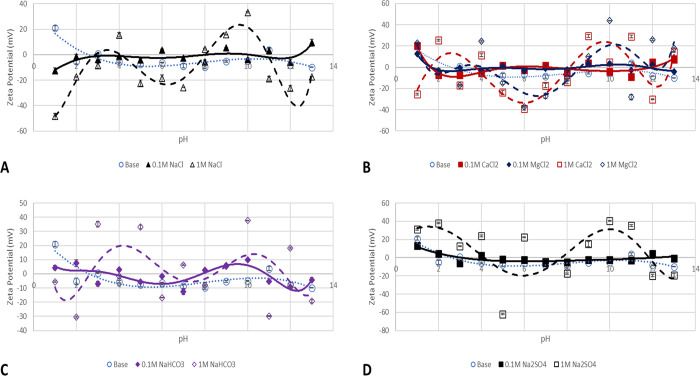
Illite particle ζ-potential values in salt solutions of 0.1 (solid lines) and 1 M (broken lines) ionic solutions are shown in Figure 6. A similar mechanism of H+/OH– controlled charge development is observed in the case of NaCl (Figure 6A) but with lower ζ-potential values than the illite particle base case (Figure 3). Figure 6B (solid lines), which presents the effect of 0.1 M divalent cations (Ca and Mg) on the illite particle surface charge development, reveals the dominance of Ca and Mg ion adsorption over H+/OH– ions, which result in near zero and positive surface charges at alkaline and acidic pH regions, respectively.
Figure 6.
ZPs of illite particles in salt solutions of 0.1 (continuous line) and 1 M (broken line). (A) NaCl effect, (B) CaCl2 and MgCl2 effect, (C) NaHCO3, and (D) Na2SO4 effect.
Even though the adsorption of HCO3– and SO42– ions (Figure 6C,D) on the illite surface resulted in an all negative surface charge across all pH, the colloidal stability is still a concern except for a pH value of 1 where stability is observed. Thus, generally, the surface charge of illite particles is dependent on the adsorption/desorption of H+ and OH– as well as the presence of cations in the solution resulting in different PZCs with different ions.25 Thus, the notion that silicate groups (quartz, feldspar, illite, and smectite) are all water-wet as claimed by Hoxha et al.42 is misleading especially with interactions with divalent and trivalent cations.
The effect of an increase in the salt solution ionic strength is depicted by broken lines in Figure 6A–D. The effect of 1 M NaCl salt solution depicted in Figure 6A is dominated by the double-layer collapse in both acidic and alkaline pH regions as a decrease in pH in the acidic region (pH 1–5) results in negative surface charges and an increase in pH (pH 8–11) results in positive surface charges. This is due to an increase in H+ and OH– change densities at acidic and alkaline pH, respectively. So, pH (1–3) with high negative ζ-potential values can be said to be water wet surfaces, whereas the remaining pH (4–13) where low negative or positive ζ-potential is observed would be oil-wet. Divalent cation adsorption depicted in Figure 6B presents a more oil-wet prone surface due to the positive surface charges exhibited at these pH values, and even though colloidal stability is improved in some pH (1, 6, 7, and 8), in the case of CaCl2, their propensity to adsorb polar fractions is still a concern. Furthermore, in the case of CaCl2, around neutral pH, the illite surface is water wet, which may be the observation reported by Hoxha et al.42 Sodium bicarbonate salt solution (Figure 6C) results in an all negative surface charge due to HCO3– adsorption on the illite surface, whereas a more drastic behavior dominated by the collapse of the double layer is observed for Na2SO4 salt solution (Figure 6D).
2.2.1.4. Chlorite
Chlorite particle ζ-potential in 0.1 (solid lines) and 1 M (broken lines) salt solutions is shown in Figure 7. Adsorption of ions changes the surface charge of chlorite;47 however, in the case of monovalent salts like NaCl depicted in Figure 7A, no significant effect on the ζ-potential of chlorite is observed except at the extreme pH values. The presence of the divalent cation (Figure 7B) and anions (Figure 7C,D) results in low ζ-potential values and positive surface charge. This supports the explanation provided earlier that states that chlorite particle charge development is attributed to ionic species adsorption, mineral dissolution, and Mg-Al and Mg-Fe hydroxide formation.29 More so, chlorite surface charge in acidic media includes a permanent negative charge on exposed siloxane surfaces and the pH-dependent positive charge on Mg–OH exposed surfaces, which can be obscured by negatively charged groups especially silicate anions sorbed on the surfaces. Furthermore, Si–OH and Mg–OH surfaces could pose positive charges at low pH and negative charges at high pH as observed in Figure 7A–D. The effect of the ionic strength increase shown in Figure 7 (broken lines) exhibits similar trends and controlled by mineral dissolutions. This observation concurs with the report of Yin et al.,48 who studied the anisotropic surface charge of chlorite surfaces using atomic force microscopy and ζ-potential measurements. Findings showed that at pH values of 5.6, 8.0, and 9.0, the chlorite mica-like face is negatively charged, similar to our observation and congruent with an earlier report by Jones.29
Figure 7.
ZPs of chlorite particles in salt solutions of 0.1 (continuous line) and 1 M (broken line). (A) NaCl effect, (B) CaCl2 and MgCl2 effect, (C) NaHCO3, and (D) Na2SO4 effect.
2.3. pH Environment and Well Operations
Different well operations, which include drilling, acidizing, and enhanced oil recovery techniques, are implemented in the life of a field or reservoir. These well operations begin with the drilling operation and end with EOR operations, which alters the nature of the fluids and rocks in the reservoir.1,49 These operations induce a change in the pH environment of the reservoir, which affects the surface chemistry of contacting minerals. The aftereffect of these well operations includes the adsorption of polar crude oil compounds on the rock surfaces, which has a significant impact on production. Maps of the pH environments and the salt (type and concentration) are produced (Tables 1 and 2) to provide insight into the surface charge of different clay minerals and how susceptible the surfaces are to the adsorption of polar crude fractions. The green, yellow, and red portions represent surfaces with high negative, low negative, and positive ζ-potential, respectively. Surfaces with positive and low negative ζ-potentials are prone to adsorption, whereas surfaces with high negative ζ values are free from adsorption.
Table 1. Effect of Well Operations on Rock Mineral Surface Conditions for 0.1 M Ionic Salt Concentrationa1,14,19,50−52.
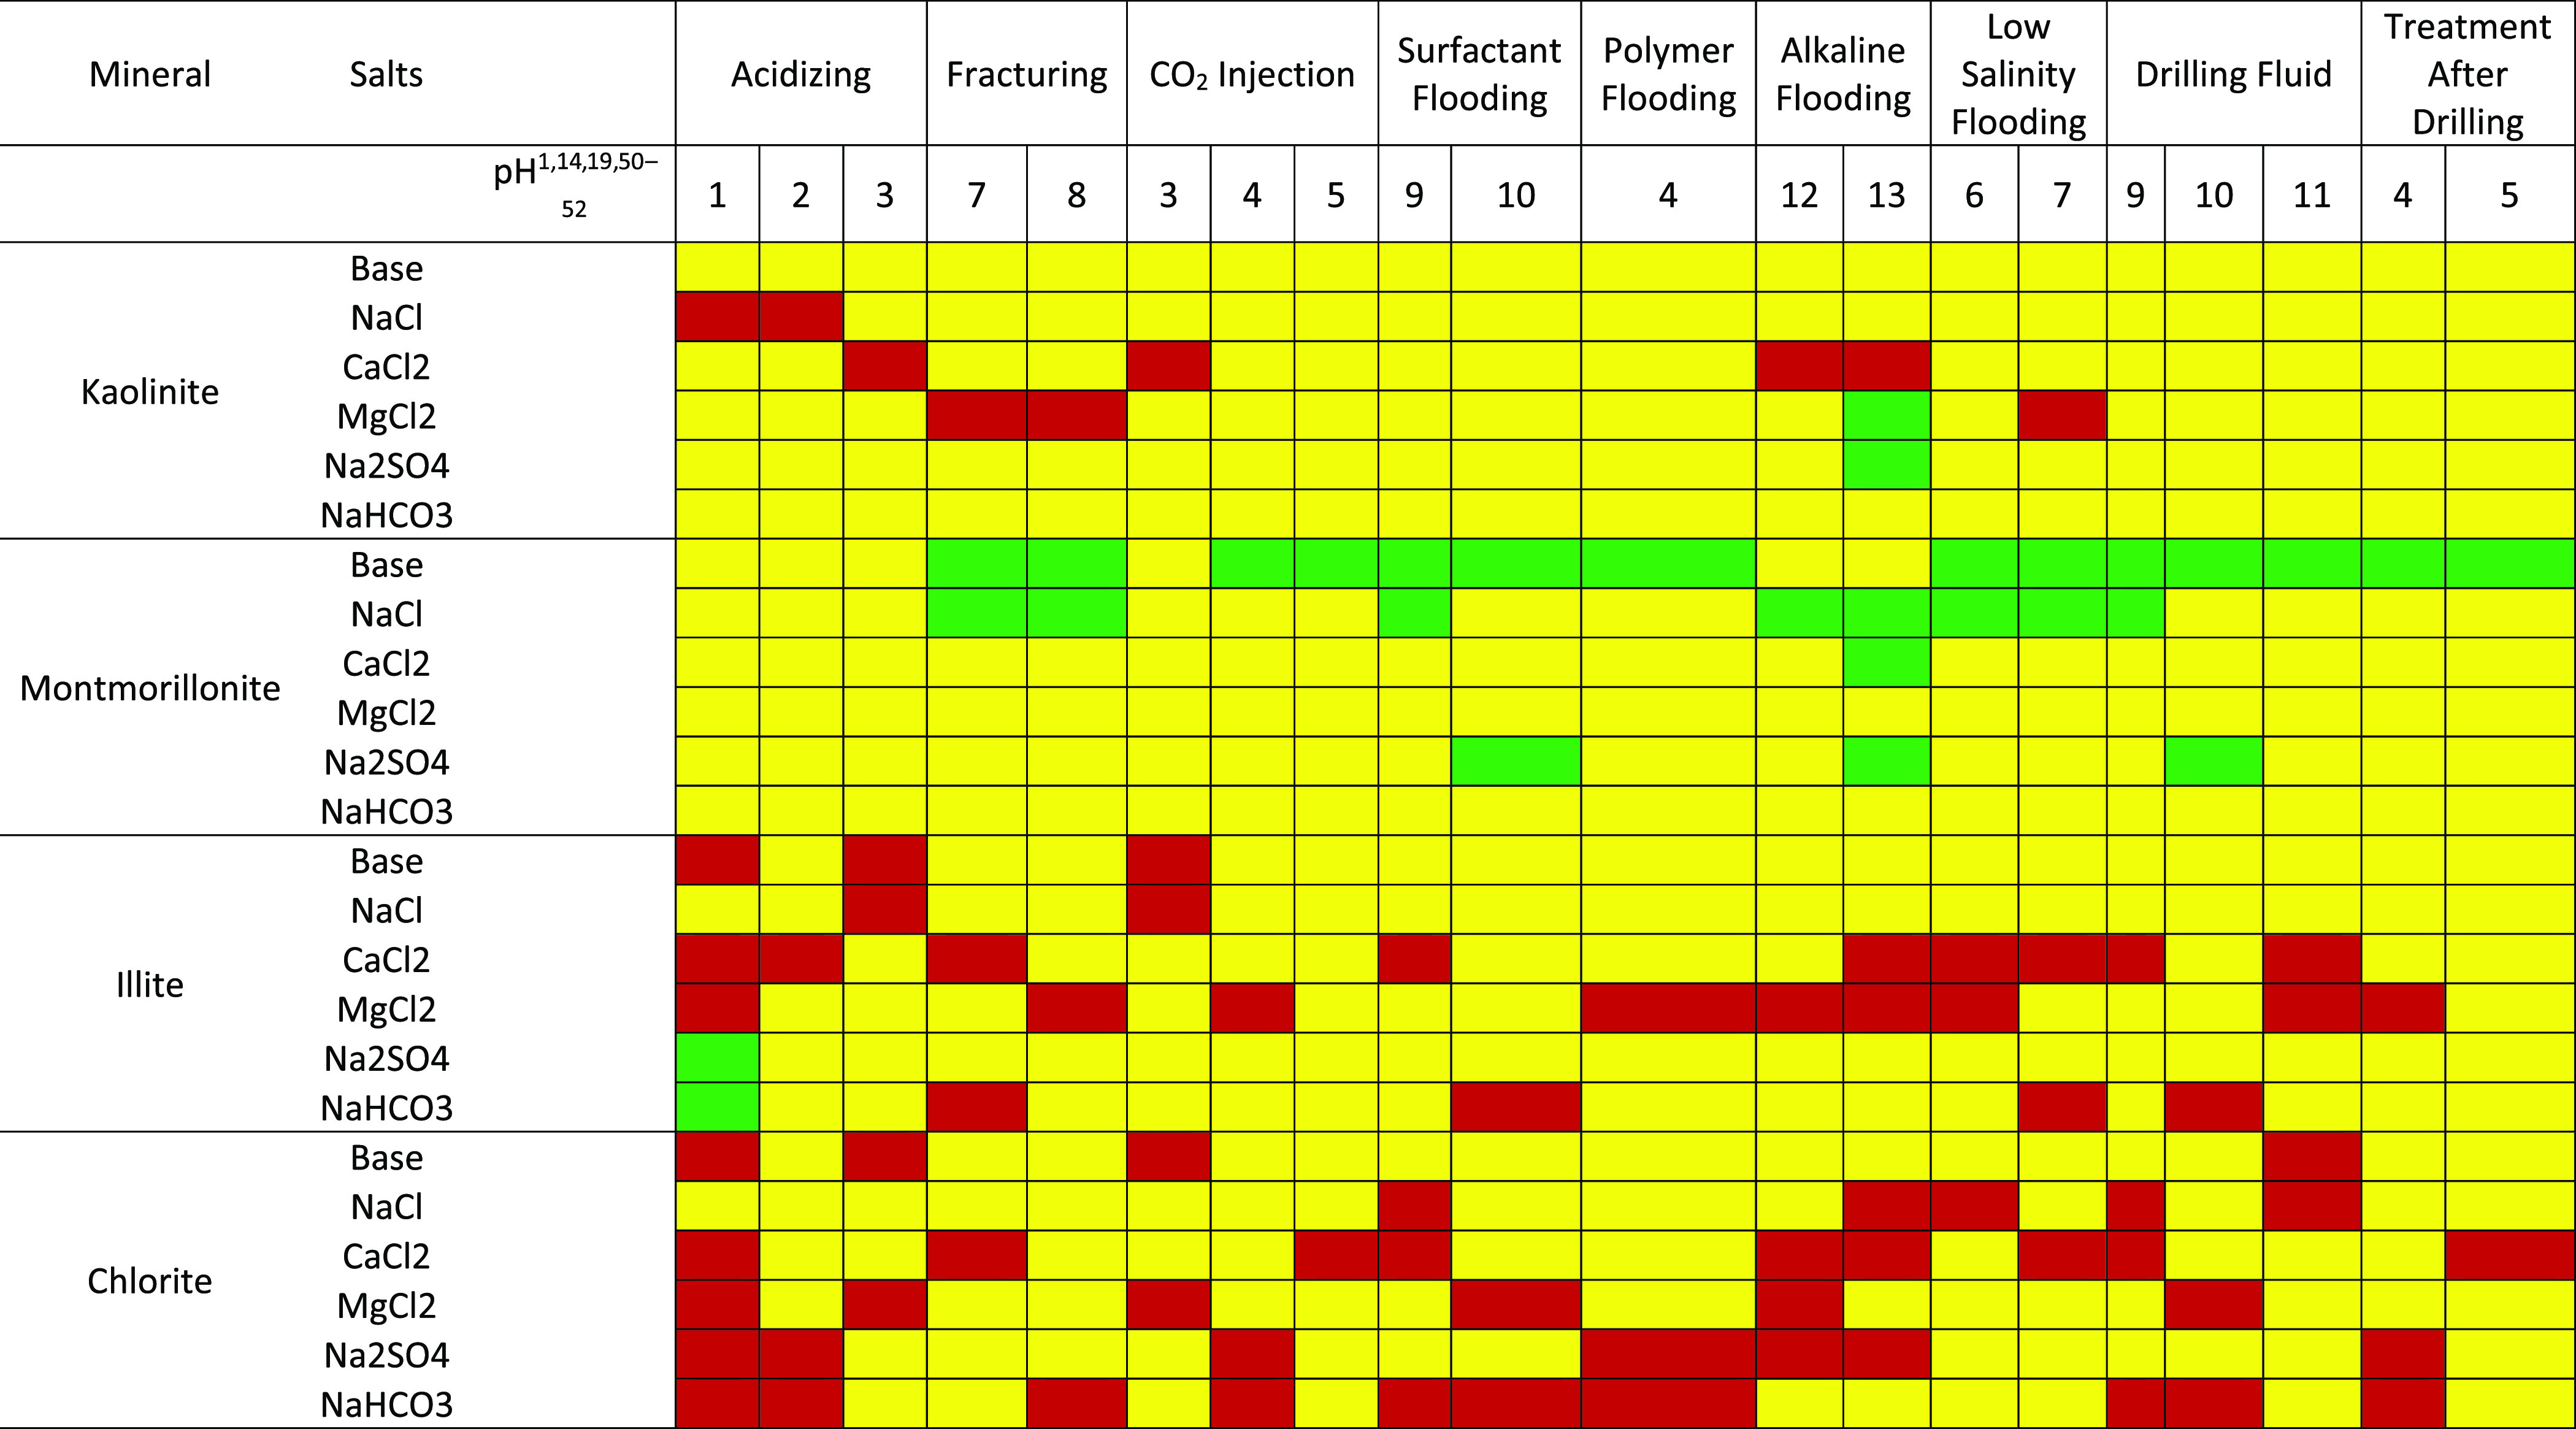
Red, yellow, and green represent surfaces with positive, low negative, and high negative zeta potential values.
Table 2. Effect of Well Operations on Rock Mineral Surface Conditions for 1 M Ionic Salt concentrationa1,14,19,50−52.
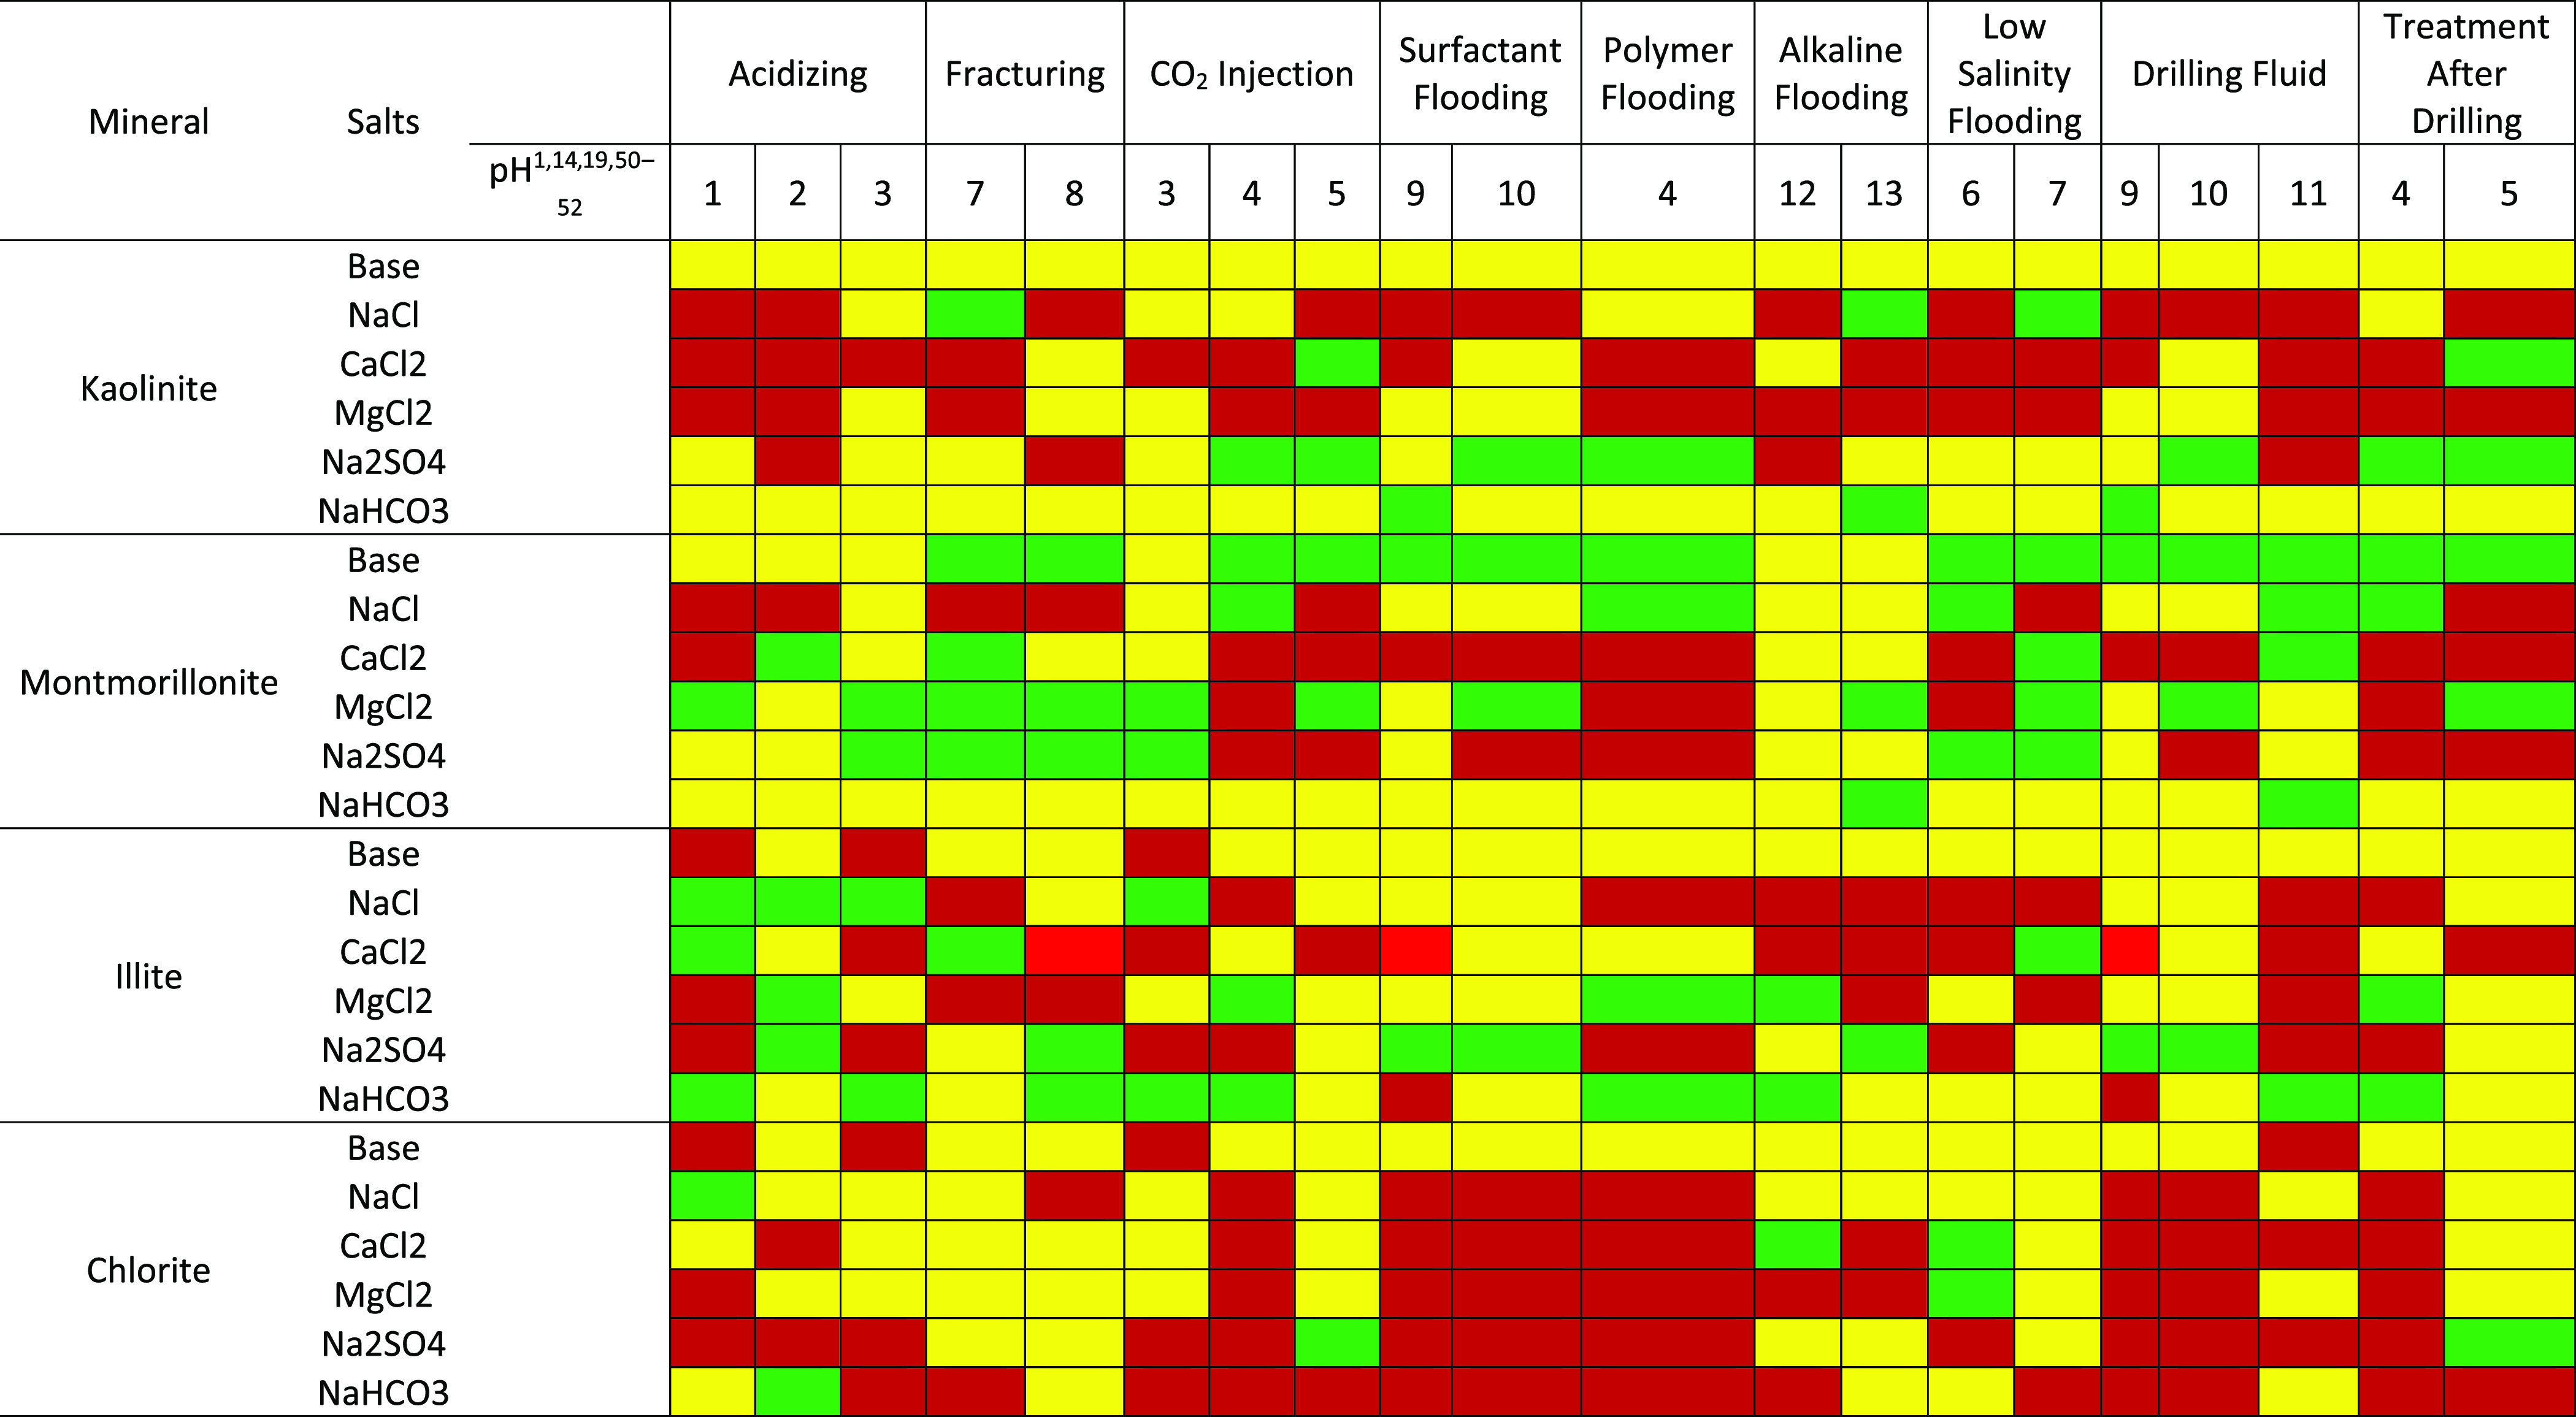
Red, yellow, and green represent surfaces with positive, low negative, and high negative zeta potential values.
Tables 1 and 2 show a flip in surface conditions due to pH changes, which suggest that the effect of well operations would be drastic especially in the case of kaolinite and chlorite. Furthermore, the effect of well operations on the clay mineral surface conditions is depicted. Depicted in Table 2 is the surface condition of chlorite under the surfactant flooding operation. Surfactant flooding is a well operation that reduces the interfacial tension between fluid/fluid and fluid/rock, thus improving recovery. However, in the case where chlorite is a contacting mineral in the reservoir, adsorption of the injected surfactant will occur, thus reducing the efficiency of the process.
This is one of many well operations whose aftereffects are neglected and thus serves as a precursor for flow assurance problems during the EOR. These maps, which are based on ζ-potential results from this study, are the first of their kind and provides insight into mitigating asphaltene depositional issues due to well operations. More so, they could serve as a guide in EOR design and selection of fluids to be injected into the reservoir. The ζ-potentials of some of the mineral surfaces in the reservoir determined under experimental conditions may be a piece of the puzzle. However, when fluids are introduced into a reservoir, the resulting wettability behavior is usually complex, as many other factors play a role.
3. Conclusions
Surface charge development of clay minerals and their contributions to wettability alteration are investigated using ζ-potential measurement in this research. This provides insight into the effect of pH change inducing well operations on reservoir wettability. The following conclusions are made based on findings from this study:
-
(1)
The presence of clay minerals and their interactions with reservoir brine present an adsorption prone (oil wetting) surface across all pH, and given the large surface area that clay minerals possess, the consequence of adsorption would be significant.
-
(2)
Clay mineral charge development is controlled by isomorphous substitution of ions, ion adsorption on the mineral surface, and double layer collapse around the mineral particles.
-
(3)
The surface charge of the clay minerals considered in this study becomes potentially more conducive to the adsorption of hydrocarbons in the presence of salts. The effect is greater in the following order: NaHCO3 < Na2SO4 < NaCl < MgCl2 < CaCl2.
-
(4)
Well operations considered in this study have a significant effect on clay mineral surface charge and would promote adsorption prone conditions in the reservoir.
4. Materials and Methods
4.1. Materials
Kaolinite, illite, chlorite, and montmorillonite were crushed to particle sizes of 4.57, 3.16, 11.28, and 2.64 μm, respectively, using a Malvern particle size analyzer. Salts (NaCl, MgCl2, CaCl2, Na2SO4, and NaHCO3) of ACS grade purchased from Sigma-Aldrich were used for all experiments. The buffer solution was prepared using 0.1 M solutions of nitric acid and sodium hydroxide. This is to ensure stable pH throughout the experiments. Also, nitric acid was used instead of hydrochloric acid to minimize the etching effect that acids have on mineral surfaces.
4.2. Sample Preparation and ζ-Potential Measurement
Fine mineral powders were conditioned in aqueous media of varying pH as detailed in our earlier publications.14,53 ζ-potential measurement was conducted using the Malvern Zeta Z instruments, with calibration ensured before measurements were taken. The details of this can also be found elsewhere.14,53 Measurements of kaolinite, montmorillonite, illite, and chlorite sample ζ-potentials in a buffer solution of different pH (1–13) as a function of salt type and concentration were conducted. This is to ascertain the effect of these salts on the charge development of the clay samples. The electrophoresis technique of ζ-potential measurement was used with the samples prepared by suspending 10 mg of clay samples in 30 mL of solutions (pH 1 to 13). To improve the quality of measurement for high settling clay samples as used in this study, samples were sonicated. The sample was then allowed to rest for 5 min before measurements were recorded. Furthermore, for high repeatability and reproducibility, a concentration of 10/100 mg/mL was observed to be optimal.
4.3. X-ray Diffraction
Rigaku Ultima IV equipment with a Cu-source was used for X-ray diffraction of the mineral samples to ascertain the presence of other crystalline phases. Mineral particle X-ray diffractograms were matched using the International Center for Diffraction Database (PDF-4 + 2021), with the data fitted using Rietveld.
Acknowledgments
The authors acknowledge the College of Petroleum and Geoscience, at King Fahd University of Petroleum & Minerals, for the support and permission to publish this work.
The authors declare no competing financial interest.
References
- Mohammed I.; Mahmoud M.; Al Shehri D.; El-Husseiny A.; Alade O. Asphaltene Precipitation and Deposition: A Critical Review. J. Pet. Sci. Eng. 2020, 197, 107956. 10.1016/j.petrol.2020.107956. [DOI] [Google Scholar]
- Leontaritis K. J.; Ali Mansoori G. Asphaltene Deposition: A Survey of Field Experiences and Research Approaches. J. Pet. Sci. Eng. 1988, 1, 229–239. 10.1016/0920-4105(88)90013-7. [DOI] [Google Scholar]
- Guo J.; Cao J.; Li M.; Xia H. Influences of Water Treatment Agents on Oil-Water Interfacial Properties of Oilfield Produced Water. Pet. Sci. 2013, 10, 415–420. 10.1007/s12182-013-0290-5. [DOI] [Google Scholar]
- Habibi S.; Jafari A.; Fakhroueian Z. Wettability Alteration Analysis of Smart Water/Novel Functionalized Nanocomposites for Enhanced Oil Recovery. Pet. Sci. 2020, 17, 1318–1328. 10.1007/s12182-020-00436-y. [DOI] [Google Scholar]
- Yan J.; Plancher H.; Morrow N. R. Wettability Changes Induced by Adsorption of Asphaltenes. SPE Prod. Facil. 1997, 12, 259–266. 10.2118/37232-PA. [DOI] [Google Scholar]
- Al-Maamari R. S. H.; Buckley J. S.. Asphaltene Precipitation and Alteration of Wetting: Can Wettability Change during Oil Production? In SPE/DOE Improved Oil Recovery Symposium; Society of Petroleum Engineers: 2000; pp. 187–192, 10.2118/59292-MS. [DOI] [Google Scholar]
- Parvizi Ghaleh S.; Khodapanah E.; Tabatabaei-Nezhad S. A. Experimental Evaluation of Thiamine as a New Clay Swelling Inhibitor. Pet. Sci. 2020, 17, 1616–1633. 10.1007/s12182-020-00466-6. [DOI] [Google Scholar]
- Somasundaran P.; Fuerstenau D. W. Mechanisms of Alkyl Sulfonate Adsorption at the Alumina-Water Interface1. J. Phys. Chem. 1966, 70, 90–96. 10.1021/j100873a014. [DOI] [Google Scholar]
- Saraji S.; Goual L.; Piri M. Adsorption of Asphaltenes in Porous Media under Flow Conditions. Energy Fuels 2010, 24, 6009–6017. 10.1021/ef100881k. [DOI] [Google Scholar]
- Auflem I. H.Influence of Asphaltene Aggregation and Pressure on Crude Oil Emulsion Stability, Norwegian University of Science and Technology: 2002. [Google Scholar]
- Nghiem L.; Kohse B.; Ali S. M.; Quang D.. Asphaltene Precipitation: Phase Behaviour Modelling and Compositional Simulation. In Proceedings of SPE Asia Pacific Conference on Integrated Modelling for Asset Management; Society of Petroleum Engineers: 2000; pp. 283–296. 10.2523/59432-MS. [DOI] [Google Scholar]
- Piro G.; Canonico L. B.; Galbariggi G.; Bertero L.; Carniani C. Asphaltene Adsorption Onto Formation Rock: An Approach to Asphaltene Formation Damage Prevention. SPE Prod. Facil. 1996, 11, 156–160. 10.2118/30109-PA. [DOI] [Google Scholar]
- Pauchard V.; Rane J. P.; Zarkar S.; Couzis A.; Banerjee S. Long-Term Adsorption Kinetics of Asphaltenes at the Oil-Water Interface: A Random Sequential Adsorption Perspective. Langmuir 2014, 30, 8381–8390. 10.1021/la500384r. [DOI] [PubMed] [Google Scholar]
- Mohammed I.; Al Shehri D.; Mahmoud M.; Kamal M. S.; Alade O. S. Impact of Iron Minerals in Promoting Wettability Alterations in Reservoir Formations. ACS Omega 2021, 6, 4022–4033. 10.1021/acsomega.0c05954. [DOI] [PMC free article] [PubMed] [Google Scholar]
- Jiang S.Clay Minerals from the Perspective of Oil and Gas Exploration. In Clay Minerals in Nature - Their Characterization, Modification and Application; InTech: 2012, 10.5772/47790. [DOI] [Google Scholar]
- Ralph E. G.; K H.. Clay Mineral. In Dictionary of Geotourism; Springer Singapore: Singapore, 2020; pp. 86–86. 10.1007/978-981-13-2538-0_346. [DOI] [Google Scholar]
- Uddin F.Montmorillonite: An Introduction to Properties and Utilization. In Current Topics in the Utilization of Clay in Industrial and Medical Applications; InTech: 2018; p 13. 10.5772/intechopen.77987. [DOI] [Google Scholar]
- Eltoum H.; Yang Y.-L.; Hou J.-R. The Effect of Nanoparticles on Reservoir Wettability Alteration: A Critical Review. Pet. Sci. 2020, 18, 0123456789 10.1007/s12182-020-00496-0. [DOI] [Google Scholar]
- Mahmoud M. A. N. E. D. Effect of Chlorite Clay-Mineral Dissolution on the Improved Oil Recovery from Sandstone Rocks during Diethylenetriaminepentaacetic Acid Chelating-Agent Flooding. SPE J. 2018, 23, 1880–1898. 10.2118/189988-PA. [DOI] [Google Scholar]
- Vdović N.; Jurina I.; Škapin S. D.; Sondi I. The Surface Properties of Clay Minerals Modified by Intensive Dry Milling — Revisited. Appl. Clay Sci. 2010, 48, 575–580. 10.1016/j.clay.2010.03.006. [DOI] [Google Scholar]
- Lauzon R. V.Microelectrophoresis, Laser Clays. Laser Microelcectrophoresis of Clay, NL Baroid?NL Industries, P.O Box 1675, HoustonTexas, 1982. https://doi.org/https://doi.org/NA. [Google Scholar]
- Zhou D.; Abdel-Fattah A. I.; Keller A. A. Clay Particles Destabilize Engineered Nanoparticles in Aqueous Environments. Environ. Sci. Technol. 2012, 46, 7520–7526. 10.1021/es3004427. [DOI] [PubMed] [Google Scholar]
- Avadiar L.; Leong Y.-K.; Fourie A. Physicochemical Behaviors of Kaolin Slurries with and without Cations—Contributions of Alumina and Silica Sheets. Colloids Surf. Physicochem. Eng. Asp. 2015, 468, 103–113. 10.1016/j.colsurfa.2014.12.019. [DOI] [Google Scholar]
- Chorom M.; Rengasamy P. Dispersion and Zeta Potential of Pure Clays as Related to Net Particle Charge under Varying PH, Electrolyte Concentration and Cation Type. Eur. J. Soil Sci. 1995, 46, 657–665. 10.1111/j.1365-2389.1995.tb01362.x. [DOI] [Google Scholar]
- Beene G. M.; Bryant R.; Williams D. J. A. Electrochemical Properties of Illites. J. Colloid Interface Sci. 1991, 147, 358–369. 10.1016/0021-9797(91)90168-8. [DOI] [Google Scholar]
- Horikawa Y.; Murray R.; Quirk J. The Effect of Electrolyte Concentration on the Zeta Potentials of Homoionic Montmorillonite and Illite. Colloids Surf. 1988, 32, 181–195. 10.1016/0166-6622(88)80015-5. [DOI] [Google Scholar]
- Lowson R. T.; Brown P. L.; Comarmond M.-C. J.; Rajaratnam G. The Kinetics of Chlorite Dissolution. Geochim. Cosmochim. Acta 2007, 71, 1431–1447. 10.1016/j.gca.2006.12.008. [DOI] [Google Scholar]
- Gustafsson Å. B.; Puigdomenech I. The Effect of PH on Chlorite Dissolution Rates at 25°C. MRS Proc. 2002, 757, II3.16. 10.1557/PROC-757-II3.16. [DOI] [Google Scholar]
- Jones A. A. Charges on the Surfaces of Two Chlorites. Clay Miner. 1981, 16, 347–359. 10.1180/claymin.1981.016.4.04. [DOI] [Google Scholar]
- Silvester E. J.; Bruckard W. J.; Woodcock J. T. Surface and Chemical Properties of Chlorite in Relation to Its Flotation and Depression. Miner. Process. Extr. Metall. 2011, 120, 65–70. 10.1179/1743285510Y.0000000009. [DOI] [Google Scholar]
- Pan G.; Zhang G.; Shi Q.; Chen W. The Effect of Sodium Alginate on Chlorite and Serpentine in Chalcopyrite Flotation. Minerals 2019, 9, 196. 10.3390/min9030196. [DOI] [Google Scholar]
- Alarifi S. A.; Mahmoud M. A.; Kamal M. S. Interactions of DTPA Chelating Agent with Sandstone Rocks during EOR: Rock Surface Charge Study. Fuel 2018, 232, 684–692. 10.1016/j.fuel.2018.06.003. [DOI] [Google Scholar]
- Nasralla R. A.; Nasr-El-Din H. A. Double-Layer Expansion: Is It a Primary Mechanism of Improved Oil Recovery by Low-Salinity Waterflooding?. SPE Reserv. Eval. Eng. 2014, 17, 49–59. 10.2118/154334-PA. [DOI] [Google Scholar]
- Nasralla R. A.; Bataweel M. A.; Nasr-El-Din H. A.. Investigation of Wettability Alteration by Low Salinity Water in Sandstone Rock. SPE Offshore Europe Oil and Gas Conference and Exhibition. Society of Petroleum Engineers: 2011, 2, 978–989. 10.2118/146322-ms. [DOI] [Google Scholar]
- Nasralla R. A.; Alotaibi M. B.; Nasr-El-Din H. A.. Efficiency of Oil Recovery by Low Salinity Water Flooding in Sandstone Reservoirs. SPE Western North American Region Meeting; Society of Petroleum Engineers: 2011, No. 1967, 578–593. 10.2118/144602-ms. [DOI] [Google Scholar]
- Niriella D.; Carnahan R. P. Comparison Study of Zeta Potential Values of Bentonite in Salt Solutions. J. Dispersion Sci. Technol. 2006, 27, 123–131. 10.1081/DIS-200066860. [DOI] [Google Scholar]
- Tomb́cz E.; Szekeres M. Surface Charge Heterogeneity of Kaolinite in Aqueous Suspension in Comparison with Montmorillonite. Appl. Clay Sci. 2006, 34, 105–124. 10.1016/j.clay.2006.05.009. [DOI] [Google Scholar]
- Gupta V.Surface Charge Features of Kaolinite Particles and Their Interactions; Ph.D Thesis, The University of Utah, 2011.
- Vane L. M.; Zang G. M. Effect of Aqueous Phase Properties on Clay Particle Zeta Potential and Electro-Osmotic Permeability: Implications for Electro-Kinetic Soil Remediation Processes. J. Hazard. Mater. 1997, 55, 1–22. 10.1016/S0304-3894(97)00010-1. [DOI] [Google Scholar]
- Parsons I.Feldspars and Their Reactions; Parsons I., Ed.; Springer Netherlands: Dordrecht, 1994. 10.1007/978-94-011-1106-5. [DOI] [Google Scholar]
- Bolland M. D. A. PH-Independent and PH-Dependent Surface Charges on Kaolinite. Clays Clay Miner. 1980, 28, 412–418. 10.1346/CCMN.1980.0280602. [DOI] [Google Scholar]
- Hoxha B. B.; Sullivan G.; van Oort E.; Daigle H.; Schindler C.. Determining the Zeta Potential of Intact Shales via Electrophoresis. In SPE Europec featured at 78th EAGE Conference and Exhibition; Society of Petroleum Engineers: 2016. 10.2118/180097-MS. [DOI] [Google Scholar]
- Unal Y.; Kar T.; Mukhametshina A.; Hascakir B.. The Impact of Clay Type on the Asphaltene Deposition during Bitumen Extraction with Steam Assisted Gravity Drainage. In SPE International Symposium on Oilfield Chemistry; Society of Petroleum Engineers: 2015; Vol. 2, pp. 1199–1211. 10.2118/173795-MS. [DOI] [Google Scholar]
- Saka E. E.; Güler C. The Effects of Electrolyte Concentration, Ion Species and PH on the Zeta Potential and Electrokinetic Charge Density of Montmorillonite. Clay Miner. 2006, 41, 853–861. 10.1180/0009855064140224. [DOI] [Google Scholar]
- Gu B. Adsorption of Hydroxy-Al Polycations and Destabilization of Illite and Montmorillonite Suspensions. Clays Clay Miner. 1990, 38, 493–500. 10.1346/CCMN.1990.0380505. [DOI] [Google Scholar]
- Liu X.; Hu M.; Hu Y. Chemical Composition and Surface Charge Properties of Montmorillonite. J. Cent. South Univ. Technol. 2008, 15, 193–197. 10.1007/s11771-008-0037-4. [DOI] [Google Scholar]
- Vrdoljak G. A.; Henderson G. S. Specific Ion Adsorption at the Mineral—Water Interface: Cesium Adsorption on Chlorite. Colloids Surfaces A Physicochem. Eng. Asp. 1994, 87, 187–196. 10.1016/0927-7757(94)80067-7. [DOI] [Google Scholar]
- Yin X.; Yan L.; Liu J.; Xu Z.; Miller J. D. Anisotropic Surface Charging of Chlorite Surfacesa. Clays Clay Miner. 2013, 61, 152–164. 10.1346/CCMN.2013.0610212. [DOI] [Google Scholar]
- Kaita A. Y.; Ogolo O.; Wu X.; Mohammed I.; Akpan E. A. Study of the Impact of Injection Parameters on the Performance of Miscible Sour Gas Injection for Enhanced Oil Recovery. J. Pet. Explor. Prod. Technol. 2020, 10, 1575. 10.1007/s13202-019-00793-4. [DOI] [Google Scholar]
- Mahmoud M. A.; Abdelgawad K. Z. Chelating-Agent Enhanced Oil Recovery for Sandstone and Carbonate Reservoirs. SPE J. 2015, 20, 483–495. 10.2118/172183-PA. [DOI] [Google Scholar]
- Tavakkoli M.; Panuganti S. R.; Vargas F. M.; Taghikhani V.; Pishvaie M. R.; Chapman W. G. Asphaltene Deposition in Different Depositing Environments: Part 1. Model Oil. Energy Fuels 2014, 28, 1617–1628. 10.1021/ef401857t. [DOI] [Google Scholar]
- Al-Attar H. H.; Mahmoud M. Y.; Zekri A. Y.; Almehaideb R.; Ghannam M. Low-Salinity Flooding in a Selected Carbonate Reservoir: Experimental Approach. J. Pet. Explor. Prod. Technol. 2013, 3, 139–149. 10.1007/s13202-013-0052-3. [DOI] [Google Scholar]
- Mohammed I.; Al Shehri D. A.; Mahmoud M.; Kamal M. S.; Alade O. Surface Charge Investigation of Reservoir Rock Minerals. Energy Fuels 2021, 35, 6003–6021. 10.1021/acs.energyfuels.1c00459. [DOI] [Google Scholar]


