

Abstract
Developing better three-way catalysts with improved low-temperature performance is essential for cold start emission control. Density functional theory in combination with microkinetics simulations is used to predict reactivity of CO/NO/H2 mixtures on a small Pd cluster on CeO2(111). At low temperatures, N2O formation occurs via a N2O2 dimer over metallic Pd3. Part of the N2O intermediate product re-oxidizes Pd, limiting NO conversion and requiring rich conditions to obtain high N2 selectivity. High N2 selectivity at elevated temperatures is due to N2O decomposition on oxygen vacancies. Doping CeO2 by Fe is predicted to lead to more oxygen vacancies and a higher N2 selectivity, which is validated by the lower onset of N2 formation for a Pd catalyst supported on Fe-doped CeO2 prepared by flame spray pyrolysis. Activating ceria surface oxygen by transition metal doping is a promising strategy to improve the performance of three-way catalysts.
Keywords: NO reduction, Pd/CeO2, density functional theory, mechanism, Fe doping
Introduction
Supported platinum group metal (PGM) catalysts are key components of catalytic convertors in motor vehicles, which can simultaneously convert CO, NOx, and hydrocarbons from the exhaust of gasoline engines to less harmful gases.1−4 The control of these pollutants employing Pd, Pt, and Rh in three-way catalysts (TWCs) is a well-established technology, which typically operates at temperatures above 250 °C.5,6 Excess emissions during a cold start, which is the period from the start of the engine until hot operation, can make a significant part of the total emissions. Repeated cold start events in fuel-efficient hybrid electric vehicles pose a new challenge in reducing the overall emissions. Therefore, it is imperative to develop TWCs with improved performance at low temperatures.7−12
Recently, substantial progress has been made in preparing single-atom catalysts (SACs) with outstanding performance in low-temperature CO oxidation. SACs represent a new direction in heterogeneous catalysis because of the ultimate (atom) efficiency in PGM utilization, which can impact automotive emission control given the high price of PGMs and the size of the TWC market.13 For example, highly active SACs for CO oxidation can be prepared by combining PGMs with reducible oxides such as TiO2,14 FeOx,15 Cu2O,16 and CeO2.17,18 CeO2 is most widely used in TWCs because of its ability to disperse PGMs and high oxygen storage capacity. Recent work emphasizes that the activation of lattice oxygen atoms of CeO2 in highly dispersed Pt/CeO2 catalysts leads to catalysts active in CO oxidation below 150 °C.19 Pd/CeO2 SACs are also active under these conditions.20 Pd is currently widely used in modern TWCs and does not require a reduction activation step as Pt. In general, small clusters of Pd on CeO2 are active catalysts for low-temperature CO oxidation.21,22
Environmental legislation on NOx emissions is becoming stricter because NO and NO2 by-products of fuel combustion at high temperatures contribute to respiratory diseases. NOx reduction to N2 is catalyzed by Pd and especially Rh, the latter being the most expensive of the PGMs used in these catalysts.23 Improving NOx removal at low temperatures using TWCs is challenging because the strong N–O bond in NO needs to be broken.24−26 It is known that small clusters of PGMs can strongly bind and activate NO.27,28 However, at low temperatures, the main reaction product is N2O,28,29 which is undesired as it is harmful to humans and a strong greenhouse gas.30,31 Optimizing TWCs for low-temperature NOx removal in a rational manner is hampered by a lack of understanding of the mechanism and the active sites. NO dissociation has been widely studied in surface science studies employing single crystals of PGMs, which demonstrated that open metal surfaces including step-edge sites are preferred for NO dissociation.32,33 For CO oxidation, the classical mechanistic picture of purely metal-catalyzed chemistry has already shifted to a description in which the metal–ceria interface provides the active sites.34 Although low-temperature NO reduction is unfavorable on ceria itself,35 it is therefore important in the context of stricter NOx emission regulations to determine the possible role of the interface between highly dispersed PGMs and CeO2 on NO reduction.
Herein, we used a combined theoretical and experimental approach to understand which reaction steps limit the NO reduction reaction at low temperatures for Pd/CeO2. Pd was chosen as it is much cheaper than Rh. The structural model used for computations is based on a well-characterized Pd/CeO2 catalyst, which consists of very small Pd clusters on CeO2 and exhibits good catalytic performance in NO reduction. Although this catalyst is already active below 200 °C, the main product is N2O under these conditions. The energetics of elementary reaction steps relevant to three-way catalysis were computed using density functional theory. The resulting data were used as input to microkinetics simulations to predict CO oxidation and NO reduction kinetics. A sensitivity analysis of the microkinetics identifies elementary reaction steps that limit the overall rate and the selectivity. We will demonstrate how this can guide the design of improved catalysts. Specifically, we show that slow decomposition of N2O on the CeO2 support is the root cause of the limited N2 selectivity at low temperatures. Theoretical predictions indicate that doping CeO2 with Fe increases the number of surface oxygen vacancies and significantly increases the NO reduction activity of the model system. These predictions are validated by experiment.
Methods
Materials and Synthesis
Ce(acac)3·H2O (acac = acetylacetonate, 99.9% purity), Fe(acac)3 (99.9% purity), glacial acetic acid (99.7% purity), Pd(NO3)2·2H2O (40% Pd basis), and Fe(NO3)3·9H2O (99.95 purity) were purchased from Sigma Aldrich. Sipernat 50 high-surface-area silica was purchased from Evonik. The chemicals were used without any further purification. Flame spray pyrolysis (FSP) synthesis was performed in a Tethis NPS10 apparatus. Cerium acetylacetonate and iron acetylacetonate were chosen as precursors, while glacial acetic acid acted as the solvent. The iron content was varied. For this purpose, the total Ce(acac)3 concentration was kept constant at 0.10 M, and appropriate amounts of Fe(acac)3 were added in order to achieve Fe/Ce atomic ratios of 1%, 2%, 5%, 10%, and 20% compared to cerium. The solvent was added to the precursors, and the mixture was stirred on a heating plate at a temperature of 80 °C to enhance solubilization. Once a homogeneous solution was obtained, it was drawn into the Tethis NPS10 syringe and injected into the flame at a rate of 5 mL/min. The flame was fed with a 1.5 L/min methane flow and a 3.0 L/min oxygen flow, with an additional 5.0 L/min dispersion oxygen flow, maintaining an overpressure of 2.5 bar. The particles were collected on a glass fiber filter placed on top of the machine. For the sake of clarity, the supports will be denoted as Fe(x)-CeO2, with x representing the Fe/Ce ratio in the sample. A pure CeO2 sample was also prepared and denoted as CeO2.
A portion of each support was impregnated with a solution of Pd(NO3)2·2H2O in demineralized water to achieve a 1% weight Pd loading on each sample. The dispersion was stirred for 30 min and then slowly heated on a plate to promote water evaporation. The resulting solid was dried at 100 °C and successively calcined at 300 °C with a dwelling time of 3 h in a 20/80 v/v O2/He flow. A similar approach was used to impregnate 5 wt % Pd on the silica support as a reference sample. The Pd-impregnated samples will be named Pd/Fe(x)-CeO2. Pure CeO2 impregnated with Pd will be denoted as Pd/CeO2. A control sample was prepared by impregnating a Fe(NO3)3·9H2O solution in demineralized water in order to achieve a 10% molar Fe loading on the CeO2 support. The ensuing steps were analogous to those used for the Pd-impregnated samples. This sample is denoted as Fe(10)-CeO2. The silica-based sample is labeled Pd/SiO2.
Characterization
An inductively coupled plasma-optical emission spectrometry (ICP-OES) spectrophotometer (Spectroblue, AMETEK Inc.) was employed for elemental analysis. For analyzing the Fe content of the ceria supports, approximately 50 mg of the sample was dissolved in 5 mL of concentrated H2SO4. The mixture was heated at 250 °C on a heating plate while stirring for 30 min. After cooling to room temperature, 15 mL of demineralized water was added. Once transparent, the mixtures were transferred to Teflon glassware and 1 mL of 4% v/v HF in demineralized water was added in order to solubilize potential glass fiber filter residues and minimize the chances of pipeline obstruction. The Fe(10)-CeO2 support could not be solubilized by this procedure, and a melting process was used instead. An appropriate amount of support was placed in a Pt crucible with 2 g of K2O7S2 followed by heated on a Bunsen burner until the melt was clear. The melt was dissolved in 10 mL of concentrated H2SO4 before adding 1 mL of 4% HF to dissolve potential glass fibers present from the support. The solutions were appropriately diluted for the ICP-OES measurements with demineralized water. ICP-OES analysis was conducted in duplo in order to determine the reproducibility of the results and with the aid of a calibration line comprising standards with iron elemental concentrations between 0 and 6 mg/mL. The wavelengths used for Fe concentration determination were 238.204 and 259.941 nm.
X-ray diffraction (XRD) patterns were recorded on a Bruker D2 Phaser powder diffraction system using Cu Kα radiation with a time per step of 0.5 min and a step size of 0.02° in the 2θ range of 10–90°.
N2 physisorption was performed on a Micromeritics Tristar II 3020 instrument at 77 K. Approximately 200 mg of each sample were transferred in a glass tube. A pretreatment procedure was employed at 120 °C under a N2 flow overnight in order to remove H2O, CO2, and impurities. The Brunauer–Emmett–Teller (BET) method was employed to calculate the surface area, and the below equation was used to calculate particle size for the supports.
| 1 |
Here, dBET is the particle diameter, As is the surface area calculated with the BET model, and ρp is the density of the material (7.2 g/cm3 for pure CeO2, used for the doped samples as well due to the relatively low loading). This formula assumes all particles to have a spherical morphology.
The details of the other characterization methods employed for the catalysts are provided in the Supporting Information.
Catalytic Activity Measurements
Catalytic activity measurements were performed using the following reaction mixtures: (i) CO + O2, (ii) CO + NO, (iii) CO + NO + H2, and (iv) CO + N2O. The reactions were performed in a high-throughput setup equipped with 10 parallel flow reactors. Fifty milligrams of each sample was pressed and sieved to a fraction between 125 and 250 μm and mixed with 200 mg of SiC of the same sieve fraction as an inert diluent material. The samples were transferred into the quartz reactors and contained between two quartz wool plugs. As a reference, one reactor was only packed with SiC. The catalysts were calcined in situ before reaction in a 20% O2/80% He flow. The flow amounted to 50 mL/min STP (standard temperature and pressure) per reactor, and the temperature was ramped at a rate of 5 °C/min to 300 °C with a dwelling time of 3 h. The samples were then cooled to room temperature in the same flow. The different feed mixtures had the following volumetric compositions: (1) 1% CO, 1% O2 balanced with He, (2) 1% CO, 1% NO balanced with He, (3) 1% CO, 1% NO, 0.5% H2 balanced with He, and (4) 1% CO, 1% N2O balanced with He. Once the reaction flow had stabilized, the temperature was ramped with steps of 25 °C at a rate of 5 °C/min. The reaction was allowed to stabilize for 20 min at each temperature. Then, the reaction effluents were analyzed with an online Interscience Compact GC equipped with Plot and Molsieve columns and thermal conductivity detector (TCD).
Computational Modeling
Spin-polarized DFT calculations were performed within the Vienna Ab Initio Simulation Package.36,37 The projector-augmented wave (PAW) method was used to describe the electron–ion interactions.38 To account for the effect of the exchange–correlation and on-site Coulomb interaction, the Perdew–Burke–Ernzerhof (PBE) functional39 with the Hubbard + U correction was used. Here, U = 4.5 eV for Ce was chosen based on previous studies.40,41 The cutoff energy for the plane-wave basis set was 400 eV. The geometry optimizations were assumed converged when the Hellmann–Feynman forces acting on atoms were less than 0.05 eV/Å.
For the ceria supported surface model, we constructed a CeO2 (111) slab models with 4 × 4 unit cell and six atomic layers. The top three layers were relaxed, and the bottom three layers were frozen to the configuration of the bulk. A vacuum thickness of 12 Å was used to avoid spurious interactions of adsorbates between neighboring super cells. For the Brillouin zone integration, a 1 × 1 × 1 Monkhorst–Pack k-point was used for these large unit cells.
In order to study the influence of transition metals on the catalytic performance, we considered doping of the support by replacing a surface Ce atom by a Fe atom. The transition states were searched by using the climbing-image nudged elastic band method (CI-NEB).42 The structure of the transition states was identified by vibrational frequency analysis with a single mode of imaginary frequency.
The adsorption energies are computed by
| 2 |
where Em+surf and Em are the electronic energies of the adsorbed system and the corresponding gas phase species, respectively.
To understand the kinetics properties of NO reduction with CO (H2) on Pd/CeO2 and Pd/Fe-CeO2 under experimental conditions, we performed microkinetics simulations of the overall reaction networks considered in our DFT calculations. The simulations are carried out using the in-house developed MKMCXX code,43 which has been employed in our previous works to explore the detailed kinetics of synthesis gas conversion on cobalt and rhodium surfaces.44,45 More details about the modeling method are described in the Supporting Information.
Results and Discussion
Catalytic Performance Pd/CeO2 vs Pd/SiO2
Figure 1 shows the NO reduction light-off curves for a Pd/CeO2 catalyst obtained by wet impregnation of 1 wt % Pd on CeO2 nanoparticles. The CeO2 support was prepared by flame spray pyrolysis of Ce(acetylacetonate) dissolved in glacial acetic acid, which yields small nanoparticles of ∼5 nm with a specific surface area of 155 m2/g, much higher than values usually reported for CeO2.46 The ceria nanoparticles expose preferentially the (111) surface. A reference sample containing 5 wt % Pd impregnated on silica was employed to ascertain the role of ceria as a support. According to XRD, the Pd/SiO2 catalyst contained PdO particles with an average size of ∼4 nm (Figure S1). The catalytic performance was evaluated using a model feed containing NO + CO without and with a small amount of H2, representing stoichiometric and slightly rich model conditions (Figures 1a and 1b ). Light-off occurred below 100 °C for Pd/CeO2 with full NO conversion being reached below 150 °C for both conditions.
Figure 1.

(a, b) NO conversion and N2 selectivity during NO + CO and NO + CO + H2 reactions, respectively (PCO = PNO = 0.01 atm, PH2 = 0.005 atm). (c) CO conversion during CO oxidation for Pd/CeO2 and Pd/SiO2 (PCO = PO2 = 0.01 atm). (d) HAADF-STEM and EDX-mapping images of Pd/CeO2.
Despite the higher Pd loading, Pd/SiO2 is much less active than Pd/CeO2 and full NO conversion is only reached above 250 °C. Both catalysts exhibit a low N2 selectivity below 200 °C with N2O as the main product of NO reduction. It is interesting to note that both catalysts show a small decrease in the NO conversion around 200 °C under stoichiometric conditions. Compared to the stoichiometric reaction, the CO conversion decreases at low temperatures under slightly rich conditions, as shown in Figure S2. The catalysts show very different performance in CO oxidation, in qualitative agreement with the differences noted for the NO + CO reaction (Figure 1c). High-angle annular dark-field scanning transmission electron microscopy (HAADF-STEM) images in combination with energy-dispersive X-ray (EDX) maps indicate a high dispersion of Pd in Pd/CeO2 with no evidence of Pd nanoparticles (Figure 1d). The high dispersion of the as-prepared Pd/CeO2 catalyst is confirmed by Pd extended X-ray absorption fine structure (EXAFS) analysis (Figure S3 and Table S1). The Pd–Pd coordination number (CN) of 0.9 at a distance (R) of 2.81 Å points to very small clusters of a few Pd atoms on the CeO2 support. The significant Pd–O shell (R = 2.00 Å; CN = 4.1) indicates that Pd is oxidized. Together, the X-ray absorption spectroscopy (XAS) results show that Pd/CeO2 contains very small PdO clusters. Based on these results, we constructed a small Pd cluster model consisting of 3 Pd atoms placed on a periodic surface of CeO2 with the (111) termination (Figure 2). This model was chosen to keep the DFT calculations computationally tractable without compromising significantly on the key aspects of a small Pd cluster in contact with the ceria support.
Figure 2.
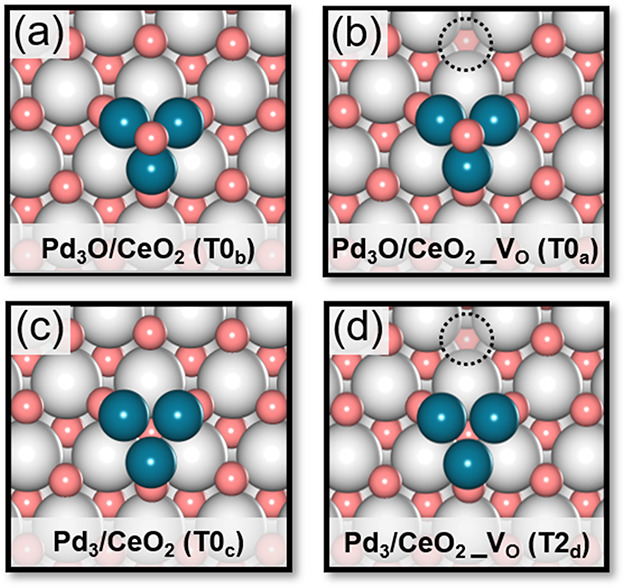
Structural models used in DFT calculations composed of Pd3 and Pd3O cluster placed on the (111) surface of CeO2 with and without a ceria surface oxygen vacancy (VO): (a) Pd3O/CeO2, (b) Pd3O/CeO2_VO, (c) Pd3/CeO2 (d) Pd3/CeO2_VO (color code: gray, Ce; pink, O; turquoise, Pd). The dashed circles represent surface oxygen vacancies. The codes between brackets are used in the following and pertain to states described in Figure S4.
Elementary Reaction Steps of NO Reduction
We considered Pd3 and Pd3O clusters on CeO2(111) as the initial states of the surface for developing an as complete as possible reaction network relevant to three-way catalysis. Here, the Pd3 and Pd3O clusters represent metallic Pd cluster and oxidized Pd clusters, respectively. The structural model emphasizes the chemistry occurring at the Pd–CeO2 interface. The complete reaction network explored in this study, which is shown in detail in Figure S4, involves CO oxidation, NO dissociation, N2O formation and decomposition, N2 formation, H2 dissociation, and H2O formation. Below, we discuss in more detail CO oxidation, NO dissociation and N2O formation, and N2O decomposition.
CO oxidation can involve the reaction of CO adsorbed on one of the Pd atoms of Pd3O/CeO2 with an O atom of the stoichiometric ceria surface with an activation barrier of 80 kJ/mol, as shown in Figure S5a. CO oxidation with the O atom of Pd3O/CeO2 is, however, much more favorable with a barrier of only 21 kJ/mol (Figure S5b). This finding suggests that low-temperature CO oxidation involves O atoms of oxidized surface Pd rather than surface O atoms of ceria.20,47 We also explored the effect of an oxygen vacancy (VO) in the CeO2(111) surface close to the Pd cluster. CO2 formation with the O atom of Pd3O for the Pd3O/CeO2_Vo model has a nearly similar barrier of 29 kJ/mol as for the stoichiometric CeO2 surface. This shows that the electronic influence of a ceria oxygen vacancy on the chemistry of the Pd3O cluster is small. CO oxidation with a ceria O atom on Pd3/CeO2 is much more difficult with a barrier of 167 kJ/mol. This is caused by the much stronger binding of CO on Pd3/CeO2 (Eads = −275 kJ/mol) than on Pd3O/CeO2 (Eads = −154 kJ/mol), raising the barrier for CO2 formation. These results are consistent with the insights of a previous computational work for a slightly larger Pd8 cluster on CeO2.12
We next considered NO reduction on these models. NO dissociation is a structure-sensitive reaction, implying that the rate depends strongly on the metal particle size. NO dissociation on the close-packed (111) surface of Pd is very difficult with a computed barrier of 224 kJ/mol.48 Reported barriers on more open surfaces in experimental and theoretical studies are lower but typically above 100 kJ/mol. For instance, the NO dissociation barrier on stepped Pd is around 150 kJ/mol.49 These more reactive step-edge sites are only expected on the surface of relatively large Pd nanoparticles as present on the Pd/SiO2 catalyst. Accordingly, we explored alternative pathways for NO dissociation on the Pd3/CeO2 model to explain the higher activity of the highly dispersed Pd phase in Pd/CeO2. We first focused on direct NO dissociation on Pd3/CeO2 and Pd3O/CeO2 where the N atom ends up on the Pd cluster and the O atom on the ceria support. All these reactions have unfavorable activation barriers above 150 kJ/mol, as shown in Figures 3a and 3b and Figure S6. These reactions are strongly endothermic, even when a ceria oxygen vacancy is healed by the O atom resulting from NO dissociation. Pathways in which the N and O atoms end up at the Pd3 and Pd3O cluster are even less favorable with barriers above 200 kJ/mol.
Figure 3.

Mechanistic pathways for NO dissociation: (a) Direct NO dissociation on Pd3/CeO2, (b) direct NO dissociation on Pd3/CeO2_VO, (c) H-assisted NO dissociation on Pd3/CeO2, and (d) NO dissociation via the N2O2 dimer pathway on Pd3/CeO2 (color code: gray, Ce; pink and red, O; blue, N; turquoise, Pd; white, H). The dashed circles represent surface oxygen vacancies.
We also investigated the possibility of H-assisted NO dissociation in analogy to H-assisted CO dissociation.50 We focus on such a reaction pathway for the Pd3O/CeO2_Vo model (Figure S7). NO adsorbs slightly stronger (Eads = −169 kJ/mol) on the Pd3O cluster than CO (−146 kJ/mol). The adsorption energy of H2 on the model containing NO is −66 kJ/mol. The formation of the HNO intermediate has an activation barrier of 105 kJ/mol. The N–O bond in this intermediate is activated in comparison with adsorbed NO as follows from the longer N–O bond in HNO (1.31 Å) than in adsorbed NO (1.20 Å). The resulting activation barrier for N–O bond dissociation in HN–O is 92 kJ/mol. The O atom of NO migrates to the ceria oxygen vacancy. Next, the H atom of the NH intermediate migrates to the ceria surface O atom with a barrier of 73 kJ/mol and adsorbed H2O is formed with the other H atom. The latter step has a relatively high barrier of 126 kJ/mol, while H2O is also strongly adsorbed on the ceria surface (Eads = −119 kJ/mol). The reaction energetics are similar for the Pd3/CeO2_Vo model. When the ceria surface does not contain an oxygen vacancy, the barriers for HN–O dissociation are higher, i.e., around 108 kJ/mol (Figure 3c). The remaining N adatom on the Pd cluster will react very easily with adsorbed NO to form N2O with typical barriers of 25 kJ/mol. As the direct and H-assisted NO dissociation need to overcome very high barriers, it is unlikely that two N adatoms can be formed on the small Pd3 cluster for direct N2 formation.
We also investigated the formation of N2O2 as an intermediate toward N–O bond dissociation on Pd3/CeO2. Figure 3d shows that the adsorption of 2 NO molecules on Pd3/CeO2 is favorable (Eads = −392 kJ/mol). From this state, N2O2 can be formed with a low barrier of 71 kJ/mol. This dimer can dissociate with a barrier of only 69 kJ/mol, resulting in the formation of adsorbed N2O and an O adatom. In the transition state, one of the N–O bonds is stretched to 1.87 Å from 1.48 Å in the initial state. The N2O product molecule adsorbs only weakly on the resulting Pd3O cluster (Eads = −19 kJ/mol). We found that, despite the strong adsorption of 2 NO molecules on Pd3O/CeO2, N2O2 formation is inhibited by the presence of the O adatom on the Pd cluster.
N2O decomposition is the main route toward N2 formation for the used model. N2O binds relatively strong on Pd in the Pd3/CeO2 model (Eads = −62 kJ/mol). From this state, N2O desorption competes with N2O decomposition with an activation barrier of 61 kJ/mol. N2O adsorption on Pd in the Pd3O/CeO2 cluster is very weak (Eads = −19 kJ/mol). The O–N2 bonds in N2O adsorbed on Pd3O/CeO2 and Pd3/CeO2 are 1.26 and 1.29 Å, respectively. This indicates that the barrier for N2O decomposition after adsorption on Pd3O/CeO2 is higher than 61 kJ/mol. Thus, desorption of N2O is strongly preferred over decomposition. A third route toward N2 involves N2O adsorption on a ceria oxygen vacancy (Eads = −106 kJ/mol). In this adsorbed state, the O–N2 bond is increased to 1.36 Å from 1.20 Å in the gas phase. The barrier for N2O decomposition from the adsorbed state on ceria is very low (∼5 kJ/mol).
NO dissociation on Pd1/CeO2 was also considered because recent studies emphasized the single-atom character of active sites in Pd/CeO2 catalysts for CO oxidation.47 The structures and corresponding energy profiles are shown in Figure S8. NO adsorbs very strongly on the single Pd atom (Eads = −238 kJ/mol). However, direct NO dissociation is a strongly endothermic process (ΔE = 349 kJ/mol) with a very high barrier of 469 kJ/mol. This is related to unstable final state where N atom adsorbs on Pd and O atom adsorbs between Pd and Ce atoms. H-assisted NO dissociation was also considered. After NO adsorption, H2 co-adsorbs with NO with a very high adsorption energy of −4 kJ/mol, meaning the co-adsorption of H2 and NO is impossible. Thus, we can exclude the H-assisted NO dissociation pathway. We also exclude the N2O2 dimer pathway on the Pd1/CeO2 model because adsorption of a second NO molecule is unfavorable. Based on these calculations, we rule out the role of NO reduction for a model containing a single Pd atom on CeO2(111).
Microkinetics Simulations on Pd3/CeO2
The reaction energetics for the network displayed in Figure S4 was used to simulate the microkinetics of NO reduction in a simple continuous stirred-tank reactor model. Figures 4a and 4b show the results for stoichiometric and rich conditions. Under stoichiometric conditions, the reaction lights off below 100 °C and levels off at 80% until 200 °C. Full NO conversion is only reached above 250 °C. The main product at low temperatures is N2O, which starts being converted to N2 above 150 °C. The reaction is only selective to N2 above 250 °C. Under slightly rich conditions, the activity at low temperatures is higher and full NO conversion is reached already at 125 °C. Although the N2 selectivity at lower temperatures is only slightly improved under these conditions, complete conversion of NO to N2 still requires temperatures above 250 °C (Figure 4b). These predictions are in good agreement with the experimental catalytic data for Pd/CeO2 (Figures 1a and 1b).
Figure 4.

NO conversion and N2 selectivity for Pd3/CeO2 predicted by microkinetics simulations: (a) NO + CO reaction (PCO = PNO = 0.01 atm) and (b) NO + CO + H2 reaction (PCO = PNO = 0.01 atm, PH2 = 0.005 atm).
We then analyzed the main reaction pathways for the stoichiometric case at 100, 200, and 300 °C (Figure 5). At 100 °C, the reaction network analysis shows that the first step is the reduction of the Pd3O cluster to Pd3 on the stoichiometric ceria support by adsorbed CO. The main NO reduction reaction takes place on Pd3/CeO2 on which N2O is formed by dimerization of NO and its decomposition. Thus, at low temperatures, the overall reaction is CO + 2NO → CO2 + N2O. NO conversion is limited by the fraction of the Pd3/CeO2 (T0c) state required for the N2O2 dimer pathway (Figure S9).
Figure 5.

Reaction network analysis and coverage distribution for different reactions on Pd/CeO2 at 100, 200, and 300 °C: (a) NO + CO reaction and (b) NO + CO + H2 reaction. Here, the dominated reaction pathways are marked in green and deep gray. The key intermediates for the dominated pathways (green) are displayed. Partial pressures of NO, CO, and H2 are 0.01, 0.01, and 0.005 atm, respectively. (c) Structures for the key intermediates (color code: gray, Ce; pink and red, O; black, C; blue, N; turquoise, Pd; white, H). The dashed circles represent surface oxygen vacancies.
At intermediate temperatures, N2O decomposition will occur on the Pd3/CeO2 (T0c) state, resulting in the formation of N2 and Pd3O/CeO2. This can explain the finding that the NO conversion is limited to 80%, while CO conversion still increases with temperature. CO is converted, resulting in the reduction of Pd3O to Pd3. About half of N2O is decomposed on Pd3/CeO2, the other half on the small number of ceria oxygen vacancies. This involves the reaction of CO adsorbed on the Pd3O cluster with a ceria surface O atom, resulting in a ceria oxygen vacancy. This oxygen vacancy can adsorb N2O, resulting in facile N2 formation. This N2O decomposition process on defective CeO2 is much easier than on Pd3O. As the rates of ceria O removal and N2O decomposition on Pd3/CeO2 are much lower than the rate of NO reduction to N2O, the main reaction product remains N2O at this temperature. At 300 °C, the catalytic surface is further reduced and the dominant state is Pd3/CeO2_VO (T2d). Under these conditions, the reduction of the ceria surface by CO is sufficiently fast to generate oxygen vacancies, leading to the decomposition of all N2O intermediate product formed on the Pd3 cluster. N2O decomposition takes place only on the defect CeO2 surface. This means that N2O is rapidly decomposed and cannot reoxidize Pd3 to Pd3O, explaining why full NO conversion can be achieved under these conditions.
The effect of operating under slightly rich conditions by adding H2 has a limited influence on the microkinetics (Figure 5b). H2 can adsorb at low temperatures, which leads to the formation of a hydride-type species on the Pd3O cluster and a hydroxyl group on the CeO2 surface (T10b). The second H atom can also migrate to the CeO2 surface, resulting in the formation of H2O. However, H2O is relatively strongly bound (T14b), precluding the formation of surface oxygen vacancies at 100 °C. Analysis of the reaction network shows that the two dominant states at this temperature, T10b and T14b, are spectator species. The reduction of Pd3O to Pd3 occurs by H2 and CO in proportions similar with the partial pressure difference. Thus, a higher concentration of reducing reactants results in a higher steady-state concentration of Pd3/CeO2 and, henceforth, a slightly higher NO conversion at low temperatures. This trend is consistent with the experimental data. The higher N2 selectivity at intermediate temperatures is related to the more facile reduction of the Pd3O cluster, which is in keeping with Pd3/CeO2 (T0c) being the dominant state at 200 °C. Under these conditions, the CeO2 surface is also slightly reduced by H2, which also contributes to the higher N2 selectivity. At 300 °C, all N2O intermediate product is again decomposed on the defect CeO2 surface. We did not observe a contribution of H-assisted pathways in the microkinetics in the presence of H2, which is expected based on the much higher activation barriers of these pathways.
The microkinetics for the Pd3/CeO2 model correspond well with the experimentally observed kinetics for the Pd/CeO2 catalyst. The most important insight derived from the microkinetics simulations is that the catalysis at low temperatures takes place on the Pd3 cluster and does not involve the CeO2 support. CO (and H2) oxidation result in the reduction of the Pd3O cluster, required to open the N2O2 dimer pathway to convert NO into N2O at low temperatures. N2O decomposition on the Pd3 cluster is slow because of the weak binding of N2O to Pd3. The preferred pathway for the decomposition of N2O to N2 is via adsorption on ceria surface oxygen vacancies followed by decomposition. These oxygen vacancies can be generated by CO or H2 oxidation at higher temperatures. The addition of H2 to simulate rich conditions increases the reaction rate slightly because the reduction of the Pd3O cluster is easier. Moreover, the N2 selectivity is slightly higher because of the higher fraction of reduced Pd3 and ceria oxygen vacancies at intermediate temperatures. The limited NO conversion predicted by the simulations is due to reoxidation of Pd3 to Pd3O by N2O, decreasing the rate of NO dimerization and N2O formation on Pd3. This phenomenon related to Pd chemistry is also observed in the NO + CO reaction experiments for Pd/CeO2 and Pd/SiO2. For Pd3/CeO2 at high temperatures, when the removal of the ceria O surface atom by CO (or H2) is facile, all NO is converted to N2 on the defective ceria surface because N2O preferably reoxidizes the defective CeO2 support instead of the Pd3 cluster. The main limitation with respect to NO reduction to N2 is therefore the formation of ceria oxygen vacancies. This insight is used to guide the design of an improved Pd/CeO2 catalyst.
Transition Metal Doping of Ceria
Doping of ceria with low-valence cations such as rare earth or transition metal cations can introduce a much larger number of oxygen vacancies.51,52 Kim et al. reported that the doping of an equal or lower valence cation as Ce4+ in CeO2 can make surface oxygen vacancy formation easier.53 Recent studies indicated that modification of the CeO2 surface with transition metals can improve the catalytic performance of CO oxidation.54,55 Su et al. systematically investigated the substitution of Ce4+ in the stable (111) surface of CeO2 by a range of transition metals, focusing on the local coordination environment of the dopant and the oxygen vacancy formation energy.56 We considered here the first-row transition metals Cu, Ni, Co, and Fe because of their abundance and low cost. Although the oxygen vacancy formation energy of Cu-doped CeO2 is negligible, Cu species in the CeO2 surface can be reduced already at 200 °C, which results in the segregation of Cu from the CeO2 surface.57,58 This severely limits the stability of Cu-CeO2 solid solutions under rich reaction conditions. Fe-doped CeO2 has been reported to be particularly stable, even at elevated temperatures.59 The work of Wang et al. shows that a homogeneous solution of Fe in CeO2 leads to a higher density of oxygen vacancies at the surface. Accordingly, we selected Fe as a dopant for CeO2. The Fe-doped Pd3O/CeO2 models without and with an oxygen vacancy are shown in Figure 6. The surface oxygen vacancy formation energy for this model is 167 kJ/mol, which is significantly lower than the computed value for the stoichiometric CeO2(111) surface (242 kJ/mol). Removal of the indicated O atom to generate the vacancy results in the formation of a Ce3+ ion in the surface. We then explored CO oxidation at the Pd3/Fe-CeO2 interface (Figure S10). While CO binds at the Pd3O cluster with an adsorption energy of −150 kJ/mol, the activation barrier for CO oxidation with the O atom coordinated to the Fe cation is only 47 kJ/mol, which is much lower than the barrier for CO oxidation at the Pd3O/CeO2 surface (80 kJ/mol). We computed the barriers for the other reactions occurring at the Pd–CeO2 interface. N2O adsorption is stronger at the oxygen vacancy on the Pd3O/Fe-CeO2_VO model (Eads = −85 kJ/mol) than on the Pd3O/CeO2_VO model (Eads = −49 kJ/mol). The barrier on both models for decomposing adsorbed N2O is negligible. To keep the model tractable, we assume that all other elementary reaction steps occurring solely on the Pd3 cluster have similar reaction energetics as for the Pd3 cluster on the undoped CeO2 support.
Figure 6.

Structural models of the Pd3O clusters on (a) Fe-doped CeO2(111) surface and (b) Fe-doped CeO2 (111) with a ceria surface oxygen vacancy (color code: gray, Ce; pink, O; red, activated O; turquoise, Pd; purple, Fe). The dashed circles represent surface oxygen vacancies.
Microkinetics Simulations on Pd3/Fe-CeO2
We then carried out microkinetics simulations to predict NO conversion and N2 selectivity for the Pd/Fe-CeO2 model (Figure 7). Compared to the NO + CO reaction on Pd/CeO2, the NO conversion at low temperatures and N2 selectivity at intermediate temperatures are increased upon Fe doping (Figure 7a). The higher NO conversion can be linked to the increased amount of surface oxygen vacancies at the Fe-doped interface. The unaltered chemistry on the Pd3O site leads to the conversion of CO + 2NO → CO2 + N2O. Whereas, at lower temperatures, N2O is decomposed mainly on Pd3/CeO2, nearly all N2O is decomposed on surface oxygen vacancies for the Pd3/Fe-CeO2 case. Thus, the NO to N2O reaction on Pd3 is less inhibited by competitive adsorption of N2O and reoxidation of Pd3 to Pd3O (Figure S11). This is caused by the overall lower barrier of N2O decomposition on the surface oxygen vacancy in comparison with Pd3. The higher N2 selectivity at intermediate temperatures compared to the Fe-free model is, therefore, due to the faster removal of the O atom from the Fe-doped CeO2 surface. This is also consistent with the dominant Pd3/Fe-CeO2_VO (T2d) intermediate in the intermediate temperature range (Figure S12).
Figure 7.

NO conversion and N2 selectivity on Pd/Fe-CeO2 predicted by microkinetics simulations: (a) NO + CO reaction (PCO = PNO = 0.01 atm) and (b) NO + CO + H2 reaction (PCO = PNO = 0.01 atm, PH2 = 0.005 atm, symbol: open circles and triangles) and NO + CO reaction with excess of CO (PCO = 0.015 atm, PNO = 0.01 atm, symbol: closed circles and triangles).
Therefore, these simulations show that Fe-doping activates surface O atoms in the CeO2 surface, resulting in a faster generation of oxygen vacancies to decompose the N2O intermediate product at relatively low temperatures. The N2 selectivity is, however, still limited by the faster rate of NO reduction to N2O in comparison to O removal from the Fe-CeO2 surface. Under rich conditions (Figure 7b), NO conversion is considerably improved due to the easier reduction of Pd3O/Fe-CeO2 to Pd3/Fe-CeO2. Most striking, however, is the strongly increased N2 selectivity below 200 °C due to the rich conditions in comparison to the stoichiometric conditions. This is caused by the faster removal of O atoms of the Fe-modified CeO2 surface, resulting in oxygen vacancies that can rapidly decompose N2O. We verified that a rich mixture of NO and CO, in which the CO partial pressure is the same as the combined CO and H2 partial pressures under rich conditions, gave qualitatively similar results (Figure 7b). Although the absence of H2 results in a lower NO conversion, the N2 selectivity below 200 °C is still much higher than obtained under stoichiometric conditions.
Experimental Validation Pd/Fe-CeO2
To validate the above predictions, we prepared a series of Fe-doped CeO2 samples by the FSP method. For the preparation of the ceria supports, a mixture of Ce(acetylacetonate) and Fe(acetylacetonate) was used in the same solvent as for the CeO2 preparation under otherwise similar conditions. All the FSP-prepared CeO2 supports (denoted as Fe-CeO2) exhibited BET surface areas exceeding 150 m2/g (Table 1).
Table 1. Surface Area and Particle Size Determined by Nitrogen Physisorption.
| sample | surface area (m2/g) | particle size (nm) |
|---|---|---|
| CeO2 | 155 | 5.3 |
| Fe(1)-CeO2 | 171 | 4.9 |
| Fe(2)-CeO2 | 177 | 4.7 |
| Fe(5)-CeO2 | 169 | 4.9 |
| Fe(10)-CeO2 | 166 | 5 |
| Fe(20)-CeO2 | 155 | 5.5 |
TEM micrographs of selected samples confirm that the primary Fe-CeO2 particles have a similar size as the reference CeO2 sample. Compared to CeO2, the Fe-CeO2 samples have a rounder shape (Figure 8). A similar influence of doping cations on the CeO2 morphology was observed before for FSP-prepared Ti-doped CeO2.60
Figure 8.

(Left) TEM pictures of CeO2, Fe(5)-CeO2, Fe(10)-CeO2, and Fe(20)-CeO2, average particle size, and particle size distribution histograms. (Right) H2-TPR traces for the CeO2 and Fe-doped CeO2 samples.
The small changes in the surface area upon Fe loading are consistent with the variations in the average particle size determined by TEM. No clear evidence for separate Fe-oxide phases can be derived from the TEM images, suggesting that Fe-oxide is likely to be finely dispersed or incorporated into the CeO2 support. Diffuse reflectance UV–visible (DRUV-Vis) spectra (Figure S13) show bands between 200 and 400 nm, which belong to CeO2 and supports a high dispersion of Fe.54 The Fe-doped samples display a minor absorption in the visible region with increasing Fe content, indicative of some agglomeration of the Fe species. All the CeO2 supports exhibit the typical fluorite structure (Fm3m space group, ICCD card 43-1002) with characteristic broadened diffraction peaks due to a small crystallite size (Figure S14). Inspection of the most intense CeO2 reflection reveals a systematic shift as a function of Fe loading. The shift of the reflection to a higher diffraction angle points to a contraction of the CeO2 lattice, which evidences the inclusion of the smaller Fe3+ ion (as compared to Ce4+) and the formation of a solid solution. These data agree with the DFT calculations that show that Fe doping of CeO2 results in a distortion of the CeO2 lattice. A Bader charge analysis shows that the doped Fe ion has the 3+ oxidation state.
In order to evaluate the extent of metal–support interactions between Fe and CeO2 and the Fe reducibility, we carried out H2 temperature-programmed reduction (TPR) measurements for the Fe-CeO2 catalysts. The TPR profile of CeO2 contains two main reduction features (Figure 8, right). The first broad one between 300 and 550 °C represents the reduction of CeO2 surface lattice O, while the second feature above 650 °C can be attributed to bulk reduction of CeO2.61 The introduction of Fe changes the TPR profiles substantially. Fe doping of CeO2 results in a significant shift of the surface O reduction peak to lower temperatures. The surface O removal already starts at 200 °C and ends around 400 °C. In contrast, the presence of Fe has a little influence on the bulk reduction feature at low Fe loading. This result is consistent with the significant decrease in the O binding energy upon replacement of Ce4+ in the surface with Fe3+ as predicted by DFT. Only when more than 5% of Ce is replaced by Fe that an additional TPR feature due to Fe2O3 reduction is observed. This shows that small Fe2O3 domains are present on the CeO2 support at higher Fe loadings.
We then prepared 1 wt % Pd catalysts on the Fe-modified CeO2 supports by a similar conventional wet impregnation as used before for obtaining Pd/CeO2. HAADF-STEM images combined with EDX maps (Figure 9) showed neither Pd or Fe-oxide nanoparticles, confirming that the high dispersion of Pd observed for Pd/CeO2 is maintained for the Pd/Fe-CeO2 supports.
Figure 9.

HAADF-STEM and EDX-mapping images of the Pd/Fe(10)-CeO2 catalyst.
We first evaluated the performance of the Pd/Fe-CeO2 catalysts in CO oxidation (Figure 10). While the reference Pd/SiO2 sample is only active above 175 °C, all the CeO2-supported Pd catalysts display good catalytic performance at much lower temperatures. The bare Fe(10)-CeO2 support exhibits a low CO oxidation activity, indicating that the higher CO oxidation activity of the Pd/Fe-CeO2 catalysts in comparison to Pd/CeO2 does not stem from the presence of Fe solely. The CO oxidation activity of the Pd/Fe-CeO2 samples increased with Fe content between 1 and 5% and then leveled off. This indicates that the synergetic effect between Pd and Fe is due to Fe doping in the ceria surface. It is interesting to note that full CO conversion was already reached around 125 °C for the optimum samples, which is also a benefit with respect to the 150 °C light-off challenge for automotive exhaust neutralizers.62 As our DFT calculations show that Fe doping of CeO2 leads to activation of surface O, we speculate that the reaction shifts from a Langmuir–Hinshelwood mechanism on Pd/CeO2 to a Mars–van Krevelen one for the Pd/Fe-CeO2 catalysts.
Figure 10.
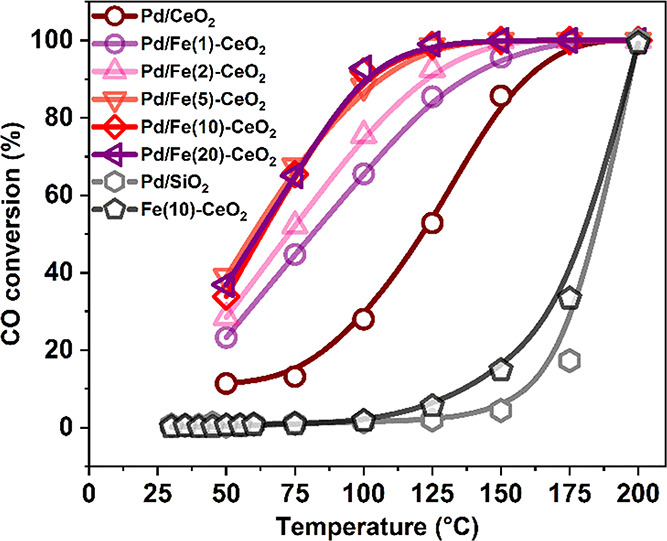
CO conversion for the CO + O2 reaction for Pd/CeO2, Pd/SiO2, Fe(10)-CeO2, and Pd/Fe-CeO2 catalysts (PCO = PO2 = 0.01 atm).
Figure 11 shows the catalytic data for the NO + CO reaction under stoichiometric and rich conditions for the Pd/Fe-CeO2 and Pd/CeO2 catalysts. All samples show a high activity in NO conversion to N2O at low temperatures. Although the differences are relatively small, the NO conversion shows a similar trend with Fe content as the CO oxidation activity. Under stoichiometric conditions, the presence of Fe has a small positive influence on the N2 selectivity. In line with the microkinetics simulations, operation under rich conditions leads to a slightly higher NO conversion at low temperatures and a significantly improved N2 selectivity at intermediate temperatures. The temperature at which 50% N2 selectivity is reached shifts from 225 °C for Pd/CeO2 to 175 °C for Pd/Fe(20)-CeO2. Full conversion of NO to N2 is achieved already below 200 °C for the optimum sample.
Figure 11.

(a) NO conversion and N2 selectivity for the NO + CO reaction on Pd/Fe-CeO2 catalysts (PCO = PNO = 0.01 atm). (b) NO conversion and N2 selectivity for the NO + CO + H2 reaction on Pd/Fe-CeO2 catalysts (PCO = PNO = 0.01 atm, PH2 = 0.005 atm).
To follow the redox dynamics of the catalyst under reaction conditions, we performed an in situ XAS study of the Pd/Fe(10)-CeO2 and Pd/CeO2 samples at Pd K-edge. These catalysts were calcined at 300 °C followed by cooling to room temperature and exposure to the reaction mixture CO + NO (+ H2). The EXAFS spectra were collected at room temperature to minimize thermal disorder. EXAFS results are summarized in Figure S3 and Tables S1–S5. The corresponding X-ray absorption near edge structure (XANES) spectra recorded during calcination and reaction as a function of temperature were analyzed by the linear combination fitting (LCF) analysis to obtain information on the oxidation state of palladium (Figure S15) as a function of reaction conditions. During CO + NO reaction, Pd is partially reduced and, at 200 °C, about 40–50% of Pd is in metallic form. The reaction in a rich feed (CO + NO + H2) resulted in an even higher reduction degree of Pd. It should be noted that the Pd/Fe(10)-CeO2 sample is more prone to reduction than Pd/CeO2. This points to a higher reducibility of the Fe-doped system inferred earlier from H2-TPR results. Calcination of the reduced catalysts at 300 °C led to almost complete reoxidation and redispersion of Pd according to EXAFS analysis (Figure S3), indicating that no severe sintering takes place under reaction conditions.
Based on these results, we can conclude that the role of Fe doping in the ceria lattice is to facilitate the reducibility of the surface oxygen atoms, which was theoretically predicted by DFT. These oxygen vacancies play an important role as active sites for N2O decomposition at relatively low temperatures. Our findings also suggest that PdO is easier reduced when the CeO2 surface is doped with Fe. The catalytic data underpin that slightly reducing conditions are preferred to obtain a slightly reduced surface for efficient NO reduction. A similar performance in terms of N2 selectivity at low temperatures was recently reported for supported PdCu alloys.63 The benefit of the Pd/Fe-CeO2 catalysts described in our work is the higher PGM utilization efficiency.
Finally, we verified that the microkinetics prediction in Figure 7b that increased N2 selectivity at low temperatures under rich conditions can also be achieved in excess CO. To this end, we carried out additional catalytic experiments and microkinetics simulations for the CO + N2O reaction. Figure 12a shows that the N2O decomposition activity of the Pd/Fe(10)-CeO2 catalysts is higher than that of the Pd/CeO2 sample. The microkinetics simulations in Figure 12b confirm that N2O decomposition for the Fe-doped Pd3/Fe-CeO2 model occurs at lower temperatures than the Pd3/CeO2 model. Analysis of the microkinetics shows that the higher N2O decomposition activity is due to an increased concentration of ceria oxygen vacancies on Fe-CeO2.
Figure 12.

N2O conversion for the N2O + CO reaction on Pd/CeO2 and Pd/Fe-CeO2: (a) experimental comparison of Pd/CeO2 and Pd/Fe(10)-CeO2 and (b) computational predictions for Pd3/CeO2 and Pd3/Fe-CeO2 (PCO = PN2O = 0.01 atm).
Conclusions
We employed DFT calculations and first-principles-based microkinetic simulations to understand the reaction mechanism of NO reduction with CO and H2 by small Pd clusters supported on CeO2. Direct and H-assisted NO dissociation pathways exhibit very high barriers. The preferred pathway is NO dimerization to N2O2 on a small reduced Pd3 cluster followed by N2O2 decomposition to N2O and reoxidation of the Pd3 cluster. This can explain the observation that the main product of NO reduction is N2O at low temperatures for Pd/CeO2. N2O decomposition to N2 does not occur until at intermediate temperatures N2O is decomposed on reduced Pd3, which limits NO conversion, and on reduced CeO2. The preferred surface for reduction of NO to N2 with CO under slightly rich conditions is a reduced Pd cluster on a defective CeO2 support. Then, N2O decomposition over the defect sites on CeO2 is favored over Pd3. Doping CeO2 with Fe can improve the low-temperature N2 selectivity of Pd/CeO2. The lower O binding energy results in activation of ceria lattice O atoms. Microkinetics simulations predict a significantly lower onset temperature of N2O decomposition. These theoretical simulations were validated by synthesizing Fe-doped CeO2 by flame spray pyrolysis. Catalysts containing 1 wt % Pd on these supports displayed improved N2 selectivity below 200 °C under slightly rich conditions. An important corollary of this work is that transition metal doping of CeO2 can activate surface O atoms for environmental catalysis.
Acknowledgments
This study has received funding from the European Union’s Horizon 2020 research and innovation programme under grant no. 686086 (Partial-PGMs). The supercomputing facilities used in the calculations were supported by the Netherlands Organization for Scientific Research. Solliance and the Dutch province of Noord-Brabant are acknowledged for funding the STEM facility.
Supporting Information Available
The Supporting Information is available free of charge at https://pubs.acs.org/doi/10.1021/acscatal.1c00564.
Methods of characterization and microkinetics simulations, XRD and EXAFS data for the relevant samples, DFT-computed energy profiles for reaction pathways, microkinetics simulations predicted NO and CO conversion, reaction network analysis and coverage distribution, DRUV-Vis spectra for the FSP-made supports, and XANES data (PDF)
Author Contributions
# L.Z., G.S., and V.M. contributed equally.
The authors declare no competing financial interest.
Supplementary Material
References
- Getsoian A.; Theis J. R.; Paxton W. A.; Lance M. J.; Lambert C. K. Remarkable Improvement in Low Temperature Performance of Model Three-Way Catalysts Through Solution Atomic Layer Deposition. Nat. Catal. 2019, 2, 614–622. 10.1038/s41929-019-0283-x. [DOI] [Google Scholar]
- Sachtler W. M. H.; Ichikawa M. Catalytic Site Requirements for Elementary Steps in Syngas Conversion to Oxygenates over Promoted Rhodium. J. Phys. Chem. 1986, 90, 4752–4758. 10.1021/j100411a009. [DOI] [Google Scholar]
- Skoglundh M.; Johansson H.; Löwendahl L.; Jansson K.; Dahl L.; Hirschauer B. Cobalt-Promoted Palladium as a Three-Way Catalyst. Appl. Catal., B 1996, 7, 299–319. 10.1016/0926-3373(95)00049-6. [DOI] [Google Scholar]
- Host R.; Moilanen P.; Fried M.; Bogi B.. Exhaust System Thermal Management: A Process to Optimize Exhaust Enthalpy for Cold Start Emissions Reduction. SAE tech. pap., SAE; 2017, 01-0141, 10.4271/2017-01-0141. [DOI] [Google Scholar]
- Wang Y.; Oord R.; van den Berg D.; Weckhuysen B. M.; Makkee M. Oxygen Vacancies in Reduced Rh/ and Pt/Ceria for Highly Selective and Reactive Reduction of NO into N2 in Excess of O2. ChemCatChem 2017, 9, 2935–2938. 10.1002/cctc.201700578. [DOI] [Google Scholar]
- Auckenthaler T. S.; Onder C. H.; Geering H. P.; Frauhammer J. Modeling of a Three-Way Catalytic Converter with Respect to Fast Transients of λ-sensor Relevant Exhaust Gas Components. Ind. Eng. Chem. Res. 2004, 43, 4780–4788. 10.1021/ie034242u. [DOI] [Google Scholar]
- Zhang L.; Filot I. A. W.; Su Y.-Q.; Liu J.-X.; Hensen E. J. M. Understanding the Impact of Defects on Catalytic CO Oxidation of LaFeO3-Supported Rh, Pd, and Pt Single-Atom Catalysts. J. Phys. Chem. C 2019, 123, 7290–7298. 10.1021/acs.jpcc.9b01520. [DOI] [PMC free article] [PubMed] [Google Scholar]
- Zhao M.; Deng J.; Liu J.; Li Y.; Liu J.; Duan Z.; Xiong J.; Zhao Z.; Wei Y.; Song W.; Sun Y. Roles of Surface-Active Oxygen Species on 3DOM Cobalt-Based Spinel Catalysts MxCo3–xO4 (M = Zn and Ni) for NOx-Assisted Soot Oxidation. ACS Catal. 2019, 9, 7548–7567. 10.1021/acscatal.9b01995. [DOI] [Google Scholar]
- Cheng G.; Tan X.; Song X.; Chen X.; Dai W.; Yuan R.; Fu X. Visible Light Assisted Thermocatalytic Reaction of CO + NO over Pd/LaFeO3. Appl. Catal., B 2019, 251, 130–142. 10.1016/j.apcatb.2019.03.029. [DOI] [Google Scholar]
- Jeon J.; Kon K.-i.; Toyao T.; Shimizu K.-i.; Furukawa S. Design of Pd-Based Pseudo-Binary Alloy Catalysts for Highly Active and Selective NO Reduction. Chem. Sci. 2019, 10, 4148–4162. 10.1039/C8SC05496G. [DOI] [PMC free article] [PubMed] [Google Scholar]
- Wu Q.; Jing M.; Wei Y.; Zhao Z.; Zhang X.; Xiong J.; Liu J.; Song W.; Li J. High-Efficient Catalysts of Core-Shell Structured Pt@Transition Metal Oxides (TMOs) Supported on 3DOM-Al2O3 for Soot Oxidation: The Effect of Strong Pt-TMO Interaction. Appl. Catal., B 2019, 244, 628–640. 10.1016/j.apcatb.2018.11.094. [DOI] [Google Scholar]
- Liu J.-X.; Su Y.; Filot I. A. W.; Hensen E. J. M. A Linear Scaling Relation for CO Oxidation on CeO2 Supported Pd. J. Am. Chem. Soc. 2018, 140, 4580–4587. 10.1021/jacs.7b13624. [DOI] [PMC free article] [PubMed] [Google Scholar]
- Li F.; Li Y.; Zeng X. C.; Chen Z. Exploration of High-Performance Single-Atom Catalysts on Support M1/FeOx for CO Oxidation via Computational Study. ACS Catal. 2015, 5, 544–552. 10.1021/cs501790v. [DOI] [Google Scholar]
- DeRita L.; Dai S.; Lopez-Zepeda K.; Pham N.; Graham G. W.; Pan X.; Christopher P. Catalyst Architecture for Stable Single Atom Dispersion Enables Site-Specific Spectroscopic and Reactivity Measurements of CO Adsorbed to Pt Atoms, Oxidized Pt Clusters, and Metallic Pt Clusters on TiO2. J. Am. Chem. Soc. 2017, 139, 14150–14165. 10.1021/jacs.7b07093. [DOI] [PubMed] [Google Scholar]
- Qiao B.; Wang A.; Yang X.; Allard L. F.; Jiang Z.; Cui Y.; Liu J.; Li J.; Zhang T. Single-Atom Catalysis of CO Oxidation Using Pt1/FeOx. Nat. Chem. 2011, 3, 634. 10.1038/nchem.1095. [DOI] [PubMed] [Google Scholar]
- Therrien A. J.; Groden K.; Hensley A. J. R.; Schilling A. C.; Hannagan R. T.; Marcinkowski M. D.; Pronschinske A.; Lucci F. R.; Sykes E. C. H.; McEwen J.-S. Water Activation by Single Pt Atoms Supported on a Cu2O Thin Film. J. Catal. 2018, 364, 166–173. 10.1016/j.jcat.2018.04.024. [DOI] [Google Scholar]
- Wang C.; Gu X.-K.; Yan H.; Lin Y.; Li J.; Liu D.; Li W.-X.; Lu J. Water-Mediated Mars–van Krevelen Mechanism for CO Oxidation on Ceria-Supported Single-Atom Pt1 Catalyst. ACS Catal. 2017, 7, 887–891. 10.1021/acscatal.6b02685. [DOI] [Google Scholar]
- Daelman N.; Capdevila-Cortada M.; López N. Dynamic Charge and Oxidation State of Pt/CeO2 Single-Atom Catalysts. Nat. Mater. 2019, 18, 1215–1221. 10.1038/s41563-019-0444-y. [DOI] [PubMed] [Google Scholar]
- Nie L.; Mei D.; Xiong H.; Peng B.; Ren Z.; Hernandez X. I. P.; DeLaRiva A.; Wang M.; Engelhard M. H.; Kovarik L.; Datye A. K.; Wang Y. Activation of Surface Lattice Oxygen in Single-Atom Pt/CeO2 for Low-Temperature CO Oxidation. Science 2017, 358, 1419–1423. 10.1126/science.aao2109. [DOI] [PubMed] [Google Scholar]
- Spezzati G.; Benavidez A. D.; DeLaRiva A. T.; Su Y.; Hofmann J. P.; Asahina S.; Olivier E. J.; Neethling J. H.; Miller J. T.; Datye A. K.; Hensen E. J. M. CO Oxidation by Pd Supported on CeO2 (100) and CeO2 (111) Facets. Appl. Catal., B 2019, 243, 36–46. 10.1016/j.apcatb.2018.10.015. [DOI] [Google Scholar]
- Gulyaev R. V.; Stadnichenko A. I.; Slavinskaya E. M.; Ivanova A. S.; Koscheev S. V.; Boronin A. I. In situ Preparation and Investigation of Pd/CeO2 Catalysts for the Low-Temperature Oxidation of CO. Appl. Catal., A 2012, 439-440, 41–50. 10.1016/j.apcata.2012.06.045. [DOI] [Google Scholar]
- Li G.; Li L.; Yuan Y.; Shi J.; Yuan Y.; Li Y.; Zhao W.; Shi J. Highly Efficient Mesoporous Pd/CeO2 Catalyst for Low Temperature CO Oxidation Especially under Moisture Condition. Appl. Catal., B 2014, 158-159, 341–347. 10.1016/j.apcatb.2014.04.030. [DOI] [Google Scholar]
- Roy S.; Hegde M. S. Pd Ion Substituted CeO2: A Superior De-NOx Catalyst to Pt or Rh Metal Ion Doped Ceria. Catal. Commun. 2008, 9, 811–815. 10.1016/j.catcom.2007.09.019. [DOI] [Google Scholar]
- Wang Y.; Kapteijn F.; Makkee M. NOx Reduction in the Di-Air System over Noble Metal Promoted Ceria. Appl. Catal., B 2018, 231, 200–212. 10.1016/j.apcatb.2018.02.004. [DOI] [Google Scholar]
- Ueda K.; Tsuji M.; Ohyama J.; Satsuma A. Tandem Base-Metal Oxide Catalyst: Superior NO Reduction Performance to the Rh Catalyst in NO + C3H6 + CO + O2. ACS Catal. 2019, 9, 2866–2869. 10.1021/acscatal.9b00526. [DOI] [Google Scholar]
- Ding W.-C.; Gu X.-K.; Su H.-Y.; Li W.-X. Single Pd Atom Embedded in CeO2(111) for NO Reduction with CO: A First-Principles Study. J. Phys. Chem. C 2014, 118, 12216–12223. 10.1021/jp503745c. [DOI] [Google Scholar]
- Ryou Y.; Lee J.; Lee H.; Kim C. H.; Kim D. H. Low Temperature NO Adsorption over Hydrothermally Aged Pd/CeO2 for Cold Start Application. Catal. Today 2018, 307, 93–101. 10.1016/j.cattod.2017.02.025. [DOI] [Google Scholar]
- Hu Q.; Cao K.; Lang Y.; Chen R.; Chu S.; Jia L.; Yue J.; Shan B. Improved NO–CO Reactivity of Highly Dispersed Pt Particles on CeO2 Nanorod Catalysts Prepared by Atomic Layer Deposition. Catal. Sci. Technol. 2019, 9, 2664–2672. 10.1039/C9CY00212J. [DOI] [Google Scholar]
- Zhang X.; Cheng X.; Ma C.; Wang Z. Effects of the Fe/Ce Ratio on the Activity of CuO/CeO2–Fe2O3 Catalysts for NO Reduction by CO. Catal. Sci. Technol. 2018, 8, 3336–3345. 10.1039/C8CY00709H. [DOI] [Google Scholar]
- Zabilskiy M.; Djinović P.; Erjavec B.; Dražić G.; Pintar A. Small CuO Clusters on CeO2 Nanospheres as Active Species for Catalytic N2O Decomposition. Appl. Catal., B 2015, 163, 113–122. 10.1016/j.apcatb.2014.07.057. [DOI] [Google Scholar]
- Konsolakis M. Recent Advances on Nitrous Oxide (N2O) Decomposition over Non-Noble-Metal Oxide Catalysts: Catalytic Performance, Mechanistic Considerations, and Surface Chemistry Aspects. ACS Catal. 2015, 5, 6397–6421. 10.1021/acscatal.5b01605. [DOI] [Google Scholar]
- Ramsier R. D.; Gao Q.; Waltenburg H. N.; Yates J. T. Jr. Thermal Dissociation of NO on Pd Surfaces: The Influence of Step Sites. J. Chem. Phys. 1994, 100, 6837–6845. 10.1063/1.467043. [DOI] [Google Scholar]
- Vesecky S. M.; Rainer D. R.; Goodman D. W. Basis for the Structure Sensitivity of the CO + NO Reaction on Palladium. J. Vac. Sci. Technol.A 1996, 14, 1457–1463. 10.1116/1.579969. [DOI] [Google Scholar]
- Cargnello M.; Doan-Nguyen V. V. T.; Gordon T. R.; Diaz R. E.; Stach E. A.; Gorte R. J.; Fornasiero P.; Murray C. B. Control of Metal Nanocrystal Size Reveals Metal-Support Interface Role for Ceria Catalysts. Science 2013, 341, 771–773. 10.1126/science.1240148. [DOI] [PubMed] [Google Scholar]
- Liu L.; Cao Y.; Sun W.; Yao Z.; Liu B.; Gao F.; Dong L. Morphology and Nanosize Effects of Ceria from Different Precursors on the Activity for NO Reduction. Catal. Today 2011, 175, 48–54. 10.1016/j.cattod.2011.04.018. [DOI] [Google Scholar]
- Kresse G.; Hafner J. Ab Initio Molecular Dynamics for Liquid Metals. Phys. Rev. B 1993, 47, 558–561. 10.1103/PhysRevB.47.558. [DOI] [PubMed] [Google Scholar]
- Kresse G.; Furthmüller J. Efficient Iterative Schemes for Ab Initio Total-Energy Calculations Using a Plane-Wave Basis Set. Phys. Rev. B 1996, 54, 11169–11186. 10.1103/PhysRevB.54.11169. [DOI] [PubMed] [Google Scholar]
- Blöchl P. E. Projector Augmented-Wave Method. Phys. Rev. B 1994, 50, 17953–17979. 10.1103/PhysRevB.50.17953. [DOI] [PubMed] [Google Scholar]
- Perdew J. P.; Burke K.; Ernzerhof M. Generalized Gradient Approximation Made Simple. Phys. Rev. Lett. 1996, 77, 3865–3868. 10.1103/PhysRevLett.77.3865. [DOI] [PubMed] [Google Scholar]
- Fabris S.; de Gironcoli S.; Baroni S.; Vicario G.; Balducci G. Taming Multiple Valency with Density Functionals: A Case Study of Defective Ceria. Phys. Rev. B 2005, 71, 041102 10.1103/PhysRevB.71.041102. [DOI] [Google Scholar]
- Cococcioni M.; de Gironcoli S. Linear Response Approach to the Calculation of the Effective Interaction Parameters in the LDA + U Method. Phys. Rev. B 2005, 71, 035105 10.1103/PhysRevB.71.035105. [DOI] [Google Scholar]
- Henkelman G.; Uberuaga B. P.; Jónsson H. A Climbing Image Nudged Elastic Band Method for Finding Saddle Points and Minimum Energy Paths. J. Chem. Phys. 2000, 113, 9901–9904. 10.1063/1.1329672. [DOI] [Google Scholar]
- Filot I. A. W. Z. B.; Hensen E. J. M.. MKMCXX, a C++ Program for Constructing Microkinetic Models.http://www.mkmcxx.nl (accessed August 01, 2020).
- Zijlstra B.; Broos R. J. P.; Chen W.; Filot I. A. W.; Hensen E. J. M. First-principles Based Microkinetic Modeling of Transient Kinetics of CO Hydrogenation on Cobalt Catalysts. Catal. Today 2020, 342, 131–141. 10.1016/j.cattod.2019.03.002. [DOI] [Google Scholar]
- Filot I. A. W.; Broos R. J. P.; van Rijn J. P. M.; van Heugten G. J. H. A.; v an Santen R. A.; Hensen E. J. M. First-principles-Based Microkinetics Simulations of Synthesis Gas Conversion on a Stepped Rhodium Surface. ACS Catal. 2015, 5, 5453–5467. 10.1021/acscatal.5b01391. [DOI] [Google Scholar]
- Mai H.-X.; Sun L.-D.; Zhang Y.-W.; Si R.; Feng W.; Zhang H.-P.; Liu H.-C.; Yan C.-H. Shape-Selective Synthesis and Oxygen Storage Behavior of Ceria Nanopolyhedra, Nanorods, and Nanocubes. J. Phys. Chem. B 2005, 109, 24380–24385. 10.1021/jp055584b. [DOI] [PubMed] [Google Scholar]
- Spezzati G.; Su Y.; Hofmann J. P.; Benavidez A. D.; DeLaRiva A. T.; McCabe J.; Datye A. K.; Hensen E. J. M. Atomically Dispersed Pd–O Species on CeO2 (111) as Highly Active Sites for Low-Temperature CO Oxidation. ACS Catal. 2017, 7, 6887–6891. 10.1021/acscatal.7b02001. [DOI] [PMC free article] [PubMed] [Google Scholar]
- Zhang L.; Filot I. A. W.; Su Y.-Q.; Liu J.-X.; Hensen E. J. M. Transition Metal Doping of Pd(111) for the NO + CO Reaction. J. Catal. 2018, 363, 154–163. 10.1016/j.jcat.2018.04.025. [DOI] [Google Scholar]
- Loffreda D.; Simon D.; Sautet P. Structure Sensitivity for NO Dissociation on Palladium and Rhodium Surfaces. J. Catal. 2003, 213, 211–225. 10.1016/S0021-9517(02)00030-1. [DOI] [Google Scholar]
- Shetty S.; Jansen A. P. J.; van Santen R. A. Direct Versus Hydrogen-Assisted CO Dissociation. J. Am. Chem. Soc. 2009, 131, 12874–12875. 10.1021/ja9044482. [DOI] [PubMed] [Google Scholar]
- Li G.; Smith R. L.; Inomata H. Synthesis of Nanoscale Ce1-xFexO2 Solid Solutions via a Low-Temperature Approach. J. Am. Chem. Soc. 2001, 123, 11091–11092. 10.1021/ja016502+. [DOI] [PubMed] [Google Scholar]
- Safavinia B.; Wang Y.; Jiang C.; Roman C.; Darapaneni P.; Larriviere J.; Cullen D. A.; Dooley K. M.; Dorman J. A. Enhancing CexZr1–xO2 Activity for Methane Dry Reforming Using Subsurface Ni Dopants. ACS Catal. 2020, 10, 4070–4079. 10.1021/acscatal.0c00203. [DOI] [Google Scholar]
- Kim H. Y.; Henkelman G. CO Oxidation at the Interface between Doped CeO2 and Supported Au Nanoclusters. J. Phys. Chem. Lett. 2012, 3, 2194–2199. 10.1021/jz300631f. [DOI] [PubMed] [Google Scholar]
- Laguna O. H.; Centeno M. A.; Boutonnet M.; Odriozola J. A. Fe-doped Ceria Solids Synthesized by the Microemulsion Method for CO Oxidation Reactions. Appl. Catal., B 2011, 106, 621–629. 10.1016/j.apcatb.2011.06.025. [DOI] [Google Scholar]
- Sudarsanam P.; Mallesham B.; Reddy P. S.; Großmann D.; Grünert W.; Reddy B. M. Nano-Au/CeO2 Catalysts for CO Oxidation: Influence of Dopants (Fe, La and Zr) on the Physicochemical Properties and Catalytic Activity. Appl. Catal., B 2014, 144, 900–908. 10.1016/j.apcatb.2013.08.035. [DOI] [Google Scholar]
- Su Y.-Q.; Liu J.-X.; Filot I. A. W.; Zhang L.; Hensen E. J. M. Highly Active and Stable CH4 Oxidation by Substitution of Ce4+ by Two Pd2+ Ions in CeO2 (111). ACS Catal. 2018, 8, 6552–6559. 10.1021/acscatal.8b01477. [DOI] [PMC free article] [PubMed] [Google Scholar]
- Beckers J.; Rothenberg G. Redox Properties of Doped and Supported Copper–Ceria Catalysts. Dalton Trans. 2008, 6573–6578. 10.1039/b809769k. [DOI] [PubMed] [Google Scholar]
- Zhu H.; Chen Y.; Wang Z.; Liu W.; Wang L. Catalytic Oxidation of CO over Mesoporous Copper-Doped Ceria Catalysts via a Facile CTAB-Assisted Synthesis. RSC Adv. 2018, 8, 14888–14897. 10.1039/C8RA02327A. [DOI] [PMC free article] [PubMed] [Google Scholar]
- Wang J.; Zhang B.; Shen M.; Wang J.; Wang W.; Ma J.; Liu S.; Jia L. Effects of Fe-Doping of Ceria-Based Materials on Their Microstructural and Dynamic Oxygen Storage and Release Properties. J. Sol-Gel Sci. Technol. 2011, 58, 259–268. 10.1007/s10971-010-2386-3. [DOI] [Google Scholar]
- Feng X.; Sayle D. C.; Wang Z. L.; Paras M. S.; Santora B.; Sutorik A. C.; Sayle T. X. T.; Yang Y.; Ding Y.; Wang X.; Her Y.-S. Converting Ceria Polyhedral Nanoparticles into Single-Crystal Nanospheres. Science 2006, 312, 1504–1508. 10.1126/science.1125767. [DOI] [PubMed] [Google Scholar]
- Zhu H.; Qin Z.; Shan W.; Shen W.; Wang J. Pd/CeO2–TiO2 Catalyst for CO Oxidation at Low Temperature: A TPR Atudy with H2 and CO as Reducing Agents. J. Catal. 2004, 225, 267–277. 10.1016/j.jcat.2004.04.006. [DOI] [Google Scholar]
- Lambert C. K. Current State of the Art and Future Needs for Automotive Exhaust Catalysis. Nat. Catal. 2019, 2, 554–557. 10.1038/s41929-019-0303-x. [DOI] [Google Scholar]
- Xing F.; Jeon J.; Toyao T.; Shimizu K.-i.; Furukawa S. A Cu–Pd Single-Atom Alloy Catalyst for Highly Efficient NO Reduction. Chem. Sci. 2019, 10, 8292–8298. 10.1039/C9SC03172C. [DOI] [PMC free article] [PubMed] [Google Scholar]
Associated Data
This section collects any data citations, data availability statements, or supplementary materials included in this article.