

Abstract
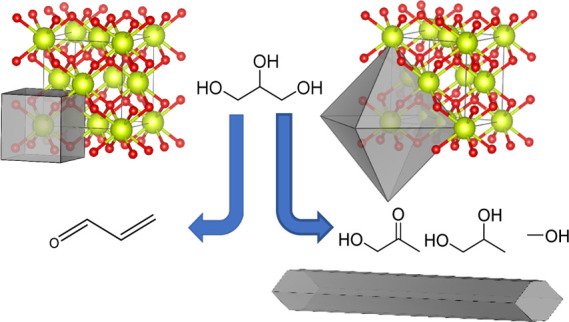
Glycerol solutions were vaporized and reacted over ceria catalysts with different morphologies to investigate the relationship of product distribution to the surface facets exposed, particularly, the yield of bio-renewable methanol. Ceria was prepared with cubic, rodlike, and polyhedral morphologies via hydrothermal synthesis by altering the concentration of the precipitating agent or synthesis temperature. Glycerol conversion was found to be low over the ceria with a cubic morphology, and this was ascribed to both a low surface area and relatively high acidity. Density functional theory calculations also showed that the (100) surface is likely to be hydroxylated under reaction conditions which could limit the availability of basic sites. Methanol space-time-yields over the polyhedral ceria samples were more than four times that for the cubic material at 400 °C, where 201 g of methanol was produced per hour per kilogram of the catalyst. Under comparable glycerol conversions, we show that the rodlike and polyhedral catalysts produce a major intermediate to methanol, hydroxyacetone (HA), with a selectivity of ca. 45%, but that over the cubic sample, this was found to be 15%. This equates to a 13-fold increase in the space-time-yield of HA over the polyhedral samples compared to the cubes at 320 °C. The implications of this difference are discussed with respect to the reaction mechanism, suggesting that a different mechanism dominates over the cubic catalysts to that for rodlike and polyhedral catalysts. The strong association between exposed surface facets of ceria to high methanol yields is an important consideration for future catalyst design in this area.
Keywords: glycerol, methanol, mechanism, ceria, morphology
Introduction
Increased concerns regarding rising CO2 levels and the associated environmental consequences have resulted in increased demands for sustainable liquid biofuels. One of the most widely used biofuels is biodiesel with an annual production of ca. 30 billion liters in 2014, comprising approximately 1.5% of diesel supplies.1 Biodiesel is typically produced through acid- or base-catalyzed transesterification reactions between triglycerides and a simple alcohol, usually methanol, producing fatty acid methyl esters (FAMEs) and glycerol, with the latter accounting for 10% w/w % of the product.2,3 While highly pure glycerol is a valuable platform chemical,4 with uses in numerous industries, crude glycerol derived from FAME production typically contains high levels of impurities such as water, methanol, unreacted long-chain organic molecules, ash and soap, preventing its use in traditional industrial applications of glycerol, for example, personal care, food, and pharmaceuticals.4,5 Accordingly, effective routes for the valorization of crude glycerol are highly desirable to reduce the glycerol surplus and improve the economic viability of biodiesel production.
The valorization of glycerol is not a new concept, with several reviews detailing the progress made in glycerol dehydration,6,7 hydrogenolysis,8−11 oxidation,12,13 gasification,14,15 esterification,16 etherification,17 oligomerization,18 acetylation, and carboxylation.19 The conversion of glycerol into lower alcohols provides an attractive route for glycerol valorization due to their industrial applicability and potential for fuel blends.20 van Ryneveld et al. reported alcohol selectivities exceeding 68% (methanol, ethanol, and propanol combined) over Ni/SiO2 catalysts, at a reaction temperature of 320 °C and 60 bar H2.21 A similar study by Friedrich and co-workers showed that Mo and W catalysts supported on alumina and silica could be used to convert glycerol to lower alcohols,22 with a total mono-alcohol (methanol, ethanol, 1-propanol, and 2-propanol) selectivity of >85% at 325 °C and 60 bar H2. An ethanol space-time-yield of 1.45 gethanol kgcat–1 h–1 was reported by Hou and co-workers23 over a CoZnO-ZIF-based catalyst, corresponding to an ethanol selectivity of ca. 58% obtained at 20 bar H2 and 210 °C. Methanol has also been produced from glycerol under supercritical conditions, although harsh reaction conditions were required with both elevated temperatures and pressures (350–475 °C and 250–450 bar).24
We have previously demonstrated that under certain reaction conditions, aqueous glycerol solutions can be converted into crude methanol mixtures in the gas phase over simple basic and redox metal oxide catalysts, such as CeO2 and MgO, without the need for an external reductant.25−27 In our previous studies, we have shown that the reaction conditions strongly influence methanol selectivity, with relatively high reaction temperatures required to achieve high glycerol conversion and methanol yield.
Since Yan and co-workers demonstrated the shape-selective synthesis of ceria nanocrystals, with nanocubes, nanorods, and nanopolyhedra, synthesized by the hydrothermal treatment of Ce(NO3)3 with NaOH at varying concentrations and temperatures, the effect of the morphology of ceria nanocrystals on their catalytic activity has been the focus of much attention.41,28−30 Numerous studies have shown that ceria morphology and surface termination can significantly influence redox,31 acid–base,32 and defect properties.33,34 The effect of the ceria morphology on catalytic activity has been studied for numerous reactions, including examples for which CeO2 itself is the catalyst, and those in which CeO2 is a catalyst support. In both cases, the ceria morphology has been shown to significantly influence both catalyst activity and selectivity.35−39 Pérez-Ramírez and co-workers showed that the (100) surface, predominantly exposed in nanocubes, gives the highest activity for CO oxidation, whereas the (111) surface, which is typically the dominant surface in polyhedral, is the optimal surface for ethylene hydrogenation. Indeed, ceria seems to display this difference in the most active facets for oxidation and hydrogenation reactions quite generally.40
We have previously reported on the effect of ceria calcination temperatures and the subsequent physicochemical properties of ceria on the reaction of glycerol, which revealed that there is no clear relationship between the density of defect sites and the reactivity of glycerol or its intermediate products, when samples are compared at a constant space velocity and activity is normalized to catalyst surface area.26 This present work examines the effect of the ceria morphology on the conversion of glycerol and subsequent methanol selectivity. As part of this work, reactor space velocities were adjusted to obtain a constant level of glycerol conversion across ceria nanocubes, nanorods, and nanopolyhedra to investigate differences in product distribution with differing morphologies.
Experimental Section
Materials
Glycerol (≥99.5%), cerium(III) nitrate hexahydrate (99.9% trace metal basis), and sodium hydroxide (99.8%) were purchased from Sigma-Aldrich. Argon gas was supplied by BOC. All purchased materials were used as received. Deionized (DI) water was provided in-house. Silicon carbide (SiC, ≥ 98%) with a grain size of 300–425 μm was obtained from Alfa Aesar, washed with DI water, and dried prior to use.
Catalyst Preparation
The three ceria nanostructures were synthesized in accordance with the hydrothermal procedure reported by Yan and co-workers.41 For all morphologies, Ce(NO3)3·6H2O (10 mmol) was dissolved in DI water (50 mL). NaOH solution (150 mL) of the appropriate concentration was added to the cerium(III) nitrate solution giving a gel-like precipitate which was stirred at room temperature for 10 min. The suspension (total volume 200 mL) was transferred to a PTFE-lined steel autoclave (total capacity of 300 mL) and heated under autogenous pressure at the appropriate temperature to produce the desired morphology. Once fully cooled, the precipitates were collected by centrifugation, washed thoroughly three times with DI water (3 × 500 mL) and once with ethanol (250 mL), dried in vacuo (80 °C; 15 h), and finally calcined in static air at 400 °C for 4 h. The synthesis temperature and concentration of NaOH varied dependent on the desired morphology (rods: [NaOH] = 9 M, T = 100 °C; cubes: [NaOH] = 9 M, T = 180 °C; polyhedra: [NaOH] = 0.13 M, T = 100 °C).
Catalyst Characterization
Powder X-ray diffraction (XRD) analysis of the catalysts was carried out on a PANalytical X’pert Pro powder diffractometer (Malvern Panalytical, Malvern, UK) using a Cu source operated at 40 keV and 40 mA with a Ge(111) monochromator to select Kα1 X-rays. Patterns were analyzed from measurements taken over the 2θ angular range 10–80° (step size of 0.016°).
Thermal gravimetric analysis (TGA) and differential thermal analysis were performed using a Setaram Labsys 1600 instrument. Samples (20–50 mg) were loaded into alumina crucibles and heated to 800 °C (5 °C/min) in a flow of synthetic air (50 mL min–1). For all specified TGA runs, blank runs were subtracted from the relevant data to remove buoyancy effects.
Brunauer–Emmett–Teller (BET) surface area analysis was performed using a QUADRASORB evo surface area and pore size analyzer. 80 point (40 adsorption and 40 desorption points) analysis was performed using N2 as the adsorbate gas at −196 °C. Samples (ca. 300 mg) were degassed under vacuum for 3 h at 200 °C prior to analysis.
Transmission electron microscopy (TEM) and scanning TEM were performed on a JEOL JEM-2100 operating at 200 kV. Energy-dispersive X-ray analysis was carried out using an Oxford Instruments X-MaxN 80 detector, and the data analyzed using the Aztec software. Samples were prepared by a dry dispersion route and loaded on to 300 mesh copper grids coated with holey carbon films after grinding between glass slides. Particle size analysis was performed by counting 200–250 particles using ImageJ software.
Hydrogen-programmed temperature reduction (TPR) was performed to estimate the reducibility of the catalysts and was performed using a ChemBet chemisorption analyzer (Quantachrome Instruments) equipped with a thermal conductivity detector (TCD). Samples (100 mg) were placed between two plugs of quartz wool in a U-shaped silica tube and pre-treated by heating to 130 °C (15 °C min–1) for 1 h under flowing He (80 mL min–1). The samples were allowed to cool to room temperature before being heated to 900 °C (10 °C min–1) under flowing 5% H2/Ar (30 mL min–1). Samples were reoxidized by repeating the above procedure under a 10% O2/He environment. A second temperature-programmed reduction (TPR) was performed in an identical manner, as the initial analysis, to study any loss of reducibility.
The basicity of the catalysts was investigated by CO2 temperature-programmed desorption (TPD). This was performed using a ChemBet chemisorption analyzer (Quantachrome Instruments) equipped with a TCD. Samples (200 mg) were placed between two plugs of quartz wool in a U-shaped silica tube and pretreated by heating to 130 (15 °C min–1) for 1 h under flowing He (80 mL min–1). CO2 was adsorbed at room temperature for a period of 20 min. Physisorbed CO2 was removed by heating to 110 °C (15 °C min–1) for 1 h under flowing He (80 mL min–1). Chemisorbed CO2 was desorbed by heating to 900 °C (15 °C min–1) for 1 h under flowing He (80 mL min –1); desorbed CO2 was monitored by using a TCD (detector current 180 mV; attenuation 1). The same procedure was followed with NH3 gas to probe acidic sites, using 10% NH3/He as the adsorbate gas. Blank runs were performed without admitting the adsorbate to the sample, resulting in no desorbed species being detected, indicating that the pre-treatment conditions were sufficient to remove adsorbed species and that no catalyst decomposition occurred.
Raman spectroscopy was performed using a Renishaw inVia microscope operated at a wavelength of 514 nm. 10 acquisitions were performed per sample with an exposure time of 10 s; the laser was employed at 1% power.
Density Functional Theory (DFT) Calculations
All calculations presented here were performed using the Vienna Ab initio Simulation Package (VASP) code42 with the core–valence interaction of the electrons represented using the projected augmented wave approach and the valence electronic states expanded in a basis of plane-waves.43 A spin-polarized approach with the Perdew–Burke–Ernzerhof (PBE)44 functional was employed throughout, and the energy cut-off for the expansion of the plane-wave basis set was set to 550 eV. A Hubbard-U term using the Liechtenstein approach45 was used to account for self-interaction effects which are particularly significant for the localized Ce(4f) orbitals. We take the value of Ueff from Loschen et al. who have shown that Ueff(Ce(4f)) = 5 eV gives values for the O 2p–Ce 4f and O 2p–Ce 5d band gaps for bulk CeO2 that agree well with experimental estimates.46 To account for dispersion effects, the Grimme D3 level47 of theory was used.
A convergence criterion for ionic relaxation of 0.01 eV Å–1 was used for geometry optimization calculations. The cubic lattice constant was fitted using a Murnaghan equation of state to a series of structures for which atom co-ordinates were optimized at differing fixed cell volumes at a k-point grid of 13 × 13 × 13 (Figure S1 and Table S1). The optimal cell constant was found to be 5.469 Å which compares well to the experimental value extrapolated to zero pressure (5.411 Å)48 and to the values obtained for the Ce–C, Ce–P, and Ce–R samples in this work (Table 1).
Table 1. Structural and Textural Properties of Morphologically Controlled Ceria.
| sample | morph.a | sizea/nm | exposed planesa | (111) peakb degrees | cryst. sizeb/nm | lattice strainb/% | lattice param.b/nm | surf. areac/m2 g–1 | pore volumec/cm3 g–1 | ave. pore sized/nm |
|---|---|---|---|---|---|---|---|---|---|---|
| Ce–C | cubes | 19.3 ± 2.2 | (100) | 28.434 | 20 | 0.71 | 0.5432 | 23 | 0.159 | 17.1 |
| Ce–R | rods | 90.4 ± 4.6 × 7.1 ± 0.7 | (110),(100) | 28.490 | 8 | 1.72 | 0.5422 | 85 | 0.689 | 30.1 |
| Ce–P | trun. oct. | 10.7 ± 0.9 | (111),(100) | 28.498 | 11 | 1.12 | 0.5421 | 65 | 0.099 | 5.1 |
Measured by high-resolution TEM.
Calculated from the (111) diffraction peak obtained by XRD, Figure S3.
Surface area calculated from N2 adsorption measurements, Figure S6.
Calculated from N2 desorption isotherm, in accordance with the BJH method. Abbreviations: morph. = morphology, cryst. = crystallite, param. = parameter, surf. = surface, and trun. oct. = truncated octahedra.
For surface calculations, the slab approach was used. Slabs were cut from the optimized bulk CeO2 structure, and a vacuum gap of 15 Å was introduced in the direction perpendicular to the slab surface to minimize interaction between images. The most stable surfaces of ceria are (111) and (110).49 The (110) Miller planes in CeO2 are stoichiometric, while the (111) planes can form stoichiometric stacking units consisting of one Ce4+ and two O2– ionic layers, which means that, slab models for the CeO2(111) and CeO2(110) surfaces can be constructed with zero net dipole across the slab simply by choosing the correct truncation positions for the faces of the slab. In contrast, the (100) surface has a nonzero dipole moment normal to the surface for any choice of truncation and so is a type three surface, according to Tasker’s ionic classification.49 To generate the slab model in this case, a slab model of the CeO2(100) surface with outer most O2– atomic layers was created and then half of the O2– anions from the top and from the bottom surfaces of the slab were removed to restore stoichiometry and give a slab with no net dipole moment.
The ideal surfaces were modeled by 2 × 2 supercells with seven atomic layers for (100) and (111), while five atomic layers were found to be sufficient to converge the surface energy of the (110) surface. The surface terminations are shown in Figure S2 which shows the pattern of oxygen vacancies used to produce a stoichiometric slab representation of the CeO2(100) surface. A k-point grid of 3 × 3 × 1 was used for all slab calculations; this choice was made based on the convergence of the surface energy with respect to k-point sampling. The upper three layers of the slab models were relaxed during geometry optimizations, and the remaining layers were held fixed at their bulk positions to represent the restraint placed on the surface by the bulk structure.
The calculated surface energies for the optimized surfaces from these slab models were obtained using an approach taking into account the fixed lower layers50 (eq S4 in Supporting Information, Section S1). We obtain values of (100): 2.06 J m–2 > (110): 1.43 J m–2 > (111): 1.14 J m–2 (Table S2). While this is the same energetic ordering as reported in the literature using the same PBE functionals51 [(100): 1.44 J m–2, (110): 1.06 J m–2, (111): 0.71 J m–2] and found with the PW91 GGA [(100): 1.57 J m–2, (110): 1.05 J m–2, (111): 0.68 J m–2], our values are consistently higher than the earlier work. However, those calculations were carried out without dispersion corrections which would be expected to lead to higher surface energy values since dispersion is an overall attractive energy contribution and atoms at the surface have a reduced number of interactions compared to those in the bulk.
The adsorption energy per adsorbed molecule, Eads, on these surfaces were calculated from the difference between the calculated total energy of the slab with the adsorbed water molecule, Eslab+mol, and the sum of the energies of the pristine slab, Eslab, and the appropriate number, nmol, of single water molecules in the gas phase, that is
| 1 |
A consistent unit cell size and choice of computing parameters were used for both slab and isolated molecule calculations.
To calculate the free energy of hydroxylation for the surfaces, the VASP code was used to evaluate the vibrational modes of the relaxed clean surface, the surface with one monolayer (ML) coverage, and an isolated water molecule. For vibrational calculations of slabs, a single-oxide layer and all adsorbate atoms were included in the degrees of freedom used to form the second derivative matrix. The enthalpy, H, entropy, S, and free energy, G, at a particular temperature, T, and pressure, P, are then calculated using the formulae
| 2 |
| 3 |
| 4 |
where Uelec is the PBE electronic energy of the system calculated by the VASP optimization. The vibrational calculations provide the frequencies for the calculation of the zero-point energy, ZPE, and the heat capacity, Cp, and are used to calculate the vibrational contribution to the entropy, Svib. For the slab calculations, this is the only contribution to the entropy but for the isolated water molecule, the translational and rotational contributions to the entropy, Strans and Srot, are also estimated using standard statistical mechanics approaches. The required partial pressure of water under the experimental reaction conditions was estimated, as described in Supporting Information (Section S4).
For each system, the calculations of the enthalpy and entropy were undertaken using modules from the Atomic Simulation Environment python library.52 As part of this work, we have implemented python scripts to read the required data from VASP output files and carry out the set of calculations required to give the enthalpy, H, entropy, S, and free energy, G, changes for the formation of a ML of water from the clean slab and isolated water molecules. The script makes additional checks, such as ensuring that the number of degrees of freedom in reactant and product states is correctly matched.
It is also possible to undertake ab initio molecular dynamics (MD) using the VASP code. This facility is used to check the stability of some of the adsorbed configurations using the NVT ensemble with Nose thermostat, T = 400 K, time step = 1 fs.
Catalyst Testing
Catalytic reactions were performed using a gas-phase plug flow micro-reactor. Aqueous glycerol solutions (50 wt %) were introduced into a preheater and vaporizer (305 °C) using a high-performance liquid chromatography pump at a flow rates of 0.016 mL min–1. The vaporized glycerol feed was swept through the reactor using argon as carrier gas (15 mL min–1). All lines were heated to prevent any condensation taking place. Catalysts were pelleted, crushed, and sieved to a uniform particle size (250–425 μm) prior to testing. The catalyst samples (typically 500 mg) were diluted with silicon carbide to a uniform volume (1 mL) and packed into an 8 mm inner diameter stainless steel tube between two plugs of quartz wool. These conditions resulted in mass velocities and space velocities between 1200 and 6000 L hAr–1 kgcat.–1 and 2250–9000 L hAr–1 Lcat.–1, respectively. A thermocouple was placed in the catalyst bed and used to control reaction temperature; reactions were carried out between 320 and 400 °C. Liquid reaction products were collected using an ice-cold stainless-steel trap. A gas bag was attached at the exit line to collect the gaseous products.
Liquid reaction products were analyzed offline using a Varian CP 3800 gas chromatograph (GC1) equipped with a capillary column (ZB-Wax plus, 30 m × 0.53 mm x 1 μm) and an flame ionization detector (FID). Cyclohexanol was used as an external standard. Carbon-based gas reaction products were analyzed offline using a Varian 450-GC gas chromatograph (GC2) equipped with a capillary column (CP-Sil5CB, 50 m × 0.32 mm × 5 μm). Products were detected and quantified by an FID after passing through a methanizer. H2 and O2 were analyzed using a Varian CP3380 gas chromatograph (GC3) equipped with a Porapak Q column and a TCD. A full list of the identified products and corresponding retention times, according to the GC used, is given in Table S3.
Reaction Data Interpretation
Equation 5 is used to calculate the glycerol conversion (CGLY) based on the molar difference between the carbon moles of glycerol fed into the reactor, gmi, and that detected at the outlet, gmo
| 5 |
The product selectivity [Sp(x), carbon mol %] for any product, x, was calculated from the moles of carbon recovered of x (xCm) divided by the total moles of carbon in all detected products, ∑xxCm (eq 6)
| 6 |
The carbon balance is obtained by comparing the moles of carbon accounted for in unreacted glycerol and in all the detected products to the moles of carbon in glycerol entering the reactor
| 7 |
Functional group yield (Y, carbon mol %) data were calculated from the sum of the selectivity for each product containing that functional group SG, multiplied by conversion CGLY, multiplied by the carbon balance BC, excluding coke (eq 8).
| 8 |
The overall carbon balance (BCtot) was calculated (eq 9) by dividing the sum of the carbon moles of products (xCm), coke (xCcoke) estimated from post reaction characterization, and unreacted glycerol (gmo) by the carbon moles of glycerol injected into the reactor (gmi).
| 9 |
The hydrogen balance (BH) was calculated (eq 10) by dividing the sum of the hydrogen moles of products xH, hydrogen gas (GC3) (xHgas), and moles of hydrogen in unreacted glycerol (gHmo) by the moles of hydrogen in glycerol injected into the reactor (gHmi).
| 10 |
The oxygen balance (BO) was calculated (eq 11) by dividing the sum of the oxygen moles of products (xO), oxygen gas (GC3) (xOgas), and moles of oxygen in unreacted glycerol (gOmo) by the moles of oxygen in glycerol injected into the reactor (gOmi).
| 11 |
The percentage of carbon deposited on the catalyst (coke) was estimated from the mass loss, as analyzed by TGA of the used catalyst. The mass of carbon lost during TGA was converted to the number of moles of carbon retained on the catalyst (Xcoke). This was then divided by the carbon moles of glycerol feed over the catalyst (gmi) (eq 12).
| 12 |
The methanol space-time-yield, STYMEOH, was calculated (eq 13) from the mass of methanol, mMEOH, produced per h (reaction time Rt), per mass of the catalyst (mcat, kg).
| 13 |
Results and Discussion
Catalyst Characterization
Structural and Textural Properties
Ceria nanostructures with cubic, rodlike, and polyhedral morphologies were prepared in accordance with previously reported procedures, herein referred to as Ce–C, Ce–R, and Ce–P.41,53 The main characterization data used to categorize the material structure are summarized in Table 1.
Figure S3 shows the XRD patterns of the prepared materials. All samples were indexed to the cubic fluorite ceria structure (space group Fm3̅m, JCPDS 01-089-8436), with no impurity or precursor peaks observed. Sharper reflections were observed for Ce–C compared with Ce–R and Ce–P, indicating a higher level of crystallinity for the cubic material than for the rods or polyhedral, which probably arises from the harsher synthesis conditions required to form the cubic morphology, using both concentrated base and a higher reaction temperature of 180 °C. Crystallite sizes, as estimated from the width of the (111) and (200) diffraction peaks (Figure S3), were found to be 21 nm for Ce–C, 8 nm for Ce–R, and 12 nm for Ce–P. Specific surface areas showed an inverse relationship to crystallinity; surface areas calculated in accordance with the BET equation were 35, 85, and 58 m2 g–1 for Ce–C, Ce–R, and Ce–P, respectively. Calculated lattice parameters were slightly larger than that reported for bulk ceria (0.5411 nm),54 with the largest lattice parameter observed for Ce–C (0.5432 nm). An increased lattice parameter can indicate partial reduction of the samples since Ce3+ has a larger ionic radius than Ce4+ (rCe4+ = 0.94 Å; rCe3+ = 1.14 Å). However, the effects on the lattice parameter are complicated by two competing effects—lattice expansions are generally observed with increasing ratios of Ce3+/Ce4+ due, as noted, to the larger size of Ce3+, while lattice contractions can arise with the decreasing crystallite size due to the increased surface/volume ratios for smaller nanocrystals.54,55 Calculation of the lattice strain showed Ce–R to have the highest degree of strain, followed by Ce–P and then Ce–C, which is in agreement with a previously published work,35 and in agreement with the smaller crystallite size calculated for Ce–R from the XRD pattern.
The morphology of the prepared ceria materials was investigated by TEM; example images are shown in Figure 1. Ce–R and Ce–C have well-defined morphologies with regular rodlike structures expressing (110) and (100) facets and a cubic habit having almost exclusively (100) faces, respectively. A more irregular geometry was observed for Ce–P, which appear to resemble a truncated octahedron morphology most closely with (111) and (100) surface facets. Particle size distributions generated from 200 to 250 individual crystallite images for Ce–P and Ce–C and 150 images for Ce–R are shown in Figure S5. The mean particle sizes, as measured from these TEM estimated distributions, are 19.3 ± 2.2 nm for Ce–C, (90.4 ± 4.6) × (7.1 ± 0.7) nm for Ce–R, and 10.7 ± 0.9 nm for Ce–P, which is in excellent agreement with the crystallite sizes estimated from XRD data.
Figure 1.
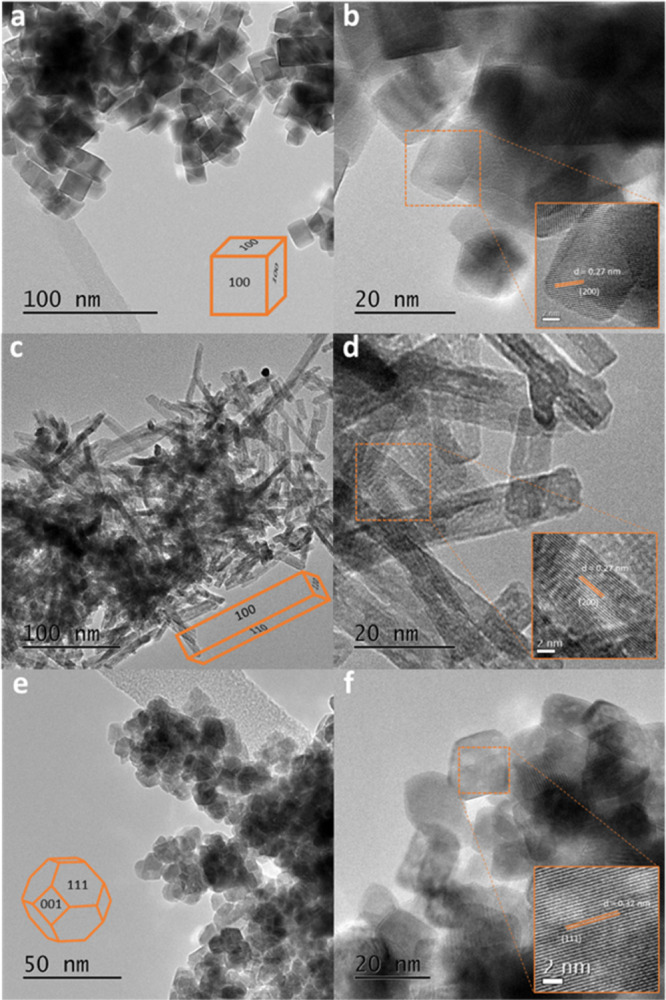
TEM images of ceria Ce–C (a,b), Ce–R (a,b), and Ce–P (e,f).
From the TEM images, interplanar spacings were measured to be 0.27 nm for Ce–C, indicating that the particles are enclosed by (100) facets. Measurements of 0.27 nm were made for Ce–R, in the longitudinal direction. For Ce–P, the dominant lattice spacing was measured to be 0.32 nm, indicating the dominant surface for the polyhedral morphology is the stable (111) surface; additional measurements were made of 0.26 nm, revealing the presence of some (100) facets. Similar findings were made by Trovarelli and co-workers, who demonstrated the exposure of (100) surfaces upon thermally treating octahedral particles, which induce a morphological change to truncated octahedra.38 The interplanar spacing measurements were in agreement with numerous previously published studies, reporting the predominant exposure of (100) surfaces in ceria cubes, (110) and (100) surfaces in ceria nanorods, and (111) surfaces in ceria polyhedra.38,41,53,56,57
Defect Properties and Reducibility
Defects in the materials were probed using visible laser Raman spectroscopy, a technique widely established for the study of ceria-based materials.58−60 The main features of Raman spectra obtained are given in Table 2. In the fluorite structure, Ce and O have coordination numbers of 8 and 4, respectively, and the spectra were dominated by a triply degenerate F2g mode at a Raman shift of 462 cm–1, corresponding to the symmetrical breathing mode of the Ce–O8 local structure.61,62 Also present were much weaker bands at wavenumbers of ca. 250 and 600 cm–1. The latter has been assigned to a defect-induced mode (D), with the relative ratios of the defect band to the F2g band (ID/IF2g) used to estimate the density of defects in ceria-based materials, although the precise origin of this mode has been the focus of much discussion.59,62−66
Table 2. Defect Properties and Reducibility of Morphologically Controlled Ceria.
| sample | F2g banda/cm–1 | F2g fwhma/cm–1 | ID/IF2gb | exposed planesc | TRd/°C | H2 con.e/μmolH2 g–1 | H2 con.e/μmolH2 m–2 |
|---|---|---|---|---|---|---|---|
| Ce–C | 463 | 14.32 | 0.03 | (100) | 519 | 81 | 3.5 |
| Ce–R | 461 | 37.72 | 0.07 | (110),(100) | 491 | 685 | 8.1 |
| Ce–P | 462 | 16.26 | 0.002 | (111),(100) | 416, 523 | 572 | 8.4 |
Calculated from Raman analysis.
The area ratios of the D and F2g band from Raman spectroscopy.
Identified by TEM.
The maximum of the low-temperature reduction peak.
H2 consumption calculated from the low-temperature TPR peak (T < 620 °C).
Studies by Taniguchi et al. and Luo and co-workers have used visible and UV Raman spectroscopy to probe the defect sites in doped ceria.59,63 The band centered around 600 cm–1 was ascribed to defects with Oh symmetry whereby the reduced Ce3+ cation forms an MO8-type complex. However, similar findings were obtained by Luo and co-workers who attributed the band at 600 cm–1 to the intrinsic oxygen vacancies required to maintain charge neutrality in the presence of Ce3+cations. Wu et al. probed the defect sites of un-doped ceria nanostructures with well-defined crystal planes and proposed an alternative assignment for the defect band at ca. 600 cm–1.58 Their XPS studies showed very similar levels of Ce3+ across all morphologies, but in the Raman spectra, nanorods showed the most intense band at 600 cm–1 followed by nanocubes with nanopolyhedra showing the least intense defect band. The rods expose (110) and (100) surfaces, cubes expose the (100) surface, and the polyhedra have (111) and (100) surfaces. Wu noted that the intensity of the defect band in the Raman spectra is in agreement with the theoretical energy of defect formation at a surface which is in the order (110) < (100) < (111).67 Even though Raman spectroscopy is not a surface-sensitive technique, these results suggest that the surface termination strongly influences the defect sites observed. Consequently, Wu suggested that the band at 600 cm–1 is due to oxygen defects which form on the surface and develop into the bulk. The Raman spectra of the as-prepared ceria nanostructures for this study (Figure S7) also showed the ID/IF2g ratio (Table 2) to be in the order Ce–R > Ce–C ≫ Ce–P, indicating that the defect densities in our samples follow the same trend. Additionally, the F2g band observed for the rods was much broader than that for the other nanostructures, consistent with increased defect density and smaller crystallite size, as observed by XRD and TEM.
The reducibility of the ceria samples was assessed using TPR with hydrogen as the reducing gas. Figure S8 shows the H2-TPR profiles for each of the CeO2 nanostructures with the data summarized in Table 2. It is widely accepted that the high-temperature peak observed during CeO2 H2-TPR is due to the reduction of bulk oxygen, while low-temperature peaks are attributed to the reduction of surface oxygen species.68 For all materials, a high-temperature reduction peak with a maximum at ca. 800 °C was observed, which was attributed to the reduction of bulk species. The bulk reduction peak for Ce–R was, however, shifted by ca. 40 °C, down to 765 °C. This suggests, similar to the defect densities estimated from Raman spectroscopy, that defect formation in the bulk structure may be influenced by the surface termination. The model for CeO2 reduction by H2 is proposed to consist of four steps: (1) dissociation of chemisorbed H2 to form surface hydroxyl species, (2) Ce4+ is reduced to Ce3+ upon formation of anionic oxygen vacancies, (3) water desorbs following recombination of surface hydroxyl and hydrogen species, and (4) oxygen vacancies diffuse into the bulk structure.69 Since equilibrium is reached between surface and bulk defects through diffusion,34 it is plausible that the nature and density of defects in the bulk structure are influenced by surface termination.
At first glance, Ce–C displayed a bimodal peak distribution with a single, broad low-temperature reduction peak with a maximum at 520 °C, in addition to the higher temperature bulk reduction peak. Closer inspection revealed the presence of multiple low-temperature reduction peaks, with additional low intensity peaks observed at 320 and 625 °C. A similar profile was observed for Ce–R, although the main surface reduction peak was shifted to a lower temperature of 478 °C, with a noticeably higher intensity. Additional peaks were detected at 312 and 378 °C, although they were obscured by the main surface reduction peak and appeared as shoulders, preventing peak deconvolution. Well-defined low-temperature reduction peaks were observed for Ce–P, with temperatures centered at 416 and 523 °C. The peak at 416 °C was noticeably sharper than is typically observed, with the lower temperature of reduction, suggesting that the Ce–P nanostructures are more easily reduced than the other morphologies. Surface hydrogen consumption was found to be highest over Ce–R at 685 μmolH2 g–1, followed by Ce–P (572 μmolH2 g–1), and then Ce–C (81 μmolH2 g–1), in agreement with the trend of surface area. However, once normalized to surface area, Ce–P showed the highest H2 consumption (8.8 μmolH2 m–2) followed by Ce–R (8.1 μmolH2 m–2) and Ce–C (3.5 μmolH2 m–2), again suggesting enhanced reducibility of Ce–P.
DFT Results
This work aims to test if the reaction of glycerol over ceria catalysts depends critically on the surface structure of the nanoparticles as the interaction with the high-temperature water/glycerol reaction mixture will depend on the crystal faces present. The synthesis of Ce–C, Ce–R, and Ce–P allows us to compare the reactivity of the major surface facets of these materials. Our DFT calculations focused on the adsorption and reaction of water with the three surfaces identified for the different nanoparticle morphologies in Table 1; (100) relevant to all morphologies, (110) relevant to Ce–R, and (111) relevant to Ce–P, which allows an initial estimate of the relative acidity/basicity of the surfaces and will enable us to estimate the likely level of surface hydroxylation under experimental conditions using ab initio thermodynamics.
Plane views of the three surface simulation slabs created for our calculations are shown in Figure S2. Ceria has a fluorite crystal structure. In the bulk unit cell, Ce4+ has cubic and O2– tetrahedral coordination. The Ce4+···O2– nearest neighbor distance is 2.368 Å in the DFT optimized cubic unit cell compared with the experimental value of 2.343 Å (ICSD structure code 182988).70,71 The (110) surface contains exposed sixfold co-ordinated Ce4+ cations with a planar arrangement of four oxygen anions around each cation in the surface. Each O2– anion in the (110) surface is three co-ordinate with two surface and one sub-surface Ce4+ neighbor. The (111) surface slab is formed by cutting a single Ce4+···O2– bond per Ce4+ cation; the outer most layer is, again, mainly O2–, but seven coordinate Ce4+ sites are also available to adsorbates. The process described in the methodology section to create a neutral (100) terminated slab model results in a surface which is still largely oxygen anion terminated but with neutral vacancies which expose additional metal co-ordination sites. Accordingly, each Ce4+ that is accessible at the (100) surface has six O2– neighbors and each O2– anion at the surface is bridging between two Ce4+ cations.
Water can be adsorbed as a molecule to the surfaces of ceria through interaction of the lone pair density on oxygen with surface Ce4+ cations and/or through hydrogen bonding (HOH···O2–) to surface anions. It is also possible to adsorb water in a dissociated state to give surface hydroxyl groups by transfer of a proton to a surface anion, with a more basic surface favoring this process. Initially, we considered the adsorption of a single water molecule on the stoichiometric surfaces, calculating the molecular and dissociated adsorption states which, using our simulation slabs, correspond to surface coverages of 0.84 H2O nm–2 for CeO2(100), 0.59 H2O nm–2 for CeO2(110), and 0.42 H2O nm–2 for CeO2(111). In each case, three alternative orientations of the molecule on the surface were explored, and the most negative adsorption energies, calculated using eq 1, are given in Table 3, with the optimized structures, as shown in Figure S9. For the (100) surface, it was difficult to find a starting point for molecular adsorption, as the molecule simply dissociated on optimization of the structure to give a dissociated state with the resulting hydroxyl groups forming a hydrogen bonded pair (Figure S9a). Molecular adsorption was stable on the (110) and (111) surfaces (Figure S9b,c,e) with the adsorption to the (110) surface around 10 kJ mol–1 more favorable than to the (111) in good agreement with the earlier results of Parker and co-workers.51
Table 3. Calculated Adsorption Energies for Water in Molecular and Dissociated States.
| surface | moleculara/kJ mol–1 | dissociativea/kJ mol–1 | MLb/kJ mol–1 | ML comp.c/n (m/d) |
|---|---|---|---|---|
| (100) | –172 | –151 | 8 (0:8) | |
| (110) | –77 | –114 | –110 | 8 (0:8) |
| (111) | –67 | –15 | –73 | 8 (8:0) |
ML = monolayer. Energy calculated for single water molecule in the slab cell.
Energy per molecule in ML.
ML composition, n = total number of water molecules per simulation cell, m = number in a molecular adsorbed state at end of optimization, d = number in the dissociated adsorbed state at end of optimization.
Starting structures for the dissociated state for the (110) and (111) surfaces based on the optimized molecular adsorbed state were created by displacing a H atom from water to the nearest surface O2–. However, on optimization, these structures consistently recombined to reform the molecular adsorbed state. To obtain the dissociated state quoted in Table 3, the hydrogen atom was placed further away in the supercell, so that the two hydroxyl groups formed do not share a Ce4+ neighbor (Figure S9d,f). In this case, the dissociatively adsorbed state on the (111) surface gives an adsorption energy that is actually 52 kJ mol–1 less favorable than the molecularly adsorbed case. For the (110) surface, the dissociated state is considerably more stable than the molecular adsorbed form, by 37 kJ mol–1. On CeO2(110), the dissociated structure has a hydrogen bond for the hydroxyl formed by proton donation to the surface anion to another surface anion with an OH···O distance of 1.82 Å. The other hydroxyl group remains on a Ce4+ top site.
So the adsorption of an isolated water molecule highlights the differences in the Lewis basicity of the different surfaces. The (100) surface has the highest affinity for water and adsorbs to a dissociated structure without a reaction barrier. On the (110) surface, water will adsorb as a molecule, but the dissociated form is more stable, so that we expect activated dissociation of the molecule to produce hydroxyl groups on the surface. The (111) surface is the least reactive with dissociation of water energetically disfavored.
To consider higher loadings of water on the surface, slab models for the ML coverage were constructed. A ML of water was taken to consist of one water molecule per exposed Ce4+ surface cation and starting structures were constructed with one water molecule placed at each cation site. The surface coverages for the ML structures were 6.69 H2O nm–2 for CeO2(100), 4.73 H2O nm–2 for CeO2(110), and 3.34 H2O nm–2 for CeO2(111). Following on from the low coverage results, dissociated ML structures were then set up for CeO2(100) and CeO2(110), while molecular adsorption was considered for CeO2(111). Table 3 reports the ratio of molecular and dissociatively adsorbed molecules following optimization for each surface at ML coverage along with the calculated adsorption energy per water molecule. The optimized structures for each surface are also shown in Figure S10. As a further check on the stability of the structures produced in this way, a 4 ps MD run was carried out for each surface and 10 structures taken at evenly spaced time points from the resulting trajectory. In all cases, the relaxed structural energy agreed to within 3 kJ mol–1 with the original optimized structure.
The ML adsorption energies, as shown in Table 3, follow a similar trend to those for the single water molecule case. The calculated adsorption energy per water molecule shows the strongest binding for the (100) surface, followed by the (110), and the weakest interaction is seen for the (100) case. The CeO2(100) surface has the highest density of water molecules adsorbed at the ML coverage: around 40% higher than CeO2(110), which results in interactions between the hydroxyl groups which lead to shifts of the oxygen atoms in those groups away from the locations expected from the ceria lattice, as can be seen from the plane view of the optimized surface in Figure S10a. Correspondingly, the adsorption energy per water molecule is some 21 kJ mol–1 less favorable than seen in the low coverage calculations. These shifts are not seen in the case of CeO2(110) (Figure S10c), and the adsorption energy per water molecule at ML coverage differs by only 4 kJ mol–1 from the low coverage value. For a molecularly adsorbed ML on the CeO2(111) surface, the adsorption energy per water molecule reported in Table 3 is actually 6 kJ mol–1 more favorable than that for a low coverage, and we note in Figure S10e that local networks of hydrogen bonds between water molecules have been formed in this case.
For the ML coverage structures, we have also carried out frequency calculations to allow an estimation of the free energy of adsorption per water molecule for each surface, which are plotted as a function of temperature in Figure 2, at the estimated partial pressure of water under reaction conditions (P = 0.60 mbar, see the Supporting Information). As would be expected from the adsorption energies in Table 3, the enthalpy of water ML formation is negative on all surfaces and shows only a very weak temperature dependence. The entropy term in the free energy is also negative as water loses translational and rotational degrees of freedom on adsorption to the surface from the gas phase. The negative entropy contribution means that the free energy increases roughly linearly with temperature. The point at which the free energy crosses the temperature axis gives us an estimate for the temperature up to which water adsorption to the surface to form a ML would be thermodynamically expected. From Figure 2, we estimate this temperature to be 684 K (100), 519 K (110), and 329 K (111). At a higher water partial pressure of 1 bar, Parker et al.51 have estimated the temperatures up to which ML coverages would be stable as 825–850 K (100), 575–600 K (110) based on dissociated water, and 325–350 K (111) based on molecular water adsorption energies, which agrees with the trend found here.
Figure 2.

Calculated free-energy change, ΔG, for water adsorption on ceria surfaces and the contributions from enthalpy, ΔH, and entropy, −TΔS, plotted as a function of temperature. Plots are based on the calculated energies for 1 ML coverage with the inclusion of vibrational ZPE and calculated normal modes. Plots are for (a) CeO2(100), (b) CeO2(110), and (c) CeO2(111). For each plot, ΔG: solid line, ΔH: dashed line, and −TΔS: dotted line.
In our experimental work, the reaction of glycerol over the ceria catalysts was carried out in the range 593–673 K, meaning that we would expect the (100) surface to be covered in hydroxyl groups from dissociated water under the reaction conditions, while the (110) and (111) surfaces would be largely bare oxide.
Acid–Base Properties
The acid–base properties of ceria can vary according to the morphology, which is usually explained by the different coordination states of the cations and anions on the different facets.32 TPD of acidic and basic probe molecules is a well-established technique to determine basic and acidic surface sites and can provide information about the strength and density of sites present.72 Basic sites were probed by CO2 desorption. A blank run was performed without admitting CO2 to the sample, which resulted in no CO2 being detected, indicating that the pre-treatment conditions were sufficient to remove any adsorbed atmospheric CO2. Of the materials tested, Ce–R showed the highest levels of CO2 desorption per gram, which is expected since those samples also possess the highest surface area. Ce–C and Ce–P showed very similar quantities of CO2 desorbed (Table 4) but with very different desorption profiles (Figure S11). Ce–P showed the most complex distribution of basic sites, with peaks observed at 180, 336, 452, 546, and 786 °C. Using the Redhead approach73 (eq S9) (details in Supporting Information, Section S5) as a rough estimate of the corresponding desorption energies for CO2 gives values from 130 to 309 kJ mol–1, suggesting a wide range of basic sites of different strengths. The peak at ca. 452 °C, corresponding to a desorption energy of 210 kJ mol–1, was the most intense, suggesting that mainly medium strength basic sites are present with the polyhedral morphology. On the other hand, Ce–C showed a wide desorption profile across the range 125–880 °C, with clear maxima observed at 268 and 736 °C, for which the Redhead equation gives desorption energies of 155 kJ mol–1 and 294 kJ mol–1, respectively. Deconvolution of the temperature program profile revealed an additional peak at 488 °C. In contrast to the desorption profile of Ce–P, the highest quantity of CO2 for Ce–C was desorbed at high temperatures, indicating that a high proportion of strongly basic sites are present. Overall, a higher quantity of desorbed CO2 was observed for Ce–R, with a simpler desorption pattern, consisting of two well-defined peaks at 315 and 536 °C, with calculated desorption energies of 169 and 234 kJ mol–1. Additionally, the start of a peak can be observed from 850 to 900 °C, indicative of very strong basic sites, although the temperature of 900 °C was insufficient to complete desorption, so this could not be quantified.
Table 4. TPD Measurements of Acid–Base Properties for Morphologically Controlled Ceria.
| morphology | CO2 desorbeda/μmol g–12 | CO2 desorbeda/μmol m–2 | NH3 desorbedb/μmol g–1 | NH3 desorbedb/μmol m–2 | basicity/acidity ratio |
|---|---|---|---|---|---|
| Ce–C | 95 | 4.1 | 13 | 0.56 | 7.3 |
| Ce–R | 138 | 1.6 | 23 | 0.27 | 6.0 |
| Ce–P | 100 | 1.7 | 15 | 0.26 | 6.5 |
Calculated from CO2 TPD.
Calculated from NH3 TPD.
The presence and strength of acid sites were probed by NH3-TPD. The desorption profiles observed (Figure S12) were very similar to those obtained with a CO2 probe, although some minor features were lost. Similar quantities of NH3 per gram of the catalyst were desorbed for Ce–C and Ce–P, with higher amounts observed over Ce–R. However, when normalized for surface area, very comparable quantities were desorbed over Ce–R and Ce–P per unit surface area. As described above, the different coordination number of cerium cations and oxygen anions at a surface is dependent on the Miller index of the surface present. It would be expected that surface basicity arising from O2– anions would follow the trend observed in our DFT calculations for the dissociative adsorption of water; (100) > (110) > (111), while the theoretical acidity due to surface Ce4+ would follow the trend (100) ≈ (110) > (111).32 TPD analysis showed that the basicity followed the theoretical trend, with Ce–C, containing mainly the (100) surface, showing higher levels of basicity than Ce–R and Ce–P, which possessed mainly (110) and (111) facets, respectively. In contrast, acidity measurements deviated from the predicted trend, with Ce–R, containing (110) surfaces, exhibiting lower acidity than theoretically predicted. It should be noted that similar to the CO2 desorption, the onset of a high-temperature peak was observed for Ce–R between 850 and 900 °C. This was not observed in the absence of any adsorbate, thus indicating strong interactions between NH3 and Ce–R. We note that the DFT calculations suggest that under the pre-treatment conditions used in the TPD experiments, the (111) surfaces would be expected to be cleared of surface water, whereas the (100) and (110) may still have acid sites blocked by hydroxylation. The increased defect density of Ce–R, as measured by Raman spectra (Table 2), could also be responsible for a reduced acidity of cerium cations, resulting in lower Lewis acidity.32
Glycerol Conversion
An earlier investigation into the influence of some of the physicochemical properties of ceria on glycerol valorization and methanol selectivity showed that surface area, crystallite size, and defect density did not significantly influence the product distribution.26 In that work, ceria catalysts were prepared by varying the calcination temperature, resulting in materials with varying surface areas, crystallite size, and defect density. Those reactions were carried out with differing catalyst masses to maintain a constant catalyst surface area, with small alterations made to the carrier gas flow rate to maintain a constant gas hourly space velocity (GHSV). Subsequently, it was found that glycerol conversion was constant with a constant catalyst surface area, and no obvious relationship between ceria crystallite size or defect density, and the conversion of glycerol or intermediate product distribution was observed. As such, it was postulated that the morphology of the catalyst may have more significant effects on product distribution, allowing for enhanced yields of methanol.
Initially, in the current work, the catalysts were tested under identical reaction conditions, with catalyst mass, volume, and space velocity kept constant, at reaction temperatures of 320, 360, and 400 °C. Glycerol conversion as a function of temperature is shown in Figure 3. At all reaction temperatures, significantly lower glycerol conversions were obtained over Ce–C than for Ce–R or Ce–P. This was not unexpected, with glycerol conversion following the order Ce–R > Ce–P ≫ Ce–C, which aligns with measured surface areas given in Table 1.
Figure 3.

Glycerol conversion at different temperatures at a space velocity of 3600 h–1 over Ce–C (pink squares), Ce–R (orange diamonds), and Ce–P (blue circles). Reaction conditions; 50 wt % glycerol (0.016 mL min–1), 0.5 g CeO2, 15 mL min–1 Ar, 3 h, GHSV = 3600 h–1.
At 320 °C, glycerol conversions of 17, 65, and 58% were obtained over Ce–C, Ce–R, and Ce–P, respectively, with carbon balances of 93, 81, and 91%. A previous work has shown that no significant glycerol conversion occurs at this temperature in the absence of a catalyst. Glycerol conversion was constant across all three materials once normalized to surface area (ca. 0.26 mmolgly h–1 mcat2). Increasing the reaction temperature to 360 °C resulted in significant increases in glycerol conversion over Ce–R and Ce–P, with almost all glycerol converted. In contrast, a modest increase in glycerol conversion was observed over Ce–C, with a conversion of 29% achieved. The carbon balance remained high over Ce–P (>90%) but dropped to 83 and 76% over Ce–C and Ce–R, respectively.
At 400 °C, only traces (<0.1%) of unconverted glycerol were observed over Ce–R and Ce–P after a reaction period of 3 h, while conversion reached 91% over Ce–C. Under these conditions, a significant decrease in carbon balance was observed, at 61, 62, and 67% over Ce–C, Ce–R, and Ce–P, respectively. TGA was used to estimate the coke content of the catalysts (Figure S13). Carbon deposition was highest over Ce–R at 65 mg g–1, followed by Ce–C (47 mg g–1) and Ce–P (16 mg g–1). As shown in Table 5, only a small proportion of carbon lost is in the form of carbon deposition on the catalyst, accounting for <2% of the carbon balance over all materials. Since low levels of carbon deposition were detected, but significant carbon losses were observed, it appears likely that additional products are formed under these conditions which cannot be detected by our typical analysis by GC-FID.
Table 5. Glycerol Conversion and Product Distribution over CeO2 with Different Morphologies.
| mass balanceb/% |
yieldc/% |
||||||||||||||
|---|---|---|---|---|---|---|---|---|---|---|---|---|---|---|---|
| entry | catalyst morphology | reaction T/°C | CGLYa/% | C | H | O | Alc. | diols | Ald. | Ket. | Ac. | COx | Unk. | MeOH S.T.Y./g h–1 kgcat–1 | carbon depositiond/mg g–1 |
| 1 | Ce–C | 320 | 17 | 93 | 91 | 91 | 1.1 | 1.9 | 3.0 | 2.4 | 0.7 | 1.0 | 5.8 | 4.01 | |
| 2 | 360 | 29 | 83 | 81 | 81 | 2.7 | 3.5 | 5.2 | 5.9 | 1.1 | 1.6 | 4.4 | 8.97 | ||
| 3 | 400 | 91 | 61 (62) | 53 | 54 | 15.6 | 6.5 | 5.9 | 6.4 | 4.3 | 7.7 | 15.5 | 60.35 | 47 | |
| 4 | Ce–R | 320 | 65 | 82 | 75 | 73 | 5.7 | 8.2 | 4.1 | 17.5 | 5.6 | 3.3 | 8.1 | 39.42 | |
| 5 | 360 | 98 | 76 | 66 | 63 | 10.4 | 9.3 | 7.8 | 19.8 | 8.9 | 6.3 | 11.8 | 90.87 | ||
| 6 | 400 | >99 | 62 (64) | 48 | 56 | 20.2 | 0.8 | 7.8 | 10.8 | 1.4 | 15.1 | 6.5 | 164.32 | 66 | |
| 7 | Ce–P | 320 | 58 | 91 | 84 | 82 | 4.9 | 7.3 | 4.3 | 17.6 | 4.1 | 2.9 | 11.3 | 40.21 | |
| 8 | 360 | 96 | 91 | 80 | 76 | 14.6 | 12.4 | 12.4 | 11.3 | 11.9 | 8.9 | 15.3 | 121.5 | ||
| 9 | 400 | >99 | 67 (67) | 51 | 63 | 23.5 | 0.3 | 3.2 | 15.0 | 2.1 | 18.8 | 4.3 | 201.3 | 16 | |
Glycerol conversion.
Carbon mass balance (±3%) of products detected in GC1 and GC2 (values in parenthesis include coke deposited on the catalyst).
Yield of products detected in GC1 and GC2; Alc., alcohols; Ald., aldehydes; Ket., ketones; Ac., acids; Unk., unknowns.
Calculated from TGA analysis (Figure S13). Reaction conditions; 50 wt % glycerol/water flow 0.016 mL/min, 0.5 g CeO2, 15 mL/min Ar, 3 h.
Iso Conversion
We have previously demonstrated a strong relationship between product distribution and glycerol conversion.26,27 While appreciable differences in product distribution were observed over Ce–C, compared with Ce–R and Ce–P, the significantly lower glycerol conversion obtained over Ce–C meant that the product distributions could not be directly compared across the three catalysts. In order to overcome this limitation, catalyst masses and subsequent space velocities were altered to achieve comparable levels of glycerol conversion over all catalysts. Catalyst masses were altered to allow flow rates, and therefore partial pressures, to remain constant across experiments.
A glycerol conversion of 17% was attained over Ce–C at 320 °C and a space velocity of 3600 h–1. The space velocities were adjusted over Ce–R and Ce–P to 11,250 and 9000 h–1, respectively, resulting in conversions of 14 and 16%. At this level of conversion, all three morphologies gave high carbon balance values, >90%, with >95% observed for Ce–R and Ce–P. Due to the diverse range of products formed, products are grouped by their functional groups; product distributions by functional groups at a glycerol conversion of ca. 15% are shown in Figure 4 (full product list in Table S6a).
Figure 4.

Product group selectivity over Ce–C (pink bars), Ce–R (orange lined bars), and Ce–P (blue hatched bars) where catalyst mass and carrier flow rates were altered to achieve glycerol conversions of ≈15%. Reaction conditions; 320 °C, 50 wt % glycerol (0.016 mL min–1), 15 mL min–1 Ar, 3 h, GHSV = 3600 h–1 (Ce–C), 11,250 h–1 (Ce–R), and 9000 h–1 (Ce–P).
Product distributions were similar over Ce–R and Ce–P, with hydroxyacetone (HA) as the main product detected, with selectivities of 37 and 44%, respectively, contributing to the high ketone selectivity observed. HA is a glycerol dehydration product, typically formed through the loss of a C1 hydroxyl group in glycerol, which generates an enol intermediate (2,3-dihydroxypropene) that undergoes rapid tautomerization to yield HA (Scheme 1).
Scheme 1. Reaction Pathway Initiated by C1 Dehydration of Glycerol.

Glycerol conversion to HA has been reported in good yields over Lewis acidic materials such as ZrO2, Al2O3, and Nb2O574 and basic materials such as LaNiO3,75 La2CuO4,76 and CuOx–MgF2.77 The other major products observed over Ce–R and Ce–P were 1,2-propanediol (8 and 5% over Ce–R and Ce–P, respectively), ethylene glycol (7%), methanol (8%), and acetaldehyde (5%), which are secondary products derived from hydroxy acetone, as shown in Scheme 1. The products, as shown in Scheme 1, account for ca. 66% of the carbon for reactions carried out with Ce–P and ca. 63% when Ce–R is employed. Smaller quantities of numerous other products were found including propanoic acid (ca. 2.5%), acrolein (ca. 2%), acetic acid (ca. 1.5%), 2,3-butanedione (ca. 1%), and allyl alcohol (ca. 1%), with trace amounts, at less than 1% selectivity of propionaldehyde, acetone, ethanol, propanols, 1,3-propanediol, and CO2. Unidentified products were also observed over Ce–R and Ce–P. These products are visible with GC1, but it has not been possible to determine their identity, and selectivity to these unknown compounds is calculated using average response factors from known products with similar retention times.
A significantly different product distribution was found for the reaction of glycerol over Ce–C compared to Ce–R and Ce–P. Over the cubic material, the major product detected was acrolein, with a selectivity of 14%, and a much lower selectivity to HA (14%) was observed compared with Ce–R and Ce–P. Acrolein is a double dehydration product of glycerol, typically initiated by the loss of the C2 hydroxyl group, yielding 3-hydroxypropanal, a highly reactive intermediate which further dehydrates to acrolein (Scheme 2). Some detected products were found to have similar selectivities to those obtained over Ce–R and Ce–P including ethylene glycol (7%), acetaldehyde (4%), propionic acid (3%), and allyl alcohol (1%). However, there are also products, aside from those already discussed, for which there are notable differences; methanol (3%), 1,2-propanediol (2%), 1,3-propanediol (3%), acetic acid (1%), and CH4 (5%). In addition, propionaldehyde, acetone, ethanol, 2,3-butanedione, propanoic acid, and CO were observed in small quantities (<1% selectivity). Additionally, a higher selectivity toward unknown products was observed (37%), suggesting that the dehydration of glycerol via the loss of a primary hydroxyl group to yield HA is not the dominant reaction pathway over Ce–C.
Scheme 2. Reaction Pathway Initiated by C2 Dehydration of Glycerol.

Both the major products identified (Ce–R/Ce–P: HA, Ce–C: acrolein) and the selectivities to the minor products (e.g. Ce–R/Ce–P: 1,2-propanediol ≫ 1,3-propanediol and Ce–C 1,3-propanediol > 1,2-propanediol) suggest that over Ce–R/Ce–P, glycerol dehydration at C1 is the more important initial step (Scheme 1), whereas for Ce–C samples, dehydration at C2 (Scheme 2) is dominant. The balance between the two pathways is an important way to control the range of products produced in the reaction and these results suggest that control of a ceria morphology could be an important approach for this to be achieved. We also note that as Ce–C samples are largely CeO2(100) terminated, our DFT calculations suggest that the level of hydroxylation for the surface of Ce–C under experimental conditions will be higher than that of the Ce–R/Ce–P morphologies. This would be expected to limit the Lewis basicity of the catalyst and may explain why dehydration at C2 is preferred in this case.
As we have previously shown, methanol is a terminal product,25,27 so that high methanol selectivity is typically only observed at very high glycerol conversions. To compare methanol selectivity at full glycerol conversion, an increased catalyst mass (and subsequent volume) of Ce–C was used to decrease the space velocity. Since full glycerol conversion was achieved at a space velocity of 3600 h–1 over Ce–R and Ce–P at 400 °C, the space velocity was reduced to 1800 h–1 over Ce–C to achieve the same level of conversion. Product distributions under these conditions are shown in Figure 5 (full product distribution in Table S6b).
Figure 5.

Product distributions at a glycerol conversion of >95% over Ce–C (pink bars), Ce–R (orange lined bars), and Ce–P (blue hatched bars). Reaction conditions; 400 °C, 50 wt % glycerol (0.016 mL min–1), 15 mL min–1 Ar, 3 h, GHSV = 1800 h–1 (Ce–C), 3600 h–1 (Ce–R), and 3600 h–1 (Ce–P).
Product distribution by functional group appears to vary somewhat between the three morphologies, although fairly similar product distributions are observed for Ce–R and Ce–P. Alcohol selectivity was in the order Ce–P > Ce–R ≫ Ce–C, with methanol selectivities of 25, 23, and 13%, respectively. Other alcohols included ethanol, 2-propanol, 1-propanol, and allyl alcohol. Under these reaction conditions, only small quantities of HA were observed over all materials, indicative of its role as an intermediate. As shown in Scheme 1, HA undergoes a radical fragmentation process, related to a Norrish type 1 reaction, generating methanol and acetyl radicals. The methanol radical is reduced to yield methanol, whereas the acetyl radical is reduced to acetaldehyde, with further reduction to ethanol possible. Alternatively, the coupling of two acetyl radicals generates 2,3-butanedione; the formation of 2,3-butanedione, a C4 product, from glycerol, a C3 molecule, provides good evidence for the fragmentation of HA and the presence of acetyl radicals. Higher aldehyde selectivity was observed over Ce–C (24%) compared to the other morphologies, the main aldehyde produced was acetaldehyde (16%) with smaller quantities of propionaldehyde and acrolein also detected. Acetaldehyde is a product which can be formed through either HA fragmentation (Scheme 1) or via a retro-aldol mechanism (Scheme 2).
The selectivity to acrolein over Ce–C was significantly lower than that was observed at low glycerol conversions, likely due to the higher reaction temperature used favoring the retro-aldol fragmentation of the 3-hydroxypropanol intermediate, as previously reported by other authors.78 A total aldehyde selectivity of 13% was observed over Ce–R, composed of acetaldehyde (6%), propionaldehyde (6%) along with small quantities of acrolein and butyraldehyde. Less than 5% of the total product distribution over Ce–P consisted of aldehydes, primarily due to the low acetaldehyde selectivity observed. The low aldehyde selectivity over Ce–P, and to a lesser extent Ce–R, was attributed to ketonization reactions, which have been widely reported over CeO2 and CeO2-containing catalysts,79−81 here two acetaldehyde molecules and one water molecule react to give acetone, carbon dioxide, and two equivalents of hydrogen. No H2 gas was detected throughout these experiments, but hydrogen is required to form several products, including methanol, suggesting that it was consumed in situ. A selectivity of around 20% toward ketones was observed over Ce–R and Ce–P, despite the high levels of HA conversion. This was attributed mainly to acetone and 2,3-butanedione, with small quantities of HA, cyclopentanone, and hexanone also detected. As shown in Figure 5, at complete glycerol conversion, high ketone selectivity is typically accompanied by low aldehyde selectivity and high COx selectivity. Both CO and CO2 were observed over all materials; these are undesirable byproducts which are typically produced under conditions yielding high levels of methanol. Future work will focus on reducing COx levels without reducing methanol selectivity.
At full glycerol conversion, the carbon balances (excluding catalyst coking) over all three catalysts were low at 63, 62, and 67% over Ce–C, Ce–R, and Ce–P, respectively. The amount of carbon deposited on the catalysts was estimated by TGA. Taking catalyst coking into account, very modest increases in carbon balances were observed, taking the total carbon balances to 64, 64, and 68% over Ce–C, Ce–R, and Ce–P, respectively. Total organic carbon analysis was performed on the liquid phase products to determine the total carbon balances (Table S4). It was found that for all catalysts, the overall carbon balances were ca. 95%, with the remaining 5% attributed to reactor fouling. The discrepancies between observed carbon balances, as calculated from GC analysis, and total organic carbon analysis can be attributed to the formation of insoluble humin-type products, which were visibly present; similar findings were made by Hernandez et al. for the reaction of glycerol over lanthanum-based catalysts.75
At complete glycerol conversion, methanol space-time-yield (S.T.Y.) follows the order of methanol selectivity, with the highest space-time-yield obtained over Ce–P (201 g h–1 kgcat–1), followed by Ce–R (164 g h–1 kgcat) and then Ce–C (47 g–1 h–1 kgcat–1). This follows the same trend as HA space-time-yield at low conversion, as shown in Figure 6. The difference in the reaction mechanism between morphologies, with Ce–R/Ce–P favoring C1 dehydration (Scheme 1), while over Ce–C dehydration at C2 (Scheme 2) is observed, results in significantly lower methanol production achieved over Ce–C materials as methanol is not generated through this route. The high HA S.T.Y. achieved over Ce-R/Ce–P at low glycerol conversion is indicative that Scheme 1 is a major reaction pathway for these catalysts, and as HA is one of the major intermediates in methanol formation, there is a correspondingly high methanol selectivity and space-time-yield at high glycerol conversion.
Figure 6.

HA and methanol space-time-yields over Ce–C (pink), Ce–R (orange lined), and Ce–P (blue), where catalyst mass and carrier flow rates were altered to achieve glycerol conversions of ca. 15 and >99%. Low conversion reactions performed at 320 °C; high conversion reactions performed at 400 °C and GHSVs between 1800 and 11,250 h–1.
Conclusions
Aqueous glycerol solutions were reacted as vapor phase reagents over three types of ceria catalysts that were prepared with cubic, rodlike, and polyhedral morphologies. The yield of major products such as HA at low conversion and methanol at high conversion has been discussed with respect to the surface properties of the three ceria catalysts. We proposed that the density of exposed surface facets is strongly linked to the acid/base properties of the catalysts in addition to the degree of surface hydroxylation and the defect density. DFT calculations suggest that there will be significant differences in the degree of surface hydroxylation, with the morphologies exposing (100) surfaces being hydroxylated at reaction temperatures, unlike those exposing (110) and (111) surfaces. Reactions conducted at iso-conversion indicated that over the rods and polyhedral ceria, the initial product is 2,3-dihydroxypropene, and over the cubes, the product is 1,3-dihydroxypropene. This difference in the reaction mechanism results in a high space-time-yield of HA over the rods and polyhedral catalysts at low conversion. HA is one of the major intermediates to methanol formation, and as such, the methanol space-time-yield over the polyhedral was found to be >4 times that over the cubes. The strong dependence of the product yields to the density of surface facets and the corresponding surface properties should be considered for future work in this area.
Acknowledgments
We would like to thank the EPSRC for funding this work (grant reference codes: EP/P033695/1 and EP/L027240/1). The authors would also like to thank Exeter Analytical UK Ltd. for the total organic content analysis. Information on the data underpinning the results presented here can be found in the Cardiff University data catalogue at http://doi.org/10.17035/d.2021.0129330665.
Supporting Information Available
The Supporting Information is available free of charge at https://pubs.acs.org/doi/10.1021/acscatal.0c05606.
Catalyst characterization, DFT calculations, analytical techniques for evaluation of catalytic performance, full product distributions obtained, and comparison of catalytic systems (PDF)
The authors declare no competing financial interest.
Supplementary Material
References
- International Renewable Energy Agency . Boosting Biofuels. Sustainable Paths to Greater Energy Security; IRENA, 2016. [Google Scholar]
- Agarwal A. K. Biofuels (Alcohols and Biodiesel) Applications as Fuels for Internal Combustion Engines. Prog. Energy Combust. Sci. 2007, 33, 233–271. 10.1016/j.pecs.2006.08.003. [DOI] [Google Scholar]
- Meher L.; Vidyasagar D.; Naik S. Technical Aspects of Biodiesel Production by Transesterification—A Review. Renew. Sustain. Energy Rev. 2006, 10, 248–268. 10.1016/j.rser.2004.09.002. [DOI] [Google Scholar]
- Gholami Z.; Abdullah A. Z.; Lee K.-T. Dealing with the Surplus of Glycerol Production from Biodiesel Industry through Catalytic Upgrading to Polyglycerols and other Value-Added Products. Renew. Sustain. Energy Rev. 2014, 39, 327–341. 10.1016/j.rser.2014.07.092. [DOI] [Google Scholar]
- Johnson D. T.; Taconi K. A. The Glycerin Glut: Options for the Value-Added Conversion of Crude Glycerol Resulting from Biodiesel Production. Environ. Prog. 2007, 26, 338–348. 10.1002/ep.10225. [DOI] [Google Scholar]
- Katryniok B.; Paul S.; Capron M.; Dumeignil F. Towards the Sustainable Production of Acrolein by Glycerol Dehydration. ChemSusChem 2009, 2, 719–730. 10.1002/cssc.200900134. [DOI] [PubMed] [Google Scholar]
- Katryniok B.; Paul S.; Dumeignil F. Recent Developments in the Field of Catalytic Dehydration of Glycerol to Acrolein. ACS Catal. 2013, 3, 1819–1834. 10.1021/cs400354p. [DOI] [Google Scholar]
- Martin A.; Armbruster U.; Gandarias I.; Arias P. L. Glycerol Hydrogenolysis into Propanediols using In Situ Generated Hydrogen – A critical review. Eur. J. Lipid Sci. Technol. 2013, 115, 9–27. 10.1002/ejlt.201200207. [DOI] [Google Scholar]
- Ruppert A. M.; Weinberg K.; Palkovits R. Hydrogenolysis Goes Bio: From Carbohydrates and Sugar Alcohols to Platform Chemicals. Angew. Chem., Int. Ed. 2012, 51, 2564–2601. 10.1002/anie.201105125. [DOI] [PubMed] [Google Scholar]
- Sun D.; Yamada Y.; Sato S.; Ueda W. Glycerol Hydrogenolysis into Useful C3 Chemicals. Appl. Catal., B 2016, 193, 75–92. 10.1016/j.apcatb.2016.04.013. [DOI] [Google Scholar]
- Wang Y.; Zhou J.; Guo X. Catalytic Hydrogenolysis of Glycerol to Propanediols: A Review. RSC Adv. 2015, 5, 74611–74628. 10.1039/c5ra11957j. [DOI] [Google Scholar]
- Dodekatos G.; Schünemann S.; Tüysüz H. Recent Advances in Thermo-, Photo-, and Electrocatalytic Glycerol Oxidation. ACS Catal. 2018, 8, 6301–6333. 10.1021/acscatal.8b01317. [DOI] [Google Scholar]
- Katryniok B.; Kimura H.; Skrzyńska E.; Girardon J.-S.; Fongarland P.; Capron M.; Ducoulombier R.; Mimura N.; Paul S.; Dumeignil F. Selective Catalytic Oxidation of Glycerol: Perspectives for High Value Chemicals. Green Chem. 2011, 13, 1960–1979. 10.1039/c1gc15320j. [DOI] [Google Scholar]
- Vaidya P. D.; Rodrigues A. E. Glycerol Reforming for Hydrogen Production: A Review. Chem. Eng. Technol. 2009, 32, 1463–1469. 10.1002/ceat.200900120. [DOI] [Google Scholar]
- Schwengber C. A.; Alves H. J.; Schaffner R. A.; da Silva F. A.; Sequinel R.; Bach V. R.; Ferracin R. J. Overview of Glycerol Reforming for Hydrogen Production. Renew. Sustain. Energy Rev. 2016, 58, 259–266. 10.1016/j.rser.2015.12.279. [DOI] [Google Scholar]
- Pagliaro M.Esters, Ethers, Polyglycerols, and Polyesters. In Glycerol; Pagliaro M., Ed.; Elsevier: 2017; Chapter 3, pp 59–90. [Google Scholar]
- Izquierdo J. F.; Montiel M.; Palés I.; Outón P. R.; Galán M.; Jutglar L.; Villarrubia M.; Izquierdo M.; Hermo M. P.; Ariza X. Fuel Additives from Glycerol Etherification with Light Olefins: State of the Art. Renew. Sustain. Energy Rev. 2012, 16, 6717–6724. 10.1016/j.rser.2012.08.005. [DOI] [Google Scholar]
- Martin A.; Richter M. Oligomerization of Glycerol – A Critical Review. Eur. J. Lipid Sci. Technol. 2011, 113, 100–117. 10.1002/ejlt.201000386. [DOI] [Google Scholar]
- Okoye P. U.; Hameed B. H. Review on Recent Progress in Catalytic Carboxylation and Acetylation of Glycerol as a Byproduct of Biodiesel Production. Renew. Sustain. Energy Rev. 2016, 53, 558–574. 10.1016/j.rser.2015.08.064. [DOI] [Google Scholar]
- Rahmat N.; Abdullah A. Z.; Mohamed A. R. Recent Progress on Innovative and Potential Technologies for Glycerol Transformation into Fuel Additives: A Critical Review. Renew. Sustain. Energy Rev. 2010, 14, 987–1000. 10.1016/j.rser.2009.11.010. [DOI] [Google Scholar]
- van Ryneveld E.; Mahomed A. S.; van Heerden P. S.; Green M. J.; Friedrich H. B. A Catalytic Route to Lower Alcohols from Glycerol using Ni-Supported Catalysts. Green Chem. 2011, 13, 1819–1827. 10.1039/c0gc00839g. [DOI] [Google Scholar]
- Shozi M. L.; Dasireddy V. D. B. C.; Singh S.; Mohlala P.; Morgan D. J.; Friedrich H. B. Hydrogenolysis of Glycerol to Monoalcohols over Supported Mo and W Catalysts. ACS Sustainable Chem. Eng. 2016, 4, 5752–5760. 10.1021/acssuschemeng.6b01675. [DOI] [Google Scholar]
- Zhao H.; Jiang Y.; Chen P.; Fu J.; Lu X.; Hou Z. CoZn-ZIF-Derived ZnCo2O4-Framework for the Synthesis of Alcohols from glycerol. Green Chem. 2018, 20, 4299–4307. 10.1039/c8gc01768a. [DOI] [Google Scholar]
- Bühler W.; Dinjus E.; Ederer H. J.; Kruse A.; Mas C. Ionic Reactions and Pyrolysis of Glycerol as Competing Reaction Pathways in Near- and Supercritical water. J. Supercrit. Fluids 2002, 22, 37–53. 10.1016/s0896-8446(01)00105-x. [DOI] [Google Scholar]
- Haider M. H.; Dummer N. F.; Knight D. W.; Jenkins R. L.; Howard M.; Moulijn J.; Taylor S. H.; Hutchings G. J. Efficient Green Methanol Synthesis from Glycerol. Nat. Chem. 2015, 7, 1028. 10.1038/nchem.2345. [DOI] [PubMed] [Google Scholar]
- Smith P. J.; Smith L.; Dummer N. F.; Douthwaite M.; Willock D. J.; Howard M.; Knight D. W.; Taylor S. H.; Hutchings G. J. Investigating the Influence of Reaction Conditions and the Properties of Ceria for the Valorisation of Glycerol. Energies 2019, 12, 1359. 10.3390/en12071359. [DOI] [Google Scholar]
- Smith L. R.; Smith P. J.; Mugford K. S.; Douthwaite M.; Dummer N. F.; Willock D. J.; Howard M.; Knight D. W.; Taylor S. H.; Hutchings G. J. New Insights for the Valorisation of Glycerol over MgO Catalysts in the Gas-Phase. Catal. Sci. Technol. 2019, 9, 1464–1475. 10.1039/c8cy02214c. [DOI] [Google Scholar]
- Trovarelli A.; Llorca J. Ceria Catalysts at Nanoscale: How Do Crystal Shapes Shape Catalysis?. ACS Catal. 2017, 7, 4716–4735. 10.1021/acscatal.7b01246. [DOI] [Google Scholar]
- Huang W.; Gao Y. Morphology-Dependent Surface Chemistry and Catalysis of CeO2 Nanocrystals. Catal. Sci. Technol. 2014, 4, 3772–3784. 10.1039/c4cy00679h. [DOI] [Google Scholar]
- Qiao Z.-A.; Wu Z.; Dai S. Shape-Controlled Ceria-based Nanostructures for Catalysis Applications. ChemSusChem 2013, 6, 1821–1833. 10.1002/cssc.201300428. [DOI] [PubMed] [Google Scholar]
- Tana; Zhang M.; Li J.; Li H.; Li Y.; Shen W. Morphology-Dependent Redox and Catalytic Properties of CeO2 Nanostructures: Nanowires, Nanorods and Nanoparticles. Catal. Today 2009, 148, 179–183. 10.1016/j.cattod.2009.02.016. [DOI] [Google Scholar]
- Wu Z.; Mann A. K. P.; Li M.; Overbury S. H. Spectroscopic Investigation of Surface-Dependent Acid–Base Property of Ceria Nanoshapes. J. Phys. Chem. C 2015, 119, 7340–7350. 10.1021/acs.jpcc.5b00859. [DOI] [Google Scholar]
- Zhou K.; Wang X.; Sun X.; Peng Q.; Li Y. Enhanced Catalytic Activity of Ceria Nanorods from Well-Defined Reactive Crystal Planes. J. Catal. 2005, 229, 206–212. 10.1016/j.jcat.2004.11.004. [DOI] [Google Scholar]
- Agarwal S.; Zhu X.; Hensen E. J. M.; Lefferts L.; Mojet B. L. Defect Chemistry of Ceria Nanorods. J. Phys. Chem. C 2014, 118, 4131–4142. 10.1021/jp409989y. [DOI] [Google Scholar]
- Si R.; Flytzani-Stephanopoulos M. Shape and Crystal-Plane Effects of Nanoscale Ceria on the Activity of Au-CeO2 Catalysts for the Water–Gas Shift Reaction. Angew. Chem., Int. Ed. 2008, 47, 2884–2887. 10.1002/anie.200705828. [DOI] [PubMed] [Google Scholar]
- Soykal I. I.; Bayram B.; Sohn H.; Gawade P.; Miller J. T.; Ozkan U. S. Ethanol Steam Reforming over Co/CeO2 Catalysts: Investigation of the Effect of Ceria Morphology. Appl. Catal., A 2012, 449, 47–58. 10.1016/j.apcata.2012.09.038. [DOI] [Google Scholar]
- Huang X.-S.; Sun H.; Wang L.-C.; Liu Y.-M.; Fan K.-N.; Cao Y. Morphology Effects of Nanoscale Ceria on the Activity of Au/CeO2 Catalysts for Low-Temperature CO Oxidation. Appl. Catal., B 2009, 90, 224–232. 10.1016/j.apcatb.2009.03.015. [DOI] [Google Scholar]
- Aneggi E.; Wiater D.; de Leitenburg C.; Llorca J.; Trovarelli A. Shape-Dependent Activity of Ceria in Soot Combustion. ACS Catal. 2014, 4, 172–181. 10.1021/cs400850r. [DOI] [Google Scholar]
- Wang S.; Zhao L.; Wang W.; Zhao Y.; Zhang G.; Ma X.; Gong J. Morphology Control of Ceria Nanocrystals for Catalytic Conversion of CO2 with Methanol. Nanoscale 2013, 5, 5582–5588. 10.1039/c3nr00831b. [DOI] [PubMed] [Google Scholar]
- Vilé G.; Colussi S.; Krumeich F.; Trovarelli A.; Pérez-Ramírez J. Opposite Face Sensitivity of CeO2 in Hydrogenation and Oxidation Catalysis. Angew. Chem., Int. Ed. 2014, 53, 12069–12072. 10.1002/anie.201406637. [DOI] [PubMed] [Google Scholar]
- Mai H.-X.; Sun L.-D.; Zhang Y.-W.; Si R.; Feng W.; Zhang H.-P.; Liu H.-C.; Yan C.-H. Shape-Selective Synthesis and Oxygen Storage Behavior of Ceria Nanopolyhedra, Nanorods, and Nanocubes. J. Phys. Chem. B 2005, 109, 24380–24385. 10.1021/jp055584b. [DOI] [PubMed] [Google Scholar]
- Kresse G.; Hafner J. Ab Initio Molecular Dynamics for Liquid Metals. Phys. Rev. B 1993, 47, 558–561. 10.1103/physrevb.47.558. [DOI] [PubMed] [Google Scholar]
- Kresse G.; Joubert D. From Ultrasoft Pseudopotentials to the Projector Augmented-Wave Method. Phys. Rev. B 1999, 59, 1758–1775. 10.1103/physrevb.59.1758. [DOI] [Google Scholar]
- Perdew J. P.; Burke K.; Ernzerhof M. Generalized Gradient Approximation Made Simple. Phys. Rev. Lett. 1996, 77, 3865–3868. 10.1103/physrevlett.77.3865. [DOI] [PubMed] [Google Scholar]
- Liechtenstein A. I.; Anisimov V. I.; Zaanen J. Density-Functional Theory and Strong Interactions: Orbital Ordering in Mott-Hubbard Insulators. Phys. Rev. B 1995, 52, R5467–R5470. 10.1103/physrevb.52.r5467. [DOI] [PubMed] [Google Scholar]
- Loschen C.; Carrasco J.; Neyman K. M.; Illas F. First-Principles LDA + U and GGA + U Study of Cerium Oxides: Dependence on the Effective U Parameter. Phys. Rev. B 2007, 75, 035115. 10.1103/physrevb.75.035115. [DOI] [Google Scholar]
- Grimme S.; Antony J.; Ehrlich S.; Krieg H. A Consistent and Accurate Ab Initio Parametrization of Density Functional Dispersion Correction (DFT-D) for the 94 Elements H-Pu. J. Chem. Phys. 2010, 132, 154104. 10.1063/1.3382344. [DOI] [PubMed] [Google Scholar]
- Gerward L.; Staun Olsen J.; Petit L.; Vaitheeswaran G.; Kanchana V.; Svane A. Bulk Modulus of CeO2 and PrO2—An Experimental and Theoretical Study. J. Alloys Compd. 2005, 400, 56–61. 10.1016/j.jallcom.2005.04.008. [DOI] [Google Scholar]
- Tasker P. W. The Stability of Ionic Crystal Surfaces. J. Phys. C: Solid State Phys. 1979, 12, 4977–4984. 10.1088/0022-3719/12/22/036. [DOI] [Google Scholar]
- Howard K. L.; Willock D. J. A Periodic DFT Study of the Activation of O2 by Au Nanoparticles on α-Fe2O3. Faraday Discuss. 2011, 152, 135–151. 10.1039/c1fd00026h. [DOI] [PubMed] [Google Scholar]
- Molinari M.; Parker S. C.; Sayle D. C.; Islam M. S. Water Adsorption and Its Effect on the Stability of Low Index Stoichiometric and Reduced Surfaces of Ceria. J. Phys. Chem. C 2012, 116, 7073–7082. 10.1021/jp300576b. [DOI] [Google Scholar]
- Hjorth Larsen A.; Jørgen Mortensen J.; Blomqvist J.; Castelli I. E.; Christensen R.; Dułak M.; Friis J.; Groves M. N.; Hammer B.; Hargus C.; Hermes E. D.; Jennings P. C.; Bjerre Jensen P.; Kermode J.; Kitchin J. R.; Leonhard Kolsbjerg E.; Kubal J.; Kaasbjerg K.; Lysgaard S.; Bergmann Maronsson J.; Maxson T.; Olsen T.; Pastewka L.; Peterson A.; Rostgaard C.; Schiøtz J.; Schütt O.; Strange M.; Thygesen K. S.; Vegge T.; Vilhelmsen L.; Walter M.; Zeng Z.; Jacobsen K. W. The Atomic Simulation Environment-a Python Library for Working with Atoms. J. Phys.: Condens. Matter 2017, 29, 273002. 10.1088/1361-648x/aa680e. [DOI] [PubMed] [Google Scholar]
- Wu Q.; Zhang F.; Xiao P.; Tao H.; Wang X.; Hu Z.; Lü Y. Great Influence of Anions for Controllable Synthesis of CeO2 Nanostructures: From Nanorods to Nanocubes. J. Phys. Chem. C 2008, 112, 17076–17080. 10.1021/jp804140e. [DOI] [Google Scholar]
- Chen L.; Fleming P.; Morris V.; Holmes J. D.; Morris M. A. Size-Related Lattice Parameter Changes and Surface Defects in Ceria Nanocrystals. J. Phys. Chem. C 2010, 114, 12909–12919. 10.1021/jp1031465. [DOI] [Google Scholar]
- Jiang Q.; Liang L. H.; Zhao D. S. Lattice Contraction and Surface Stress of fcc Nanocrystals. J. Phys. Chem. B 2001, 105, 6275–6277. 10.1021/jp010995n. [DOI] [Google Scholar]
- Zheng X.; Li Y.; Zhang L.; Shen L.; Xiao Y.; Zhang Y.; Au C.; Jiang L. Insight into the Effect of Morphology on Catalytic Performance of Porous CeO2 Nanocrystals for H2S Selective Oxidation. Appl. Catal., B 2019, 252, 98–110. 10.1016/j.apcatb.2019.04.014. [DOI] [Google Scholar]
- Zhang Z.; Wang Z.-Q.; Li Z.; Zheng W.-B.; Fan L.; Zhang J.; Hu Y.-M.; Luo M.-F.; Wu X.-P.; Gong X.-Q.; Huang W.; Lu J.-Q. Metal-Free Ceria Catalysis for Selective Hydrogenation of Crotonaldehyde. ACS Catal. 2020, 10, 14560–14566. 10.1021/acscatal.0c04523. [DOI] [Google Scholar]
- Wu Z.; Li M.; Howe J.; Meyer H. M.; Overbury S. H. Probing Defect Sites on CeO2 Nanocrystals with Well-Defined Surface Planes by Raman Spectroscopy and O2 Adsorption. Langmuir 2010, 26, 16595–16606. 10.1021/la101723w. [DOI] [PubMed] [Google Scholar]
- Taniguchi T.; Watanabe T.; Sugiyama N.; Subramani A. K.; Wagata H.; Matsushita N.; Yoshimura M. Identifying Defects in Ceria-Based Nanocrystals by UV Resonance Raman Spectroscopy. J. Phys. Chem. C 2009, 113, 19789–19793. 10.1021/jp9049457. [DOI] [Google Scholar]
- Nakajima A.; Yoshihara A.; Ishigame M. Defect-Induced Raman Spectra in Doped CeO2. Phys. Rev. B 1994, 50, 13297–13307. 10.1103/physrevb.50.13297. [DOI] [PubMed] [Google Scholar]
- Filtschew A.; Hofmann K.; Hess C. Ceria and Its Defect Structure: New Insights from a Combined Spectroscopic Approach. J. Phys. Chem. C 2016, 120, 6694–6703. 10.1021/acs.jpcc.6b00959. [DOI] [Google Scholar]
- Weber W. H.; Hass K. C.; McBride J. R. Raman study of CeO2: Second-order Scattering, Lattice Dynamics, and Particle-Size Effects. Phys. Rev. B 1993, 48, 178–185. 10.1103/physrevb.48.178. [DOI] [PubMed] [Google Scholar]
- Guo M.; Lu J.; Wu Y.; Wang Y.; Luo M. UV and Visible Raman Studies of Oxygen Vacancies in Rare-Earth-Doped Ceria. Langmuir 2011, 27, 3872–3877. 10.1021/la200292f. [DOI] [PubMed] [Google Scholar]
- Reddy B. M.; Khan A.; Yamada Y.; Kobayashi T.; Loridant S.; Volta J.-C. Structural Characterization of CeO2–TiO2 and V2O5/CeO2–TiO2 Catalysts by Raman and XPS Techniques. J. Phys. Chem. B 2003, 107, 5162–5167. 10.1021/jp0344601. [DOI] [Google Scholar]
- Aškrabić S.; Dohčević-Mitrović Z.; Radovic M.; Scepanovic M. J. Phonon–Phonon Interactions in Ce0.85Gd0.15O2−δ Nanocrystals Studied by Raman Spectroscopy. J. Raman Spectrosc. 2009, 40, 650–655. 10.1002/jrs.2177. [DOI] [Google Scholar]
- McBride J. R.; Hass K. C.; Poindexter B. D.; Weber W. H. Raman and X-Ray Studies of Ce1–xRExO2–y, where RE=La, Pr, Nd, Eu, Gd, and Tb. J. Appl. Phys. 1994, 76, 2435–2441. 10.1063/1.357593. [DOI] [Google Scholar]
- Nolan M.; Parker S. C.; Watson G. W. The Electronic Structure of Oxygen Vacancy Defects at the Low Index Surfaces of Ceria. Surf. Sci. 2005, 595, 223–232. 10.1016/j.susc.2005.08.015. [DOI] [Google Scholar]
- Trovarelli A. Catalytic Properties of Ceria and CeO2-Containing Materials. Catal. Rev. 1996, 38, 439–520. 10.1080/01614949608006464. [DOI] [Google Scholar]
- Rao G. R.; Mishra B. G. Structural, Redox and Catalytic Chemistry of Ceria Based Materials. Bull. Catal. Soc. India 2003, 2, 122–134. [Google Scholar]
- Wu Z.; Zhang J.; Benfield R. E.; Ding Y.; Grandjean D.; Zhang Z.; Ju X. Structure and Chemical Transformation in Cerium Oxide Nanoparticles Coated by Surfactant Cetyltrimethylammonium Bromide (CTAB): An X-ray Absorption Spectroscopic Study. J. Phys. Chem. B 2002, 106, 4569–4577. 10.1021/jp011520z. [DOI] [Google Scholar]
- Marchbank H. R.; Clark A. H.; Hyde T. I.; Playford H. Y.; Tucker M. G.; Thompsett D.; Fisher J. M.; Chapman K. W.; Beyer K. A.; Monte M.; Longo A.; Sankar G. Structure of Nano-sized CeO2 Materials: Combined Scattering and Spectroscopic Investigations. ChemPhysChem 2016, 17, 3494–3503. 10.1002/cphc.201600697. [DOI] [PubMed] [Google Scholar]
- Cvetanović R. J.; Amenomiya Y. A Temperature Programmed Desorption Technique for Investigation of Practical Catalysts. Catal. Rev. 1972, 6, 21–48. 10.1080/01614947208078690. [DOI] [Google Scholar]
- de Jong A. M.; Niemantsverdriet J. W. Thermal desorption analysis: Comparative Test of Ten Commonly Applied Procedures. Surf. Sci. 1990, 233, 355–365. 10.1016/0039-6028(90)90649-s. [DOI] [Google Scholar]
- Chai S.-H.; Wang H.-P.; Liang Y.; Xu B.-Q. Sustainable Production of Acrolein: Investigation of Solid Acid-Base Catalysts for Gas-Phase Dehydration of Glycerol. Green Chem. 2007, 9, 1130–1136. 10.1039/b702200j. [DOI] [Google Scholar]
- Hernandez D.; Velasquez M.; Ayrault P.; Lopez D.; Fernandez J. J.; Santamaria A.; Batiot-Dupeyrat C. Gas Phase Glycerol Conversion over Lanthanum based Catalysts: LaNiO3 and La2O3. Appl. Catal., A 2013, 467, 315–324. 10.1016/j.apcata.2013.07.016. [DOI] [Google Scholar]
- Velasquez M.; Santamaria A.; Batiot-Dupeyrat C. Selective Conversion of Glycerol to Hydroxyacetone in Gas Phase over La2CuO4 Catalyst. Appl. Catal., B 2014, 160–161, 606–613. 10.1016/j.apcatb.2014.06.006. [DOI] [Google Scholar]
- Célerier S.; Morisset S.; Batonneau-Gener I.; Belin T.; Younes K.; Batiot-Dupeyrat C. Glycerol Dehydration to Hydroxyacetone in Gas Phase over Copper Supported on Mgnesium Oxide (Hydroxide) Fluoride Catalysts. Appl. Catal., A 2018, 557, 135–144. 10.1016/j.apcata.2018.03.022. [DOI] [Google Scholar]
- Corma A.; Huber G.; Sauvanaud L.; Oconnor P. Biomass to Chemicals: Catalytic Conversion of Glycerol/Water Mixtures into Acrolein, Reaction Network. J. Catal. 2008, 257, 163–171. 10.1016/j.jcat.2008.04.016. [DOI] [Google Scholar]
- Snell R. W.; Shanks B. H. Insights into the Ceria-Catalyzed Ketonization Reaction for Biofuels Applications. ACS Catal. 2013, 3, 783–789. 10.1021/cs400003n. [DOI] [Google Scholar]
- Snell R. W.; Hakim S. H.; Dumesic J. A.; Shanks B. H. Catalysis with Ceria Nanocrystals: Bio-Oil Model Compound Ketonization. Appl. Catal., A 2013, 464–465, 288–295. 10.1016/j.apcata.2013.06.003. [DOI] [Google Scholar]
- Orozco L. M.; Renz M.; Corma A. Cerium Oxide as a Catalyst for the Ketonization of Aldehydes: Mechanistic Insights and a Convenient Way to Alkanes without the Consumption of External Hydrogen. Green Chem. 2017, 19, 1555–1569. 10.1039/c6gc03511f. [DOI] [Google Scholar]
Associated Data
This section collects any data citations, data availability statements, or supplementary materials included in this article.