

Abstract
Skin melanoma remains a highly prevalent and yet deadly form of cancer, with the exact degree of melanoma-associated mortality being strongly dependent upon the local tumor microenvironment. The exact composition of stromal and immune cells within this microenvironmental region has the potential to profoundly impact melanoma progression and prognosis. As such, the present study was designed with the goal of clarifying the predictive relevance of stromal and immune cell-related genes in melanoma patients through comprehensive bioinformatics analyses. We therefore analyzed melanoma sample gene expression within The Cancer Genome Atlas database and employed the ESTIMATE algorithm as a means of calculating both stromal and immune scores that were in turn used for identifying differentially expressed genes (DEGs). Subsequently, univariate analyses were used to detect DEGs associated with melanoma patient survival, and through additional functional enrichment analyses, we determined that these survival-related DEGs are largely related to inflammatory and immune responses. A prognostic signature comprised of 10 genes (IL15, CCL8, CLIC2, SAMD9L, TLR2, HLA.DQB1, IGHV1–18, RARRES3, GBP4, APOBEC3G) was generated. This 10-gene signature effectively separated melanoma patients into low- and high-risk groups based upon their survival. These low- and high-risk groups also exhibited distinct immune statuses and differing degrees of immune cell infiltration. In conclusion, our results offer novel insights into a number of microenvironment-associated genes that impact survival outcomes in melanoma patients, potentially highlighting these genes as viable therapeutic targets.
Keywords: ESTIMATE, skin melanoma, TCGA
1. Introduction
Skin melanoma remains a highly malignant melanoma subtype, and it is also highly prevalent, accounting for approximately 4.6% of all malignant tumor types and 1.7% of cancer-related death.[1] Melanoma incidence has been rising in recent years, and although early state melanoma can readily undergo curative resection, the disease is often not detected until a later stage at which point the prognosis is poor. Indeed, advanced melanomas are often not responsive to chemotherapy or radiotherapy. However, as these tumors are often responsive to immunotherapeutic intervention, it is essential that novel immunomodulatory approaches to treating melanoma be developed.[2]
Although tumor cells are often examined as individual entities, there is increasingly clear evidence that the local tumor microenvironment is essential for shaping tumor development.[3,4] Microenvironmental cells and proteins can shape diverse tumor cell activities including survival and chemotaxis. This tumor microenvironment is also dynamic and is composed of stromal, immune, and endothelial progenitor cells, as well as a complex extracellular matrix and a diverse array of cytokines and growth factors.[5] Immunological and stromal cells are the primary cells that drive melanoma growth and progression.[6,7] Indeed, numerous immunomodulatory therapeutic approaches to treating melanoma have been designed in recent years.[8,9] The ESTIMATE (Estimation of Stromal and Immune cells in Malignant Tumor tissues using Expression data) algorithm is a tool that is designed to gauge stromal and immune cell infiltration into a given tumor sample according to gene expression datasets.[10] This algorithm has previously been used to evaluate microenvironmental composition associated with colon cancer,[11] prostate cancer,[10] and glioblastoma.[12,13] However, no comparable studies regarding stromal and immune cell infiltration in melanoma have been conducted to date.
In the present analysis, we therefore evaluated melanoma patient The Cancer Genome Atlas (TCGA) genome expression profiles and the ESTIMATE algorithm to define the immune/stromal scores for these patients, leading us to identify a subset of microenvironment-associated genes related to melanoma patient overall survival (OS), then used these genes to construct a gene signature related to patient survival outcomes, and to explore the significance of this signature in relative to the immune response and immune cell infiltration. Together, our results offer novel insight into the melanoma tumor microenvironment while highlighting potential prognostically and/or therapeutically relevant gene targets in these tumors.
2. Materials and methods
2.1. Sample datasets
The raw mRNA expression data and clinical data of skin melanoma were downloaded from TCGA database (https://gdc.nci.nih.gov/). Extracted data were from patients with skin melanoma. In total, 470 skin melanoma samples (combined set) were divided into equally sized training and validation sets at random. The validation set was utilized when validating training set findings. As all data included herein were isolated from public sources, no ethical oversight was required.
2.2. DEG identification based on immune/stromal scores
ESTIMATE algorithm was applied to estimate the sample stromal and immune scores. Stromal and immune scores were calculated by the ESTIMATE package in R. ESTIMATE outputs stromal, immune and ESTIMATE scores by performing single-sample gene set enrichment analysis (GSEA). Based on immune/stromal score values, patients were divided into low- and high-score groups by median split. The expression profiles of melanoma patients with a high immune (or stromal) score were compared to those with a low score to identify immune (or stromal) score-related DEGs. The edge R package was then used for data analysis, with differentially expressed genes being defined as genes meeting the following criteria: false discovery rate (FDR) <0.05 and |log2 fold change| >1.
2.3. Identification and functional enrichment analysis of survival-related DEGs
Univariate Cox regression analyses were used for identifying DEGs linked with melanoma patient survival using the ‘survival’ R package (bioconductor.org/ packages/survivalr/). Prognostic DEGs were those with a log-rank P < .05. Functional enrichment analyses were used to identify potential pathways in which these survival-related DEGs were enriched. Kyoto Encyclopedia of Genes and Genomes (KEGG) pathway enrichment was assessed at a P < .05 significance threshold.
2.4. Development and validation of a survival-related DEG prognostic signature
A risk signature was constructed using these survival-related DEGs, with a least absolute shrinkage and selection operator (LASSO) regression strategy being employed to further screen these genes and to optimize the risk signature. Prognostic risk score values were ultimately calculated as follows: Risk score = Gene 1 × β1 + Gene 2 × β2 +… Gene n × βn. The β symbol corresponds to a regression coefficient which had been defined for each gene of interest based upon the training dataset. Median prognostic risk score values were then employed for separating melanoma patients into low- and high-risk groups. This formula was them employed for assessing validation cohort patient samples. Signature prognostic relevance was gauged through univariate analyses of patients in both cohorts, after which the independent prognostic relevance of this signature risk score in these 2 cohorts was evaluated via multivariate analysis.
2.5. Bioinformatics analysis
We carried out a principal component analysis (PCA) to assess expression patterns for groups of patients, and GSEA was performed as a means of assessing whether there were significant differences between groups with respect to identified gene sets. We examined 2 gene sets (immune system process, M13664 and immune response, M19817) that were extracted from the Molecular Signatures Database v4.0 (http://www.broadinstitute.org/gsea/msigdb/index.jsp). We also examined KEGG gene sets from MSigDB. A normalized enrichment score <0.05 and FDR < 0.05 were used to establish significance.
2.6. Immune infiltration analysis
The CIBERSORT algorithm[14] was employed to transformed skin melanoma gene expression profiles into the proportion of 22 tumor-infiltrating immune cells. The proportions of the 22 tumor-infiltrating immune cells in each sample were determined by using the “CIBERSORT” (R package). Features were compared between groups via 1-tailed t tests.
2.7. Statistical analysis
R (v3.6.3; http://www.Rproject.org) was employed for all analyses, with LASSO regression analyses being conducted using the “glmnet" package. The final gene signature was defined according to the sum of individual gene expression levels following weighting based upon gene-specific regression coefficients (β) values. Kaplan-Meier curves and log-rank tests were employed when conducting prognostic assessments, and figures were prepared with GraphPad Prism 8 (GraphPad Software Inc., CA). Univariate and multivariate Cox regression analyses were performed to identify predictors of patient prognosis. We utilized the “survival ROC" package for time-dependent receiver-operating characteristic curve curve analyses. P < .05 was the threshold of significance.
3. Results
3.1. Association of clinical characteristics with stromal/immune scores
We began by downloading TCGA gene expression data from 470 patients with skin melanoma (Table 1), including 290 males and 180 females (61.71% and 38.29%). The median age was 58.09 years (range: 15–90). Patients presented with AJCC 8th stage I, II, III, and IV tumors in 18.94%, 29.79%, 36.38%, and 4.89% of cases.
Table 1.
Clinical characteristics of combined, training, and validation cohort.
| Characteristics | Combined cohort | Training cohort | Validation cohort |
| n = 470 | n = 235 | n = 235 | |
| Age, y | 58.09 ± 12.93 | 56.16 ± 13.52 | 59.71 ± 10.8 |
| Sex | |||
| Female | 180 (38.29%) | 93 (39.57%) | 87 (37.02%) |
| Male | 290 (61.71%) | 142 (60.43%) | 148 (62.98) |
| T stage (8th AJCC) | |||
| T1 | 50 (10.64%) | 25 (10.64%) | 25 (10.64%) |
| T2 | 78 (16.59%) | 30 (12.77%) | 48 (20.43%) |
| T3 | 90 (19.15%) | 44 (18.72%) | 46 (19.57%) |
| T4 | 153 (32.55%) | 78 (33.19%) | 75 (31.91%) |
| Tx | 99 (21.06%) | 58 (24.68%) | 41 (17.45%) |
| N stage (8th AJCC) | |||
| N0 | 235 (50%) | 113 (48.09%) | 122 (51.91%) |
| N1 | 74 (15.74%) | 38 (16.17%) | 36 (15.32%) |
| N2 | 49 (10.43%) | 27 (11.49%) | 22 (9.36%) |
| N3 | 55 (11.7%) | 27 (11.49%) | 28 (11.91%) |
| Nx | 57 (12.13%) | 30 (12.77%) | 27 (11.49%) |
| M stage (8th AJCC) | |||
| M0 | 418 (88.94%) | 198 (84.26%) | 220 (93.62%) |
| M1 | 24 (5.11%) | 18 (7.66%) | 6 (2.55%) |
| Mx | 28 (5.95%) | 19 (8.08%) | 9 (3.83%) |
| TNM stage (8th AJCC) | |||
| Stage I | 89 (18.94%) | 37 (15.74%) | 52 (22.13%) |
| Stage II | 140 (29.79%) | 70 (29.79%) | 70 (22.79%) |
| Stage III | 171 (36.38%) | 85 (36.17%) | 86 (36.59%) |
| Stage IV | 23 (4.89%) | 17 (7.23%) | 6 (2.55%) |
| Other | 47 (10%) | 26 (11.06%) | 21 (8.94%) |
The ESTIMATE algorithm was then employed as a means of calculating stromal scores (range: −1800.51 to 1901.99), immune scores (range: −1476.28 to 3780.29) and ESTIMATE scores (range: −2618.28 to 5098.14) (Fig. 1 and Supplemental Table 1). The link between stromal/immune scores and the pathologic properties of melanoma patients was evaluated by assessing score distributions among different T stages, N stages, M stages, and TNM stages. We found that these stromal/immune scores were significantly linked to T stage and TNM stage. Interestingly, stromal scores increased with increasing T stage (P < .001) and TNM stage (P < .001), whereas immune scores decreased with increasing T stage (P < .001) and TNM stage (P < .001). However, both stromal and immune scores were not significantly linked with N or M stage (all P > .05) (Fig. 1).
Figure 1.
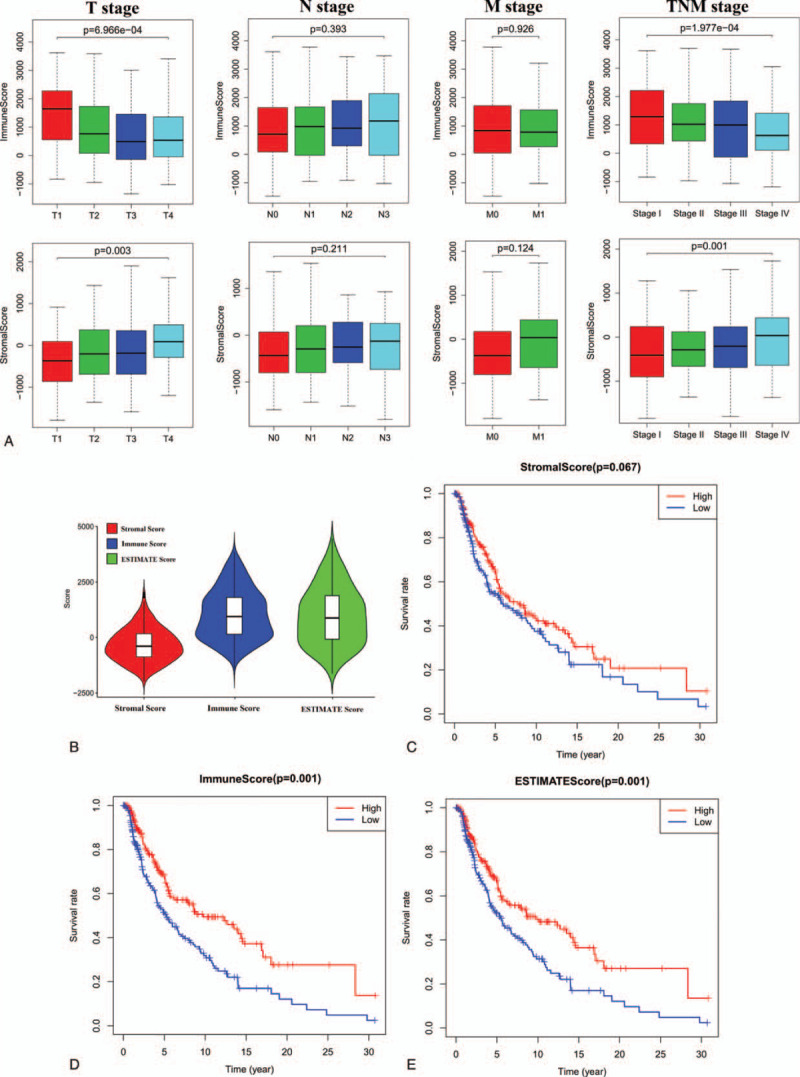
Association of stromal and immune scores with skin melanoma pathology and prognosis. (A) Distributions and comparisons of stromal and immune scores among different T stages, N stages, M stages, and TNM stages. (B) Violin plot of the stromal, immune and ESTIMATES scores. (C) Kaplan-Meier plot of overall survival for patients with low vs. high stromal scores. (D) Kaplan-Meier plot of overall survival for patients with low versus high immune scores. (E) Kaplan-Meier plot of overall survival for patients with simultaneously low ESTIMATES scores versus patients with high ESTIMATES scores.
To explore the prognostic relevance of these immune and stromal scores, we separated patients into low- and high-score groups by median split (median stromal score = −330.28; median immune score = 862.96; median ESTIMATE score = 563.81). Subsequent Kaplan-Meier analyses revealed that patients with high immune and ESTIMATE scores exhibited an increase in OS relative to those for whom these scores were low (P < .0001) (Fig. 1).
3.2. Identification of DEGs based upon immune/stromal scores
We assessed RNA-seq data from these 470 melanoma patients in the TCGA database in an effort to explore how gene expression levels and the immune/stromal scores generated above were related. The expression profiles of melanoma patients with a high immune (or stromal) score were compared to those with a low score to identify immune (or stromal) score-related DEGs. In total, we identified 2054 stromal score-related DEGs (upregulated, n = 1956; downregulated, n = 98) and 1837 immune score-related DEGs (upregulated, n = 1687; downregulated, n = 150). (FDR < 0.05 and |log2 fold change| >1) (Fig. 2 and Supplemental Table 2). The expression profiles of stromal and immune score-related DEGs are visualized, respectively, on the heatmaps (Fig. 3).
Figure 2.

Volcano plot of differentially expressed genes (DEGs) from the low vs. high stromal score (A) /immune score (B) groups. Genes with P < .05 are shown in red (log2 fold change >1.0) and blue (log2 fold change<−1.0). Black plots represent the remaining genes (those with no significant difference). Forest plot of hazard ratios for the top 20 stromal score(C)- and immune score(D)-related prognostic DEGs (hazard ratios and corresponding 95% confidence intervals were estimated by using the Cox proportional hazard regression model).
Figure 3.

Expression profiles of stromal and immune score-related differentially expressed genes (DEGs). Heatmaps showing expression profiles for stromal score (A)- and immune score (B)-related DEGs with unsupervised hierarchical clustering analyses. Rows represent the DEGs expression profiles, and columns indicate corresponding tumor samples.
3.3. Identification of the prognostic DEGs-based on OS
To determine the prognostic significance of these stromal/immune score-related DEGs in predicting melanoma patient OS, univariate Cox regression analyses were conducted to detect OS-associated DEGs. Among the 1837 immune score-related DEGs, 153 were significantly linked to melanoma patient OS. Using the same method, we identified 1006 stromal score-related DEGs that were significantly linked to melanoma patient OS (Fig. 2).
3.4. Functional enrichment analyses highlight the roles of survival-related DEGs
We next conducted KEGG functional enrichment analyses to assess these survival-related DEGs. KEGG analyses revealed that survival-related DEGs (from immune score-related DEGs) were mainly enriched in neuroactive ligand-receptor interaction, cytokine-cytokine receptor interaction, JAK-STAT signaling, chemokine signaling, Th1 and Th2 cell differentiation, complement and coagulation cascades, and B cell receptor signaling pathways. Additionally, the survival-related DEGs (from stromal score-related DEGs) were primarily associated with antigen processing and presentation, cell adhesion molecules, the intestinal immune network for IgA production, and type I diabetes mellitus (Fig. 4).
Figure 4.
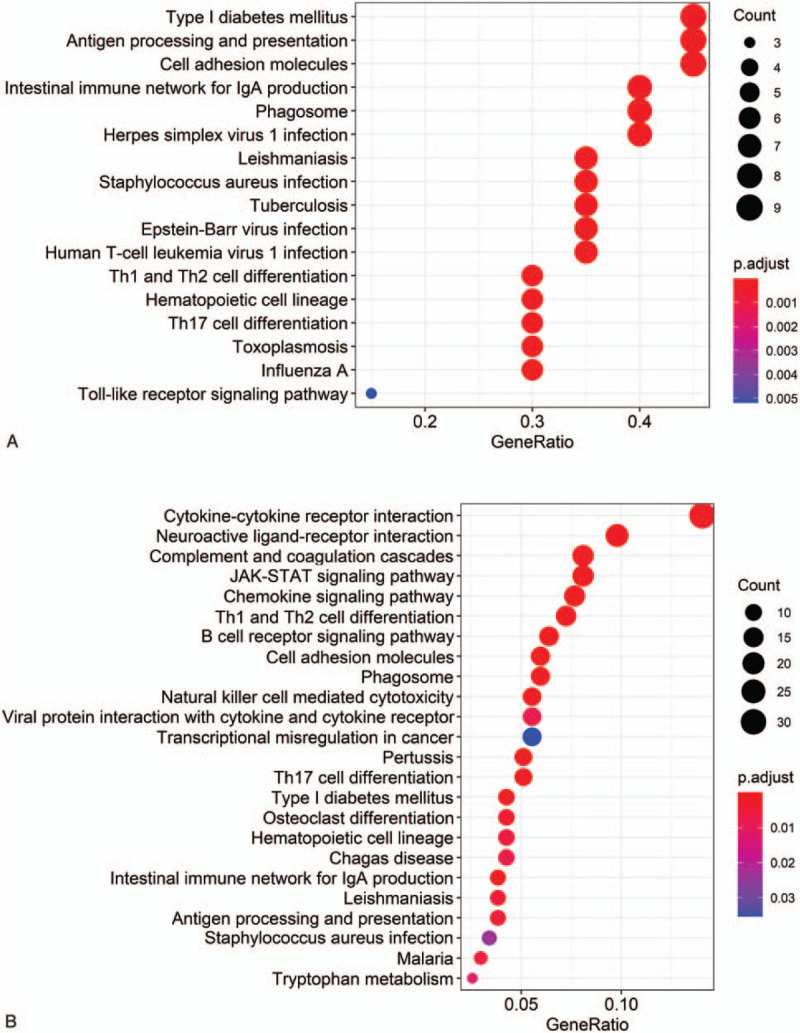
Kyoto Encyclopedia of Genes and Genomes (KEGG) pathway enrichment analysis of stromal score-related (A) and immune score-related (B) prognostic differentially expressed genes (DEGs). (x axis: the number of prognostic DEGs in each pathway; y axis: statistically Enriched KEGG pathway, P values were adjusted by false discovery rate).
3.5. Construction of a prognostic signature based on survival-related DEGs
Based on melanoma patient survival data in the training cohort, we used above survival-related DEGs as candidates for the construction of a gene risk signature. A LASSO Cox regression approach was employed to ultimately select 10 genes for inclusion in this signature (Table 2). We established a risk-scoring model based on the expression of 10-gene signature to predict survival. The risk score formula is as follows: risk score = (−0.03884) × expr IL15 + (−0.00036) × expr CCL8 + (−0.00245) × expr CLIC2 + (−0.00833) × expr SAMD9L + (−0.01267) × expr TLR2 + (−0.00028) × expr HLA.DQB1 + (−0.00014) × expr IGHV1-18 + (−0.00268) × expr GBP4 + (−0.0013) × expr RARRES3 + −0.00163) × expr APOBEC3G. “expr” represents the expression value of the corresponding gene. To confirm the prognostic significance of the risk score. The median risk score (0.863) was identified as cutoff value to divide the patients into high- and low-risk group (Fig. 5).
Table 2.
10-Gene signature.
| Gene symbol | Gene ID | Description | Coefficient |
| IL15 | 80328 | Interleukin 15 | −0.03884 |
| CCL8 | 6355 | Chemokine (C-C motif) ligand 8 | −0.00036 |
| CLIC2 | 1193 | Chloride intracellular channel protein 2 | −0.00245 |
| SAMD9L | 219285 | Sterile alpha motif domain containing 9-like | −0.00833 |
| TLR2 | 7097 | Toll-like receptor 2 | −0.01267 |
| HLA.DQB1 | 3119 | Human leukocyte antigen DQB1 | −0.00028 |
| IGHV1-18 | 9606 | Immunoglobulin heavy variable 1-18 | −0.00014 |
| GBP4 | 115361 | GTP-binding protein 4 | −0.00268 |
| RARRES3 | 5920 | Retinoic acid receptor responder (tazarotene induced) 3 | −0.0013 |
| APOBEC3G | 60489 | Apolipoprotein B mRNA editing enzyme, catalytic polypeptide-like 3G | −0.00163 |
Figure 5.

Construction and validation of 10-gene signature risk score model. (A) LASSO coefficient spectrum of 10 genes in skin melanoma. Generate a coefficient distribution map for a logarithmic (λ) sequence. (B) Selecting the best parameters for skin melanoma in the LASSO model (λ). Distribution of risk score, OS, gene expression, and clinicopathologic features in in the training (C) and validation (D) datasets. Heatmap of the expression of 10 microenvironment-related prognostic genes in low-risk and high-risk groups (Rows represent corresponding genes, whereas columns indicate corresponding patients). Clinicopathologic features in low-risk and high-risk groups stratified by the signature. Rows represent corresponding items (T stage, N stage, M stage, TNM stage, age, and sex). Cases in low-risk group displayed lower age, T and TNM stage in training and validation. (∗P < .05, ∗∗P < .01, ∗∗∗P < .001).
Consistent with our expectations, low-risk melanoma patients (risk score ≤ 0.863) exhibited markedly increased OS compared to high-risk melanoma patients (risk score > 0.863) (16.39 ± 1.66 vs 6.37 ± 0.71 years, P < .0001). We then attempted to validate our signature-derived risk score by using this same approach to analyze the validation dataset, wherein we also found that the OS of low-risk patients was shorter than that of high-risk patients (11.71 ± 1.18 vs 7.24 ± 1.01 years; P < .0001). To compare the prognostic values of our 10-gene signature risk model and other clinicopathologic characteristics, we performed time-dependent receiver-operating characteristic curve curve analysis and the area under the curve (AUC) was measured. The 10-gene signature curve showed the greatest AUC value (training set: AUC = 0.83; validation set: AUC = 0.79) compared with other clinicopathologic characteristics curves in the training and the validation cohort. Thus, this 10-gene signature risk score may be more accurate than other clinical characteristics as a means of discriminating between melanoma patients (Fig. 6).
Figure 6.

Kaplan-Meier analysis of patients’ OS in the high-risk and low-risk subgroups of the training cohort (A) and validation cohort (B), The x axis represents the survival time (years), and the y axis represents survival rate; time-dependent ROC analysis performed to compare the ten-gene signature risk model and other clinicopathologic characteristics in predicting OS of skin melanoma in training cohort (C) and validation cohort (D). OS = overall survival.
Independent risk factors in these to cohorts were assessed via univariate and multivariate Cox regression analyses. In univariate analyses, our 10-gene signature scores were significantly related with melanoma patient OS in the training (hazard ratio [HR] = 199.59, 95% confidence interval [CI] 20.87–1908.94, P < .001) and validation (HR = 38.93, 95% CI 6.45–234.94, P < .001) cohorts. Several clinicopathological factors and the 10-gene signature scores were included in a multivariate analysis. These findings showed that 3 factors, including T stage (training set: HR = 1.532, 95% CI 1.223–1.916, P < .001; validation set: HR = 1.636, 95% CI 1.267–2.111, P < .001), N stage (Training set: HR = 1.752, 95% CI 1.383–2.251, P < .001; validation set: HR = 1.496, 95% CI 1.113–2.01, P = .008), and the 10-gene signature score (training set: HR = 42.11, 95% CI 8.243–216.463, P < .001; validation set: HR = 13.54, 95% CI 1.91–96.19, P = .009) were independent prognostic indicators in the training and validation cohorts (Table 3).
Table 3.
Univariate and multivariate independent prognostic analysis of 10-gene signature risk score and other clinical characteristics in melanoma patients.
| Univariate analysis | Multivariate analysis | |||
| Characteristic | HR (95% CI) | P | HR (95% CI) | P |
| Training cohort | ||||
| Age | 1.024 (1.004–1.037) | <.001 | 1.011 (0.997–1.024) | .087 |
| Gender | 0.958 (0.665–1.368) | .788 | 0.892 (0.685–1.423) | .891 |
| T stage | 1.575 (1.321–1.978) | <.001 | 1.532 (1.223–1.916) | <.001 |
| N stage | 1.589 (1.352–1.905) | <.001 | 1.752 (1.383–2.251) | <.001 |
| M stage | 1.557 (0.576–4.173) | .387 | 1.591 (0.521–4.812) | .408 |
| TNM stage | 1.568 (1.287–1.912) | <.001 | 0.767 (0.519–1.129) | .177 |
| Signature risk score | 199.59 (20.87–1908.94) | <.001 | 42.11 (8.243–216.463) | <.001 |
| Validation cohort | ||||
| Age | 1.025 (1.010–1.039) | <.001 | 1.005 (0.989–1.021) | .547 |
| Sex | 1.182 (0.766–1.822) | .451 | 0.879 (0.556–1.391) | .583 |
| T stage | 1.776 (1.437–2.195) | <.001 | 1.636 (1.267–2.111) | <.001 |
| N stage | 1.425 (1.164–1.746) | <.001 | 1.496 (1.113–2.01) | .008 |
| M stage | 3.466 (0.84–14.295) | .086 | 1.253 (0.283–5.555) | .767 |
| TNM stage | 1.607 (1.255–2.058) | <.001 | 0.978 (0.631–1.516) | .922 |
| Signature risk score | 38.93 (6.45–234.94) | <.001 | 13.54 (1.91–96.19) | .009 |
3.6. High- and low-risk melanoma patients exhibit differences in immune status and infiltration
A PCA approach was employed to evaluate differences in patterns of distribution in the low- and high-risk groups based upon 10-gene signature risk scores, and the low- and high-risk groups were separable into 3 distinct clusters (Fig. 7). A GSEA functional annotation strategy was also employed, revealing low-risk samples to be significantly enriched for immune response pathway-related genes compared to those from high-risk patients. There were therefore clear differences in the immune status of tumor samples from low- and high-risk melanoma patients when these patients were stratified according to their 10-gene signature risk scores. Furthermore, low-risk group samples were enriched for immunological pathways such as the JAK-STAT, RIG-I-like receptor, Toll-like receptor, and T cell receptor signaling pathways. However, the enriched pathways in the high-risk group were predominantly associated with oxidative phosphorylation, glyoxylate metabolism, and dicarboxylate metabolism (Fig. 7).
Figure 7.

(A) Principal components analysis between low- and high-risk groups on the basis of the 10-gene signature risk score model. Functional annotation of the 10-gene signature by GSEA analysis: (B) Immune response set and Immune system process set (C) Kyoto Encyclopedia of Genes and Genomes. (D) Microenvironment of the immune cell population is estimated by CIBERSORT algorithm based on TCGA-skin melanoma data (Row: tumor samples). Clinicopathologic features in low-risk and high-risk groups (corresponding items: T stage, N stage, M stage, TNM stage, age, and sex. ∗P < .05, ∗∗P < .01, ∗∗∗P < .001). FDR = false discovery rate, NES = normalized enrichment score.
We next performed an immune cell-based analysis, revealing low-risk patients to have increases in numbers of M1 macrophages, naïve/memory B cell, plasma cells, regulatory T cells (Tregs), CD8+ T cells, activated CD4+ memory T cells, follicular helper T cells, and resting NK cells. In contrast, high-risk patients had increases in M2 macrophage and M0 macrophage levels. Our 10-gene signature risk scores were also negatively correlated with enrichment for B cell, CD4+ T cells, CD8+ T cells, dendritic cells, neutrophils, and macrophages (Fig. 8).
Figure 8.

(A) The violin plot showed the immune cells population in the low- (blue) and high-risk (red) groups. P values are based on the Wilcoxon Test. (B) Correlation analysis between immune cells population and risk score. P values are based on the paired t test.
4. Discussion
Melanomas are not homogenous, but comprise cells with differing invasive, proliferative and stem-like phenotypes. Accumulating evidence suggests that the proliferative and invasive cells in melanoma are characterized by distinct gene expression profiles. Notably, the tumor microenvironment (TME) can induce melanoma cells to alternate between these phenotypes.[15] Previous work suggests that both immune and stromal cells represent key facets of the TME, and can profoundly impact tumor proliferation, progression, and therapeutic responsiveness.[16] As such, it is essential that further studies evaluate the genomic profiles associated with extant tumor sequencing datasets to better evaluate the interplay between melanoma cells and the TME. Herein, we therefore evaluated the prognostic relevance of TME-related genes within the TCGA dataset. Initially, we utilized the ESTIMATE algorithm to establish stromal and immune cell scores for melanoma patients. We then determined that melanoma patients with higher immune scores exhibited significantly improved OS relative to patients with low immune scores. We identified DEGs associated with the immune/stromal scores generated for these patient samples, and we then utilized patient outcome data in order to identify survival-related DEGs. These genes were incorporated into a prognostic risk signature that was used to compare differences in OS and immune cell infiltration between low- and high-risk melanoma patients.
We additionally conducted functional enrichment analyses of survival-related DEGs suggesting that these genes were associated with cytokine-cytokine receptor interactions, complement and coagulation cascades, JAK-STAT signaling, chemokine signaling, Th1 and Th2 cell differentiation, and B cell receptor signaling pathways. Together, these results suggest that these survival-related DEGs are largely associated with immune and inflammatory responses. The immune microenvironment has previously been shown to profoundly shape melanoma progression and prognosis, and there have been many efforts to date to develop novel immunotherapeutic approach.
Herein, we incorporated a subset of these survival-related DEGs into a gene signature risk model. Risk scores derived from this model were then employed as a means of separating patients into low- and high-risk groups, with subsequent analyses confirming that there were significant differences in patient OS between these 2 risk cohorts that corresponded to a high AUC value. We additionally confirmed the independent prognostic relevance of this risk score in melanoma patient samples through univariate and multivariate analyses. Together, these results offer novel insight into the role of the TME as a regulator of melanoma. A subset of the 10 genes included in our risk signature has previously been studied in the context of melanoma, including interleukin (IL)-15 which is a multifunctional cytokine related to NK, T, and B cell survival and activation. The ability of IL-15 to suppress tumor progression and metastasis in animal melanoma model systems (including B16 and B78-H1 tumor models) has previously been demonstrated and linked to its ability to facilitate CD8+ T cell and NK cell activation and proliferation.[17]
High-and low-risk groups were also significantly different with respect to observed immune cell infiltration. TME composition is of significant research interest. The immune cells within the melanoma tumor microenvironment, however, can vary widely and is associated with patient prognosis. Tumor-infiltrating lymphocytes —in particular CD8+ T cells—serve as key mediators of tumor immune surveillance.[18–20] Normally, effector CD8+ T cells are activated upon antigen and co-stimulatory molecule exposure, whereupon they can lyse tumor cells and suppress the growth of tumors. Itay et al[21] confirmed the distinct exhaustion status of CD8+ T cells in melanoma patients and defined a core exhaustion-gene signature through the single-cell RNA-seq. The exhaustion of CD8+ T cells have been shown to be important regulators of melanoma patient prognosis. In line with these results, we found that high-risk melanoma patients in our patient sample cohort exhibited decreased CD8+ T cell infiltration relative to low-risk patients. Tregs are another cell type of prognostic interest that are commonly evaluated, although their relevance in the context of melanoma remains uncertain. Many studies have shown Treg infiltration to be associated with a poorer melanoma patient prognosis, although there are some reports suggesting that they have a neutral or negligible impact on patient outcomes. Shang et al[22] found that FoxP3+ Tregs were of greater prognostic relevance in COX-2+ melanoma patients than in those with COX-2− disease in a meta-analysis. Herein, however, we found Tregs to be enriched in low-risk patients. B cells, however, are not known to be as important as T cells in this setting, with inconsistent prognoses having been identified as a function of B cell status such that the importance of B cells remains uncertain. Herein, we demonstrated a significant negative correlation between B cells and risk score, and naive B/plasma cells were enriched in low-risk patients. However, the exact impact of these findings on patient prognosis remains to be established.
Tumor-associated macrophages are also key regulators of the interactions between tumor cells and the immune system. Traditionally, tumor-associated macrophages are classified as being polarized towards an M1 or an M2 phenotype. M2 macrophage infiltration within tumors has been linked to a poorer patient prognosis owing to the anti-inflammatory, angiogenic, and extracellular matrix remodeling activities of these cells. We found M2 macrophages to be enriched in samples from high-risk melanoma patients. However, we have limited knowledge of how to achieve a balance between M1- and M2-phenotypes. JAK/STAT signaling pathways are among the most important regulators of polarization. GSEA results revealed that signaling pathways including JAK/STAT signaling pathways were enriched in low-risk group. Interferon (IFN)-γ can induce M1 macrophage polarization, and IFN-γ can activate STAT1, with the IFN-γ/JAK/STAT1 signaling pathway functioning as a key mechanism regulating the M1 phenotype. Previous work has shown that IL-6/JAK/STAT3 signaling pathway activation primarily mediates macrophage M2 polarization.
There are multiple limitations to the present study. For one, this analysis was retrospective in nature, and so future prospective studies will be essential to validate these results. In addition, functional analyses of the identified prognostic DEGs are essential before their clinical application to fully explore their roles in melanoma and their prognostic relevance. In addition, it is important to note that the immune signature identified in the present study is based upon an estimate of immune cell infiltration within tumors as determined from algorithmic analyses of RNA-seq data. Future in-depth research will be essential to confirm the validity of these immune infiltration results, and to assess the cell–cell interactions that may occur within these tumors and that may impact melanoma progression or prognosis.
5. Conclusion
Herein, we conducted a comprehensive bioinformatics analysis of TCGA melanoma patient gene expression datasets to evaluate the melanoma tumor microenvironment. Through this approach, we identified microenvironment-related DEGs and then evaluated their prognostic relevance in melanoma patients. Future clinical studies of the functional roles of these genes will be essential to fully validate their relationship to patient survival outcomes. Overall, our results offer new insight into the complex interplay between melanoma stromal cells and immune cells within the tumor microenvironment, potentially highlighting novel therapeutic targets for future clinical evaluation.
Author contributions
Writing – original draft: Wang Yingjuan, Zhang Li, Cao Wei.
Writing – review & editing: Wang Xiaoyuan.
Supplementary Material
Supplementary Material
Footnotes
Abbreviations: AJCC = American Joint Committee on Cancer, AUC = area under the curve, DEGs = differentially expressed genes, ESTIMATE = estimation of Stromal and Immune cells in Malignant Tumor tissues using Expression data, FDR = false discovery rate, GSEA = gene set enrichment analysis, HR = hazard ratio, IFN = interferon, IL = interleukin, KEGG = Kyoto Encyclopedia of Genes and Genomes, LASSO = least absolute shrinkage and selection operator, OS = overall survival, PCA = principal component analysis, TCGA = The Cancer Genome Atlas, TME = tumor microenvironment.
How to cite this article: Yingjuan W, Li Z, Wei C, Xiaoyuan W. Identification of prognostic genes and construction of a novel gene signature in the skin melanoma based on the tumor microenvironment. Medicine. 2021;100:21(e26017).
The authors report no conflicts of interest.
All data generated or analyzed during this study are included in this published article [and its supplementary information files].
Supplemental digital content is available for this article.
AJCC = American Joint Committee on Cancer.
HR = hazard ratio.
References
- [1].Ahmedin J, Freddie B, Melissa MC, et al. Global cancer statistics [J]. Ca Cancer J Clin 2011;61:69–90. [DOI] [PubMed] [Google Scholar]
- [2].Boyle P, Ferlay J. Cancer incidence and mortality in Europe [J]. Ann Oncol 2005;16:481488. [DOI] [PubMed] [Google Scholar]
- [3].Reisfeld RA. The tumor microenvironment: a target for combination therapy of breast cancer[J]. Crit Rev Oncogen 2013;18:115–33. [DOI] [PubMed] [Google Scholar]
- [4].Yang L, Wang S, Zhang Q, et al. Clinical significance of the immune microenvironment in ovarian cancer patients [J]. Mol Omics 2018;14:341–51. [DOI] [PubMed] [Google Scholar]
- [5].Ayala F, Dewar R, Kieran M, Kalluri R. Contribution of bone microenvironment to leukemogenesis and leukemia progression. Leukemia 2009;23:2233–41. [DOI] [PMC free article] [PubMed] [Google Scholar]
- [6].Austin R, Smyth MJ, Lane SW. Harnessing the immune system in acute myeloid leukaemia. Crit Rev Oncol Hematol 2016;103:62–77. [DOI] [PubMed] [Google Scholar]
- [7].Yehudai-Resheff S, Attias-Turgeman S, Sabbah R. Abnormal morphological and functional nature of bone marrow stromal cells provides preferential support for survival of acute myeloid leukemia cells. Int J Cancer 2019;144:2279–89. [DOI] [PubMed] [Google Scholar]
- [8].Beyar-Katz O, Gill S. Novel approaches to acute myeloid leukemia immunotherapy. Cancer Res 2018;24:5502–15. [DOI] [PubMed] [Google Scholar]
- [9].Vandsemb EN, Kim TK, Zeidan AM. Will deeper characterization of the landscape of immune checkpoint molecules in acute myeloid leukemia bone marrow lead to improved therapeutic targeting? Cancer 2019;125:1410–3. [DOI] [PMC free article] [PubMed] [Google Scholar]
- [10].Yoshihara K, Shahmoradgoli M, Martinez E, et al. Inferring tumour purity and stromal and immune cell admixture from expression data. Nat Commun 2013;4:2612. [DOI] [PMC free article] [PubMed] [Google Scholar]
- [11].Shah N, Wang P, Wongvipat J, et al. Regulation of the glucocorticoid receptor via a BET-dependent enhancer drives antiandrogen resistance in prostate cancer. eLife 2017;6: [DOI] [PMC free article] [PubMed] [Google Scholar]
- [12].Alonso MH, Aussó S, Lopez-Doriga A, et al. Comprehensive analysis of copy number aberrations in microsatellite stable colon cancer in view of stromal component. Br J Cancer 2017;117:421–31. [DOI] [PMC free article] [PubMed] [Google Scholar]
- [13].Jia D, Li S, Li D, et al. Mining TCGA database for genes of prognostic value in glioblastoma microenvironment. Aging 2018;10:592–605. [DOI] [PMC free article] [PubMed] [Google Scholar]
- [14].Newman AM, Liu CL, Green MR, et al. Robust enumeration of cell subsets from tissue expression profiles. Nat Methods 2015;12:453–7. [DOI] [PMC free article] [PubMed] [Google Scholar]
- [15].Ennen M, Keime C, Kobi D, et al. Single-cell gene expression signatures reveal melanoma cell heterogeneity[J]. Oncogene 2015;34:3251–63. [DOI] [PubMed] [Google Scholar]
- [16].Gregor S, Francesca F, Florent P, et al. Comprehensive evaluation of transcriptome-based celltype quantification methods for immuno-oncology. Bioinformatics 2019;35:i436–45. [DOI] [PMC free article] [PubMed] [Google Scholar]
- [17].Dubsky P, Saito H, Liogier M, et al. IL-15-induced human DC efficiently prime melanoma-specific naive CD8+ T cells to differentiate into CTL[J]. Eur J Immunol 2007;37:1678–90. [DOI] [PubMed] [Google Scholar]
- [18].Edwards J, Wilmott JS, Madore J, et al. CD103+ tumor-resident CD8+ T cells are associated with improved survival in immunotherapy-naïve melanoma patients and expand significantly during Anti-PD-1 treatment[J]. Clin Cancer Res 2018;24: clincanres.2257.2017. [DOI] [PubMed] [Google Scholar]
- [19].Montinaro A, Forte G, Sorrentino R, et al. Adoptive immunotherapy with Cl-IB-MECA-treated CD8+ T cells reduces melanoma growth in mice [J]. PLoS One 2012;7:e45401. [DOI] [PMC free article] [PubMed] [Google Scholar]
- [20].2015;Kohlhapp FJ, Broucek JR, Hughes T, et al. NK cells and CD8+ T cells cooperate to improve therapeutic responses in melanoma treated with CTLA-4 blockade and IL-2 (TUM2P. 1039) [J]. 3:18. [DOI] [PMC free article] [PubMed] [Google Scholar]
- [21].Tirosh I, Izar B, Sanjay PM, et al. Dissecting the multicellular ecosystem of metastatic melanoma by single-cell RNA-seq[J]. Science 2016;352:189–96. [DOI] [PMC free article] [PubMed] [Google Scholar]
- [22].Shang B, Liu Y, Jiang SJ, et al. Prognostic value of tumor-infiltrating FoxP3+ regulatory T cells in cancers: a systematic review and meta-analysis[J]. Sci Rep 2015;5:15179. [DOI] [PMC free article] [PubMed] [Google Scholar]
Associated Data
This section collects any data citations, data availability statements, or supplementary materials included in this article.