

Abstract
Rac1 is a small GTPase that plays key roles in actin reorganization, cell motility, and cell survival/growth as well as in various cancer types and neurodegenerative diseases. Similar to other Ras superfamily GTPases, Rac1 switches between active GTP-bound and inactive GDP-bound states. Switch I and II regions open and close during GDP/GTP exchange. P29S and A159V (paralogous to K-RasA146) mutations are the two most common somatic mutations of Rac1. Rac1P29S is a known hotspot for melanoma, whereas Rac1A159V most commonly occurs in head and neck cancer. To investigate how these substitutions induce the Rac1 dynamics, we used atomistic molecular dynamics simulations on the wild-type Rac1 and two mutant systems (P29S and A159V) in the GTP bound state, and on the wild-type Rac1 and P29S mutated system in the GDP bound state. Here, we show that P29S and A159V mutations activate Rac1 with different mechanisms. In Rac1P29S-GTP, the substitution increases the flexibility of Switch I based on RMSF and dihedral angle calculations and leads to an open conformation. We propose that the open Switch I conformation is one of the underlying reasons for rapid GDP/GTP exchange of Rac1P29S. On the other hand, in Rac1A159V-GTP, some of the contacts of the guanosine ring of GTP with Rac1 are temporarily lost, enabling the guanosine ring to move toward Switch I and subsequently close the switch. Rac1A159V-GTP adopts a Ras state 2 like conformation, where both switch regions are in closed conformation and Thr35 forms a hydrogen bond with the nucleotide.
Introduction
Rac1 is one of the best characterized members of Rho GTPase family, which is a subfamily of Ras GTPases. Rho GTPases have various cellular functions including cellular growth and survival, actin skeleton reorganization, proliferation, and vesicular trafficking.1,2 Dysfunction of Rho GTPases and regulators of Rho GTPases causes and enhances various pathological processes including cancer progression and especially metastasis, in addition to the progression of neurological diseases such as Alzheimer’s disease (AD) and amyotrophic lateral sclerosis (ALS) symptoms.3,4
Rho GTPases function as a molecular switch cycling between the inactive GDP-bound state and active GTP-bound state.5 The switch cycle depends on two reactions: GDP/GTP exchange and intrinsic GTP hydrolysis. Structurally, this cycling facilitates the conformational changes in two switch regions of Rho GTPases, namely, Switch I (residues 25–38 according to Rac1 numbering) and Switch II (residues 57–75) (Figure 1A). The Rho family including Cdc42 and Rac proteins share the highly conserved sequence and conformation in the switch regions (Figure 1B). Upon GDP and GTP binding, both switch regions of Rho GTPases undergo subtle conformational changes, switching between open and closed conformations, respectively.6 In the closed conformation, both switch regions are stabilized by hydrogen bonds of Thr35 and Gly60 with the GTP, respectively.7,8 In addition to the roles of switch regions, Mg2+ functions as a cofactor in nucleotide binding.9 Mg2+ is coordinated by hydroxyl group of Thr17 and carbonyl oxygen of Thr35 and interacts with the phosphate group of the nucleotide.10 Switch regions also enable selective binding of Rho GTPases to their regulators; guanine nucleotide exchange factors (GEFs) and GTPase activating proteins (GAPs).11−14
Figure 1.

(A) Crystal structure of Rac1WT (PDB ID: 3TH5). Switch I, switch II, and insert regions are colored in cyan. Pro29 and Ala159 residues are highlighted. (B) Multiple sequence alignment of RhoA, Cdc42, Rac1, Rac2, and Rac3. Residues are numbered with respect to Rac1. Nucleotide binding regions (blue), effector binding region (green), insert region (yellow), hypervariable region (purple), and CAAX motif (red) are colored.
Rac1 contributes to initiation and progression of various cancer types with different mechanisms. The involvement of Rac1 in cancer progression is well studied with respect to overactivation of its GEFs such as Tiam1, Vav, and P-Rex families, where expression of GEF is elevated or the GEF is mutated.15,16 With the hyperactivation of GEFs, the rate of GDP/GTP exchange of Rac1 is elevated. This activation mechanism of Rac1, and of Rho GTPases in general, is associated with invasiveness and metastasis.17 Interactions of Rac1 with ArhGAPs, the chimaerin family of GAPs, and the IQGAP family are also especially associated with metastasis.18,2,19 Rac-GAPs are also identified as tumor suppressors. For example, a Rac1 specific GAP, ß2-chimaerin suppresses cell cycle progression, proliferation, and migration by reducing the amount of active Rac GTPase.20,21
The oncogenic mutations of Rac1 are less studied since they are lately recognized with large genomic sequencing studies. According to the Catalog of Somatic Mutations in Cancer (COSMIC)22 database, the two most mutated somatic mutations of Rac1 are P29S (26.7% of deposited mutations) and A159V (3.74% of deposited mutations). P29S is a gain-of-function mutation identified predominantly in melanoma. Pro29 is located on the N-terminus of Switch I of Rac1 (Figure 1A), and it does not appear as an oncogenic hotspot in other Ras GTPases. A159V is the most common mutation in head and neck cancers and is not reported in melanoma yet. The mutation is also observed in colon, thyroid, and lung cancer. Ala159 is located at the nucleotide binding region of Rac1 (Figure 1A), which is the loop connecting the ß5 strand and α5 helix. The reason for the tissue specificity of these mutations is yet to be determined.
Rac1P29S is a hot-spot for sun exposed melanoma with a frequency between 4% and 9%. After B-RafV600 and N-RasQ61 mutations, Rac1P29S is recognized as the third most common activating mutation of sun-exposed melanoma with a strong UV signature.23,24 Unlike constitutively activating mutations where GTPase is locked in the GTP-bound active state, Rac1P29S maintains intrinsic GTP hydrolysis ability.25 The ability to activate and transform cell morphology while GTP hydrolysis is maintained is defined as fast-cycling behavior. The schematic representation of different activation mechanism of Rac1 is illustrated (Figure 2). Fast-cycling mutants have high a GDP/GTP exchange rate with normal intrinsic GTP hydrolysis, which corresponds to a high percentage of GTP-bound active mutants in the cell while GDP-bound inactive mutants are still present with a lower percentage.26 Rac1F28L is also another fast-cycling mutant where interaction of Leu28 and nucleotide is lost, suggesting a lower affinity toward the nucleotide. However, the fast-cycling mechanisms of Rac1P29S and Rac1F28L are suggested to be different. Rac1P29S fast-cycling is suggested to depend on the instability of the GDP-bound state, whereas Rac1F28L fast-cycling depends on reduced interactions with GTP.25 Rac1P29S mutation enhances downstream signaling to p21-activated kinase 1 (PAK1, a serine/threonine protein kinase) and mixed-lineage protein kinase 3 (MLK3, a member of the mitogen-activated protein (MAP) kinase kinase kinase) both of which bind to Rac1 through the Cdc42-Rac Interactive Binding (CRIB) domain. Rac1P29S enhances cell proliferation and migration and localizes to membrane ruffles.23 Rac1P29S also activates phosphoinositide 3-kinase (PI3K)/AKT and myocardin-related transcription factor/serum response factor (MRTF/SRF) pathways and confers drug resistance in B-RafV600E initiated melanoma.27,28
Figure 2.

Schematic representation of different activation cycles of Rac1. (A) Regular activation/deactivation of Rac1WT is shown. (B) Activation/deactivation of fast-cycling mutants (i.e., Rac1P29S) exhibit an increased GDP/GTP exchange while GTP hydrolysis is retained. (C) Activation/deactivation of constitutively activating mutants (i.e., Rac1Q61L) exhibit a retained GDP/GTP exchange and an impaired GTP hydrolysis.
In spite of the frequency of occurrence of Rac1A159V, observed as in COSMIC, this mutation is comparably less studied and appears as a rare mutation in large-scale genomic studies.29,30 Unlike Rac1P29S, Rac1A159V is not recorded in any malignant melanoma samples but in head and neck cancer. Rac1A159V also appears in anaplastic thyroid cancers.31 Rac1A159V is first recognized as a hotspot for Rac1 through a statistical study on various mutational databases and publications.32 Rac1A159V is shown as an activating mutation that enhances binding to PAK1 in vitro. The mutation occurs at the nucleotide binding region and activates Rac1 more than P29S but less than Q61R, which is a constitutively activating mutation. In another well characterized Rho GTPase, Cdc42, A159V is found to increase the intrinsic GTP hydrolysis, reducing GAP interaction and increasing GDP release.33 Rac1A159V is also paralogous to K-RasA146, which is a known hotspot of K-Ras and most commonly occurs in colorectal cancer.34,35
Here we have studied the dynamic conformational changes of Rac1 upon P29S and A159V substitutions with atomistic molecular dynamics simulations. We show that Rac1P29S and Rac1A159V are activated by different mechanisms. P29S changes the flexibility of Switch I, yielding an open conformation for most of the simulation trajectory. The fast-cycling phenotype of Rac1P29S is suggested to be not a result of the decreased interactions with nucleotide but instead to be because of the destabilization of the GDP-bound inactive state.25 However, we observed that in Rac1P29S-GTP the interactions of Phe28, Pro29, and Gly30 with GTP, which are present in the initial structure are lost. With these lost interactions located in and nearby Switch I, the flexibility of Switch I is increased, thereby adopting an open conformation. In contrast, Switch II of Rac1P29S-GTP is locked in a closed conformation with respect to Switch II of Rac1WT-GTP. In Rac1A159V-GTP, we observed that the guanosine ring of GTP opens to the Switch I region after Switch I is partially closed. Rac1A159V-GTP is stabilized where Switch I is in this partially closed conformation. The stabilized structure for Rac1A159V-GTP (represented as cluster 1A159V-GTP) also forms a hydrogen bond between Thr35 and the γ-phosphate group of GTP. This interaction is considered as a characteristic of state 2 of Ras GTPases.7,36,37 In addition, Switch II of Rac1A159V-GTP stays in a closed conformation with respect to Switch II of Rac1WT-GTP. State 2 of Ras GTPases has the closed switch conformation and is characterized by interactions of Thr35 and Gly60 with the nucleotide.7 We suggest that Rac1A159V adopts a state similar to Ras state 2, due to closed switch conformations, and a critical hydrogen bond between Thr35 and the nucleotide.
Methods
Generating Initial Configurations
The crystal structures of the catalytic domain of Rac1 loaded with the GTP analogue (GppNHp) (PDB: 3TH5) and GDP (PDB: 5N6O) were selected to model the wild-type Rac1. We replaced the GppNHp molecule in 3TH5 with GTP. To model the P29S mutant systems, the crystal structure (PDB: 3SBE) was adopted as the GTP-bound mutant Rac1, replacing GppNHp with GTP. For the GDP-bound mutant Rac1, the residue Pro29 in the wild-type Rac1-GDP was mutated to Ser29, generating the GDP-bound P29S mutant model. For the A159V mutant system, wild-type Rac1 was used to convert into the A159V mutant Rac1 due to absence of available crystal structure. The mutation is introduced with in silico mutagenesis to the wild-type crystal structure (PDB: 3TH5) using CHARMM software. The initial model configurations were prepared using the updated CHARMM force field (version 36).38,39 Properties of all systems are summarized in Table 1.
Table 1. Initial Configurations of Rac1-GTP and Rac1-GDP Systemsa.
| simulation system | protein | GDP/GTP | mutation | PDB |
|---|---|---|---|---|
| system 1 | Rac1 | GTP | wild type | 3TH5 |
| system 2 | Rac1 | GDP | wild type | 5N6O |
| system 3 | Rac1 | GTP | P29S | 3SBE |
| system 4 | Rac1 | GDP | P29S | 5N6O* |
| system 5 | Rac1 | GTP | A159V | 3TH5* |
PDBs with asterisks are modified with in silico mutagenesis.
Atomistic Molecular Dynamics Simulations
All simulations were carried out following the same protocol as in our previous studies.19,40−44 The initial Rac1 configurations were solvated using the TIP3P model. The isometric unit cell box of 90 × 90 × 90 Å3 contains approximately 74 000 atoms involving the protein and water. A total of 46 Na+ and 43 Cl– ions were added to GTP-bound systems, whereas 45 Na+ and 43 Cl– ions were added to GDP-bound systems in order to satisfy neutralization and a total concentration of ca. 100 mM. A series of minimization (10 000 steps) and dynamics (50 000 steps) cycles were performed for the solvent with the constrained protein backbone atoms. Step size was chosen as 2 fs. Then, the harmonic constraints on the backbone atoms were gradually lifted with the long-range electrostatics calculation using the particle mesh Ewald (PME) method. The simulation systems were thermodynamically controlled at 310 K with Langevin temperature control. The Nosé–Hoover Langevin piston algorithm was employed to control the pressure at 1 atm. A total of three microsecond molecular dynamics simulations were performed for 600 ns each with the Nanoscale Molecular Dynamics (NAMD)45 parallel computing code under NPT (constant number of atoms, constant pressure, and constant temperature) conditions. All the simulations were performed at high-performance computing system Koc University Advanced Computing Center (KUACC), Koc University.
Analysis of Simulation Trajectories
The root-mean-square deviation (RMSD), root-mean-square fluctuations (RMSF), and distance profiles were calculated with VMD version 1.9.3,45 and the CHARMM program. Simulation trajectories were clustered with Clustering function of Chimera (version 1.13.1).46 Representatives of the five most populated clusters (which covers between 45% and 70% of the trajectories) were further analyzed. The intermolecular interactions of Rac1 with GTP, GDP, and Mg2+ were calculated with Discovery Studio (version 19.10). The default parameters of Discovery Studio were used for the determination of the interacting residues and the interaction type. Contact maps for cluster representatives were plotted by biotite package of python.47 The cutoff distance for interacting residue–residue contacts was chosen as 7 Å between Cα atoms. Principal Component Analysis (PCA) and dihedral angle calculations were performed with the MDAnalysis package of python.48
Results
P29S and A159V Mutations Change the Flexibility of Switch Regions of GTP-Bound Systems
Opening and closing of switch regions enable GDP/GTP exchange in Rac1. Comparing GTP-bound systems, we find all systems follow different trends in the switch regions (Figure 3). In order to quantify the conformations of switch regions throughout the trajectories, we used a set of distance measurements. For Switch I, the distance between Cα of Thr35 and the γ-phosphate oxygen of GTP (Figure S1) and Cα–Cα distances in the Gly12-Pro34 residue pair are calculated (Figure S2). For Switch II, the distance between Cα of Gly60 and the γ-phosphate oxygen of GTP (Figure S3) and Cα–Cα distances in Gly12-Gly60 residue pairs are calculated (Figure S2). In the Rac1WT -GTP system, Switch I (residues 25–38) opens to a lesser extent than in the Rac1P29S-GTP system. In the Rac1A159V-GTP system, Switch I has an open conformation through 100–400 ns and a closed conformation for the last 200 ns (Figure 3 and Figure S1). Switch II (residues 60–63) of both mutated systems stays locked in a closed conformation throughout the trajectory, whereas Switch II of Rac1WT-GTP fluctuates between relatively open and closed conformations (Figure 3 and Figure S3). The initial configuration of Rac1P29S-GTP was prepared using the crystal structure (PDB: 3SBE) directly, but there is one more available crystal structure available (PDB: 3SBD). The global RMSD difference of these structures is 0.3 Å. The two structures show slight differences in Switch I and the loop connecting ß2–ß3, which would not affect the results significantly.
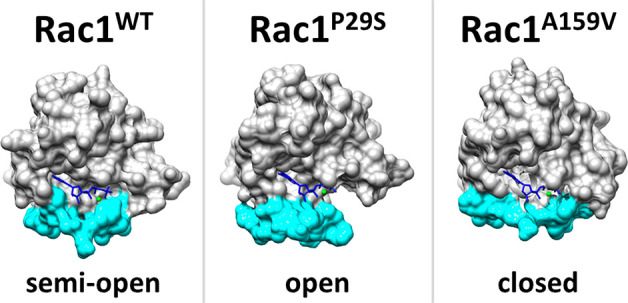
Figure 3.

Snapshots of the Rac1WT-GTP, Rac1WT-GDP, Rac1P29S-GTP, Rac1P29S-GDP, and Rac1A159V-GTP systems at the start and at 200, 400, and 600 ns. Switch regions are colored in cyan, the nucleotide is in blue, and Mg2+ is in green.
To observe the effects of P29S and A159V mutations on the switch regions further, we compared the RMSF values and standard deviation of dihedral angles of GTP-bound systems (Figure 4). In the GTP-bound systems, both mutant systems exhibit high fluctuations in Switch I compared to the case for Rac1WT-GTP. The residues near the N-terminus of Switch I fluctuate more in Rac1P29S-GTP compared than in other GTP-bound systems due to the change in flexibility of proline to serine at position 29. The central region of Switch I (residues 32–35) fluctuates the most in the Rac1A159V-GTP system. In addition, Switch I regions of Rac1P29S-GTP and Rac1A159V-GTP exhibit more deviation in Switch I with respect to the wild-type (Figure 4). In Rac1P29S-GTP, the dihedral angles in the N-terminus of Switch I deviate more than the other GTP-bound systems, suggesting an increasing flexibility around Ser29. Comparing the Rac1WT-GTP and Rac1P29S-GTP systems, we find the side chain of the proline residue is directed toward the nucleotide binding pocket, whereas in the mutated system the serine residue opens toward the exterior of nucleotide binding pocket (Figure S4). We suggest that this change in directionality of Ser29 enables Switch I to open by interrupting the interactions of Phe28, Ser29, and Gly30 with the nucleotide all of which are present in the crystal structure (PDB: 3SBE). The flexibility of Switch II is affected by the mutations in the opposite way for GTP-bound systems. Fluctuations in Switch II of Rac1WT-GTP are comparably higher than fluctuations in the mutated systems, and standard deviations of dihedral angles are slightly higher in Rac1WT-GTP (Figure 4). Comparing the mutated systems, we find the N-terminus of Switch II of Rac1A159V-GTP fluctuates more than that of Rac1P29S-GTP, since Rac1A159V-GTP adopts a partially closed conformation shifting Switch II toward the nucleotide.
Figure 4.

(A) RMSFs of GTP-bound systems. RMSFs of Rac1WT-GTP (blue), RMSF of Rac1P29S-GTP (green), and RMSF of Rac1A159V-GTP (red) are given. Switch regions and insert region are shown in black rectangles. (B) Standard deviations of dihedral angles of Rac1WT-GTP (blue), Rac1P29S-GTP (green), and Rac1A159V-GTP (red) are given. The calculations are done on the basis of the backbone atoms.
In addition to the differences of fluctuations in switch regions, GTP-bound systems present modest differences in the insert region, the loop connecting ß2–ß3, and the N-terminus α5 regions. Conformation of ß2 and ß3 changes in the Rac1A159V-GTP system, which corresponds to the region following effector binding region (residues 30–40) (Figure 4). This conformational change where the loop connecting ß2–ß3 is shifted toward the exterior of Rac1 is also observed in the representatives of most populated clusters of Rac1A159V-GTP except for cluster 5A159V-GTP (see below). The deviations in dihedral angles show that the insert region does not deviate significantly (Figure 4). In addition, Val9 and His104-Asn107 of all GTP-bound systems show a high deviation in dihedral angles.
Rac1P29S-GTP Has an Open Switch I and a Closed Switch II Conformation
All simulation trajectories are clustered, as discussed in the Methods section. The properties of five most populated cluster representatives of GTP-bound systems are summarized (Tables 2–4). After clustering, the representatives of the five most populated clusters are further analyzed for each simulation system. All cluster representatives of Rac1P29S-GTP have the open conformation in Switch I (Figure 5). The conformation of Switch II of Rac1P29S-GTP, on the other hand, does not alter as much as for Switch II of the Rac1WT-GTP system. The interactions between cluster representatives and GTP are identified (Tables S1–S5), and the contact maps of the cluster representatives are calculated (Figures S5–S7).
Table 2. Properties of the Five Most Populated Clusters of the Rac1WT-GTP System.
| distances
of critical switch residues with GTP |
RMSD between clusters |
|||||||
|---|---|---|---|---|---|---|---|---|
| cluster | percentage (%) | Thr35 | Gly60 | cluster 1 | cluster 2 | cluster 3 | cluster 4 | cluster 5 |
| cluster 1 | 11.19 | 6.028 | 7.818 | 0 | 1.307 | 1.283 | 1.239 | 1.272 |
| cluster 2 | 9.44 | 6.203 | 6.233 | 1.307 | 0 | 1.106 | 1.031 | 0.949 |
| cluster 3 | 8.74 | 6.086 | 5.673 | 1.283 | 1.106 | 0 | 1.326 | 0.954 |
| cluster 4 | 8.39 | 7.418 | 4.735 | 1.239 | 1.031 | 1.326 | 0 | 1.062 |
| cluster 5 | 8.04 | 5.743 | 5.428 | 1.272 | 0.949 | 0.954 | 1.062 | 0 |
Table 4. Properties of the Five Most Populated Clusters of the Rac1A159V-GTP System.
| distances
of critical switch residues with GTP |
RMSD between clusters |
|||||||
|---|---|---|---|---|---|---|---|---|
| cluster | percentage (%) | Thr35 | Gly60 | cluster 1 | cluster 2 | cluster 3 | cluster 4 | cluster 5 |
| cluster 1 | 32.87 | 4.602 | 3.863 | 0 | 0.990 | 1.288 | 1.100 | 1.721 |
| cluster 2 | 13.64 | 6.371 | 4.338 | 0.990 | 0 | 1.140 | 1.021 | 1.697 |
| cluster 3 | 11.19 | 8.262 | 3.779 | 1.288 | 1.140 | 0 | 0.881 | 1.423 |
| cluster 4 | 6.99 | 7.935 | 3.761 | 1.100 | 1.021 | 0.881 | 0 | 1.462 |
| cluster 5 | 6.29 | 5.072 | 3.540 | 1.721 | 1.697 | 1.423 | 1.462 | 0 |
Figure 5.

Representatives of the five most populated clusters of the (A) Rac1WT-GTP, (B) Rac1P29S-GTP, (C) Rac1A159V-GTP, (D) RacWT-GDP, and (E) Rac1P29S-GDP systems. Switch regions are colored with respect to the clusters; the nucleotide is in dark gray, and Mg2+ is in dim gray.
Pro29/Ser29 does not interact with GTP directly in both most populated Rac1WT-GTP and Rac1P29S-GTP clusters (Figure 6A,B). The most populated cluster representatives of Rac1WT-GTP have Phe28 forming π–π stacking with the guanosine ring of the nucleotide. However, we observed that in all top five cluster representatives of Rac1P29S and Rac1A159V, the Phe28 interaction is lost. Ser29 and Gly30 residues are also hydrogen bonded to GTP in the crystal structure used for the Rac1P29S-GTP system (PDB: 3SBE), but in the simulated system, these interactions are not present (Figure 6B). In addition to the lost interaction of residues 28–30, contacts of this region change (Figure S5). Residues Phe28, Ser29, and Gly30 are in contact with Ser22 which is located in α1-helix. Pro34, located in the middle of Switch I forms a van der Waals (vdW) interaction with the nucleotide in all five most populated cluster representatives of the Rac1P29S-GTP system, whereas this interaction is not present in the wild-type system. Besides, Pro34 is in contact with nucleotide binding residues Thr17 and Cys18 in cluster 4P29S-GTP, even though Switch I of this cluster is in the open conformation.
Figure 6.

Nucleotide interacting residues of most populated cluster representatives of GTP-bound systems. (A) GTP binding residues of the Rac1WT-GTP system. (B) GTP binding residues of the Rac1P29S-GTP system. (C) GTP binding residues of the Rac1A159V-GTP system. The residues involved in nucleotide interactions are represented as magenta sticks.
The interactions between Switch II and GTP are not observed in Rac1WT-GTP clusters (Figure S8). However, in Rac1P29S-GTP, in addition to the changed interactions and contacts in Switch I, Asp57, which is located in the N-terminus of Switch II, forms new interactions with the nucleotide and new contacts with nucleotide binding residues (Figure S9 and Table S2). Asp57 forms vdW interaction with GTP in all cluster representatives except for cluster 4P29S-GTP and is in contact with nucleotide binding residues Lys16 and Thr17 in all top five cluster representatives. Another Switch II residue Gly60 interacts with the nucleotide in all of the Rac1P29S-GTP clusters. Gly60 has a vdW interaction in cluster 1P29S-GTP and cluster 4P29S-GTP, a conventional hydrogen bond in cluster 3P29S-GTP and cluster 5P29S-GTP, and a carbon hydrogen bond in cluster 2P29S-GTP with the nucleotide (Figure S9 and Table S2).
The most populated Rac1P29S-GTP cluster (cluster 1P29S-GTP) covers around 21% of the trajectory (Table 3). Cluster 1P29S-GTP has an open Switch I conformation whereas the Switch II conformation is similar to that of the initial structure (Figure 5). This cluster is distinct from the other Rac1P29S-GTP clusters with the hydrogen bond between Tyr32 and ribose of the nucleotide (Figure S9 and Table S2). Cluster 4P29S-GTP covers the last 60 ns of the simulation and around 9% of the trajectory. The N-terminus of Switch I, which corresponds to the mutated residue and its nearby residues of cluster 4P29S-GTP makes a recognizable turn specific to this cluster (Figure 5). Cluster 4P29S-GTP has the most open Switch I conformation where the distance between Cα of a critical Switch I residue Thr35 and the γ-phosphate oxygen of GTP is 9.893 Å (Table 3 and Figure S9D).
Table 3. Properties of the Five Most Populated Clusters of the Rac1P29S-GTP System.
| distances of critical switch residues with GTP |
RMSD between clusters |
|||||||
|---|---|---|---|---|---|---|---|---|
| cluster | percentage (%) | Thr35 | Gly60 | cluster 1 | cluster 2 | cluster 3 | cluster 4 | cluster 5 |
| cluster 1 | 20.98 | 9.569 | 4.234 | 0 | 1.481 | 1.993 | 1.395 | 1.629 |
| cluster 2 | 11.19 | 9.483 | 3.755 | 1.481 | 0 | 1.540 | 1.335 | 1.020 |
| cluster 3 | 10.49 | 6.050 | 3.550 | 1.993 | 1.540 | 0 | 1.785 | 1.408 |
| cluster 4 | 8.74 | 9.893 | 4.141 | 1.395 | 1.335 | 1.785 | 0 | 1.374 |
| cluster 5 | 6.29 | 7.553 | 3.682 | 1.629 | 1.020 | 1.408 | 1.374 | 0 |
Rac1A159V-GTP Adopts a Closed Conformation of Switch I
Switch I conformations of Rac1P29S-GTP and Rac1A159V-GTP clusters are comparably different. In the Rac1A159V-GTP system, we observed that the guanosine ring of GTP briefly moves toward Switch I. This conformation is represented by cluster 3A159V-GTP, where some interactions of the guanosine ring of GTP with nucleotide binding regions of Rac1 are temporarily lost. These interactions of the guanosine ring include hydrogen bonds with Asp118 and Val159, a carbon hydrogen bond with Ser158, and vdW interactions with Leu119 and Thr161 (Figure S10C and Table S3). The amino group of Lys116 opens toward the guanosine ring and forms a π–cation interaction, whereas in other clusters it forms a π–alkyl interaction. With this change in orientation of Lys116, a new contact for Val85-Lys116 is formed, whereas the contact for Val85-Leu119 is lost (Figure S7). Even though the hydrogen bond of Val159 is lost, the residue still has a π–alkyl interaction with GTP. These series of changes in the interactions are followed by the opening of the guanosine ring of GTP toward Switch I.
The most populated cluster of the Rac1A159V-GTP system is cluster 1A159V-GTP covering almost 33% of the simulation trajectory corresponding to last 200 ns of the trajectory (Table 4). Therefore, we propose cluster 1A159V-GTP as the stabilized structure for the Rac1A159V-GTP system. The Switch I region is closed with respect to the other clusters of Rac1A159V-GTP in cluster 1A159V-GTP, where the distance between Cα of Thr35 and the γ-phosphate oxygen of GTP is on average 4.6 Å (Figure 7 and Table 4). The nucleotide of cluster 1A159V-GTP forms a hydrogen bond with Thr35, a carbon hydrogen bond with Pro34, and a vdW interaction with Asp11, all of which are unique to this cluster (Figure 6C and Table S3). In addition, only in cluster 1A159V-GTP does Thr35 contact with Switch II residues Ala59, Gly60, and Gln61. This cluster has a closed conformation in Switch II, where the distance between Gly60 and the nucleotide is 3.863 Å and Gly60 forms the vdW interaction with the nucleotide. Gly60 interacts with the nucleotide in the other Rac1A159V-GTP clusters as well (Figure S10 and Table S3). Gly60 and the nucleotide have conventional hydrogen bonds in cluster 3A159V-GTP and cluster 5A159V-GTP, a carbon hydrogen bond in cluster 2A159V-GTP, and a vdW interaction in cluster 1A159V-GTP and cluster 4A159V-GTP.
Figure 7.

Close view of GTP binding pocket of most populated clusters of GTP-bound systems. (A) Rac1WT-GTP system. (B) Rac1P29S-GTP system. (C) Rac1A159V-GTP system. The distances between critical switch I (Thr35) and switch II (Gly60) residues are represented as black dashed lines. Residues Thr35 and Gly60 are represented as red sticks,and GTP and Mg2+ are colored as blue and green, respectively.
Conformations of Rac1P29S-GTP and Rac1A159V-GTP Are More Diverse Than Rac1WT-GTP
To sample the ensembles of the conformations, we performed principal component analysis (PCA) on the wild-type and both mutants Rac1 in the GTP-bound state. The PCA provides clustered principal components that illustrate major differences in the conformations between the proteins. We calculated the PCA projection of the first two principal components for the three systems. Mappings of the first two principal components reveal that overall PCA projections for both Rac1P29S-GTP and Rac1A159V-GTP are similar to each another. However, the projections for Rac1WT-GTP appear to be different from both mutant systems (Figure S11A–C). Both mutant systems have several clusters of the PCA projections, while the wild-type has only two proximal clusters, suggesting that conformations of the Rac1P29S-GTP and Rac1A159V-GTP systems are more diverse with respect to the Rac1WT-GTP system. The conformational variety of Rac1P29S-GTP and Rac1A159V-GTP with respect to Rac1WT-GTP is also consistent with the mentioned flexibility differences. As the mutant systems are more flexible, the conformational spaces of these trajectories are more diverse than the wild-type. To compare previously identified clusters with the PCA projections, we mapped the cluster representatives to the PCA projections (Figure 8). In general, the clustering analysis and PCA projections show similar results.
Figure 8.

Mapping of previously determined clusters to the PCA projections. (A) Rac1WT-GTP. (B) Rac1P29S-GTP. (C) Rac1A159V-GTP.
After the PCA projections are calculated, the representative conformations are taken from each cluster (Figure S12A–C). The properties of the representative conformations are given in Tables 5–7. Mutant systems show more diverse conformations since they have higher RMSD values between conformations. The switch conformations for these representatives are characterized by the calculation of the distance between Cα of Thr35 and the γ-phosphate oxygen of GTP (Switch I) and the distance between Cα of Gly60 and the γ-phosphate oxygen of GTP (Switch II). Two representative conformations of Rac1WT-GTP, conformation 1WT-GTP and conformation 2WT-GTP, exhibit similar conformations in both switch regions (Figure S12A and Table 5). Switch I of the mutant systems shows both open and closed conformations (Figure S12B,C and Tables 6 and 7). The representative conformations of both mutant systems exhibit a relatively closed conformation in Switch II (Tables 6 and 7).
Table 5. Properties of Conformations of the Rac1WT-GTP System According to PCA Results.
| distances of critical switch residues with GTP |
RMSD between clusters |
|||
|---|---|---|---|---|
| conformation | Thr35 | Gly60 | conf 1 | conf 2 |
| conformation 1 | 6.97 | 7.78 | 0 | 1.340 |
| conformation 2 | 6.31 | 5.19 | 1.340 | 0 |
Table 7. Properties of Conformations of the Rac1A159V-GTP System According to PCA Results.
| distances
of critical switch residues with GTP |
RMSD between clusters |
|||||
|---|---|---|---|---|---|---|
| conformation | Thr35 | Gly60 | conf 1 | conf 2 | conf 3 | conf 4 |
| conformation 1 | 4.30 | 3.25 | 0 | 1.524 | 1.991 | 1.817 |
| conformation 2 | 9.84 | 4.09 | 1.524 | 0 | 1.454 | 1.538 |
| conformation 3 | 10.19 | 4.23 | 1.991 | 1.454 | 0 | 1.665 |
| conformation 4 | 5.03 | 4.49 | 1.817 | 1.538 | 1.665 | 0 |
Table 6. Properties of Conformations of the Rac1P29S-GTP System According to PCA Results.
| distances of critical switch residues with GTP |
RMSD between clusters |
||||||
|---|---|---|---|---|---|---|---|
| conformation | Thr35 | Gly60 | conf 1 | conf 2 | conf 3 | conf 4 | conf 5 |
| conformation 1 | 9.32 | 3.76 | 0 | 1.461 | 1.546 | 2.051 | 1.811 |
| conformation 2 | 9.70 | 3.93 | 1.461 | 0 | 1.717 | 2.251 | 1.835 |
| conformation 3 | 10.47 | 3.20 | 1.546 | 1.717 | 0 | 1.848 | 2.028 |
| conformation 4 | 7.10 | 4.28 | 2.051 | 2.251 | 1.848 | 0 | 1.916 |
| conformation 5 | 4.69 | 4.47 | 1.811 | 1.835 | 2.028 | 1.916 | 0 |
The interactions between Rac1 residues and GTP are identified for all representative conformations (Tables S6–S8). Consistent with the findings of the clustering analysis, none of the Rac1WT-GTP conformations have Switch II–GTP interactions (Table S6), whereas all conformations of the mutant have at least one Switch II–GTP interaction (Table S7 and S8). Conformation 1A159V-GTP has the most closed Switch I conformation, and a closed Switch II conformation has a hydrogen bond between Thr35 and GTP and an interaction between Gly60 and the GTP (Table S8).
In addition to the conformational changes in the switch regions, Mg2+ plays an important role in GTP binding. Mg2+ exhibits attractive charge interactions with the phosphate group of the nucleotide in all of the cluster representatives of GTP-bound systems. Mg2+ also interacts with Thr17 and Asp57 in all of the clusters. In cluster 2WT-GTP, cluster 3WT-GTP, and cluster 5WT-GTP, we observed an interaction between Asp38 and Mg2+ in addition to the mentioned interactions. In all Rac1P29S-GTP clusters, the interactions of Mg2+ are limited to Mg2+–GTP and Mg2+–Thr17/Asp57 interactions. Also, in cluster 5A159V-GTP, we observed a metal–acceptor interaction between Thr35 and Mg2+.
Effects of P29S Mutation on the GDP-Bound Systems
In the GDP-bound systems, Rac1P29S-GDP has slightly lower RMSD values with respect to those for Rac1WT-GDP (Figure S13B). On average two systems have 0.41 Å difference in RMSD, and the maximum difference of RMSD is 1.42 Å. This difference is more pronounced after the first 250 ns of the simulation trajectory.
In the cluster representatives of both Rac1WT-GDP and Rac1P29S-GDP, Mg2+ interacts with the phosphate group of the nucleotide, Thr17 and Asp57 in general. However, in cluster 2 WT-GDP, cluster 4 WT-GDP, and cluster 4 P29S-GDP, an unfavorable interaction between Mg2+ and Lys16 is observed.
Comparing RMSF values, we find Switch I of Rac1WT-GDP has higher fluctuations than Switch I of Rac1P29S-GDP (Figure S14). The N-terminus of Switch II of Rac1WT-GDP shows more fluctuations with respect to that of Rac1P29S-GDP, whereas the rest of the region shows a similar fluctuation for both systems. In Rac1WT-GDP, the loop connecting ß2–ß3 is more flexible with respect to that of Rac1P29S-GDP and insert regions of both systems show similar fluctuations. The dihedral angles scheme follows a similar trend where both switch regions of Rac1WT-GDP deviate more than Rac1P29S-GDP (Figure S14). In addition, the dihedral angle of Val9 of Rac1WT-GDP deviates more than that for Rac1P29S-GDP, both systems show a high deviation in dihedral angles in residues His104-Asn107, which corresponds to a loop, and there are almost no deviations in the insert region.
A set of distances are measured to characterize conformations of switch regions of GDP-bound systems (Figure S15). The Cα–Cα distance in the Gly12-Gly60 residue pair is used to interpret the Switch II conformation, whereas Gly12-Pro34 is used to interpret the Switch I conformation. For both Rac1WT-GDP and Rac1P29S-GDP, the residue pair distances are similar to one another for the first 200 ns. Then, both Gly12-Pro34 and Gly12-Gly60 residue pair distances increase in Rac1WT-GDP and stay the same in Rac1P29S-GDP. Therefore, both switch regions of the Rac1WT-GDP system are in a more open conformation whereas that of Rac1P29S-GDP is in a relatively closed conformation.
In Rac1P29S-GDP, the two most populated clusters, cluster 1P29S-GDP and cluster 2P29S-GDP, cover more than 57% of the simulation trajectory and represent the 350 ns of the simulation. The most populated cluster for Rac1WT-GDP (cluster 1WT-GDP) covers 31% of the trajectory, which corresponds to the majority of the first 200 ns for the simulation. For the comparisons of GDP-bound systems, we used cluster 1WT-GDP and cluster 1P29S-GDP as cluster representatives. Cluster 1WT-GDP is chosen for comparison even though it corresponds to the beginning of the simulation, because of the lower RMSD value with respect to other clusters in the wild-type system. Cluster 1WT-GDP and cluster 1P29S-GDP show very similar Switch I conformations, and Switch II of cluster 1P29S-GDP is in a more open conformation with respect to cluster 1WT-GDP. The interactions between Rac1 and the nucleotide are not significantly different from one another in Rac1WT-GDP and Rac1P29S-GDP, except for that Lys16 forms a salt bridge with GDP in Rac1P29S-GDP and not in Rac1WT-GDP (Tables S4 and S5). In addition, none of the clusters of GDP-bound systems have Switch II–GDP interactions apart from vdW interaction of Asp57 in cluster 3P29S-GDP and cluster 5P29S-GDP.
Discussion
Over the years, the oncogenic function of Rac1 involving its regulators GEFs and GAPs is well understood. Oncogenic mutations of Rac1, on the contrary, are relatively newly discovered and therefore less studied. In 2012, the first oncogenic mutation of Rac1 is discovered in UV-exposed melanoma by two separate groups.23,24 Both groups show that Rac1P29S mutation is a gain-of-function mutation increasing downstream signaling. The Rac1A159V mutation is identified as a recurring mutation in a large exome sequencing study and is found to have increasing downstream signaling more than Rac1P29S and less than constitutively active Rac1Q61L.32
Fast cycling phenotypes of Rac1F28L and Rac1P29S are suggested to be different in activation mechanism due to the fact that interaction of Phe28 with the guanosine ring of GTP is lost in Rac1F28L, whereas this interaction is maintained in Rac1P29S. Due to loss of the Phe28 interaction, Switch I of Rac1F28L shows increased flexibility whereas Switch I of Rac1P29S is less flexible. Therefore, it is argued that the fast-cycling phenotype of Rac1P29S might be due to the destabilization of Rac1P29S-GDP.25 In our simulations, however, Switch I of Rac1P29S-GTP shows increased flexibility with respect to the wild-type based on RMSF and dihedral angle calculations. Compared to Rac1WT-GTP, in Rac1P29S-GTP, Switch I has an open conformation. In the representative of the most probable cluster of Rac1P29S-GTP (cluster 1P29S-GTP), we observed that the interaction of Phe28 with the guanosine ring of GTP, which is present in Rac1WT-GTP, is lost. In addition, the hydrogen bonds of Ser29 and Gly30 with the nucleotide which are observed in the initial structure are also lost. In addition to the differences of Switch I, Switch II regions of both Rac1P29S-GTP and Rac1A159V-GTP are more stable than that of Rac1WT-GTP. Switch II plays a role in both GTP/GDP exchange and the interactions of Rac1 with its regulators. For example, Rac1 interacts with a Rac1-GEF Tiam1 with mainly through its Switch II.12 Therefore, with the increased stability of Switch II, it is possible for both Rac1P29S and Rac1A159V to have a higher population of an active state with respect to the wild type. On the other hand, both switch regions of Rac1P29S and Rac1A159V fluctuate between open and closed conformations throughout the simulation trajectories. This conformational heterogeneity, therefore, might result in a mixture of active and inactive states.
In 2016, a computational study comparing GTP-bound Rac1WT and Rac1P29S is published.49 For both of the systems, the conformational properties were analyzed with molecular dynamics, and GTP binding was studied with docking. Similar to our results, the authors observed increased flexibility of Switch I and a decreased flexibility of Switch II in Rac1P29S with respect to the wild type. The nucleotide binding residues found in this study are mostly consistent with our results for both Rac1WT-GTP and Rac1P29S-GTP. However, Rajendran et al. observed interactions between GTP and residues Ser83, Val85, and Ser86 in a wild-type system, whereas in our simulations these residues are distal (ca. 10 Å) from the nucleotide. In a recent study on the Rac1-PAK1 complex, where the binding is investigated with the Gaussian Network Model (GNM) and molecular dynamics, Rac1P29S also exhibits a higher flexibility in the Switch I region in both GTP-binding and PAK1-binding residues.50
Even though the literature on Rac1A159V mutation is limited, paralogous RasA146 is well studied and recognized as a hotspot for Ras species. A recent structural study on GDP-bound K-RasA146T shows that K-RasA146T adopts an open Switch I conformation and a large conformational change in ß2–ß3 strands.51 The destabilization of Switch I is explained by a shift of the Thr146 containing loop toward α1, followed by a new interaction with Lys147 (corresponding to Leu160 in Rac1). This new position of Lys147 is argued to clash with Phe28 and destabilize Switch I. Comparing the results we provide for the Rac1A159V-GTP system with this study,51 we observed a smaller conformational change in ß2–ß3 strands of Rac1. In the stabilized conformation for Rac1A159V-GTP (represented by cluster 1A159V-GTP), Leu160 and Phe28 residues are distal from one another, which would not cause any clashes. Therefore, Rac1A159V-GTP is able to stabilize the closed Switch I, and as a result, the conformational shift of ß2–ß3 strands of Rac1A159V is comparably smaller than that of K-RasA146T. Nevertheless, this conformational shift in Rac1A159V-GTP is still more with respect to Rac1WT-GTP and Rac1P29S-GTP. The fluctuation of the ß2–ß3 connecting residue Asp47 is especially higher in Rac1A159V-GTP.
The structural studies of the inactive Rac1-GDP show that the N-terminus of Switch I is different in conformation than the GDP-bound complexes Rac1-RhoGDI1 (PDB ID: 1HH4) and Rac1-Arfaptin (PDB ID: 1I4D).52 In the unbound Rac1, residues 30–32 are not well ordered, forming a turn-like conformation. We observed that this unordered conformation is fixed later in the simulation trajectories for both Rac1WT-GDP and Rac1P29S-GDP. We also observed that both switches are in a closer conformation and that there are fewer fluctuations in Rac1P29S-GDP than in Rac1WT-GDP. In the GDP-bound state, Rac1 interacts with RhoGDI through both Switch I and Switch II.13 With fewer fluctuating switch regions, Rac1P29S-GDP could bind to RhoGDI with a higher affinity.
Here, we argue that Rac1P29S and Rac1A159V are activated with different mechanisms. The key difference between two mutations stems from the conformational differences of Switch I. Overall, nucleotide binding residues that are identified in all the simulated systems are consistent with the experimental studies.53,11 Switch I of Rac1P29S is locked in an open conformation throughout the simulation. We propose that this conformational change is enabled by the flexibility change of proline to serine residue and the lost interactions of Switch I residues with GTP. On the other hand, Switch I of Rac1A159V is in the closed conformation. The stabilized structure of Rac1A159V shows some characteristics resembling state 2 of Ras GTPases. State 2 of Ras is characterized by closed switch conformations, a hydrogen bond between Thr35 and the γ-phosphate of GTP and Mg2+, a conformational change of Tyr32 where Tyr32 is closed toward the nucleotide, and a hydrogen bond between Gly60 and GTP. Rac1A159V is similar to state 2 of Ras in the following ways: switch regions are closed, Thr35 forms a hydrogen bond with the γ-phosphate of GTP, and Gly60 has the vdW interaction with GTP. Nevertheless, it is important to mention that even though Tyr32 is directed toward the nucleotide and has the vdW interaction with GTP, the conformation of Tyr32 is completely different from that of state 2 of Ras. In Rac1A159V-GTP, Tyr32 is directed underneath the Switch I region, instead of closing over the nucleotide as in state 2 of Ras proteins. State 2 of Ras is essential for interacting with its downstream effectors including Raf.37 The key residue for characterization of state 2, Thr35, also plays a role in binding of Rac1 to a Rac1-GEF P-Rex 1, where it undergoes a large conformational change, thereby enabling Rac1 activation.54 Also, in the Rac1-RhoGDI complex, Thr35 coordinates GDP stabilization through binding to RhoGDI.13
Conclusions
Herein, we show that P29S and A159V mutations have different effects on Rac1 dynamics. Switch I conformations of Rac1P29S and Rac1A159V undergo different conformational changes. Our results show that Rac1P29S is locked with a relatively open Switch I conformation. We propose that this conformational change is caused by the loss of interactions of mutated residue and neighbors with GTP and the change in directionality and flexibility of the mutated residue. In the open conformation, Switch I would enable rapid GDP/GTP exchange, which is a property of fast cycling behavior. Rac1A159V, on the other hand, has closed Switch I and II conformations and shows key similarities and differences with state 2 of Ras GTPases. The stabilized Rac1A159V exhibits crucial differences from the crystal structure of K-RasA146T. Whether these differences are caused by the fact that the mentioned crystal structure is in GDP-bound form or specific to Rac1 is to be analyzed. Like state 2 of Ras proteins enabling the Raf interaction, the closed switch I conformation of Rac1A159V may allow the downstream signaling to certain effectors, whereas Rac1P29S cannot. Therefore, it would be of interest to analyze Rac1 downstream signaling pathways. Our work emphasizes the mechanistic differences between Rac1P29S and Rac1A159V mutations.
Acknowledgments
All simulations were performed using the High Performance Computing Center (KUACC) at Koc University, (Istanbul, Turkey). This project has been funded in whole or in part with federal funds from the National Cancer Institute, National Institutes of Health, under contract HHSN261200800001E. The content of this publication does not necessarily reflect the views or policies of the Department of Health and Human Services nor does mention of trade names, commercial products, or organizations imply endorsement by the U.S. Government. This Research was supported [in part] by the Intramural Research Program of the NIH, National Cancer Institute, Center for Cancer Research.
Supporting Information Available
The Supporting Information is available free of charge at https://pubs.acs.org/doi/10.1021/acs.jpcb.1c00883.
Distance profiles of Switch I and Switch II, Cα–Cα distance profiles, snapshots of structures, contact maps of GTP-bound systems, mapping of interacting residues to the cluster representatives, principal component analysis (PCA) results, snapshots of conformations according to the PCA results, RMSD results, and RMSF of GDP-bound systems; tables of interactions of cluster representatives and conformations according to the PCA results (PDF)
The authors declare no competing financial interest.
Special Issue
Published as part of The Journal of Physical Chemistry virtual special issue “Ruth Nussinov Festschrift”.
Supplementary Material
References
- Tapon N.; Hall A. Rho, Rac and Cdc42 GTPases regulate the organization of the actin cytoskeleton. Curr. Opin. Cell Biol. 1997, 9 (1), 86–92. 10.1016/S0955-0674(97)80156-1. [DOI] [PubMed] [Google Scholar]
- Kazanietz M. G.; Caloca M. J. The Rac GTPase in Cancer: From Old Concepts to New Paradigms. Cancer Res. 2017, 77 (20), 5445–5451. 10.1158/0008-5472.CAN-17-1456. [DOI] [PMC free article] [PubMed] [Google Scholar]
- Porter A. P.; Papaioannou A.; Malliri A. Deregulation of Rho GTPases in cancer. Small GTPases 2016, 7 (3), 123–38. 10.1080/21541248.2016.1173767. [DOI] [PMC free article] [PubMed] [Google Scholar]
- Stankiewicz T. R.; Linseman D. A. Rho family GTPases: key players in neuronal development, neuronal survival, and neurodegeneration. Front. Cell. Neurosci. 2014, 8, 314. 10.3389/fncel.2014.00314. [DOI] [PMC free article] [PubMed] [Google Scholar]
- Rathinam R.; Berrier A.; Alahari S. K. Role of Rho GTPases and their regulators in cancer progression. Front. Biosci., Landmark Ed. 2011, 16, 2561–71. 10.2741/3872. [DOI] [PubMed] [Google Scholar]
- Vetter I. R.; Wittinghofer A. The guanine nucleotide-binding switch in three dimensions. Science 2001, 294 (5545), 1299–304. 10.1126/science.1062023. [DOI] [PubMed] [Google Scholar]
- Araki M.; Shima F.; Yoshikawa Y.; Muraoka S.; Ijiri Y.; Nagahara Y.; Shirono T.; Kataoka T.; Tamura A. Solution structure of the state 1 conformer of GTP-bound H-Ras protein and distinct dynamic properties between the state 1 and state 2 conformers. J. Biol. Chem. 2011, 286 (45), 39644–53. 10.1074/jbc.M111.227074. [DOI] [PMC free article] [PubMed] [Google Scholar]
- Shima F.; Ijiri Y.; Muraoka S.; Liao J.; Ye M.; Araki M.; Matsumoto K.; Yamamoto N.; Sugimoto T.; Yoshikawa Y.; et al. Structural basis for conformational dynamics of GTP-bound Ras protein. J. Biol. Chem. 2010, 285 (29), 22696–705. 10.1074/jbc.M110.125161. [DOI] [PMC free article] [PubMed] [Google Scholar]
- Zhang B.; Zhang Y.; Wang Z.; Zheng Y. The role of Mg2+ cofactor in the guanine nucleotide exchange and GTP hydrolysis reactions of Rho family GTP-binding proteins. J. Biol. Chem. 2000, 275 (33), 25299–307. 10.1074/jbc.M001027200. [DOI] [PubMed] [Google Scholar]
- Rittinger K.; Walker P. A.; Eccleston J. F.; Smerdon S. J.; Gamblin S. J. Structure at 1.65 A of RhoA and its GTPase-activating protein in complex with a transition-state analogue. Nature 1997, 389 (6652), 758–62. 10.1038/39651. [DOI] [PubMed] [Google Scholar]
- Lapouge K.; Smith S. J.; Walker P. A.; Gamblin S. J.; Smerdon S. J.; Rittinger K. Structure of the TPR domain of p67phox in complex with Rac.GTP. Mol. Cell 2000, 6 (4), 899–907. 10.1016/S1097-2765(05)00091-2. [DOI] [PubMed] [Google Scholar]
- Worthylake D. K.; Rossman K. L.; Sondek J. Crystal structure of Rac1 in complex with the guanine nucleotide exchange region of Tiam1. Nature 2000, 408 (6813), 682–8. 10.1038/35047014. [DOI] [PubMed] [Google Scholar]
- Grizot S.; Fauré J.; Fieschi F.; Vignais P. V.; Dagher M. C.; Pebay-Peyroula E. Crystal structure of the Rac1-RhoGDI complex involved in nadph oxidase activation. Biochemistry 2001, 40 (34), 10007–13. 10.1021/bi010288k. [DOI] [PubMed] [Google Scholar]
- Modha R.; Campbell L. J.; Nietlispach D.; Buhecha H. R.; Owen D.; Mott H. R. The Rac1 polybasic region is required for interaction with its effector PRK1. J. Biol. Chem. 2008, 283 (3), 1492–500. 10.1074/jbc.M706760200. [DOI] [PubMed] [Google Scholar]
- Michiels F.; Habets G. G.; Stam J. C.; van der Kammen R. A.; Collard J. G. A role for Rac in Tiam1-induced membrane ruffling and invasion. Nature 1995, 375 (6529), 338–40. 10.1038/375338a0. [DOI] [PubMed] [Google Scholar]
- Sosa M. S.; Lopez-Haber C.; Yang C.; Wang H.; Lemmon M. A.; Busillo J. M.; Luo J.; Benovic J. L.; Klein-Szanto A.; Yagi H.; et al. Identification of the Rac-GEF P-Rex1 as an essential mediator of ErbB signaling in breast cancer. Mol. Cell 2010, 40 (6), 877–92. 10.1016/j.molcel.2010.11.029. [DOI] [PMC free article] [PubMed] [Google Scholar]
- Maldonado M. D. M.; Medina J. I.; Velazquez L.; Dharmawardhane S. Targeting Rac and Cdc42 GEFs in Metastatic Cancer. Front. Cell Dev. Biol. 2020, 8, 201. 10.3389/fcell.2020.00201. [DOI] [PMC free article] [PubMed] [Google Scholar]
- Feng M.; Bao Y.; Li Z.; Li J.; Gong M.; Lam S.; Wang J.; Marzese D. M.; Donovan N.; Tan E. Y.; et al. RASAL2 activates RAC1 to promote triple-negative breast cancer progression. J. Clin. Invest. 2014, 124 (12), 5291–304. 10.1172/JCI76711. [DOI] [PMC free article] [PubMed] [Google Scholar]
- Ozdemir E. S.; Jang H.; Gursoy A.; Keskin O.; Li Z.; Sacks D. B.; Nussinov R. Unraveling the molecular mechanism of interactions of the Rho GTPases Cdc42 and Rac1 with the scaffolding protein IQGAP2. J. Biol. Chem. 2018, 293 (10), 3685–3699. 10.1074/jbc.RA117.001596. [DOI] [PMC free article] [PubMed] [Google Scholar]
- Yang C.; Liu Y.; Leskow F. C.; Weaver V. M.; Kazanietz M. G. Rac-GAP-dependent inhibition of breast cancer cell proliferation by {beta}2-chimerin. J. Biol. Chem. 2005, 280 (26), 24363–70. 10.1074/jbc.M411629200. [DOI] [PubMed] [Google Scholar]
- Casado-Medrano V.; Barrio-Real L.; García-Rostán G.; Baumann M.; Rocks O.; Caloca M. J. A new role of the Rac-GAP β2-chimaerin in cell adhesion reveals opposite functions in breast cancer initiation and tumor progression. Oncotarget 2016, 7 (19), 28301–19. 10.18632/oncotarget.8597. [DOI] [PMC free article] [PubMed] [Google Scholar]
- Tate J. G.; Bamford S.; Jubb H. C.; Sondka Z.; Beare D. M.; Bindal N.; Boutselakis H.; Cole C. G.; Creatore C.; Dawson E.; et al. COSMIC: the Catalogue Of Somatic Mutations In Cancer. Nucleic Acids Res. 2019, 47 (D1), D941–d947. 10.1093/nar/gky1015. [DOI] [PMC free article] [PubMed] [Google Scholar]
- Krauthammer M.; Kong Y.; Ha B. H.; Evans P.; Bacchiocchi A.; McCusker J. P.; Cheng E.; Davis M. J.; Goh G.; Choi M.; et al. Exome sequencing identifies recurrent somatic RAC1 mutations in melanoma. Nat. Genet. 2012, 44 (9), 1006–14. 10.1038/ng.2359. [DOI] [PMC free article] [PubMed] [Google Scholar]
- Hodis E.; Watson I. R.; Kryukov G. V.; Arold S. T.; Imielinski M.; Theurillat J. P.; Nickerson E.; Auclair D.; Li L.; Place C.; et al. A landscape of driver mutations in melanoma. Cell 2012, 150 (2), 251–63. 10.1016/j.cell.2012.06.024. [DOI] [PMC free article] [PubMed] [Google Scholar]
- Davis M. J.; Ha B. H.; Holman E. C.; Halaban R.; Schlessinger J.; Boggon T. J. RAC1P29S is a spontaneously activating cancer-associated GTPase. Proc. Natl. Acad. Sci. U. S. A. 2013, 110 (3), 912–7. 10.1073/pnas.1220895110. [DOI] [PMC free article] [PubMed] [Google Scholar]
- Lin R.; Cerione R. A.; Manor D. Specific contributions of the small GTPases Rho, Rac, and Cdc42 to Dbl transformation. J. Biol. Chem. 1999, 274 (33), 23633–41. 10.1074/jbc.274.33.23633. [DOI] [PubMed] [Google Scholar]
- Watson I. R.; Li L.; Cabeceiras P. K.; Mahdavi M.; Gutschner T.; Genovese G.; Wang G.; Fang Z.; Tepper J. M.; Stemke-Hale K.; et al. The RAC1 P29S hotspot mutation in melanoma confers resistance to pharmacological inhibition of RAF. Cancer Res. 2014, 74 (17), 4845–4852. 10.1158/0008-5472.CAN-14-1232-T. [DOI] [PMC free article] [PubMed] [Google Scholar]
- Lionarons D. A.; Hancock D. C.; Rana S.; East P.; Moore C.; Murillo M. M.; Carvalho J.; Spencer-Dene B.; Herbert E.; Stamp G.; et al. RAC1(P29S) Induces a Mesenchymal Phenotypic Switch via Serum Response Factor to Promote Melanoma Development and Therapy Resistance. Cancer Cell 2019, 36 (1), 68–83.E9. 10.1016/j.ccell.2019.05.015. [DOI] [PMC free article] [PubMed] [Google Scholar]
- Giannakis M.; Mu X. J.; Shukla S. A.; Qian Z. R.; Cohen O.; Nishihara R.; Bahl S.; Cao Y.; Amin-Mansour A.; Yamauchi M.; et al. Genomic Correlates of Immune-Cell Infiltrates in Colorectal Carcinoma. Cell Rep. 2016, 15 (4), 857–865. 10.1016/j.celrep.2016.03.075. [DOI] [PMC free article] [PubMed] [Google Scholar]
- Zehir A.; Benayed R.; Shah R. H.; Syed A.; Middha S.; Kim H. R.; Srinivasan P.; Gao J.; Chakravarty D.; Devlin S. M.; et al. Mutational landscape of metastatic cancer revealed from prospective clinical sequencing of 10,000 patients. Nat. Med. 2017, 23 (6), 703–713. 10.1038/nm.4333. [DOI] [PMC free article] [PubMed] [Google Scholar]
- Pozdeyev N.; Gay L. M.; Sokol E. S.; Hartmaier R.; Deaver K. E.; Davis S.; French J. D.; Borre P. V.; LaBarbera D. V.; Tan A. C.; et al. Genetic Analysis of 779 Advanced Differentiated and Anaplastic Thyroid Cancers. Clin. Cancer Res. 2018, 24 (13), 3059–3068. 10.1158/1078-0432.CCR-18-0373. [DOI] [PMC free article] [PubMed] [Google Scholar]
- Chang M. T.; Asthana S.; Gao S. P.; Lee B. H.; Chapman J. S.; Kandoth C.; Gao J.; Socci N. D.; Solit D. B.; Olshen A. B.; et al. Identifying recurrent mutations in cancer reveals widespread lineage diversity and mutational specificity. Nat. Biotechnol. 2016, 34 (2), 155–63. 10.1038/nbt.3391. [DOI] [PMC free article] [PubMed] [Google Scholar]
- Martinelli S.; Krumbach O. H. F.; Pantaleoni F.; Coppola S.; Amin E.; Pannone L.; Nouri K.; Farina L.; Dvorsky R.; Lepri F.; et al. Functional Dysregulation of CDC42 Causes Diverse Developmental Phenotypes. Am. J. Hum. Genet. 2018, 102 (2), 309–320. 10.1016/j.ajhg.2017.12.015. [DOI] [PMC free article] [PubMed] [Google Scholar]
- Edkins S.; O’Meara S.; Parker A.; Stevens C.; Reis M.; Jones S.; Greenman C.; Davies H.; Dalgliesh G.; Forbes S.; et al. Recurrent KRAS codon 146 mutations in human colorectal cancer. Cancer Biol. Ther. 2006, 5 (8), 928–932. 10.4161/cbt.5.8.3251. [DOI] [PMC free article] [PubMed] [Google Scholar]
- Janakiraman M.; Vakiani E.; Zeng Z.; Pratilas C. A.; Taylor B. S.; Chitale D.; Halilovic E.; Wilson M.; Huberman K.; Ricarte Filho J. C.; et al. Genomic and biological characterization of exon 4 KRAS mutations in human cancer. Cancer Res. 2010, 70 (14), 5901–11. 10.1158/0008-5472.CAN-10-0192. [DOI] [PMC free article] [PubMed] [Google Scholar]
- Matsumoto S.; Miyano N.; Baba S.; Liao J.; Kawamura T.; Tsuda C.; Takeda A.; Yamamoto M.; Kumasaka T.; Kataoka T.; et al. Molecular Mechanism for Conformational Dynamics of Ras.GTP Elucidated from In-Situ Structural Transition in Crystal. Sci. Rep. 2016, 6, 25931. 10.1038/srep25931. [DOI] [PMC free article] [PubMed] [Google Scholar]
- Parker J. A.; Volmar A. Y.; Pavlopoulos S.; Mattos C. K-Ras Populates Conformational States Differently from Its Isoform H-Ras and Oncogenic Mutant K-RasG12D. Structure 2018, 26 (6), 810–820.E4. 10.1016/j.str.2018.03.018. [DOI] [PubMed] [Google Scholar]
- Brooks B. R.; Brooks C. L. 3rd; Mackerell A. D. Jr.; Nilsson L.; Petrella R. J.; Roux B.; Won Y.; Archontis G.; Bartels C.; Boresch S.; et al. CHARMM: the biomolecular simulation program. J. Comput. Chem. 2009, 30 (10), 1545–1614. 10.1002/jcc.21287. [DOI] [PMC free article] [PubMed] [Google Scholar]
- Klauda J. B.; Venable R. M.; Freites J. A.; O’Connor J. W.; Tobias D. J.; Mondragon-Ramirez C.; Vorobyov I.; MacKerell A. D. Jr; Pastor R. W. Update of the CHARMM all-atom additive force field for lipids: validation on six lipid types. J. Phys. Chem. B 2010, 114 (23), 7830–43. 10.1021/jp101759q. [DOI] [PMC free article] [PubMed] [Google Scholar]
- Jang H.; Muratcioglu S.; Gursoy A.; Keskin O.; Nussinov R. Membrane-associated Ras dimers are isoform-specific: K-Ras dimers differ from H-Ras dimers. Biochem. J. 2016, 473 (12), 1719–32. 10.1042/BCJ20160031. [DOI] [PMC free article] [PubMed] [Google Scholar]
- Muratcioglu S.; Jang H.; Gursoy A.; Keskin O.; Nussinov R. PDEδ Binding to Ras Isoforms Provides a Route to Proper Membrane Localization. J. Phys. Chem. B 2017, 121 (24), 5917–5927. 10.1021/acs.jpcb.7b03035. [DOI] [PMC free article] [PubMed] [Google Scholar]
- Ozdemir E. S.; Jang H.; Gursoy A.; Keskin O.; Nussinov R. Arl2-Mediated Allosteric Release of Farnesylated KRas4B from Shuttling Factor PDEδ. J. Phys. Chem. B 2018, 122 (30), 7503–7513. 10.1021/acs.jpcb.8b04347. [DOI] [PMC free article] [PubMed] [Google Scholar]
- Jang H.; Banerjee A.; Marcus K.; Makowski L.; Mattos C.; Gaponenko V.; Nussinov R. The Structural Basis of the Farnesylated and Methylated KRas4B Interaction with Calmodulin. Structure 2019, 27 (11), 1647–1659.E4. 10.1016/j.str.2019.08.009. [DOI] [PMC free article] [PubMed] [Google Scholar]
- Muratcioglu S.; Aydin C.; Odabasi E.; Ozdemir E. S.; Firat-Karalar E. N.; Jang H.; Tsai C. J.; Nussinov R.; Kavakli I. H.; Gursoy A.; et al. Oncogenic K-Ras4B Dimerization Enhances Downstream Mitogen-activated Protein Kinase Signaling. J. Mol. Biol. 2020, 432 (4), 1199–1215. 10.1016/j.jmb.2020.01.002. [DOI] [PMC free article] [PubMed] [Google Scholar]
- Phillips J. C.; Braun R.; Wang W.; Gumbart J.; Tajkhorshid E.; Villa E.; Chipot C.; Skeel R. D.; Kale L.; Schulten K. Scalable molecular dynamics with NAMD. J. Comput. Chem. 2005, 26 (16), 1781–802. 10.1002/jcc.20289. [DOI] [PMC free article] [PubMed] [Google Scholar]
- Pettersen E. F.; Goddard T. D.; Huang C. C.; Couch G. S.; Greenblatt D. M.; Meng E. C.; Ferrin T. E. UCSF Chimera--a visualization system for exploratory research and analysis. J. Comput. Chem. 2004, 25 (13), 1605–12. 10.1002/jcc.20084. [DOI] [PubMed] [Google Scholar]
- Kunzmann P.; Hamacher K. Biotite: a unifying open source computational biology framework in Python. BMC Bioinf. 2018, 19 (1), 346. 10.1186/s12859-018-2367-z. [DOI] [PMC free article] [PubMed] [Google Scholar]
- Michaud-Agrawal N.; Denning E. J.; Woolf T. B.; Beckstein O. MDAnalysis: a toolkit for the analysis of molecular dynamics simulations. J. Comput. Chem. 2011, 32 (10), 2319–27. 10.1002/jcc.21787. [DOI] [PMC free article] [PubMed] [Google Scholar]
- Rajendran V.; Gopalakrishnan C.; Purohit R. Impact of point mutation P29S in RAC1 on tumorigenesis. Tumor Biol. 2016, 37 (11), 15293–15304. 10.1007/s13277-016-5329-y. [DOI] [PubMed] [Google Scholar]
- Acuner S. E.; Sumbul F.; Torun H.; Haliloglu T. Oncogenic mutations on Rac1 affect global intrinsic dynamics underlying GTP and PAK1 binding. Biophys. J. 2021, 120, 866. 10.1016/j.bpj.2021.01.016. [DOI] [PMC free article] [PubMed] [Google Scholar]
- Poulin E. J.; Bera A. K.; Lu J.; Lin Y. J.; Strasser S. D.; Paulo J. A.; Huang T. Q.; Morales C.; Yan W.; Cook J.; et al. Tissue-Specific Oncogenic Activity of KRAS(A146T). Cancer Discovery 2019, 9 (6), 738–755. 10.1158/2159-8290.CD-18-1220. [DOI] [PMC free article] [PubMed] [Google Scholar]
- Ferrandez Y.; Zhang W.; Peurois F.; Akendengué L.; Blangy A.; Zeghouf M.; Cherfils J. Allosteric inhibition of the guanine nucleotide exchange factor DOCK5 by a small molecule. Sci. Rep. 2017, 7 (1), 14409. 10.1038/s41598-017-13619-2. [DOI] [PMC free article] [PubMed] [Google Scholar]
- Hirshberg M.; Stockley R. W.; Dodson G.; Webb M. R. The crystal structure of human rac1, a member of the rho-family complexed with a GTP analogue. Nat. Struct. Biol. 1997, 4 (2), 147–52. 10.1038/nsb0297-147. [DOI] [PubMed] [Google Scholar]
- Lucato C. M.; Halls M. L.; Ooms L. M.; Liu H. J.; Mitchell C. A.; Whisstock J. C.; Ellisdon A. M. The Phosphatidylinositol (3,4,5)-Trisphosphate-dependent Rac Exchanger 1·Ras-related C3 Botulinum Toxin Substrate 1 (P-Rex1·Rac1) Complex Reveals the Basis of Rac1 Activation in Breast Cancer Cells. J. Biol. Chem. 2015, 290 (34), 20827–40. 10.1074/jbc.M115.660456. [DOI] [PMC free article] [PubMed] [Google Scholar]
Associated Data
This section collects any data citations, data availability statements, or supplementary materials included in this article.