

Abstract
Organic dust (OD) exposure in animal production industries poses serious respiratory and other health risks. OD consists of microbial products and particulate matter and OD exposure induced respiratory inflammation is under investigation. However, the effect of OD exposure on brain remains elusive. We have shown that OD exposure of microglial cells induces an inflammatory phenotype with the release of mitochondrial DNA (mt-DNA). Therefore, we tested a hypothesis that OD-exposure induced secreted mt-DNA signaling drives the inflammation. Mouse microglial cell line was treated with medium or organic dust extract (ODE, 1% v/v) along with either PBS or mitoapocynin (MA, 10 μmol). Microglia treated with control or anti-STING siRNA were exposed to medium or ODE. Mouse organotypic brain slice cultures (BSCs) were exposed to medium or ODE with or without MA. Various samples were processed to quantify mitochondrial reactive oxygen species (mt-ROS), mt-DNA, cytochrome c, TFAM, mitochondrial stress markers and mt-DNA induced signaling via cGAS-STING and TLR9. Data were analyzed and a p value of ⩽ 0.05 was considered significant. MA treatment decreased the ODE-induced mt-DNA release into cytosol. ODE increased MFN1/2 and PINK1 but not DRP1 and MA treatment decreased the MFN2 expression. MA treatment decreased the ODE-exposure induced mt-DNA signaling via cGAS-STING and TLR9. Anti-STING siRNA decreased the ODE-induced increase in IRF3, IFN-β and IBA-1 expression. In BSCs, MA-treatment decreased the ODE induced TNF-α, IL-6 and MFN1. Therefore, OD exposure induced mt-DNA signaling could be curtailed through cytoplasmic NOX-2 inhibition or STING suppression to reduce brain microglial inflammatory response.
Keywords: organic dust, inflammation, microglia, mitochondrial DNA, cGAS-STING
Introduction
Working in agriculture production and other industries is a risk factor for developing respiratory and other diseases due to exposure to contaminants (Nordgren and Charavaryamath, 2018). Among the contaminants, airborne organic dust (OD), gases (methane, ammonia, and hydrogen sulfide), odorant molecules and particulate matter (PM) of various sizes are central to the adverse health effects. OD generated in agricultural settings (swine, poultry, cattle, and other animal production units) is a complex mixture of PM and microbial products consisting of various pathogen-associated molecular patterns (PAMPs). Among the PAMPs, lipopolysaccharide (LPS) and peptidoglycan (PGN), bacterial DNA, and fungal spores have been documented in the OD samples (American Thoracic Society, 1998, Charavaryamath and Singh, 2006, Iowa State University and University of Iowa, 2002, Roy, et al., 2003). Occupational exposure to OD is known to result in various respiratory symptoms, including bronchitis, asthma-like symptoms, coughing, sneezing, mucus membrane irritation, chest tightness, and an annual decline in lung function. Cell and molecular mechanisms underlying these respiratory exposures are under investigation by several groups (Knoell, et al., 2019, Poole, et al., 2019, Warren, et al., 2019), including our laboratory (Bhat, et al., 2019, Massey, et al., 2019b, Nath Neerukonda, et al., 2018). We have shown the importance of TLR4 in OD induced lung inflammation as well as TLR4 independent effects of OD on the lung (Charavaryamath, et al., 2008). Other groups have measured the markers of LPS, PGN, fungal cell wall (Poole, et al., 2010b) and have shown the role of various pattern recognition receptors such as TLR2 (Poole, et al., 2011), NOD2 (Johnson, et al., 2020, Poole, et al., 2010a) and MyD88. These reports and our recent work (Nath Neerukonda, Mahadev-Bhat, Aylward, Johnson, Charavaryamath and Arsenault, 2018) using kinome analysis confirms the complex composition of OD samples and how host response induces overlapping signaling events.
Despite the investigation of OD-exposure induced respiratory diseases, the effect of exposure to OD on other vital organs such as the brain largely remains unknown. Particularly the published observation that there is an increased incidence of Parkinson's disease in the mid-western and north-eastern USA is interesting (Wright Willis, et al., 2010a). These geographical areas are also known for their higher density of animal production facilities. Microglial cells of the brain are primary sentinel cells that respond to danger signals through morphological signs of activation and production of pro-inflammatory mediators (Block, et al., 2007, Wolf, et al., 2017). Our previous work demonstrated that OD exposure induces a pro-inflammatory phenotype in a mouse microglial cell line. Following OD exposure, microglia secreted pro-inflammatory mediators and reactive species. OD exposure also resulted in nucleocytoplasmic translocation of high-mobility group box 1 (HMGB1) and HMGB1-RAGE signaling. Following pharmacological inhibition of HMGB1 translocation using ethyl pyruvate (EP) or siRNA mediated suppression of HMGB1, we observed a reduction in reactive species, TNF-α and IL-6 production collectively. Next, pharmacological inhibition of cytoplasmic NOX-2 using mitoapocynin (MA) reduced OD-induced RNS production in microglia (Massey, Puttachary, Mahadev-Bhat, Kanthasamy and Charavaryamath, 2019b). These results indicate a prime role for microglia in OD exposure induced neuroinflammation. Further, our results showed that secreted HMGB1 and cellular mitochondria could be an attractive therapeutic target to curtail OD-induced neuroinflammation.
Cellular homeostasis is controlled mainly by organelles such as mitochondria and endoplasmic reticulum (ER). ER lumen maintains a unique environment which plays a vital role in protein folding. This delicate homeostasis in the lumen can be disturbed by high protein demand and inflammatory processes resulting in a large number of misfolded proteins in the ER lumen. ER stress responses are initiated by mainly by three transmembrane proteins: Inositol Requiring 1 (IRE1), PKR-like ER kinase (PERK), and Activating Transcription Factor 6 (ATF6). Activated IRE1 leads to splicing of X-box binding (XBP1) mRNA which functions as a stable UPR transcription factor. Activating transcription factor 4 (ATF4) is involved in protein folding and anti-oxidative stress (Oslowski and Urano, 2011). Glucose regulated protein 94 (GRP94), a protein that resides in the lumen of ER and regulates protein folding (Marzec, et al., 2012). Mitochondria are a seat of energy production and are located in the cytoplasm of cells and additionally contribute to essential cellular functions such as calcium signaling, immunity, and apoptosis (Missiroli, et al., 2020). A growing number of publications indicate that mitochondrial dysfunction is central to neurodegenerative disorders (Lin and Beal, 2006) (Johri and Beal, 2012). Mitochondria are dynamic organelles that continually undergo fusion (mediated by MFN1 and MFN2 genes) and fission (mediated by DRP1 gene). Several metabolic and neurological disorders are known to alter these genes (MFN1/2 and DRP1) and affect mitochondrial homeostasis (Chan, 2006) (Johri and Beal, 2012). Mitophagy is a crucial regulator of mitochondrial turnover and cell death (Lin and Beal, 2006) (Truban, et al., 2017) and mitochondria undergo PINK1 mediated mitophagy during apoptosis.
Now, a growing body of evidence suggests a prime role for mitochondria in triggering and maintaining inflammation and mitochondrial dysfunction is emerging as a critical factor in inflammatory processes (Escames, et al., 2012). Many damage-associated molecular patterns (DAMPs) such as peptides, lipids, and mitochondrial DNA (mt-DNA) are known to be released from mitochondria. Released DAMPs are capable of activating pattern recognition receptors (PRRs) to induce inflammation. Mainly, mt-DNA released from the mitochondrial matrix is known to signal through multiple PRRs such as Toll-like receptor 9 (TLR9), Nod-like receptors-3 (NLRP3), and cyclic GMP–AMP synthase/stimulator of interferon gene (cGAS-STING) pathways and could mount an exaggerated inflammatory response (Nakayama and Otsu, 2018). mt-DNA is a circular molecule comprising of double-stranded DNA, and human mt-DNA sequencing has shown that it includes 16,569 base pairs and encodes 13 proteins. Change in mitochondrial membrane integrity increases the chances of mt-DNA release into the cellular cytosol, which can lead to an auto-immune response (Riley, et al., 2018) or inflammation. cGAS is a DNA sensing receptor that signals through stimulator of interferon gene (STING) and leads to the production of IFN-β. Also, STING knockdown has shown to ameliorate inflammatory responses in cultured tubular cells of the kidney following cisplatin treatment (Maekawa, et al., 2019). cGAS-STING mediated mt-DNA signaling is an emerging target to curtail inflammation (Motwani, et al., 2019). Apocynin (4-hydroxy-3-methoxyacetophenone) is a plant-derived mitochondria targeting antioxidant. Apocynin inhibits cytoplasmic NOX2 activity and has been studied using various in vitro and in vivo models (Jin, et al., 2014) (Gao, et al., 2003) (Anantharam, et al., 2007). Apocynin has been shown to be well tolerated even at high doses (Anantharam, Kaul, Song, Kanthasamy and Kanthasamy, 2007) (Cristóvão, et al., 2009). Mitoapocynin (MA) is a cytoplasmic NOX2 inhibitor (Langley, et al., 2017a) and is a more efficacious synthetic analog of apocynin made by conjugating a triphenylphosphonium cation moiety via an alkyl chain with differing chain lengths (C2-C11) (Ghosh, et al., 2016). While the neuroprotective effects of MA(C2) have been established in in vitro models (Ghosh, Langley, Harischandra, Neal, Jin, Anantharam, Joseph, Brenza, Narasimhan, Kanthasamy, Kalyanaraman and Kanthasamy, 2016), the long-acting MA(C11) has been more extensively used in in vivo models (Langley, et al., 2017b) (Dranka, et al., 2014).
To understand the mechanisms of OD-induced inflammation in microglial cells, it is essential to utilize relevant models. Microglial cells of the brain are central to the innate response to the danger signals and are the chief drivers of neuroinflammation (Block, Zecca and Hong, 2007, Xu, et al., 2021). In vitro models of microglial cells have been used to unravel mechanisms of neuroinflammation (Nyzil et al., 2019), and mitochondrial damage has been shown to be central in many neurodegenerative diseases (Lin and Beal, 2006). Therefore, we tested a hypothesis that OD exposure induced secreted mt-DNA signaling drives the inflammation. This hypothesis was tested using an in vitro model of microglial cells and ex vivo organotypic brain slice cultures (BSCs) to demonstrate that OD exposure induces mitochondrial and endoplasmic reticulum stress responses and resultant inflammation involves the release of mt-DNA and signaling through cGAS-STING pathway. In the current manuscript, we demonstrated that exposure to OD induces mitochondrial and ER stress and release of mt-DNA leading to cGAS-STING mediated signaling. Using anti-STING siRNAs or cytoplasmic NOX-2 inhibitory agent MA (C2/C11), we demonstrate a reduction in OD-induced mitochondrial and ER stress and resultant inflammation.
Materials and methods
Preparation of organic dust extract (ODE)
All the experiments were conducted in accordance with an approved protocol from the Institutional Biosafety Committee (IBC protocol# 19-004) of the Iowa State University. Settled swine barn dust (representing OD) was collected from various swine production units into sealed bags with a desiccant and transported on ice to the laboratory. Organic dust extract (ODE) was prepared as per a published protocol (Romberger, et al., 2002). Briefly, dust samples were weighed, and for every gram of dust, 10 mL of Hank’s balanced salt solution without calcium (Gibco) was added, and allowed to stir at room temperature for 60 min. The mixture was centrifuged (1365 g, 4° C) for 20 min, supernatant collected, and the pellet was discarded. The supernatant was centrifuged again with the same conditions, the pellet discarded and recovered supernatant was filtered using a 0.22 μm filter and stored at −80° C until used. This stock was considered 100% and diluted in cell culture medium to prepare a 1% v/v solution to use in our experiments (Table 1).
Table 1.
Microglial Cell Treatments
| Treatment Groups | Co-treatment |
|---|---|
| Control | Medium |
| ODE | ODE 1% v/v |
| ODE+MA (C2/C11*) | ODE 1% v/v + MA 10 μmol |
C11 fraction of the MA was used to treat organotypic BSCs and C2 fraction of the MA was used in all other in vitro experiments.
Previous work on characterization of ODE samples has shown that, dust extracts contain lipopolysaccharide (LPS), 3-hydroxy fatty acids (3-OHFA, marker of LPS), muramic acid (marker of Gram-positive bacterial cell wall component, peptidoglycan), ergosterol (marker of fungal biomass) (Poole, Dooley, Saito, Burrell, Bailey, Romberger, Mehaffy and Reynolds, 2010b). Various bacterial species (Boissy, et al., 2014, White, et al., 2019) including archaea bacteria (Bønløkke, et al., 2019) have been identified in the animal confinement organic dust samples. Previously, we have shown that airborne organic dust samples contain LPS and viable bacteria (Charavaryamath, et al., 2005, Charavaryamath, Juneau, Suri, Janardhan, Townsend and Singh, 2008). Presently, we routinely quantify the LPS content of our ODE samples using Pyrochrome® Kinetic Chromogenic Endotoxin (CAPE COD, catalog # CG-1500-5) as per the instructions. LPS content of several of our ODE samples has been reported in a previous publication (Bhat, Massey, Karriker, Singh and Charavaryamath, 2019).
The biological activity and inflammatory response due to exposure to ODE has been modeled and well characterized by our group and other research laboratories. We have recently shown that ODE samples induce inflammatory response in human airway epithelial cells (Bhat, Massey, Karriker, Singh and Charavaryamath, 2019) and mouse microglial cell line (Massey, Puttachary, Mahadev-Bhat, Kanthasamy and Charavaryamath, 2019b). A mouse model of intra-nasal inhalation of ODE has been well characterized and used to delineate mechanisms of respiratory inflammation (Poole, et al., 2020, Poole, et al., 2009).
Quantification of endotoxin in ODE samples
We quantitatively measured endotoxin levels in our ODE samples using the Pierce Chromogenic Endotoxin Quant Kit (catalog# A39553, ThermoFisher Scientific). First, the above prepared ODE samples (considered 100 %) were diluted in a ratio of 1:50 in endotoxin free water. The diluted samples (50 μL) along with reconstituted amebocyte lysate reagent (50 μL) were added to an endotoxin free 96-well plate (sample to lysate ratio of 1:1). The LPS standard (derived from E. coli O111:B4) was reconstituted as per manufacturer’s recommendation and added to the plate in a sample to lysate ratio of 1:1. The microplate was incubated at 37°C for 12 to 35 minutes based on the range of standards used. Following incubation, 100 μL of chromogenic substrate was added and the plate was incubated at 37°C for 6 minutes. A stop solution (50 μL of 25% acetic acid) was added and absorbance was read at 405 nm using spectrophotometer reader (SpectraMax M2 Gemini Microplate Reader, Molecular Devices, San Jose, CA). The average of blank wells was deducted from the average of samples and standards. A linear standard graph was plotted with R>98% and sample concentrations were extrapolated from the equation of the slope using the OD values. All the calculations were performed using Excel (Office 365, Microsoft, Redmond, WA).
Chemicals and reagents
Dulbecco’s minimum essential medium (DMEM), penicillin, and streptomycin (PenStrep), L-glutamine, and trypsin-EDTA were purchased from Life Technologies (Carlsbad, CA). Fetal bovine serum (FBS) was purchased from Atlanta Biologicals (Flowery Branch, GA, catalog # S11150H and lot # A17002). Poly-D-Lysine (Sigma, catalog # P6407) was prepared and stored as 0.5 mg/mL stock at −20° C. Oligomycin, hydrogen peroxide, carbonyl cyanide 4-trifluoromethoxy-phenylhydrazone (FCCP) and antimycin A were purchased from Sigma Aldrich (St. Louis, MO), and the Seahorse FluxPak calibration solution was purchased from Seahorse Biosciences (Billerica, MA). Rhod-2 AM (ab142780) was purchased from Abcam (Cambridge, MA). Mitotraker green, Dulbecco’s phosphate buffer saline (DPBS), mitochondrial isolation kit for cultured cells (catalog # 89874), DNA purification kit (Thermo Fisher Scientific, catalog # K0512) were purchased from Thermo Fisher Scientific (Waltham, MA). IGEPAL CA630 (I3021) was purchased from Sigma. Mitoapocynin (MA) was procured from Dr. Balaraman Kalyanaraman (Medical College of Wisconsin, Milwaukee, WI), stock solution (10 mM/L in DMSO) was prepared by shaking vigorously and stored at - 20° C. MA was used (10 μM) as one of the co-treatments (Table 1).
Cell culture and treatments
Wild-type mouse microglial cell line derived from wild-type C57BL/6 mice (Halle, et al., 2008) was a kind gift from Dr. DT Golenbock (University of Massachusetts Medical School, Worcester, MA) to Dr. AG Kanthasamy. Microglial cells were grown in T-75 flasks (1 x 10⁶ cells/flask), 12 well tissue culture plates coated with poly-D Lysine, 24 well tissue culture plates (50 x 103 cells/well) and in 24 well seahorse assay plate (15 x 103 cells/flask). Cells were maintained in DMEM supplemented with 10% heat inactivated fetal bovine serum (FBS), 50 U/mL penicillin, 50 μg/mL streptomycin, and 2 mM L-glutamine. Cells were incubated overnight before treatment. All the treatment groups with pre-treatment and co-treatment details are outlined in Table 1. Control group samples were collected at 0 h because the control group samples from 6, 24, and 48 h time points did not show any differences in our pilot studies (electronic supplementary data, Figures 5). To address the specific role of the cGAS-STING pathway, in separate experiments, cells were treated either with anti-STING or negative control siRNAs followed by either saline or ODE-exposure.
Microglial morphology
To understand the impact of ODE-exposure on microglial cell morphology, we performed light and electron microscopic analysis. Cells were grown in 24 well plates and maintained in Dulbecco’s Modified Eagle’s Medium (DMEM, Thermo Fisher Scientific, Waltham, MA) supplemented with 10% heat inactivated FBS, 50 U/mL of penicillin, 50 μg/mL of streptomycin and 2 mM L-glutamine and incubated overnight. Cells were treated as outlined in Table 1. Live cell imaging of the microglial cells was performed under an inverted bright field microscope (ALPHAPHOT-2, Nikon). Before counting the cells, observers were blinded to the treatment groups. Cells with an increase in the size of cell body and number of processes compared to control were counted (Hinwood, et al., 2012) (Crews and Vetreno, 2015) (Ransohoff, 2016) manually using ImageJ (NIH) in five randomly selected microscopic fields viewed under a 20X objective lens. Percent of morphologically different microglia were quantified, data analyzed and graphically represented.
Transmission electron microscopy
Cells were grown in 12-well tissue culture plates coated with Poly-D Lysine and maintained in Dulbecco’s Modified Eagle’s Medium (DMEM, ThermoFisher Scientific, Waltham, MA) supplemented with 10% heat-inactivated FBS, 50 U/mL of penicillin, 50 μg/mL of streptomycin and 2 mM L-glutamine and incubated overnight. Cells were treated as outlined in Table 1 and after 6, 24 or 48 h cells were washed with ice cold HBSS and fixed with 1% paraformaldehyde and 2.5% glutaraldehyde for 24 h at 4° C. Fixed cells were embedded, sectioned, stained and imaged at the electron microscopy core facility (Roy J. Carver High Resolution Microscopy Facility, Iowa State University, Ames, IA). An investigator blinded to the treatment groups identified the ultra-structural changes.
Western blot analysis
Cells were grown in T-75 flasks (1 x 10⁶ cells/flask) and incubated overnight at 37° C with 5% CO2. Following co-treatments (outlined in Table 1), cells were treated with 0.5% trypsin for 15 min at 37° C and then re-suspended in equal volumes of DMEM and 10% FBS. Mitochondrial fraction was separated using a mitochondrial isolation kit (Thermo Fisher Scientific, catalog # 89874). Whole-cell lysates were prepared using RIPA buffer, and total protein was estimated using Bradford assay. Equal amounts of proteins (20 μg/well) were resolved on 10% SDS-PAGE gels (Bio-Rad). Next, proteins were transferred to a nitrocellulose membrane, and the nonspecific binding sites were blocked for an hour with a blocking buffer specially formulated for fluorescent western blotting (Rockland Immunochemicals, Pottstown, PA). Membranes were incubated overnight at 4 °C with the respective primary antibodies (listed in Table 5; supplementary data) namely caspase 3, caspase 9, Cytochrome c, TFAM, MFN1, MFN2, DRP1, PINK1, SOD-2, TLR9, cGAS, IFN-β, IBA1, β-actin (1:5000, Abcam; ab6276 or ab8227). Next, membranes were incubated with the respective secondary donkey anti-rabbit IgG highly cross-adsorbed (A10043) or anti-mouse 680 Alexa Fluor antibodies (A21058, Thermo Fisher Scientific). Membranes were washed three times with PBS containing 0.05% Tween-20 and visualized on the Odyssey infrared imaging system. Using GAPDH or β-actin as a loading control, band densities were normalized, and densitometry was performed (ImageJ, NIH). β-Actin (42 kDa) is commonly chosen as a loading control due to its general expression across all the eukaryotic cell types. This protein's expression levels do not vary drastically due to experimental cellular treatment, which is another reason this particular protein makes a reasonable control. On the other hand, GAPDH (36 kDa) is integral for glycolysis and plays many roles in the nuclear function; such as transcription regulation and apoptosis. Therefore, while looking at cytochrome C release which is usually linked to apoptotic changes, we chose to use GAPDH as the loading control. The stable and ubiquitous expression of GAPDH also makes it a suitable loading control for many experiments (Tarze, et al., 2007).
Seahorse assay
Mitochondrial oxygen consumption/bioenergetics was measured using a Seahorse XFe24 Extracellular Flux analyzer (Dr. Anumantha G. Kanthasamy’s laboratory, Iowa State University, Ames, IA) as described previously (Dranka, et al., 2011). The Seahorse XFe24 Extracellular Flux analyzer is a sensitive, high-throughput instrument that performs real-time measurements of respiration rates of cells with or without oxidative stress. For quantifying mitochondrial bioenergetics, cells were first treated as outlined in Table 1 and maintained in 5% CO2 at 37°C for 48 h. Simultaneously, a Seahorse FluxPak cartridge was equilibrated 24 h before seahorse analysis and loaded with the mito-stressor agents such as oligomycin (1 μg/mL), FCCP (1 μM) and antimycin A (10 μM). Once the mito-stressors were loaded in their corresponding position in the cartridge, the treated plate with microglia was introduced into the Seahorse analyzer covered with the FluxPak cartridge. The analyzer was then programmed to measure the basal oxygen consumption rate (OCR) readouts in five specified time intervals before progressing to inject the mito-stressors. The mito-stressors were injected after every three cycles of measurements of OCR. Further analysis of data was performed using a T-test.
Confocal microscopy of microglial cells
Microglial cells were seeded into 35 mm diameter glass bottom wells and maintained in Dulbecco’s Modified Eagle’s Medium (DMEM, Thermo Fisher Scientific, Waltham, MA) supplemented with 10% heat inactivated FBS, 50 U/mL of penicillin, 50 μg/mL of streptomycin and 2 mM L-glutamine and incubated overnight. Cells were treated as outlined in Table 1. After washing with ice cold DPBS, cells were loaded with either mitochondria localizing probe MitoTracker® Green (Invitrogen catalog # M7514,100 nM, for 12 min) followed by the fluorogenic mitochondria-targeted Ca2+ probe Rhod-2 AM (10 μM) for 30 min in 37°C in DMEM containing 10% fetal calf serum or MitoSox® (mitochondrial superoxide staining dye, Invitrogen catalog # M36008,100 nm) for 15 min. After loading with either of the dyes, cells were placed on the stage of the Nikon confocal microscope. MitoTracker® Green was observed using FITC filter and Rhod-2 AM and MitoSox® were observed using cy3 filter. Following MitoSox staining, five fields (under a 20X objective lens) per slide were chosen randomly, and all the stained cells were counted (ImageJ, NIH). Next, the total staining intensity per field (cy3) was measured using a computer software (HC Image, Hamamatsu Corp, Sewickley, Pennsylvania). The total staining intensity of the microscopic field (cy3) was divided by the total number of cells per field to obtain mean intensity (cy3) per cell.
qRT-PCR
Total cellular RNA was isolated using TRIzol™ (Invitrogen catalog # 15596-026) extraction methods as per the manufacturer’s guidelines. Following treatments (Table 1), RNA concentration was measured using NanoDrop, and the A260/A280 ratio was used to determine the quality. Samples with an A260/A280 ratio between 1.8-2.1 were considered acceptable and used for further analysis. One microgram of RNA was reverse transcribed into cDNA using the superscript IV VILO Kit (Thermo Fisher Scientific, catalog # 11766050) following the manufacturer’s protocol. For qPCR, 5 μL of PowerUp™ SYBR Green Master mix (Thermo Fisher Scientific, catalog # 25742), 0.5 μL each of forward and reverse primers (10 μM), 3 μL of water and 1 μL of cDNA (1-10 ng) were used. The genes and their respective primer sequences used for qRT-PCR analysis are listed in supplementary Table 3 (electronic supplementary data), and all the primers were synthesized at Iowa State University’s DNA Facility. 18 S and β-actin were used as housekeeping genes in all the qRT-PCR experiments. No template controls and dissociation curves were run for all experiments to exclude cross-contamination. CT values of gene products of interest were normalized to housekeeping gene product CT values. Comparisons were made between experimental groups using the ΔCT method. Briefly, the ΔCT value was calculated for each sample (CT gene of interest minus CT 18 S or β-actin). Then the calibrator value was averaged (ΔCT) for the control samples. The calibrator was subtracted from the ΔCT for each control and from the experimental sample to derive the ΔΔCT. The fold change was calculated as 2−ΔΔCt. Average fold change was calculated for each experimental group.
Mitochondrial DNA detection
Cells were seeded in T-25 tissue culture flask (2x 10⁵ cells/flask). After administering the treatments, cells were washed once with ice-cold DPBS and lysed with 1% Nonidet P-40 (Igepal Ca-630, Sigma- Aldrich, catalog #18896). Following centrifugation (13000 rpm for 15 min at 4° C), mitochondria free cytosolic fraction of microglia was collected, and DNA was purified using DNA purification kit (Thermo fisher scientific, catalog # K0512). For q-PCR, 10 μL of SYBR Green Mastermix (Qiagen catalog #208056), 1 μL of primers, 8 μL of water and 1 μL of cDNA were used. The mitochondrially encoded cytochrome c oxidase gene was used in our qRT-PCR reaction (primer sequences: forward 5’-GCCCCAGATATAGCATTCCC-3, and reverse 5’-GTTCATCCTGTTCCTGCTCC-3’, synthesized at Iowa State University’s DNA Facility) (Bronner and O’Riordan, 2016) to quantify the amount of mt-DNA. Using primers specific for 18S, we quantified the housekeeping gene expression.
DNase treatment of ODE
In order to eliminate any interference by the prokaryotic or eukaryotic DNA that may be present in 0.2 μm filtered ODE samples, we performed the DNase treatment. Total RNA in an ODE sample was measured using NanoDrop (Biotek synergy 2). Then RNA concentration was used as a criterion for the amount of DNase (Turbo DNase, Thermo Fisher Scientific catalog # AM2239) to be added in 50 μL volume of 100% ODE to remove any traces of DNA effectively.
siRNA-mediated knockdown of STING
Our protocol for siRNA mediated knockdown of a gene of interest is published (Massey, Puttachary, Mahadev-Bhat, Kanthasamy and Charavaryamath, 2019b). Briefly, three (R1, R2, and R3) custom-designed Dicer-substrate anti-STING siRNAs (DsiRNA), scrambled RNA (negative control, NC and a fluorescent transfection control (TYE563) were purchased from Integrated DNA Technologies Inc. (Coralville, Iowa) to maximize the probability of achieving successful STING knockdown. Lipofectamine 2000 (Thermo Fisher Scientific) was employed to transfect DsiRNA into the microglia. Sequences of siRNAs and NC siRNA are listed in supplementary Table 4 (electronic supplementary data). For performing transfection with various siRNAs, microglia were cultured a day before in DMEM without antibiotics and FBS. For each transfection, 20 mmol of (DsiRNA) for STING, scrambled RNA (negative control), and a fluorescent transfection control (TYE563) were diluted in Opti-MEM media without antibiotics and FBS to 10 nmol and gently mixed with Lipofectamine 2000 according to the manufacturer’s protocol. Following incubation for 20 min at room temperature, the transfection mixture was added to the cells, transfected cells were further incubated at 37 °C for 24, and 48 h, and knockdown was confirmed by qRT-PCR and Western blot analysis of the target gene and protein respectively. Transfection was confirmed by performing immunofluorescence (IF) for TYE563 (fluorescent transfection control).
MA treatment of microglia and brain slice cultures (BSCs)
MA treatment was used only when there was a ODE exposure effect. Two forms of Mitoapocynin (MA, C2 or C11) were used in this study and unless otherwise specified, MA refers to C2 fraction. Details of the preparation of MA (C2 and C11) and its neuroprotective properties have been reviewed (Ghosh, Langley, Harischandra, Neal, Jin, Anantharam, Joseph, Brenza, Narasimhan, Kanthasamy, Kalyanaraman and Kanthasamy, 2016) (Dranka, Gifford, McAllister, Zielonka, Joseph, O'Hara, Stucky, Kanthasamy and Kalyanaraman, 2014). Microglial cells were treated with MA (C2, 10 μmol) for 48 h (Ghosh, Langley, Harischandra, Neal, Jin, Anantharam, Joseph, Brenza, Narasimhan, Kanthasamy, Kalyanaraman and Kanthasamy, 2016) and MA(C11) is found effective for use in in vivo models as per prior published work (Dranka, Gifford, McAllister, Zielonka, Joseph, O'Hara, Stucky, Kanthasamy and Kalyanaraman, 2014). MA(C11) was found to have superior neuroprotective effects in our ex vivo model at 10 μmol for 5 day as compared to MA(C2) (data not shown). MA (C2 or C11) exposure for in vitro and ex vivo models was administered as co-treatments with ODE (1%). We did not include MA(C2 or C11) alone in media since apocynin has shown to be nontoxic in cell culture and mouse models and can be well tolerated even at higher doses (Anantharam, Kaul, Song, Kanthasamy and Kanthasamy, 2007) (Cristóvão, Choi, Baltazar, Beal and Kim, 2009).
Brain slice cultures (BSCs)
All the work described here was performed as per the approved protocols from the Iowa State University’s Institutional Animal Care and Use Committee (IACUC protocol # 18-290). Organotypic brain slices were prepared as previously described (Kondru, et al., 2017). As per an approved protocol (IACUC protocol #18-227), we procured the breeding pairs of C57BL/6 mice (The Jackson Laboratories, Bar Harbor, ME) and paired male and female mice of around four weeks of age. Mouse pups born were kept with the parents until 9-12 days of age. Mouse pups (9-12 days, male or females) were euthanized by cervical dislocation by pinching and disrupting in the high cervical region as per an approved AVMA method for the euthanasia of pups of 9-12 days of age. Organotypic brain slices (BSCs) were prepared from freshly dissected brain tissues using a microtome (Compresstome™ VF-300, Precisionary Instruments). After dissection, the whole brain was oriented in the mid-sagittal plane in the Compresstome’s specimen tube, which had been prefilled with 2% low-melting-point agarose. The agarose was quickly solidified by clasping the specimen tube with a chilling block. Then, the specimen tube was inserted into the slicing reservoir filled with freshly prepared, ice-cold Gey’s balanced salt solution supplemented with the excitotoxic antagonist, kynurenic acid (GBSSK). To prepare GBSS, we added the following in solution in the following order from 10x stocks to obtain the final concentrations per liter: 8 g NaCl, 0.37 g KCl, 0.12 g Na2HPO4, 0.22 g CaCl2 · 2H2O, 0.09 g KH2PO4, 0.07 g MgSO4 · 7H2O, 0.210 g MgCl2 · 6H2O, 0.227 g NaHCO3. The compression lip located in the cutting chamber helps to stabilize the brain specimen while obtaining 350-μm thick slices with the blade set at a medium vibration speed. BSCs were collected at the specimen tube’s outlet and transferred to another plate with fresh prefilled GBSSK. Later, the BSCs were washed twice in 6 mL ice-cold GBSSK, transferred to 6-well plate inserts (Falcon catalog #353090, 3-4 slices per insert), and were incubated in a humidified atmosphere with 5% CO2 at 37 °C for 2 weeks. Cutting brain tissue into thin slices can actually cause trauma to the neuronal processes and glial cells. Thus, immediately after preparation of BSCs, a widespread gliosis could be observed. In order to minimize the effect of this injury on experimental outcomes, it is recommended to incubate the BSCs before any treatments could be performed. Incubating BSCs for two weeks in a humidified atmosphere with 5% CO2 at 37 °C is found to be beneficial and helps to overcome the effect of trauma due to sectioning (Croft and Noble, 2018, Kondru, Manne, Greenlee, West Greenlee, Anantharam, Halbur, Kanthasamy and Kanthasamy, 2017). During this incubation, culture media was replenished every other day for two weeks. After two weeks of incubation, BSCs in cultures were treated for five days and all the treatment groups with pre-treatment and co-treatments are outlined in Table 1.
Confocal imaging of BSCs
After five days of treatment with either medium (control) or ODE followed by either MA (C11) or vehicle (PBS), BSCs on inserts were cut out with a scalpel and placed in a new 12-well inserts facing upward and washed twice with phosphate-buffered saline (PBS) and fixed in 4% paraformaldehyde at room temperature for 30 min and incubated with ice-cold 20% methanol in PBS for an additional 5 min. BSCs were permeabilized with 1% Triton X-100 in PBS for 12-18 h at 4°C. Blocking was performed with 20% BSA with 0.1 % Triton X-100 in PBS for 2-3 h. Next, BSCs were incubated with anti IBA-1 and anti NeuN antibodies (listed in supplementary Table 6; electronic supplementary data) overnight at 4°C. After being washed with washing solution (5% BSA in PBS), BSCs were incubated with secondary antibodies (supplementary Table 6; electronic supplementary data), for 12 h at 4° C followed by mounting with VECTASHIELD antifade mounting medium containing 4’, 6-Diamidino-2-Phenylindole, Dihydrochloride (DAPI, Vector Labs, Burlingame, California) and covered with a cover-glass. The cover glasses were sealed with nail polish, and slides were imaged by viewing under a microscope (Nikon Eclipse TE2000-U). Images were photographed using a camera and a software (Photometrics Cool Snap cf, HCImage, Tucson, AZ).
TUNEL assay
Following five days of treatment with either medium (control) or ODE followed by either MA (C11) or vehicle (PBS), BSCs on inserts were cut out with a scalpel and placed in a new 12 well inserts facing upward (BSCs side up) and washed twice with phosphate-buffered saline (PBS) and fixed in 4% paraformaldehyde at room temperature for 30 min. TUNEL assay was performed using a DeadEnd™ Fluorometric TUNEL System according to the manufacturer’s instructions (Promega Corporation, Madison, WI, USA). Briefly, BSCs were rinsed in PBS and incubated in 20 μg/mL proteinase K for 10 min. After rinsing in PBS (0.05 M phosphate buffer containing 0.145 M sodium chloride, pH 7.4), the BSCs were incubated with equilibration buffer and then TdT enzyme in a humidified chamber at 37°C for 60 min. Next, BSCs were transferred into pre-warmed working strength stop wash buffer for 15 min. Following rinsing with PBS, the BSCs were mounted with brain slices facing up with VECTASHIELD antifade mounting medium containing 4’, 6-Diamidino-2-Phenylindole, Dihydrochloride (DAPI, Vector Labs, Burlingame, California). BSCs on slides were covered with a cover-glass and the cover glasses were sealed with nail polish. Nuclei were stained blue with DAPI and localized green fluorescence of apoptotic cells was detected by fluorescence microscopy and photographed (Nikon Eclipse TE2000-U, Photometrics Cool Snap cf, HCImage). TUNEL positive cells were counted manually using ImageJ (NIH) software in five randomly selected microscopic fields viewed under 20X objective lens. Percent of TUNEL positive cells were quantified, statistically analyzed, and plotted.
Statistical analysis
Data were expressed as mean ± SEM and analyzed by T-test or one-way or two-way ANOVA followed by Bonferroni’s post hoc comparison tests (GraphPad Prism 5.0, La Jolla, California). A p-value of < 0.05 was considered statistically significant. An asterisk (*) indicates a significant difference between controls and ODE treated cells whereas hashtag (#) indicates either MA(C2/C11) treatment or siRNA-mediated STING knockdown effect. The p-values (Figs. 1-10, electronic supplementary Figs. 1-3 and respective legends) corresponding to asterisk/s or hashtag/s are listed in Table 2.
Fig 1. MA reduces ODE induced morphological and ultrastructural changes in Microglia.

Microglia were exposed to media or ODE and co-treated with either vehicle or MA. Morphological signs of differentiation such as an increase in size and change in shape (amoeboid body with thick and longer processes) were observed, and percent of differentiated microglia/microscopic field was calculated manually at 6, 24, and 48 h (supplementary data, Fig. 1). Compared to controls, ODE treated microglia appeared to increase in size with a round center and thick amoeboid processes (arrows) (a’-a’’’’). MA (cytoplasmic NOX-2 inhibitor) successfully reduced ODE-induced changes in microglia (micrometer bar= 50 μm) (b’-b’’’’). The number of microglia was manually counted in five randomly chosen fields, and percent differentiated cells was calculated. Compared to controls, ODE significantly induced morphological signs of differentiation at 24 and 48 h. MA treatment successfully reduced ODE-induced microglial differentiation at 24 and 48 h (c). Microglia were exposed to media or ODE with or without MA and processed for transmission electron microscopy (TEM). Control cells showed mitochondria with normal cristae, electron-dense calcium sequestration bodies, and rough endoplasmic reticulum (RER) (d). Following ODE exposure, mitochondria were hypertrophic with cristolysis, contained larger calcium sequestration bodies, and fragmented RER (e). Compared to vehicle treatment, MA-treatment reduced ODE-induced mitochondrial hypertrophy, cristolysis, larger electron-dense calcium sequestration bodies, and fragmentation of RER at 48 h (f, micrometer bar = 0.5 μm). (n=4, * exposure effect, P < 0.05).
Figure 10. An overview of ODE exposure induced mitochondrial dysfunction in microglia and BSCs.

Mitochondria is a vital organelle of the cell involved in the maintenance and survival of the cell. Thus, ODE induced mitochondrial damage can have different consequences simultaneously. 1) Cytochrome c is a respiratory chain protein loosely associated with the inner membrane of mitochondria. ODE exposure induced mitochondrial damage will result in the release of Cytochrome c into the cellular cytosol and initiation of apoptotic changes inside the cell through activation of Caspase 3 and Caspase 9. 2) Mitochondrial fusion (MFN1/2 mediated) is a form of stress response and is a mechanism for coping with the altered cellular homeostasis. 3) TFAM is a mitochondrial DNA binding protein that aids in the transcription of the mitochondria genome. Damage to mitochondria renders TFAM and mt-DNA vulnerable for release into the cellular cytosol. When in the cytosol, mt-DNA can potentiate an inflammation response through TLR9-NFκB signaling resulting in pro-inflammatory cytokine release or mt-DNA can be sensed by cGAS-STING pathway, ultimately leading to IFN-β production. 4) PINK1 mediated mitophagy is a response often seen in damaged or stressed mitochondria to contain the inflammation. During mitophagy, mitochondria undergo selective degradation to maintain cellular homeostasis. 5) Finally, by targeting mitochondria and preventing it from experiencing damage or stress can help alleviate the inflammation. Use of MA (C2 or C11) reduced mitochondrial fusion, prevented mt-DNA release, downregulated pro-inflammatory cytokines as well as prevented microglial activation and cellular apoptosis. Selective STING DsiRNA knockdown also helped in reducing microglial activation. Both MA (C2 or C211) and STING knockdown downregulated the ODE induced inflammatory and apoptotic markers and promoted the resolution of inflammation.
Table 2.
Symbols (Asterisk or Hashtag) and Corresponding p-Values
| Symbol | p-value |
|---|---|
| * or # | ⩽.05 |
| ** or ## | ⩽.01 |
| *** or ### | ⩽.001 |
| **** or #### | ⩽.0001 |
Results
Endotoxin levels in ODE samples
We report the endotoxin levels from our 1:50 diluted ODE samples (electronic supplementary data, Table). From the six samples, we found that endotoxin values ranged from 4.410±0.7 to 8.052±0.1 EU/mL. We have used sample# 11 (endotoxin level 8.052±0.1 EU/mL) throughout the current experiments.
ODE exposure of microglia induces microscopic and ultrastructural changes indicating mitochondrial and ER damage
Using bright field and transmission electron microscopy (TEM), we assessed the microscopic and ultrastructural changes in microglia following exposure to ODE with or without MA treatment. Compared to controls, ODE exposure of microglia resulted in morphological changes indicated by an increase in size over time (6, 24, and 48 h), and microglia developed an amoeboid body with thick and longer processes (Fig. 1 a-b). A low-magnification view of the morphological changes of the microglial cells is shown (electronic supplementary figure 1). A visual examination of the microglia under a microscope indicated an increase in the number of morphologically differentiated microglia upon ODE treatment as compared to the controls at 24 h and 48 h. MA successfully reduced any effect on morphological signs of microglial differentiation (24 and 48 h) (Fig. 1 c). We also assessed the ultrastructural details of microglia using TEM. ODE treated microglia showed mitochondrial hypertrophy with cristolysis, increased size of calcium sequestering bodies, and fragmented rough endoplasmic reticulum (RER) as compared to microglia treated with vehicle. MA treatment partially reduced ODE induced ultrastructural changes in microglia (Fig. 1 d-f). Since it is difficulty to examine equal number of mitochondria in each group, we did not perform a rigorous quantification of the ultrastructural changes within each mitochondrion.
ODE impairs mitochondrial function
We assessed mitochondrial bioenergetics in microglia exposed to media alone or ODE with or without MA treatment using Seahorse assay. ODE treatment significantly impaired the mitochondrial bioenergetics by decreasing mean OCR, basal respiration, and ATP production. MA treatment rescued the mitochondrial bioenergetics by increasing basal respiration and ATP production (Fig. 2 a-e).
Fig 2. MA reduces ODE induced mitochondrial dysfunction.

Cells were exposed to media and ODE with or without MA and processed for seahorse assay to measure the mitochondrial bioenergetics. Standard mitochondrial stressors (oligomycin 1 μg/mL, FCCP 1 μmol, and antimycin A 10 μmol) were used, and mitochondrial bioenergetics was measured. The chart represents the whole timeline or an overview of the sea horse assay. It depicts when the injections were administered at a particular time after the start of the experiment. It also shows the different phases of respiration during the seahorse assay (a). Time-lapse visualization of change in mitochondrial respiration of microglia exposed to media or ODE and co-treated with either vehicle or MA upon treatment with mitochondrial stressors (b). Compared to control, ODE treated cells showed a decrease in mean oxygen consumption rate (OCR), basal respiration, and ATP production in mitochondria. MA treatment significantly increased the mean OCR, basal respiration, and ATP production of mitochondria when compared to ODE group (c-e), (n=4, * exposure effect, # MA treatment effect, P < 0.05).
ODE upregulates mitochondrial and ER stress responses in activated microglia
Mitochondrial and ER changes were analyzed in microglia after exposure to ODE with or without MA treatment by using qRT-PCR analysis of mitochondrial and ER stress genes. MFN1 mRNA levels increased by 2 folds after 6 h of ODE treatment, whereas MA had no effect on MFN1 expression (Fig. 3 a). MFN2 expression was also upregulated by 3 folds upon ODE treatment at 48 h as compared to controls. In contrast to MFN1, MA treatment significantly decreased the mRNA levels of MFN2 after ODE exposure to the control levels (Fig. 3 b). On the other hand, we did not observe any significant changes in the levels of DRP1 mRNA with ODE exposure with or without MA treatment (Fig. 3 c). PINK1 gene expression significantly increased at 48 h post ODE exposure whereas MA treatment did not change the fold change in the PINK1 expression (Fig. 3 d). Upon ODE exposure, spliced XBP1 mRNA fold changes significantly increased at 48 h as compared to controls, whereas Un-spliced XBP1 mRNA remained unaffected. MA treatment significantly reduced ODE-induced spliced XBP1 mRNA levels (Fig. 3 e-f). ATF4 mRNA levels showed a significant fold change increase upon ODE treatment at 48 h, whereas MA had no effect on ATF4 levels (Fig. 3 g). GRP94 mRNA levels were significantly increased upon ODE treatment at 6 h, and MA treatment had no effect on GRP94 mRNA levels (Fig. 3 h).
Fig 3. ODE induces increased expression of mitochondrial and endoplasmic reticulum stress genes.
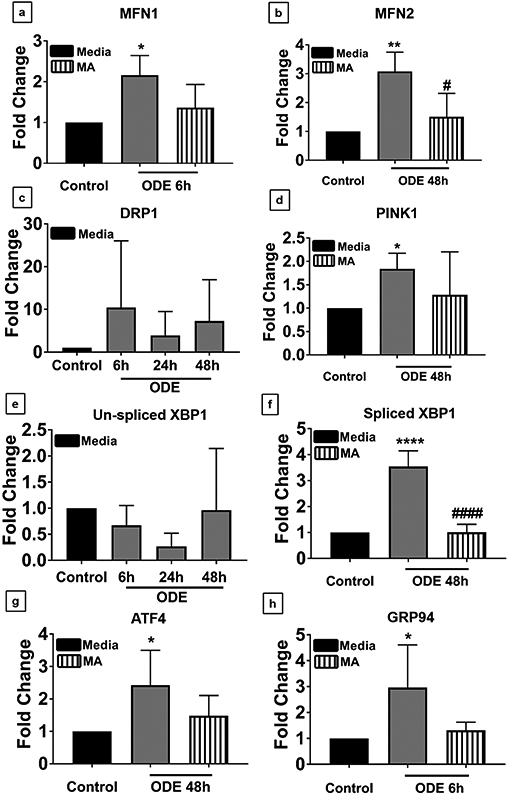
Cells were exposed to media or ODE and co-treated with either vehicle or MA and processed for qRT-PCR analysis. Compared to control, ODE exposed cells showed increased expression of MFN1 at 6 h, and MA treatment had no effect (a). Compared to control, ODE exposed cells showed increased expression of MFN2 at 6 h (data not shown), 24 h (data not shown), and 48 h following ODE treatment. MA significantly reduced MFN2 expression at 6h (data not shown) and 48 h (b). DRP1 expression did not change between control and any of the treatment groups (c). Compared to control, ODE exposed cells showed increased expression of PINK1 at 48 h, and MA treatment had no effect (d). Un-spliced XBP1 expression did not change between control and any of the treatment groups (e). Compared to control, ODE exposed cells showed increased expression of spliced XBP1 gene at 24 (data not shown) and 48 h. MA significantly reduced the expression of spliced XB1 at 48 h (f). Compared to controls, ODE exposed cells showed increased ATF4 gene expression at 6 h (data not shown) and 48 h. MA treatment did not affect ATF4 expression (g). Compared to controls, ODE exposed cells showed increased GRP94 gene expression at 6 h. MA treatment did not affect (h). (n=3 in duplicates * exposure effect, # MA treatment effect, P < 0.05).
ODE induces mt-DNA and TFAM release into cytosol
Mitochondria free cytosolic fractions were prepared from microglia exposed to ODE with or without MA treatment. Upon western blot analysis, TFAM was found in the cytoplasm of microglia after 48 h post-treatment, and MA treatment did not reduce the release of TFAM from mitochondria (Fig. 4 a-b). Next, to rule out ODE as the external source of mt-DNA in our samples, we performed a qRT-PCR on ODE samples treated with DNase (negative control) or without DNase. Compared to the cytosol of control microglia, ODE contained significantly lower levels of mt-DNA (Fig. 4 c). Finally, the mt-DNA levels in the cytosol of ODE treated microglia were analyzed at 6, 24 and 48 (electronic supplementary data) and found to be elevated at 24 h post ODE exposure. In order to narrow our focus and more precisely isolate the time of mt-DNA release, we also analyzed an intermediary time point (12 h) between 6 and 24 h. Interestingly, cytosolic mt-DNA levels were also found to be significantly elevated at 12 h post-treatment as compared to control. MA significantly reduced the levels of mt-DNA in the cytosol at 12 h (Fig. 4 d).
Fig 4. ODE induces the release of TFAM and mitochondrial DNA into the cytosol of microglia.
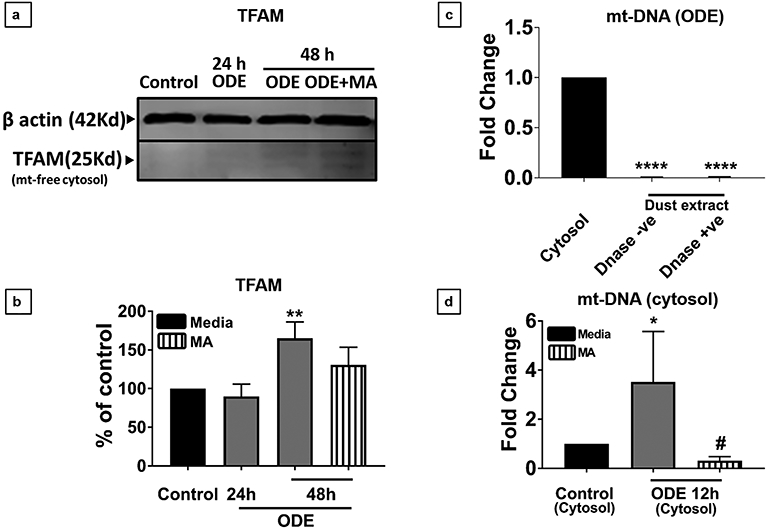
Cells were exposed to media or ODE with or without MA and processed for Western blot analysis. Normalized (β-actin, loading control) bands of TFAM were processed for densitometry (ImageJ, NIH), and statistical analysis was performed. Compared to controls, ODE exposure significantly increased the TFAM levels at 48 h, and MA treatment had no effect (a-b). Mitochondria-free cellular cytosolic fraction and ODE treated with (negative control) or without DNase were processed for DNA extraction. mt-DNA specific primers were used for qRT-PCR analysis. ODE samples treated with and without DNase confirmed that there was no background mitochondrial DNA in the ODE samples (c). Microglia treated with medium, ODE with or without mitoapocynin (C2) were processed to extract mitochondria-free cytosolic fraction, and mt-DNA content was quantified using qRT-PCR. ODE treated microglia contained significantly higher amounts of mt-DNA in the mitochondria free cytosolic fraction at 12 h, and MA treatment significantly reduced the ODE induced mt-DNA release (d). (n=4, * exposure effect, # MA treatment effect and p < 0.05).
ODE activates the cGAS-STING pathway
Cultured microglia exposed to ODE with or without MA treatment were processed for qRT-PCR and western blot for analyzing gene and protein expression respectively. We included a 12 h time point because previously, we have found that the levels of mt-DNA were elevated as early as 12 h after ODE exposure. Upon ODE treatment, we observed an elevated mRNA levels of cGAS (12 h), STING (24 h), IRF3 (24 h), and IFN-β (24 h). MA was only able to reduce the mRNA levels of cGAS and STING following ODE treatment (Fig. 5 a-b). Both cGAS and IFN-β protein levels were also found to be upregulated at 24 h and 48 h after ODE treatment, and MA did not affect cGAS and IFN-β protein levels at any given time point (Fig. 5 e-h).
Fig 5. ODE exposure upregulates cGAS, STING, IRF3, and IFN-β expression in microglia.
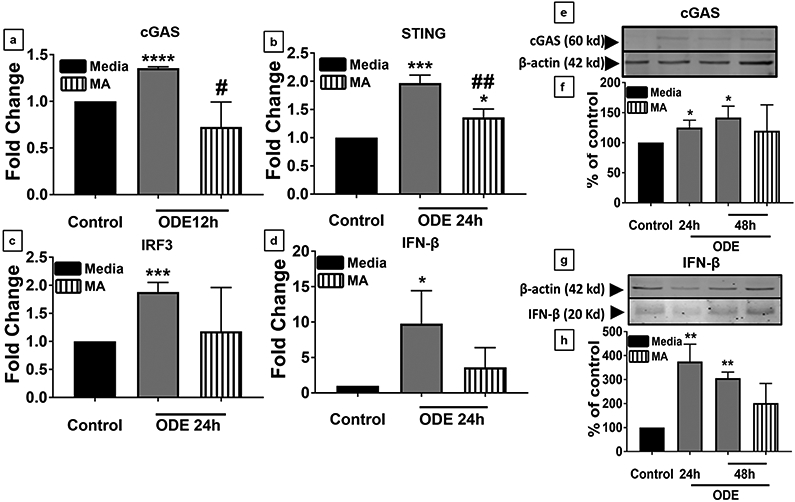
Microglia were exposed to media or ODE (12 h, 24 h, and 48 h) and co-treated with either vehicle or MA (48 h) and processed to quantify mRNA (a-d) or protein levels (e-h). cGAS, STING, IRF3, and IFN-β specific primers were used to quantify mRNA (2−ΔΔCt method) and compared to controls, cGAS (12 h), STING (24 h), IRF3 (24 h) and IFN-β (24 h) mRNA levels increased. In contrast, MA treatment significantly decreased cGAS and STING expression and did not change the IRF3 (c) and IFN-β (c) mRNA levels. cGAS (e), IFN-β (g) and β-actin antibodies (house-keeping protein) detected 60 kD, 20 kD, and 42 kD bands, respectively. Densitometry of normalized bands showed that, compared to controls, ODE exposure increased the cGAS (f) and IFN-β (h) levels at 24 and 48 h, and MA treatment had no effect (n=3, * exposure effect, # MA treatment effect, P < 0.05).
Role of cGAS-STING pathway in microglial activation
Successful transfection of anti-STING siRNAs into microglia was confirmed by using a fluorescently tagged DsiRNA (DsiRNA TYE 563) at 10 nmol concentration after 24 h incubation (Fig. 6 a). After establishing optimal conditions for transfection, microglia were incubated with R1, R2, or R3 (three different siRNAs against STING) at 10 nmol for 24 h concentration and exposed to either media (control) or ODE for 48 h. A negative control group (NC) microglia received scrambled DsiRNA (10 nmol for 24 h) and did not show any change in the expression of STING mRNA (data not shown). R1, R2, and R3 siRNAs successfully reduced the STING mRNA levels in ODE exposed microglia to the level of the control group (Fig. 6 b). Furthermore, IRF3 and IFN-β mRNA levels were also downregulated in ODE treated microglia to the level of control following treatment with R1, R2, or R3 (Fig. 6 c-d). After confirming an effective knockdown of STING and downregulation of IRF3 and IFN-β, we analyzed the expression of IBA-1 protein (microglial activation marker) in microglia. Our result indicated that transfection with R2 and R3 significantly reduced ODE-induced IBA-1 protein expression in microglia (Fig. 6 e-f).
Fig 6. STING knockout with siRNA downregulates STING, IRF3, IFN-β, and IBA1 expression.

Microglia were treated with DsiRNAs TYE 563 (transfection control, Cy3) or anti-STING siRNAs (R1, R2, R3) A scrambled siRNA was also used as a negative control (NC). Following treatment, cells were either fixed with paraformaldehyde (a) or processed for qRT-PCR analysis (b-d) or processed for western blot analysis (e-f). After 24 h, immunofluorescence (cy3, red) shows a successful transfection (white arrows and inset) (a) in the cytoplasm of microglia, and the nucleus is stained with DAPI (blue). Following qRT-PCR analysis, R1 (10 nmol), R2 (10 nmol), and R3 (10 nmol) significantly reduced the mRNA expression of STING (b), IRF-3 (c), and IFN-β (d) mRNAs at 24 h. Following the siRNA-mediated knockdown of STING mRNA, IBA-1 and β-actin (house-keeping protein) were detected in ODE treated (24 h) microglia at 13 kD and 42 kD bands, respectively (e). Normalized densitometry values show that, compared to ODE treated cells either with or without negative control siRNA (NC), anti-STING siRNA treatment (R2 and R3) reduced the IBA 1 protein levels at 24 h (f). (n=4, * exposure effect, # siRNA treatment effect, P < 0.05).
ODE induces microglial activation in brain slice cultures (BSCs)
Compared to controls, ODE-treated BSCs showed increased IBA-1 and decreased NeuN expression in the olfactory bulb, frontal cortex, corpus callosum, and visual cortex in the BSCs. MA(C11) treatment appeared to have no effect on either IBA-1 or NeuN staining (Fig. 7 a-c). Following qRT-PCR analysis, expression of pro-inflammatory cytokines such as TNF-α and IL-6 were significantly elevated after 5-day ODE treatment of BSCs when compared to control. MA(C11) treatment significantly reduced both TNF-α and IL-6 expression in ODE treated BSCs (Fig. 7 d).
Fig 7. Organic dust extract (ODE)-exposure induces microglial activation and pro-inflammatory cytokines gene expression in organotypic brain slice culture (BSCs).

BSCs were exposed to media (control) or ODE (5 days) followed by either vehicle or MA(C11) treatment and were stained with anti-NeuN (arrow head; neuronal marker; Cy3, red), anti-Iba1 (arrow; microglial activation marker; FITC, green) antibodies (a-c) or processed for qRT-PCR analysis (d). Compared to control (a), ODE-exposed BSCs showed higher amounts of Iba-1 staining in the olfactory bulb, frontal cortex, corpus callosum, and visual cortex of the brain (b). MA(C11) treatment had no effect on ODE induced microglial activation (c). Compared to medium, ODE-exposed BSCs showed an upregulation of TNF-α and IL-6 gene expression. MA(C11) treatment decreased the gene expression of TNF-α and IL-6 (d). (n=3, * exposure effect, # MA(C11) treatment effect, P < 0.05, micrometer bar = 100 μm).
ODE induces apoptosis in BSCs
Fluorescent TUNEL staining revealed that compared to control, ODE treated BSCs had a significantly higher number of degenerating or dead cells in the olfactory bulb, frontal cortex, corpus callosum and visual cortex. MA(C11) significantly reduced the number of TUNEL positive cells in the olfactory bulb, frontal cortex, corpus callosum and visual cortex when compared to ODE treated BSCs (Fig. 8 a-d). MA(C11) treated BSCs still had significantly higher number of degenerating or dead neurons when compared to controls in olfactory bulb, corpus callosum and visual cortex but not in the frontal cortex (Fig. 8 a-d).
Fig 8. Organic dust extract (ODE)-exposure induces neurodegeneration in BSCs.

BSCs were exposed to media (control) or ODE (5 days) and co-treated with either vehicle or MA (C11). BSCs were labeled with dUTP-FITC (arrow head; apoptosis marker, FITC, green), and nucleus stained with DAPI (arrow; blue) (a-c). The total number of cells (DAPI, blue) and TUNEL positive cells (FITC, green) per field (20X) were counted in a total of five random fields. Compared to control, ODE-exposed BSCs showed a higher number of TUNEL positive cells in the olfactory bulb, frontal cortex, corpus callosum and visual cortex of the brain. MA(C11) significantly reduced the number of TUNEL positive cells in the olfactory bulb, frontal cortex, corpus callosum and visual cortex (d). (n=3, * exposure effect, # MA(C11) treatment effect, P < 0.05, micrometer bar = 100 μm).
ODE induces expression of mitochondrial stress genes and release of mt-DNA into the cytoplasm in BSCs
Following 5-day treatment of BSCs with either media alone (control) or ODE with or without MA(C11), gene expression of MFN1, MFN2, DRP1, and PINK1 was analyzed. Compared to control, only MFN1 gene expression was found to be elevated in BSCs but not the MFN2, DRP1 and PINK1. MA(C11) significantly reduced the MFN1 gene expression in ODE treated BSCs (Fig. 9 a). Also, mt-DNA levels were elevated in the mt-free cytosolic fractions of cells extracted from the ODE treated BSCs as compared to control BSCs. MA(C11) significantly reduced the levels of mt-DNA in the mt-free cytosol (Fig. 9 b). However, no significant amounts of mt-DNA were found in the culture media of both control and ODE treated BSCs (Fig. 9 c).
Figure 9. ODE exposure of organotypic brain slice culture activates mitochondrial stress response and induces the release of mt-DNA into the cytosol.

BSCs were exposed to media or ODE (5 days) and co-treated with either vehicle or MA(C11). DNA extracted from the whole cell (a), mt-free cell cytosol (b), and supernatant (c) was processed for mt-DNA specific qRT-PCR analysis. Compared to medium, ODE-exposed brain slices showed an upregulation of MFN1 but not MFN2, DRP1, and PINK1. MA(C11) significantly decreased the MFN1 expression (a). Compared to control (vehicle), ODE induced a significant increase in the cytosolic mt-DNA fraction in BSCs. MA(C11) treatment significantly reduced cytosolic mt-DNA release in the cytosol (b). ODE exposed BSCs did not show any significant rise in mitochondrial DNA in supernatant (secreted) at 5 days post-treatment (c) (n=3, * exposure effect, # MA(C11) treatment effect, P < 0.05).
Discussion
Increasing incidences of neurocognitive disorders such as Parkinson's disease among the agricultural communities in the Midwestern and northeastern parts of the USA has been reported (Wright Willis, et al., 2010b). The fact that the same area is known for a higher density of animal production facilities indicates a causal link between the agriculture exposures such as OD and incidences of Parkinson's disease. We recently published a manuscript showing that exposure to organic dust extract (ODE) activates microglia of the brain. This will lead to neuroinflammation and supports our overarching hypothesis that OD if inhaled could induce neuroinflammation. Further, our data supported that mitochondria are involved in RNS production. Following treatment with MA (mitochondria targeted apocynin and a cytoplasmic NOX-2 inhibitor), we were able to reduce the inflammatory signals, and MA exposure also reduced the microglial activation (Massey, et al., 2019a). These pieces of evidence formed the basis for the current work that examined the impact of OD exposure on mitochondrial structure and function. In this manuscript, we investigated the role of mitochondria in the underlying mechanisms of ODE induced microglial activation and inflammation.
The ODE exposure induced structural changes in the microglia (large amoeboid appearance and thicker branching) indicated their innate response to danger signals. Next, ultrastructural alterations within the mitochondria revealed cristolysis, mitochondrial swelling, fusion, and increased size of structures resembling calcium sequestering bodies. We also noticed fragmentation and swelling of ER, increased expression of ER stress markers such as spliced XB1, ATF4 and GRP4 in microglia after ODE exposure. These findings attested that ODE treatment was inducing mitochondrial and ER stress responses in microglia. Interestingly, ODE treatment also induced mitochondrial bioenergetics deficiencies in agreement with the ultrastructural damages to the mitochondria. ODE-induced upregulation of mitochondrial fusion genes (MFN1/MFN2) and PINK1 (mitophagy related marker) in microglia indicated mitochondrial stress in ODE treated groups. Treatment with MA abrogated many of the ODE-induced damages at the gross, ultrastructural, functional (bioenergetics) and ER level indicating that OD-induced mitochondrial and ER damages could be abrogated by using a mitochondria targeting apocynin that has a cytoplasmic NOX-2 activity. Our data are in agreement with others who have shown how cigarette smoke exposure impairs the mitochondrial structure and function in airway epithelial cells (Hoffmann, et al., 2013).
The ODE exposure induced cellular stress was characterized by an increase in mt-ROS and SOD-2 production (supplementary data) as well as mitochondrial stress. Further, we documented an increase in the calcium uptake by mitochondria (electronic supplementary data). The increased calcium uptake by the mitochondria is known to alter the mitochondrial membrane permeability that could lead to apoptotic changes in the cells. MA treatment did not reduce the ODE induced mt-ROS production, mitochondrial permeability and mitochondrial calcium uptake indicating that these changes are independent of cytoplasmic NOX-2 inhibition (Langley, Ghosh, Charli, Sarkar, Ay, Luo, Zielonka, Brenza, Bennett, Jin, Ghaisas, Schlichtmann, Kim, Anantharam, Kanthasamy, Narasimhan, Kalyanaraman and Kanthasamy, 2017b).
ODE-exposure induced an increase in (TUNEL-positive) apoptotic cells indicating that the response to exposure could be protective since the apoptosis is a form of cell death that aims to contain the cell contents (such as DAMPs) in order to keep the inflammation in the check (Kolb, et al., 2017). We detected cytochrome c in the extra-mitochondrial cellular cytosol along with an increase in caspase 3 and caspase 9 levels indicating that prevention of cytochrome c release would be an attractive therapeutic target (Oliva, et al., 2016) to curtail ODE exposure induced apoptosis (electronic supplementary data). ODE exposure induced release of cytochrome c and mt-DNA into the cytosol indicates mitochondrial injury whereas ODE exposure induced apoptosis (TUNEL-positive cells) could be protective. These two seemingly opposite effects may happen as injury and compensatory effects are part of the body’s innate responses. Surprisingly, MA treatment reduced the ODE-induced increase in caspase-3 and 9 without an effect on the release of cytochrome c from the mitochondria (electronic supplementary data). These results indicate that MA treatment may induce anti-inflammatory effects at multiple levels in the signaling pathway.
Our study examined the role of mt-DNA as a DAMP following exposure to ODE. It is known that the mt-DNA resides within the mitochondrial matrix and when it is in the cytoplasm or extracellular space, it is being identified as a danger signal by the host immune system (Nakayama and Otsu, 2018). Despite coding for very few mitochondrial genes, mt-DNA is important for oxidative phosphorylation (OXPHOS) and loss of mt-DNA is linked to several neurodegenerative diseases (Area-Gomez, et al., 2019). Before examining if ODE-exposure would lead to mt-DNA release or damage to the mt-DNA, we ensured that ODE samples used in our studies did not contain any (prokaryotic or eukaryotic) DNA by using DNase treatment. ODE exposure of microglia resulted in the release of mt-DNA into the mt-free cellular cytosolic fraction and MA treatment significantly reduced the release of mt-DNA. These results confirm that inhibition of cytoplasmic NOX-2 using MA could halt the process of ODE-exposure induced release of mt-DNA. Though our study does not address mechanistic details of how ODE exposure leads to mt-DNA release, it does prove that cytoplasmic NOX-2 inhibition reduces ODE-induced mt-DNA release. Surprisingly, following ODE exposure, we were not able to detect mtDNA in the cell culture supernatant using the RT PCR technique. This could be possibly due to dilution effect or degradation of mtDNA in the cell culture supernatant samples.
The significance of ODE-exposure induced mt-DNA release is that, mt-DNA is very similar to a prokaryotic DNA in origin, and hence the immune system responds to the mt-DNA as if it is a foreign DNA through intracellular DNA sensing receptors such as TLR9 and cGAS molecules (Nakayama and Otsu, 2018). Toll-like receptor 9 has a specific affinity for unmethylated cytosine and guanine nucleotides separated by a phosphate-backbone (CpG), which are common to prokaryotic DNA and this specificity is essential for preventing TLR9-dependent autoimmunity. mt-DNA also contains unmethylated CpG dinucleotides and TLR9 signaling can ultimately result in the activation of NF-κB and cytokine secretion (McCarthy, et al., 2015). ODE exposure of microglia increased the TLR9 expression and MA treatment reduced the TLR9 protein levels but not the tlr9 gene expression (electronic supplementary data).
cGAS is a cytosolic sensor of foreign DNA that activates STING leading to IFN-β production (Motwani, Pesiridis and Fitzgerald, 2019). Therefore, we probed whether mt-DNA released into the cytosol will activate cGAS-STING pathway. ODE exposure increased the expression of cGAS, STING as well as the downstream molecules IRF-3 and IFN-β indicating that mt-DNA in the cytosol initiates a specific host response similar to a foreign DNA encounter. MA treatment reduced the expression of cGAS and STING but not the IRF3 and IFN-β levels. Activated cGAS produces cGAMP, which binds to STING and STING resides in the ER. STING can further relay signals downstream to IRF3, ultimately leading to IFN-β production. Upon ODE exposure of microglia, we observed significant upregulation of the mRNA and protein molecules of the cGAS-STING pathway. MA significantly reduced the upregulation of the cGAS and STING mRNAs (Motwani, Pesiridis and Fitzgerald, 2019). When we performed a specific knockdown of STING by using DsiRNA, all the three siRNAs (R1, R2 and R3) significantly reduced the IRF3 and IFN-β production. However, only R2 and R3 but not R1 siRNA treated cells showed a reduction in microglial activation as indicated by a reduced expression of IBA1. This observation indicates that microglia activation could be induced independent of cGAS-STING pathway activation. Next, we found that MA treatment produced promising results in curtailing mt-DNA release and its downstream signaling via TLR9 and cGAS-STING. Loss of mt-DNA from the mitochondrial matrix is a significant event as it compromises OXPHOS reactions and feeds into ODE-induced inflammation. This supports our hypothesis that OD-induced mitochondrial DNA release drives the neuroinflammation and mitochondria could serve as a crucial target to reduce ODE-induced neuroinflammatory responses in microglia.
In order to predict how ODE-exposure induced microglial activation will induce neuroinflammatory changes in the brain, we used mouse organotypic BSCs as a physiologically relevant ex vivo model. ODE exposure of BSCs resulted in the activation of microglia and the production of pro-inflammatory mediators such as TNF-α and IL-6. MA(C11) but not MA(C2) was effective in abrogating the ODE-induced expression of TNF-α and IL-6. These results suggested that MA(C11) is effective in in vivo models and is far superior when compared to MA(C2) which is suitable for in vitro models.
Similar to mouse microglia, ODE exposure of BSCs upregulated the IBA1 expression, pro-inflammatory cytokine production and induced TUNEL positive apoptotic cells in different regions of BSCs. Further, ODE exposure of BSCs upregulated the expression of MFN1 (mitochondrial fusion protein), lead to release of mt-DNA into cytosol but not into the supernatant. Interestingly, MA(C11) was also able to reduce the ODE-exposure induced pro-inflammatory cytokine expression, MFN1 expression, and mt-DNA levels in cytosol to indicate that ODE-exposure induced mitochondrial dysfunction is a possible therapeutic target to treat neurodegenerative changes. In our study, we did not address the role of NLRP3 in mt-DNA induced signaling as well as the motor or neurobehavioral impact of loss of neuronal cells (TUNEL-positive) in certain regions of the brain (BSC model). Despite these deficiencies, our study provides a mechanistic evidence that ODE-exposure leads to mitochondrial dysfunction and targeting mitochondria would lead to therapeutic benefits. The future studies addressing the behavioral, motor and sensory impacts of ODE-exposure in animal models would be highly valuable.
Conclusions
In conclusion, ODE-exposure activates microglial cells of the brain, induces mitochondrial and ER stress and inflammation characterized by the loss of cells in the brain. Exposure leads to mitochondrial dysfunction as indicated by the expression of specific stress markers, structural and functional deficits, mt-DNA release and signaling. Use of mitochondria targeted pharmacological agent (MA) that inhibits cytoplasmic NOX-2 or siRNA mediated knockdown of STING suppresses the mt-DNA induced signaling. Both MA and STING appear promising in preventing ODE-exposure induced brain microglial inflammatory response (Fig. 10).
Supplementary Material
Acknowledgment
We thank Dr. T. Thippeswamy’s laboratory (Biomedical Sciences) for providing access to facilities and Ms. Catharine A. Martens of Biomedical Sciences department for technical assistance. We also thank the department of Biomedical Sciences for providing access to the core laboratory.
Funding
C.C. laboratory is funded through startup grant through Iowa State University and a pilot grant (5 U54 OH007548) from the CDC-NIOSH (Centers for Disease Control and Prevention-The National Institute for Occupational Safety and Health). A.G.K. laboratory is supported by the National Institutes of Health grants (ES026892, ES027245 and NS100090).
Footnotes
Conflicts of interest/Competing interests
AGK has an equity interest in PK Biosciences Corporation located in Ames, IA.
The terms of this arrangement have been reviewed and approved by Iowa State University per its conflict of interest policies. All other authors have declared no potential conflicts of interest.
Ethics approval
All the studies included in this manuscript were conducted with approval from the Iowa State University’s Institutional Biosafety Committee (IBC, protocol # 19-004) and Institutional Animal Care and Use Committee (IACUC protocol # 18-290 and 18-227).
Consent to participate
Not applicable. This manuscript does not contain any studies with human subjects or human specimens.
References
- American Thoracic Society (1998) Respiratory health hazards in agriculture. Am J Respir Crit Care Med, vol 158, pp S1–S76 [DOI] [PubMed] [Google Scholar]
- Anantharam V, Kaul S, Song C, Kanthasamy A, Kanthasamy AG (2007) Pharmacological inhibition of neuronal NADPH oxidase protects against 1-methyl-4-phenylpyridinium (MPP+)-induced oxidative stress and apoptosis in mesencephalic dopaminergic neuronal cells. Neurotoxicology 28:988–997 [DOI] [PMC free article] [PubMed] [Google Scholar]
- Area-Gomez E, Guardia-Laguarta C, Schon EA, Przedborski S (2019) Mitochondria, OxPhos, and neurodegeneration: cells are not just running out of gas. The Journal of Clinical Investigation 129:34–45 [DOI] [PMC free article] [PubMed] [Google Scholar]
- Bhat SM, Massey N, Karriker LA, Singh B, Charavaryamath C (2019) Ethyl pyruvate reduces organic dust-induced airway inflammation by targeting HMGB1-RAGE signaling. Respir Res 20:27. [DOI] [PMC free article] [PubMed] [Google Scholar]
- Block ML, Zecca L, Hong JS (2007) Microglia-mediated neurotoxicity: uncovering the molecular mechanisms. Nat Rev Neurosci 8: [DOI] [PubMed] [Google Scholar]
- Boissy RJ, Romberger DJ, Roughead WA, Weissenburger-Moser L, Poole JA, LeVan TD (2014) Shotgun pyrosequencing metagenomic analyses of dusts from swine confinement and grain facilities. PLoS One 9:e95578. [DOI] [PMC free article] [PubMed] [Google Scholar]
- Bønløkke JH, Duchaine C, Schlünssen V, Sigsgaard T, Veillette M, Basinas I (2019) Archaea and Bacteria Exposure in Danish Livestock Farmers. Ann Work Expo Health 63:965–974 [DOI] [PMC free article] [PubMed] [Google Scholar]
- Bronner DN, O’Riordan MX (2016) Measurement of Mitochondrial DNA Release in Response to ER Stress. Bio-protocol 6:e1839. [DOI] [PMC free article] [PubMed] [Google Scholar]
- Chan DC (2006) Mitochondria: Dynamic Organelles in Disease, Aging, and Development. Cell 125:1241–1252 [DOI] [PubMed] [Google Scholar]
- Charavaryamath C, Janardhan KS, Townsend HG, Willson P, Singh B (2005) Multiple exposures to swine barn air induce lung inflammation and airway hyper-responsiveness. Respir Res 6:50. [DOI] [PMC free article] [PubMed] [Google Scholar]
- Charavaryamath C, Juneau V, Suri SS, Janardhan KS, Townsend H, Singh B (2008) Role of Toll-like receptor 4 in lung inflammation following exposure to swine barn air. Exp Lung Res 34:19–35 [DOI] [PubMed] [Google Scholar]
- Charavaryamath C, Singh B (2006) Pulmonary effects of exposure to pig barn air. J Occup Med Toxicol 1:10. [DOI] [PMC free article] [PubMed] [Google Scholar]
- Crews F, Vetreno R (2015) Mechanisms of neuroimmune gene induction in alcoholism. Psychopharmacology 233: [DOI] [PMC free article] [PubMed] [Google Scholar]
- Cristóvão AC, Choi D-H, Baltazar G, Beal MF, Kim Y-S (2009) The role of NADPH oxidase 1-derived reactive oxygen species in paraquat-mediated dopaminergic cell death. Antioxidants & redox signaling 11:2105–2118 [DOI] [PMC free article] [PubMed] [Google Scholar]
- Croft CL, Noble W (2018) Preparation of organotypic brain slice cultures for the study of Alzheimer's disease. F1000Research 7:592. [DOI] [PMC free article] [PubMed] [Google Scholar]
- Dranka BP, Benavides GA, Diers AR, Giordano S, Zelickson BR, Reily C, Zou L, Chatham JC, Hill BG, Zhang J, Landar A, Darley-Usmar VM (2011) Assessing bioenergetic function in response to oxidative stress by metabolic profiling. Free Radical Biol Med 51:1621–1635 [DOI] [PMC free article] [PubMed] [Google Scholar]
- Dranka BP, Gifford A, McAllister D, Zielonka J, Joseph J, O'Hara CL, Stucky CL, Kanthasamy AG, Kalyanaraman B (2014) A novel mitochondrially-targeted apocynin derivative prevents hyposmia and loss of motor function in the leucine-rich repeat kinase 2 (LRRK2(R1441G)) transgenic mouse model of Parkinson's disease. Neurosci Lett 583:159–164 [DOI] [PMC free article] [PubMed] [Google Scholar]
- Escames G, López LC, García JA, García-Corzo L, Ortiz F, Acuña-Castroviejo D (2012) Mitochondrial DNA and inflammatory diseases. Hum Genet 131:161–173 [DOI] [PubMed] [Google Scholar]
- Gao H-M, Liu B, Hong J-S (2003) Critical role for microglial NADPH oxidase in rotenone-induced degeneration of dopaminergic neurons. The Journal of neuroscience : the official journal of the Society for Neuroscience 23:6181–6187 [DOI] [PMC free article] [PubMed] [Google Scholar]
- Ghosh A, Langley MR, Harischandra DS, Neal ML, Jin H, Anantharam V, Joseph J, Brenza T, Narasimhan B, Kanthasamy A, Kalyanaraman B, Kanthasamy AG (2016) Mitoapocynin Treatment Protects Against Neuroinflammation and Dopaminergic Neurodegeneration in a Preclinical Animal Model of Parkinson's Disease. Journal of neuroimmune pharmacology : the official journal of the Society on NeuroImmune Pharmacology 11:259–278 [DOI] [PMC free article] [PubMed] [Google Scholar]
- Halle A, Hornung V, Petzold GC, Stewart CR, Monks BG, Reinheckel T, Fitzgerald KA, Latz E, Moore KJ, Golenbock DT (2008) The NALP3 inflammasome is involved in the innate immune response to amyloid-[beta]. Nat Immunol 9:857–865 [DOI] [PMC free article] [PubMed] [Google Scholar]
- Hinwood M, Morandini J, Day TA, Walker FR (2012) Evidence that Microglia Mediate the Neurobiological Effects of Chronic Psychological Stress on the Medial Prefrontal Cortex. Cereb Cortex 22:1442–1454 [DOI] [PubMed] [Google Scholar]
- Hoffmann RF, Zarrintan S, Brandenburg SM, Kol A, de Bruin HG, Jafari S, Dijk F, Kalicharan D, Kelders M, Gosker HR, Ten Hacken NH, van der Want JJ, van Oosterhout AJ, Heijink IH (2013) Prolonged cigarette smoke exposure alters mitochondrial structure and function in airway epithelial cells. Respir Res 14:97. [DOI] [PMC free article] [PubMed] [Google Scholar]
- Iowa State University and University of Iowa (2002) IOWA CONCENTRATED ANIMAL FEEDING OPERATIONS AIR QUALITY STUDY. Final Report., vol 2018. Iowa State University and University of Iowa, Iowa [Google Scholar]
- Jin H, Kanthasamy A, Ghosh A, Anantharam V, Kalyanaraman B, Kanthasamy AG (2014) Mitochondria-targeted antioxidants for treatment of Parkinson's disease: preclinical and clinical outcomes. Biochim Biophys Acta 1842:1282–1294 [DOI] [PMC free article] [PubMed] [Google Scholar]
- Johnson AN, Harkema JR, Nelson AJ, Dickinson JD, Kalil J, Duryee MJ, Thiele GM, Kumar B, Singh AB, Gaurav R, Glover SC, Tang Y, Romberger DJ, Kielian T, Poole JA (2020) MyD88 regulates a prolonged adaptation response to environmental dust exposure-induced lung disease. Respir Res 21:97. [DOI] [PMC free article] [PubMed] [Google Scholar]
- Johri A, Beal MF (2012) Mitochondrial dysfunction in neurodegenerative diseases. The Journal of pharmacology and experimental therapeutics 342:619–630 [DOI] [PMC free article] [PubMed] [Google Scholar]
- Knoell DL, Smith DA, Sapkota M, Heires AJ, Hanson CK, Smith LM, Poole JA, Wyatt TA, Romberger DJ (2019) Insufficient zinc intake enhances lung inflammation in response to agricultural organic dust exposure. J Nutr Biochem 70:56–64 [DOI] [PMC free article] [PubMed] [Google Scholar]
- Kolb JP, Oguin TH 3rd, Oberst A, Martinez J (2017) Programmed Cell Death and Inflammation: Winter Is Coming. Trends Immunol 38:705–718 [DOI] [PMC free article] [PubMed] [Google Scholar]
- Kondru N, Manne S, Greenlee J, West Greenlee H, Anantharam V, Halbur P, Kanthasamy A, Kanthasamy A (2017) Integrated Organotypic Slice Cultures and RT-QuIC (OSCAR) Assay: Implications for Translational Discovery in Protein Misfolding Diseases. Sci Rep 7:43155. [DOI] [PMC free article] [PubMed] [Google Scholar]
- Langley M, Ghosh A, Charli A, Sarkar S, Ay M, Luo J, Zielonka J, Brenza T, Bennett B, Jin H, Ghaisas S, Schlichtmann B, Kim D, Anantharam V, Kanthasamy A, Narasimhan B, Kalyanaraman B, Kanthasamy AG (2017a) Mito-Apocynin Prevents Mitochondrial Dysfunction, Microglial Activation, Oxidative Damage, and Progressive Neurodegeneration in MitoPark Transgenic Mice. Antioxid Redox Signal 27:1048–1066 [DOI] [PMC free article] [PubMed] [Google Scholar]
- Langley M, Ghosh A, Charli A, Sarkar S, Ay M, Luo J, Zielonka J, Brenza T, Bennett B, Jin H, Ghaisas S, Schlichtmann B, Kim D, Anantharam V, Kanthasamy A, Narasimhan B, Kalyanaraman B, Kanthasamy AG (2017b) Mito-Apocynin Prevents Mitochondrial Dysfunction, Microglial Activation, Oxidative Damage, and Progressive Neurodegeneration in MitoPark Transgenic Mice. Antioxidants & Redox Signaling 27:1048–1066 [DOI] [PMC free article] [PubMed] [Google Scholar]
- Lin MT, Beal MF (2006) Mitochondrial dysfunction and oxidative stress in neurodegenerative diseases. Nature 443:787–795 [DOI] [PubMed] [Google Scholar]
- Maekawa H, Inoue T, Ouchi H, Jao T-M, Inoue R, Nishi H, Fujii R, Ishidate F, Tanaka T, Tanaka Y, Hirokawa N, Nangaku M, Inagi R (2019) Mitochondrial Damage Causes Inflammation via cGAS-STING Signaling in Acute Kidney Injury. Cell reports 29:1261–1273.e1266 [DOI] [PubMed] [Google Scholar]
- Marzec M, Eletto D, Argon Y (2012) GRP94: An HSP90-like protein specialized for protein folding and quality control in the endoplasmic reticulum. Biochim Biophys Acta 1823:774–787 [DOI] [PMC free article] [PubMed] [Google Scholar]
- Massey N, Puttachary S, Bhat SM, Kanthasamy AG, Charavaryamath C (2019a) HMGB1-RAGE Signaling Plays a Role in Organic Dust-Induced Microglial Activation and Neuroinflammation. Toxicol Sci 169:579–592 [DOI] [PMC free article] [PubMed] [Google Scholar]
- Massey N, Puttachary S, Mahadev-Bhat S, Kanthasamy AG, Charavaryamath C (2019b) HMGB1-RAGE Signaling Plays a Role in Organic Dust-Induced Microglial Activation and Neuroinflammation. Toxicol Sci [DOI] [PMC free article] [PubMed] [Google Scholar]
- McCarthy CG, Wenceslau CF, Goulopoulou S, Ogbi S, Baban B, Sullivan JC, Matsumoto T, Webb RC (2015) Circulating mitochondrial DNA and Toll-like receptor 9 are associated with vascular dysfunction in spontaneously hypertensive rats. Cardiovasc Res 107:119–130 [DOI] [PMC free article] [PubMed] [Google Scholar]
- Missiroli S, Genovese I, Perrone M, Vezzani B, Vitto VAM, Giorgi C (2020) The Role of Mitochondria in Inflammation: From Cancer to Neurodegenerative Disorders. Journal of clinical medicine 9: [DOI] [PMC free article] [PubMed] [Google Scholar]
- Motwani M, Pesiridis S, Fitzgerald KA (2019) DNA sensing by the cGAS–STING pathway in health and disease. Nat Rev Genet 20:657–674 [DOI] [PubMed] [Google Scholar]
- Nakayama H, Otsu K (2018) Mitochondrial DNA as an inflammatory mediator in cardiovascular diseases. The Biochemical journal 475:839–852 [DOI] [PMC free article] [PubMed] [Google Scholar]
- Nath Neerukonda S, Mahadev-Bhat S, Aylward B, Johnson C, Charavaryamath C, Arsenault RJ (2018) Kinome analyses of inflammatory responses to swine barn dust extract in human bronchial epithelial and monocyte cell lines. Innate Immun 24:366–381 [DOI] [PMC free article] [PubMed] [Google Scholar]
- Nordgren TM, Charavaryamath C (2018) Agriculture Occupational Exposures and Factors Affecting Health Effects. Curr Allergy Asthma Rep 18:65. [DOI] [PMC free article] [PubMed] [Google Scholar]
- Oliva CR, Markert T, Ross LJ, White EL, Rasmussen L, Zhang W, Everts M, Moellering DR, Bailey SM, Suto MJ, Griguer CE (2016) Identification of Small Molecule Inhibitors of Human Cytochrome c Oxidase That Target Chemoresistant Glioma Cells. J Biol Chem 291:24188–24199 [DOI] [PMC free article] [PubMed] [Google Scholar]
- Oslowski CM, Urano F (2011) Measuring ER stress and the unfolded protein response using mammalian tissue culture system. Methods Enzymol 490:71–92 [DOI] [PMC free article] [PubMed] [Google Scholar]
- Poole JA, Burrell AM, Wyatt TA, Kielian TL, Romberger DJ (2010a) NOD2 Negatively Regulates Organic Dust-Induced Inflammation in Monocytes/Macrophages. J Allergy Clin Immunol 125:AB118 [Google Scholar]
- Poole JA, Dooley GP, Saito R, Burrell AM, Bailey KL, Romberger DJ, Mehaffy J, Reynolds SJ (2010b) Muramic acid, endotoxin, 3-hydroxy fatty acids, and ergosterol content explain monocyte and epithelial cell inflammatory responses to agricultural dusts. J Toxicol Environ Health A 73:684–700 [DOI] [PMC free article] [PubMed] [Google Scholar]
- Poole JA, Nordgren TM, Heires AJ, Nelson AJ, Katafiasz D, Bailey KL, Romberger DJ (2020) Amphiregulin modulates murine lung recovery and fibroblast function following exposure to agriculture organic dust. Am J Physiol Lung Cell Mol Physiol 318:L180–l191 [DOI] [PMC free article] [PubMed] [Google Scholar]
- Poole JA, Thiele GM, Janike K, Nelson AJ, Duryee MJ, Rentfro K, England BR, Romberger DJ, Carrington JM, Wang D, Swanson BJ, Klassen LW, Mikuls TR (2019) Combined Collagen-Induced Arthritis and Organic Dust-Induced Airway Inflammation to Model Inflammatory Lung Disease in Rheumatoid Arthritis. J Bone Miner Res [DOI] [PMC free article] [PubMed] [Google Scholar]
- Poole JA, Wyatt TA, Kielian T, Oldenburg P, Gleason AM, Bauer A, Golden G, West WW, Sisson JH, Romberger DJ (2011) Toll-like receptor 2 regulates organic dust-induced airway inflammation. Am J Respir Cell Mol Biol 45:711–719 [DOI] [PMC free article] [PubMed] [Google Scholar]
- Poole JA, Wyatt TA, Oldenburg PJ, Elliott MK, West WW, Sisson JH, Von Essen SG, Romberger DJ (2009) Intranasal organic dust exposure-induced airway adaptation response marked by persistent lung inflammation and pathology in mice. Am J Physiol Lung Cell Mol Physiol 296:L1085–1095 [DOI] [PMC free article] [PubMed] [Google Scholar]
- Ransohoff RM (2016) How neuroinflammation contributes to neurodegeneration. Science 353:777–783 [DOI] [PubMed] [Google Scholar]
- Riley JS, Quarato G, Cloix C, Lopez J, O'Prey J, Pearson M, Chapman J, Sesaki H, Carlin LM, Passos JF, Wheeler AP, Oberst A, Ryan KM, Tait SW (2018) Mitochondrial inner membrane permeabilisation enables mtDNA release during apoptosis. The EMBO journal 37:e99238. [DOI] [PMC free article] [PubMed] [Google Scholar]
- Romberger DJ, Bodlak V, Von Essen SG, Mathisen T, Wyatt TA (2002) Hog barn dust extract stimulates IL-8 and IL-6 release in human bronchial epithelial cells via PKC activation. J Appl Physiol (1985) 93:289–296 [DOI] [PubMed] [Google Scholar]
- Roy SR, Schiltz AM, Marotta A, Shen Y, Liu AH (2003) Bacterial DNA in house and farm barn dust. J Allergy Clin Immunol 112:571–578 [DOI] [PubMed] [Google Scholar]
- Tarze A, Deniaud A, Le Bras M, Maillier E, Molle D, Larochette N, Zamzami N, Jan G, Kroemer G, Brenner C (2007) GAPDH, a novel regulator of the pro-apoptotic mitochondrial membrane permeabilization. Oncogene 26:2606–2620 [DOI] [PubMed] [Google Scholar]
- Truban D, Hou X, Caulfield TR, Fiesel FC, Springer W (2017) PINK1, Parkin, and Mitochondrial Quality Control: What can we Learn about Parkinson's Disease Pathobiology? J Parkinsons Dis 7:13–29 [DOI] [PMC free article] [PubMed] [Google Scholar]
- Warren KJ, Dickinson JD, Nelson AJ, Wyatt TA, Romberger DJ, Poole JA (2019) Ovalbumin-sensitized mice have altered airway inflammation to agriculture organic dust. Respir Res 20:51. [DOI] [PMC free article] [PubMed] [Google Scholar]
- White JK, Nielsen JL, Madsen AM (2019) Microbial species and biodiversity in settling dust within and between pig farms. Environ Res 171:558–567 [DOI] [PubMed] [Google Scholar]
- Wolf SA, Boddeke HW, Kettenmann H (2017) Microglia in Physiology and Disease. Annu Rev Physiol 79:619–643 [DOI] [PubMed] [Google Scholar]
- Wright Willis A, Evanoff BA, Lian M, Criswell SR, Racette BA (2010a) Geographic and ethnic variation in Parkinson disease: a population-based study of US Medicare beneficiaries. Neuroepidemiology 34:143–151 [DOI] [PMC free article] [PubMed] [Google Scholar]
- Wright Willis A, Evanoff BA, Lian M, Criswell SR, Racette BA (2010b) Geographic and Ethnic Variation in Parkinson Disease: A Population-Based Study of US Medicare Beneficiaries. Neuroepidemiology 34:143–151 [DOI] [PMC free article] [PubMed] [Google Scholar]
- Xu Y, Jin MZ, Yang ZY, Jin WL (2021) Microglia in neurodegenerative diseases. Neural Regen Res 16:270–280 [DOI] [PMC free article] [PubMed] [Google Scholar]
Associated Data
This section collects any data citations, data availability statements, or supplementary materials included in this article.