

Abstract
Background:
Stroke has a high burden of disease in women, and adverse pregnancy outcomes have been identified as important risk factors for stroke later in life. However, long-term risks of stroke associated with preterm delivery, and whether such risks are due to familial confounding, are unclear. Such knowledge is needed to improve long-term risk assessment and stroke prevention in women.
Methods:
A national cohort study was conducted of all 2,188,043 women with a singleton delivery in Sweden in 1973-2015, who were followed up for stroke identified from nationwide diagnoses through 2015. Cox regression was used to compute adjusted hazard ratios (aHRs) for stroke associated with pregnancy duration, and co-sibling analyses assessed for confounding by shared familial (genetic and/or environmental) factors.
Results:
In 48.0 million person-years of follow-up, 36,372 (1.7%) women were diagnosed with stroke. In the 10 years following delivery, the aHR for stroke associated with preterm delivery (gestational age <37 weeks) was 1.61 (95% CI, 1.45-1.79), and further stratified was 2.81 (2.02-3.91) for extremely preterm (22-27 weeks), 2.07 (1.74-2.46) for very preterm (28-33 weeks), 1.38 (1.21-1.57) for late preterm (34-36 weeks), and 1.15 (1.06-1.24) for early term (37-38 weeks), compared with full-term (39-41 weeks). These risks remained similarly elevated at 10-19 years after delivery (preterm vs. full-term: aHR, 1.61; 95% CI, 1.50-1.74), then declined but remained significantly elevated at 20-29 years (1.35; 1.28-1.44) and 30-43 years (1.35; 1.27-1.42). Preterm delivery was associated with both hemorrhagic (aHR, 1.31; 95% CI, 1.25-1.38) and ischemic (1.54; 1.47-1.61) stroke across the entire follow-up period (up to 43 years). These findings were not explained by shared determinants of preterm delivery and stroke within families. Stroke risks were higher after either spontaneous or medically indicated preterm delivery, and recurrent preterm delivery was associated with further increases in risk.
Conclusions:
In this large national cohort, preterm delivery was associated with higher future risks of both hemorrhagic and ischemic stroke. These associations remained substantially elevated at least 40 years later, and were largely independent of covariates and shared familial factors. Preterm delivery should be recognized as a risk factor for stroke in women across the life course.
Keywords: cerebrovascular disorders, hemorrhagic stroke, ischemic stroke, premature birth, preterm birth, stroke, women
INTRODUCTION
Stroke is the third leading cause of death worldwide1 and has a higher burden of disease in women.2 The majority of strokes occur in women3 and they tend to be more severe, causing greater disability4, 5 and a higher case fatality rate6 than in men. Major risk factors for stroke include hypertension, smoking, diabetes, hyperlipidemia, ischemic heart disease, and peripheral artery disease.3 However, most of these risk factors are less prevalent in women than in men.7, 8 Other sex-specific factors, including adverse pregnancy outcomes, may also play an important role in long-term stroke risks.9, 10 A better understanding of pregnancy-related risk factors is needed to improve long-term risk assessment and targeted preventive actions in women.
Nearly 11% of all births worldwide occur preterm, affecting 15 million deliveries each year.11 Women who deliver preterm have been reported to have modestly higher future risks of hypertension, diabetes, and hyperlipidemia,12, 13 which are established risk factors for stroke.3 Several studies also have reported higher stroke risks after preterm delivery, with relative risks in the 1.3-1.9 range.14-18 However, it is unclear whether such associations might be due to confounding by shared familial (genetic or environmental) determinants of both preterm delivery and stroke. To our knowledge, this has not been examined, and thus the relative influences of shared familial factors vs. direct effects of preterm delivery on stroke risks are unknown. Other major knowledge gaps also remain, including risks of specific types of stroke (hemorrhagic or ischemic) associated with preterm delivery, how such risks change across the life course, and risks by specific types of preterm delivery (spontaneous or medically indicated).
To address these gaps, we conducted a national cohort study of more than 2 million women in Sweden. Our goals were to: (1) determine risk estimates for stroke and major types of stroke associated with preterm delivery in the largest population-based cohort to date; (2) examine changes in such risks across the life course with up to 43 years of follow-up; and (3) assess for potential confounding by shared genetic or environmental factors in families by performing co-sibling analyses. We hypothesized that preterm delivery is associated with long-term higher risks of stroke and its major types, and that these risks are largely independent of shared familial factors.
METHODS
Study Population
The Swedish Medical Birth Register contains prenatal and birth information for nearly all deliveries in Sweden since 1973.19 Using this register, we identified 2,194,939 women who had a singleton delivery during 1973-2015 and no prior history of stroke. Singleton deliveries were selected to improve internal comparability given the higher prevalence of preterm delivery and its different underlying causes in multiple gestation pregnancies.20 We excluded 6,896 (0.3%) women who had missing information for pregnancy duration, leaving 2,188,043 women (99.7% of the original cohort) for inclusion in the study. This study was approved by the Regional Ethical Review Board in Lund, Sweden (No. 2020/627). Participant consent was not required as this study used only pseudonymized registry-based secondary data. Due to legal concerns, the supporting data (which come from a large portion of the Swedish population) cannot be made openly available. Further information about the data registers is available from the Swedish National Board of Health and Welfare (https://www.socialstyrelsen.se/en/statistics-and-data/registers/).
Pregnancy Duration Ascertainment
Pregnancy duration was identified from the Swedish Medical Birth Register based on maternal report of last menstrual period in the 1970s and ultrasound estimation starting in the 1980s and onward (>70% of the cohort). This was examined alternatively as a continuous variable or categorical variable with 6 groups based on number of completed weeks: extremely preterm (22-27 weeks), very preterm (28-33 weeks), late preterm (34-36 weeks), early term (37-38 weeks), full-term (39-41 weeks, used as the reference group), and post-term (≥42 weeks). In addition, the first 3 groups were combined to provide summary estimates for preterm delivery (<37 weeks).21-24
Stroke Ascertainment
The study cohort was followed up for the earliest diagnosis of stroke from first delivery through December 31, 2015 (maximum follow-up time, 43 years; median, 22.2). Stroke was identified using International Classification of Diseases (ICD) codes in the Swedish Hospital and Outpatient Registers and all deaths attributed to stroke in the Swedish Death Register (see Table I in the Supplement for ICD codes). "Any stroke" was examined as the primary outcome, and hemorrhagic or ischemic strokes were examined separately as secondary outcomes. The Swedish Hospital Register contains all primary and secondary hospital discharge diagnoses from six populous counties in southern Sweden starting in 1964 and with nationwide coverage starting in 1987; these diagnoses are currently >99% complete, and their positive predictive value and sensitivity for first-time stroke have been reported to be >90%.25-27 The Swedish Outpatient Register contains all diagnoses from specialty clinics nationwide starting in 2001. The Swedish Death Register includes all deaths and causes of death for all persons registered in Sweden since 1960, with compulsory reporting nationwide.
Covariates
Other maternal characteristics that may be associated with pregnancy duration and stroke risk were identified using the Swedish Medical Birth Register and national census data, which were linked using a pseudonymous personal identification number. In all models, maternal age was adjusted for as the Cox model time scale (as described below). The following maternal variables were included in full models, with all time-varying factors updated for each pregnancy and modeled as time-dependent covariates: calendar year of delivery (continuous and categorical by decade), parity (1, 2, 3, 4, ≥5), education level (≤9, 10-12, >12 years), employment status (yes/no) and income (quartiles) in the year prior to delivery, country or region of origin (Sweden, other Europe/US/Canada, Asia/Oceania, Africa, Latin America, other/unknown); smoking (0, 1-9, ≥10 cigarettes/day) and body mass index (BMI; continuous and categorical [<18.5, 18.5-24.9, 25.0-29.9, ≥30.0 kg/m2]) at the beginning of prenatal care; and preeclampsia, other hypertensive disorders, and diabetes mellitus (gestational or pregestational types 1 or 2) prior to delivery (see Table I in the Supplement for ICD codes).
Maternal smoking and BMI were assessed at the beginning of prenatal care starting in 1982 and were available for 74.8% and 61.9% of births, respectively. Data were >99% complete for all other variables. Missing data for each covariate were multiply imputed with 20 imputations using all other covariates and stroke as predictors.28 As alternatives to multiple imputation, sensitivity analyses were performed that (1) restricted to births with complete data (N=2,673,801 births among 1,427,978 women), or (2) coded missing data for each covariate as a separate category using a missing data indicator.
Statistical Analysis
Cox proportional hazards regression was used to compute hazard ratios (HRs) and 95% confidence intervals (CIs) for associations between pregnancy duration and subsequent risk of stroke. These associations were examined across the maximum possible follow-up (up to 43 years) and in narrower intervals of follow-up (<10, 10-19, 20-29, 30-43 years) among women still living in Sweden without a prior diagnosis of stroke at the beginning of the respective interval. Pregnancy duration was modeled as a time-dependent variable with the exposure category determined by the shortest pregnancy to date. For example, if a woman’s first delivery was full-term and her second was preterm, she entered the preterm exposure category at the date of her second delivery. In all models, maternal age was used as the Cox model time axis with age at first delivery as “time zero.” Full models were further adjusted for covariates (as above). Women were censored at death from causes other than stroke as identified in the Swedish Death Register (n=60,694; 2.8%) or emigration as determined by absence of a Swedish residential address in census data (n=92,458; 4.2%). Emigrants and non-emigrants had similar pregnancy durations (median, 40 1/7 weeks for both groups), and thus it was unlikely that emigration introduced any substantial bias. Absolute risk differences and 95% CIs also were computed for each pregnancy duration group compared with full-term.29 The proportional hazards assumption was assessed by examining log-log plots,30 and no substantial departures were found. In addition, a sensitivity analysis was performed that was restricted to each woman’s first delivery instead of time-dependent modeling of her shortest pregnancy.
Co-sibling analyses were performed to assess for potential confounding by unmeasured shared familial (genetic and/or environmental) factors.22-24 Shared environmental factors in families may include lifestyle factors such as diet and physical activity, or ambient exposures such as passive smoking and air pollution. These analyses included all 1,186,921 (54.2%) women with at least one sister who had a singleton delivery. Stratified Cox regression was used with a separate stratum for each set of sisters as identified by their mother’s pseudonymous identification number. In the stratified Cox model, each set of sisters had its own baseline hazard function that reflected their shared genetic and environmental factors, and thus associations between pregnancy duration and stroke were examined within the family, controlling for their shared factors. In addition, these analyses were further adjusted for the same covariates as in the main analyses.
Secondary analyses were performed to examine: (1) risks of hemorrhagic or ischemic stroke associated with preterm delivery; (2) the proportion of hemorrhagic or ischemic stroke risks mediated by hypertension (because it is more common after preterm delivery12, 13 and a major risk factor for both hemorrhagic and ischemic stroke31); (3) stroke risks associated with recurrent preterm delivery; (4) stroke risks associated with spontaneous or medically indicated preterm delivery, which was systematically recorded starting in 1990 (N=2,655,313 births among 1,451,284 women; maximum 26 years of follow-up); (5) stroke risks after further adjusting for ischemic heart disease (IHD) and heart failure (HF) as time-dependent covariates; and (6) stroke risks using competing risks models to account for death from non-stroke causes as a competing event, as an alternative to censoring at death. All statistical tests were 2-sided and used an α-level of 0.05. All analyses were conducted using Stata version 15.1.
RESULTS
Table 1 reports maternal characteristics by women's shortest pregnancy duration. Women who delivered preterm were more likely than those who never delivered preterm to be <20 years old, have low education level, be unemployed, smoke, or have high prenatal BMI, preeclampsia, other hypertensive disorders, or diabetes.
Table 1.
Characteristics of study participants by shortest pregnancy duration, Sweden, 1973-2015.
| Extremely preterm |
Very preterm |
Late preterm | Early term | Full-term | Post-term | |
|---|---|---|---|---|---|---|
| (22-27 wks) | (28-33 wks) | (34-36 wks) | (37-38 wks) | (39-41 wks) | (≥42 wks) | |
| N=9,075 | N=45,372 | N=140,096 | N=551,190 | N=1,352,785 | N=89,525 | |
| n (%) | n (%) | n (%) | n (%) | n (%) | n (%) | |
| Age at first delivery (yrs) | ||||||
| <20 | 801 (8.8) | 4,119 (9.1) | 11,396 (8.1) | 35,932 (6.5) | 64,194 (4.7) | 2,811 (3.1) |
| 20-24 | 2,577 (28.4) | 13,312 (29.3) | 42,360 (30.2) | 162,194 (29.4) | 364,022 (26.9) | 17,765 (19.8) |
| 25-29 | 2,773 (30.6) | 14,573 (32.1) | 47,238 (33.7) | 194,425 (35.3) | 498,447 (36.9) | 31,067 (34.7) |
| 30-34 | 1,863 (20.5) | 9,026 (19.9) | 27,426 (19.6) | 112,679 (20.4) | 304,617 (22.5) | 24,752 (27.7) |
| 35-39 | 853 (9.4) | 3,491 (7.7) | 9,633 (6.9) | 37,728 (6.8) | 101,714 (7.5) | 11,036 (12.3) |
| ≥40 | 208 (2.3) | 851 (1.9) | 2,043 (1.5) | 8,232 (1.5) | 19,791 (1.5) | 2,094 (2.3) |
| Year of delivery | ||||||
| 1973-1979 | 1,441 (15.9) | 10,126 (22.3) | 31,063 (22.2) | 112,398 (20.4) | 338,090 (25.0) | 33,926 (37.9) |
| 1980-1989 | 1,768 (19.5) | 10,744 (23.7) | 33,757 (24.1) | 126,282 (22.9) | 258,759 (19.1) | 11,881 (13.3) |
| 1990-1999 | 1,989 (21.9) | 9,991 (22.0) | 30,400 (21.7) | 121,582 (22.1) | 267,573 (19.8) | 12,213 (13.6) |
| 2000-2009 | 2,235 (24.6) | 9,316 (20.5) | 29,125 (20.8) | 126,296 (22.9) | 279,102 (20.6) | 12,959 (14.5) |
| 2010-2015 | 1,642 (18.1) | 5,195 (11.5) | 15,751 (11.2) | 64,632 (11.7) | 209,261 (15.5) | 18,546 (20.7) |
| Final parity | ||||||
| 1 | 1,721 (19.0) | 8,341 (18.4) | 23,542 (16.8) | 86,218 (15.6) | 326,697 (24.1) | 46,414 (51.8) |
| 2 | 3,067 (33.8) | 18,055 (39.8) | 62,467 (44.6) | 263,178 (47.8) | 669,391 (49.5) | 29,673 (33.1) |
| 3 | 2,489 (27.4) | 11,435 (25.2) | 34,726 (24.8) | 140,213 (25.4) | 269,983 (19.9) | 9,981 (11.2) |
| 4 | 1,125 (12.4) | 4,737 (10.4) | 12,654 (9.0) | 42,689 (7.7) | 64,246 (4.8) | 2,431 (2.7) |
| ≥5 | 673 (7.4) | 2,804 (6.2) | 6,707 (4.8) | 18,892 (3.4) | 23,468 (1.7) | 1,026 (1.2) |
| Education (years) | ||||||
| ≤9 | 1,502 (16.6) | 7,483 (16.5) | 21,378 (15.3) | 75,746 (13.7) | 181,787 (13.4) | 16,090 (18.0) |
| 10-12 | 4,205 (46.3) | 21,490 (47.4) | 65,383 (46.7) | 247,462 (44.9) | 591,170 (43.7) | 38,787 (43.3) |
| >12 | 3,368 (37.1) | 16,399 (36.1) | 53,335 (38.1) | 227,982 (41.4) | 579,828 (42.9) | 34,648 (38.7) |
| Employment | 7,505 (82.7) | 38,225 (84.3) | 119,958 (85.6) | 474,304 (86.1) | 1,173,294 (86.7) | 75,529 (84.4) |
| Income (quartile) | ||||||
| 1st (highest) | 2,484 (27.4) | 10,373 (22.9) | 31,217 (22.3) | 130,963 (23.8) | 348,660 (25.8) | 24,437 (27.3) |
| 2nd | 2,222 (24.5) | 10,706 (23.6) | 33,539 (23.9) | 132,154 (24.0) | 341,908 (25.3) | 25,365 (28.3) |
| 3rd | 1,907 (21.0) | 11,589 (25.5) | 35,866 (25.6) | 138,437 (25.1) | 338,948 (25.1) | 22,461 (25.1) |
| 4th (lowest) | 2,462 (27.1) | 12,704 (28.0) | 39,474 (28.2) | 149,636 (27.1) | 323,269 (23.9) | 17,262 (19.3) |
| Birth country or region | ||||||
| Sweden | 6,931 (76.4) | 37,376 (82.4) | 116,167 (82.9) | 448,987 (81.5) | 1,114,195 (82.4) | 72,319 (80.8) |
| Other Europe/US/Canada | 962 (10.6) | 3,973 (8.8) | 12,122 (8.7) | 48,814 (8.9) | 128,965 (9.5) | 10,418 (11.6) |
| Asia/Oceania | 741 (8.2) | 2,667 (5.9) | 8,353 (6.0) | 38,223 (6.9) | 73,880 (5.5) | 3,703 (4.1) |
| Africa | 325 (3.6) | 897 (2.0) | 1,927 (1.4) | 8,145 (1.5) | 21,724 (1.6) | 2,208 (2.5) |
| Latin America | 106 (1.2) | 399 (0.9) | 1,388 (1.0) | 6,479 (1.2) | 12,653 (0.9) | 757 (0.9) |
| Other/unknown | 9 (0.1) | 60 (0.1) | 139 (1.0) | 542 (0.1) | 1,368 (0.1) | 120 (0.1) |
| Smoking (cigarettes/day) | ||||||
| 0 | 6,580 (72.5) | 31,195 (68.8) | 99,772 (71.2) | 409,890 (74.4) | 992,541 (73.4) | 57,918 (64.7) |
| 1-9 | 2,057 (22.7) | 12,020 (26.5) | 34,509 (24.6) | 121,431 (22.0) | 321,887 (23.8) | 29,578 (33.0) |
| ≥10 | 438 (4.8) | 2,157 (4.7) | 5,815 (4.2) | 19,869 (3.6) | 38,357 (2.8) | 2,029 (2.3) |
| Body mass index (kg/m2) | ||||||
| <18.5 | 218 (2.4) | 1,290 (2.8) | 4,209 (3.0) | 16,221 (2.9) | 29,729 (2.2) | 1,048 (1.2) |
| 18.5-24.9 | 6,908 (76.1) | 36,644 (80.8) | 113,938 (81.3) | 450,033 (81.7) | 1,109,729 (82.0) | 72,138 (80.6) |
| 25.0-29.9 | 1,342 (14.8) | 5,162 (11.4) | 15,652 (11.2) | 62,437 (11.3) | 158,184 (11.7) | 11,217 (12.5) |
| ≥30.0 | 607 (6.7) | 2,276 (5.0) | 6,297 (4.5) | 22,499 (4.1) | 55,143 (4.1) | 5,122 (5.7) |
| Preeclampsia | 1,023 (11.3) | 6,979 (15.4) | 14,148 (10.1) | 35,673 (6.5) | 61,296 (4.5) | 4,099 (4.6) |
| Other hypertensive disorders | 102 (1.1) | 679 (1.5) | 1,750 (1.3) | 6,226 (1.1) | 12,600 (0.9) | 738 (0.8) |
| Diabetes mellitus | 213 (2.3) | 1,389 (3.1) | 4,315 (3.1) | 9,985 (1.8) | 11,098 (0.8) | 477 (0.5) |
In 48.0 million person-years of follow-up, 36,372 (1.7%) women were diagnosed with stroke. The median age at first delivery was 27.0 (mean 27.1 ± 5.2), at stroke diagnosis was 55.5 (mean 54.6 ± 11.7), and at end of follow-up was 49.2 (mean 49.5 ± 13.2) years. Stroke incidence rates by pregnancy duration and follow-up time are reported in Table 2.
Table 2.
Associations between women’s pregnancy duration and subsequent risk of stroke.
| Stroke cases |
Rate* | Age-adjusted† | Full model‡ | Risk difference§ (95% CI) |
||
|---|---|---|---|---|---|---|
| HR (95% CI) | HR (95% CI) | P | ||||
| 0-43 years after delivery | ||||||
| Preterm (<37 wks) | 4,243 | 106.2 | 1.57 (1.52, 1.62) | 1.42 (1.38, 1.47) | <0.001 | 35.7 (32.4, 39.0) |
| Extremely preterm (22-27 wks) | 198 | 128.6 | 2.01 (1.75, 2.31) | 1.77 (1.53, 2.03) | <0.001 | 58.1 (40.1, 76.0) |
| Very preterm (28-33 wks) | 1,150 | 123.9 | 1.82 (1.71, 1.93) | 1.61 (1.52, 1.71) | <0.001 | 53.4 (46.2, 60.6) |
| Late preterm (34-36 wks) | 2,895 | 99.4 | 1.46 (1.41, 1.52) | 1.34 (1.29, 1.40) | <0.001 | 28.9 (25.1, 32.6) |
| Early term (37-38 wks) | 9,082 | 81.2 | 1.20 (1.17, 1.23) | 1.16 (1.13, 1.19) | <0.001 | 10.7 (8.8, 12.6) |
| Full-term (39-41 wks) | 21,349 | 70.5 | Reference | Reference | Reference | |
| Post-term (≥42 wks) | 2,058 | 81.7 | 1.04 (1.00, 1.09) | 1.02 (0.97, 1.07) | 0.45 | 11.2 (7.5, 14.8) |
| Per additional week (trend) | 0.94 (0.94, 0.94) | 0.95 (0.95, 0.95) | <0.001 | |||
| <10 years after delivery | ||||||
| Preterm (<37 wks) | 451 | 31.8 | 1.85 (1.67, 2.05) | 1.61 (1.45, 1.79) | <0.001 | 15.2 (12.2, 18.2) |
| Extremely preterm (22-27 wks) | 37 | 63.8 | 3.57 (2.58, 4.94) | 2.81 (2.02, 3.91) | <0.001 | 47.2 (26.6, 67.7) |
| Very preterm (28-33 wks) | 144 | 44.2 | 2.54 (2.14, 3.00) | 2.07 (1.74, 2.46) | <0.001 | 27.6 (20.3, 34.9) |
| Late preterm (34-36 wks) | 270 | 26.1 | 1.53 (1.35, 1.74) | 1.38 (1.21, 1.57) | <0.001 | 9.5 (6.3, 12.7) |
| Early term (37-38 wks) | 867 | 21.2 | 1.24 (1.14, 1.34) | 1.15 (1.06, 1.24) | 0.001 | 4.6 (3.0, 6.2) |
| Full-term (39-41 wks) | 2,051 | 16.6 | Reference | Reference | Reference | |
| Post-term (≥42 wks) | 168 | 14.1 | 0.86 (0.73, 1.00) | 0.93 (0.79, 1.09) | 0.36 | −2.5 (−4.8, −0.3) |
| Per additional week (trend) | 0.91 (0.90, 0.92) | 0.93 (0.92, 0.94) | <0.001 | |||
| 10-19 years after delivery | ||||||
| Preterm (<37 wks) | 880 | 69.2 | 1.81 (1.68, 1.95) | 1.61 (1.50, 1.74) | <0.001 | 29.8 (25.1, 34.6) |
| Extremely preterm (22-27 wks) | 52 | 105.5 | 2.70 (2.05, 3.55) | 2.25 (1.71, 2.97) | <0.001 | 66.2 (37.4, 94.9) |
| Very preterm (28-33 wks) | 255 | 85.9 | 2.21 (1.95, 2.52) | 1.89 (1.66, 2.15) | <0.001 | 46.5 (35.9, 57.2) |
| Late preterm (34-36 wks) | 573 | 61.9 | 1.63 (1.49, 1.78) | 1.48 (1.36, 1.62) | <0.001 | 22.6 (17.3, 27.8) |
| Early term (37-38 wks) | 1,765 | 49.7 | 1.30 (1.22, 1.37) | 1.25 (1.18, 1.33) | <0.001 | 10.3 (7.6, 13.0) |
| Full-term (39-41 wks) | 3,398 | 39.4 | Reference | Reference | Reference | |
| Post-term (≥42 wks) | 260 | 45.3 | 1.02 (0.90, 1.15) | 0.98 (0.86, 1.11) | 0.71 | 5.9 (0.3, 11.6) |
| Per additional week (trend) | 0.92 (0.91, 0.93) | 0.93 (0.92, 0.94) | <0.001 | |||
| 20-29 years after delivery | ||||||
| Preterm (<37 wks) | 1,383 | 158.8 | 1.47 (1.39, 1.57) | 1.35 (1.28, 1.44) | <0.001 | 45.4 (36.7, 54.3) |
| Extremely preterm (22-27 wks) | 55 | 172.1 | 1.61 (1.24, 2.10) | 1.47 (1.13, 1.92) | 0.004 | 58.7 (13.2, 104.3) |
| Very preterm (28-33 wks) | 358 | 175.6 | 1.62 (1.46, 1.81) | 1.47 (1.32, 1.63) | <0.001 | 62.2 (43.9, 80.7) |
| Late preterm (34-36 wks) | 970 | 152.7 | 1.41 (1.32, 1.51) | 1.31 (1.23, 1.40) | <0.001 | 39.3 (29.4, 49.4) |
| Early term (37-38 wks) | 3,154 | 133.0 | 1.21 (1.16, 1.27) | 1.19 (1.14, 1.25) | <0.001 | 19.6 (14.3, 25.1) |
| Full-term (39-41 wks) | 6,662 | 113.4 | Reference | Reference | Reference | |
| Post-term (≥42 wks) | 625 | 145.2 | 1.15 (1.06, 1.25) | 1.08 (0.99, 1.17) | 0.09 | 31.8 (20.1, 43.5) |
| Per additional week (trend) | 0.95 (0.94, 0.96) | 0.96 (0.95, 0.96) | <0.001 | |||
| 30-43 years after delivery | ||||||
| Preterm (<37 wks) | 1,529 | 351.6 | 1.42 (1.34, 1.49) | 1.35 (1.27, 1.42) | <0.001 | 82.5 (64.0, 100.9) |
| Extremely preterm (22-27 wks) | 54 | 366.5 | 1.50 (1.15, 1.96) | 1.41 (1.08, 1.84) | 0.01 | 97.4 (−0.5, 195.3) |
| Very preterm (28-33 wks) | 393 | 385.7 | 1.56 (1.41, 1.73) | 1.48 (1.34, 1.64) | <0.001 | 116.6 (78.1, 155.2) |
| Late preterm (34-36 wks) | 1,082 | 340.0 | 1.36 (1.28, 1.45) | 1.30 (1.22, 1.38) | <0.001 | 70.9 (49.9, 91.9) |
| Early term (37-38 wks) | 3,296 | 280.4 | 1.10 (1.06, 1.15) | 1.09 (1.05, 1.14) | <0.001 | 11.3 (0.3, 22.4) |
| Full-term (39-41 wks) | 9,238 | 269.1 | Reference | Reference | Reference | |
| Post-term (≥42 wks) | 1,005 | 310.5 | 1.05 (0.99, 1.13) | 1.01 (0.94, 1.08) | 0.79 | 41.4 (21.4, 61.4) |
| Per additional week (trend) | 0.96 (0.95, 0.97) | 0.96 (0.95, 0.97) | <0.001 | |||
Stroke incidence rate per 100,000 person-years.
Adjusted for maternal age (as Cox model time scale).
Further adjusted for year of delivery, parity, education, employment, income, region of origin, BMI, smoking, preeclampsia, other hypertensive disorders, and diabetes prior to delivery.
Incidence rate difference per 100,000 person-years.
Pregnancy Duration and Risk of Stroke
Across the entire follow-up period (0-43 years after first delivery), the adjusted HRs for stroke associated with preterm, extremely preterm, or early term delivery were 1.42 (95% CI, 1.38-1.47), 1.77 (1.53-2.03), and 1.16 (1.13-1.19), respectively, compared with full-term (Table 2, full model). Each additional week of pregnancy was associated with a 5% lower risk of stroke on average (adjusted HR, 0.95; 95% CI, 0.95-0.95; P<0.001). The fully adjusted HRs (as above) were only moderately lower than those adjusted only for age (Table 2).
HRs were highest in the first 20 years after delivery and then subsequently declined, whereas the absolute risk differences associated with preterm delivery increased with longer follow-up (Table 2 and Figure 1). In the first 10 years after delivery, the adjusted HR for stroke associated with preterm delivery was 1.61 (95% CI, 1.45-1.79), and further stratified was 2.81 (2.02-3.91) for extremely preterm, 2.07 (1.74-2.46) for very preterm, 1.38 (1.21-1.57) for late preterm, and 1.15 (1.06-1.24) for early term, compared with full-term (Table 2, full model). Each additional week of pregnancy was associated with a 7% lower risk of stroke on average (adjusted HR, 0.93; 95% CI, 0.92-0.94; P<0.001).
Figure 1.
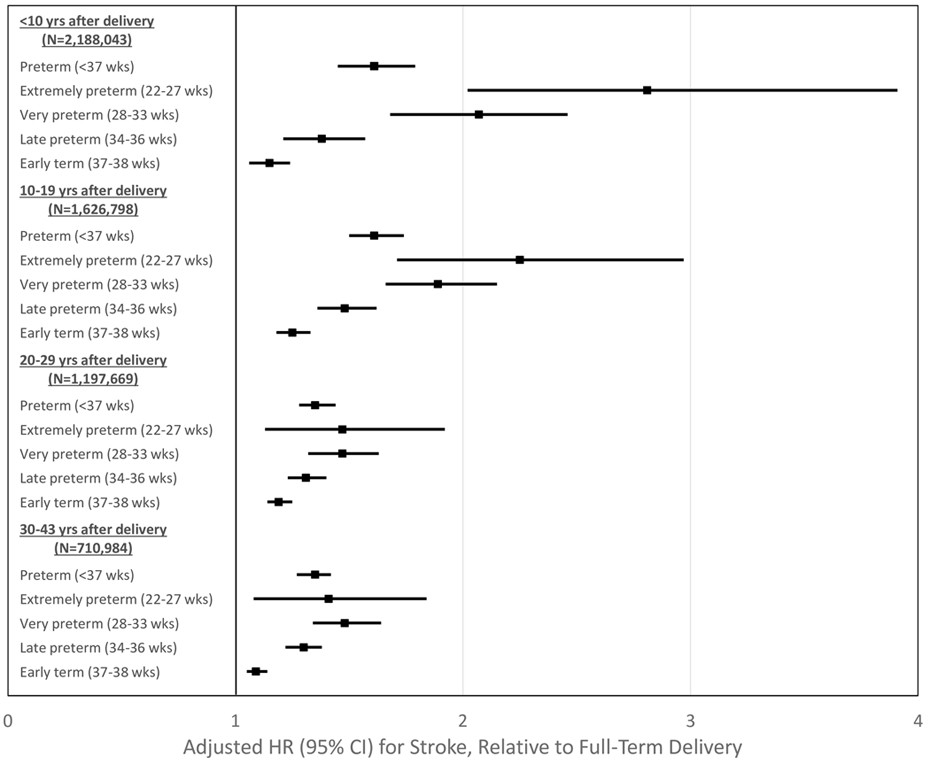
Adjusted hazard ratios and 95% confidence intervals for stroke by pregnancy duration and time since delivery, Sweden, 1973-2015.
After longer follow-up, the risk of stroke associated with preterm delivery remained similarly elevated at 10-19 years after delivery (full model, adjusted HR: 1.61; 95% CI, 1.50-1.74), then declined but remained significantly elevated at 20-29 years (1.35; 1.28-1.44) and 30-43 years (1.38; 1.32-1.45). Early term delivery (37-38 weeks) was associated with a modestly higher risk of stroke even >20 years later, compared with full-term (adjusted HR, 20-29 years: 1.19; 95% CI, 1.14-1.25; P<0.001; 30-43 years: 1.09; 1.05-1.14; P<0.001). Figure 1 shows adjusted HRs and 95% CIs for stroke by pregnancy duration and time since delivery. Figure 2 shows adjusted HRs and unadjusted risk differences for stroke by time since delivery for different pregnancy durations using spline curves.
Figure 2.
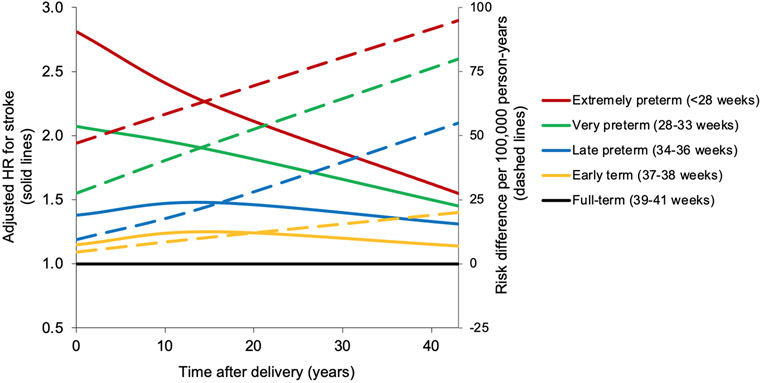
Adjusted hazard ratios and unadjusted risk differences for stroke by pregnancy duration compared with full-term, Sweden, 1973-2015.
In sensitivity analyses that examined alternatives to multiple imputation for missing data, all results were similar to the main findings and the conclusions were unchanged. For example, the adjusted HR for stroke at 0-43 years after delivery comparing preterm vs. full-term was 1.43 (95% CI, 1.35-1.52; P<0.001) when restricting to women with complete data, and 1.41 (1.36-1.46; P<0.001) when coding missing data as a separate category. In the complete case analysis, adjustment for maternal smoking and BMI had only a modest effect on risk estimates (i.e., were not major confounders). In addition, the corresponding adjusted HR when focusing on each woman’s first delivery, instead of her shortest pregnancy adjusted for parity, was 1.40 (95% CI, 1.34-1.45; P<0.001).
Hemorrhagic and Ischemic Stroke
Preterm delivery was associated with significantly higher risks of both hemorrhagic and ischemic stroke, but was more strongly associated with ischemic stroke (Table 3). Across the entire follow-up period (0-43 years), the adjusted HRs for hemorrhagic and ischemic stroke were 1.31 (95% CI, 1.25-1.38; P<0.001) and 1.54 (1.47-1.61; P<0.001), respectively (P<0.001 for difference in HRs). For both hemorrhagic and ischemic stroke, the risks associated with preterm delivery were highest in the first 10 years after delivery (adjusted HR, 1.50; 95% CI, 1.31-1.72; and 1.98; 1.68-2.33, respectively), then subsequently declined but remained significantly elevated even 30-43 years after delivery (1.23; 1.11-1.36; and 1.41; 1.32-1.51, respectively; Table 3).
Table 3.
Associations between women’s pregnancy duration and subsequent risk of hemorrhagic or ischemic stroke.
| Hemorrhagic stroke | Ischemic stroke | |||||
|---|---|---|---|---|---|---|
| Cases | HR (95% CI)* | P | Cases | HR (95% CI)* | P | |
| 0-43 years after delivery | ||||||
| Preterm (<37 wks) | 1,728 | 1.31 (1.25, 1.38) | <0.001 | 2,415 | 1.54 (1.47, 1.61) | <0.001 |
| Extremely preterm (22-27 wks) | 71 | 1.40 (1.11, 1.77) | 0.005 | 122 | 2.11 (1.77, 2.53) | <0.001 |
| Very preterm (28-33 wks) | 469 | 1.48 (1.35, 1.63) | <0.001 | 658 | 1.76 (1.62, 1.90) | <0.001 |
| Late preterm (34-36 wks) | 1,188 | 1.25 (1.18, 1.33) | <0.001 | 1,635 | 1.44 (1.37, 1.52) | <0.001 |
| Early term (37-38 wks) | 3,950 | 1.13 (1.09, 1.18) | <0.001 | 4,802 | 1.17 (1.13, 1.21) | <0.001 |
| Full-term (39-41 wks) | 9,253 | Reference | 11,466 | Reference | ||
| Post-term (≥42 wks) | 877 | 1.06 (0.99, 1.14) | 0.09 | 1,149 | 1.01 (0.95, 1.07) | 0.82 |
| Per additional week (trend) | 0.96 (0.96, 0.97) | <0.001 | 0.94 (0.94, 0.95) | <0.001 | ||
| <10 years after delivery | ||||||
| Preterm (<37 wks) | 263 | 1.50 (1.31, 1.72) | <0.001 | 195 | 1.98 (1.68, 2.33) | <0.001 |
| Extremely preterm (22-27 wks) | 15 | 1.78 (1.05, 3.01) | 0.03 | 21 | 4.62 (2.98, 7.15) | <0.001 |
| Very preterm (28-33 wks) | 84 | 1.95 (1.56, 2.44) | <0.001 | 60 | 2.36 (1.79, 3.11) | <0.001 |
| Late preterm (34-36 wks) | 164 | 1.32 (1.12, 1.56) | 0.001 | 114 | 1.67 (1.36, 2.04) | <0.001 |
| Early term (37-38 wks) | 550 | 1.16 (1.05, 1.28) | 0.005 | 297 | 1.15 (1.00, 1.32) | 0.05 |
| Full-term (39-41 wks) | 1,313 | Reference | 692 | Reference | ||
| Post-term (≥42 wks) | 122 | 1.03 (0.85, 1.24) | 0.77 | 54 | 0.89 (0.67, 1.18) | 0.42 |
| Per additional week (trend) | 0.95 (0.93, 0.97) | <0.001 | 0.91 (0.89, 0.92) | <0.001 | ||
| 10-19 years after delivery | ||||||
| Preterm (<37 wks) | 462 | 1.45 (1.31, 1.60) | <0.001 | 444 | 1.93 (1.73, 2.15) | <0.001 |
| Extremely preterm (22-27 wks) | 18 | 1.37 (0.86, 2.19) | 0.18 | 36 | 3.68 (2.63, 5.15) | <0.001 |
| Very preterm (28-33 wks) | 128 | 1.62 (1.35, 1.94) | <0.001 | 127 | 2.22 (1.84, 2.67) | <0.001 |
| Late preterm (34-36 wks) | 316 | 1.39 (1.23, 1.57) | <0.001 | 281 | 1.73 (1.52, 1.97) | <0.001 |
| Early term (37-38 wks) | 1,006 | 1.20 (1.11, 1.30) | <0.001 | 745 | 1.29 (1.18, 1.41) | <0.001 |
| Full-term (39-41 wks) | 2,044 | Reference | 1,400 | Reference | ||
| Post-term (≥42 wks) | 158 | 1.00 (0.85, 1.18) | 0.98 | 103 | 0.88 (0.72, 1.08) | 0.23 |
| Per additional week (trend) | 0.95 (0.94, 0.96) | <0.001 | 0.91 (0.90, 0.92) | <0.001 | ||
| 20-29 years after delivery | ||||||
| Preterm (<37 wks) | 554 | 1.22 (1.11, 1.33) | <0.001 | 772 | 1.44 (1.33, 1.56) | <0.001 |
| Extremely preterm (22-27 wks) | 18 | 1.07 (0.67, 1.71) | 0.77 | 33 | 1.70 (1.21, 2.40) | 0.002 |
| Very preterm (28-33 wks) | 134 | 1.23 (1.04, 1.47) | 0.02 | 214 | 1.67 (1.46, 1.92) | <0.001 |
| Late preterm (34-36 wks) | 402 | 1.22 (1.10, 1.35) | <0.001 | 525 | 1.35 (1.23, 1.48) | <0.001 |
| Early term (37-38 wks) | 1,386 | 1.16 (1.09, 1.24) | <0.001 | 1,671 | 1.21 (1.15, 1.29) | <0.001 |
| Full-term (39-41 wks) | 2,985 | Reference | 3,526 | Reference | ||
| Post-term (≥42 wks) | 278 | 1.11 (0.98, 1.25) | 0.11 | 345 | 1.07 (0.96, 1.20) | 0.21 |
| Per additional week (trend) | 0.97 (0.96, 0.98) | <0.001 | 0.95 (0.94, 0.96) | <0.001 | ||
| 30-43 years after delivery | ||||||
| Preterm (<37 wks) | 449 | 1.23 (1.11, 1.36) | <0.001 | 1,004 | 1.41 (1.32, 1.51) | <0.001 |
| Extremely preterm (22-27 wks) | 20 | 1.63 (1.05, 2.53) | 0.03 | 32 | 1.33 (0.94, 1.89) | 0.11 |
| Very preterm (28-33 wks) | 123 | 1.44 (1.20, 1.73) | <0.001 | 257 | 1.55 (1.37, 1.76) | <0.001 |
| Late preterm (34-36 wks) | 306 | 1.15 (1.02, 1.29) | 0.02 | 715 | 1.37 (1.27, 1.48) | <0.001 |
| Early term (37-38 wks) | 1,008 | 1.04 (0.97, 1.12) | 0.30 | 2,089 | 1.10 (1.05, 1.16) | <0.001 |
| Full-term (39-41 wks) | 2,911 | Reference | 5,848 | Reference | ||
| Post-term (≥42 wks) | 319 | 1.06 (0.95, 1.20) | 0.30 | 647 | 1.01 (0.93, 1.10) | 0.82 |
| Per additional week (trend) | 0.97 (0.96, 0.98) | <0.001 | 0.96 (0.95, 0.97) | <0.001 | ||
Adjusted for maternal age (as Cox model time scale), year of delivery, parity, education, employment, income, region of origin, BMI, smoking, preeclampsia, other hypertensive disorders, and diabetes prior to delivery.
A hypertension diagnosis was present in 37.3% of women who had a hemorrhagic stroke (41.1% vs. 36.9% in those who ever vs. never delivered preterm) and 56.7% of women who had an ischemic stroke (59.1% vs. 56.4%), compared with 7.9% of women who never had a stroke (10.1% vs. 7.6%). Hypertensive disorders prior to delivery were adjusted for as covariates in the main analyses (e.g., Tables 2 and 3). In addition, mediation analyses indicated that 19.4% and 22.2% of the associations between preterm delivery and hemorrhagic or ischemic stroke, respectively, were mediated by subsequent development of new-onset hypertension.
Co-Sibling Analyses
Co-sibling analyses to control for unmeasured shared familial factors resulted in moderate attenuation of certain risk estimates but increases in others (Table 4). For example, comparing preterm with full-term delivery, the adjusted HRs for any stroke at ages <10 years after delivery were 1.61 (95% CI, 1.45-1.79) in the primary analysis vs. 1.78 (1.19-2.67) in the co-sibling analysis, at 10-19 years were 1.61 (1.50-1.74) vs. 1.32 (1.03-1.70), at 20-29 years were 1.35 (1.28-1.44) vs. 1.25 (1.04-1.50), and at 30-43 years were 1.35 (1.27-1.42) vs. 1.38 (1.12-1.69).
Table 4.
Co-sibling analyses of women’s pregnancy duration and subsequent risk of stroke.
| Cases | HR (95% CI)* | P | |
|---|---|---|---|
| 0-43 years after delivery | |||
| Preterm (<37 wks) | 1,738 | 1.41 (1.29-1.55) | <0.001 |
| Early term (37-38 wks) | 3,680 | 1.15 (1.08-1.22) | <0.001 |
| Full-term (39-41 wks) | 12,707 | Reference | |
| Per additional week (trend) | 0.95 (0.94-0.96) | <0.001 | |
| <10 years after delivery | |||
| Preterm (<37 wks) | 313 | 1.78 (1.19, 2.67) | 0.005 |
| Early term (37-38 wks) | 637 | 1.07 (0.81, 1.40) | 0.63 |
| Full-term (39-41 wks) | 1,674 | Reference | |
| Per additional week (trend) | 0.93 (0.88, 0.98) | 0.006 | |
| 10-19 years after delivery | |||
| Preterm (<37 wks) | 367 | 1.32 (1.03, 1.70) | 0.03 |
| Early term (37-38 wks) | 731 | 1.12 (0.94, 1.34) | 0.22 |
| Full-term (39-41 wks) | 2,225 | Reference | |
| Per additional week (trend) | 0.95 (0.92, 0.98) | 0.004 | |
| 20-29 years after delivery | |||
| Preterm (<37 wks) | 510 | 1.25 (1.04, 1.50) | 0.02 |
| Early term (37-38 wks) | 1,174 | 1.28 (1.12, 1.46) | <0.001 |
| Full-term (39-41 wks) | 3,994 | Reference | |
| Per additional week (trend) | 0.96 (0.94, 0.99) | 0.006 | |
| 30-43 years after delivery | |||
| Preterm (<37 wks) | 548 | 1.38 (1.12, 1.69) | 0.002 |
| Early term (37-38 wks) | 1,138 | 1.11 (0.96, 1.29) | 0.16 |
| Full-term (39-41 wks) | 4,814 | Reference | |
| Per additional week (trend) | 0.95 (0.92, 0.98) | <0.001 |
Adjusted for shared familial (genetic and/or environmental) factors, and additionally for maternal age (as Cox model time scale), year of delivery, parity, education, employment, income, BMI, smoking, preeclampsia, other hypertensive disorders, and diabetes prior to delivery.
Co-sibling analyses of hemorrhagic and ischemic stroke also resulted in little change in risk estimates. For example, across the entire follow-up period (0-43 years), the adjusted HRs for hemorrhagic stroke were 1.31 (95% CI, 1.25-1.38) in the primary analysis vs. 1.34 (1.17-1.53) in the co-sibling analysis, and for ischemic stroke were 1.54 (1.47-1.61) vs. 1.53 (1.35-1.73) (not shown in the tables). Overall, these findings suggest that the associations observed in the main analyses were largely not attributable to shared genetic or environmental factors in families.
Other Secondary Analyses
Table 5 reports associations between the number of preterm deliveries and stroke risk among women with at least two singleton deliveries. Women with recurrent preterm delivery had further increases in stroke risk. The adjusted HRs for stroke per each additional preterm delivery were 1.46 (95% CI, 1.35-1.58) at <10 years of follow-up, 1.33 (1.25-1.41) at 10-19 years, 1.22 (1.16-1.28) at 20-29 years, and 1.30 (1.24-1.36) at 30-43 years.
Table 5.
Associations between number of preterm deliveries and subsequent risk of stroke among women with at least two singleton deliveries.
| Cases | Rate* | HR (95% CI)† | P | |
|---|---|---|---|---|
| 0-43 years after first delivery | ||||
| 0 preterm | 16,627 | 56.2 | Reference | |
| 1 preterm | 2,265 | 77.5 | 1.32 (1.26, 1.38) | <0.001 |
| ≥2 preterm | 659 | 104.7 | 1.80 (1.67, 1.95) | <0.001 |
| Per additional preterm delivery | 1.30 (1.27, 1.34) | <0.001 | ||
| <10 years after first delivery | ||||
| 0 preterm | 1,779 | 14.8 | Reference | |
| 1 preterm | 254 | 21.7 | 1.42 (1.25, 1.63) | <0.001 |
| ≥2 preterm | 91 | 36.3 | 2.41 (1.95, 2.98) | <0.001 |
| Per additional preterm delivery | 1.46 (1.35, 1.58) | <0.001 | ||
| 10-19 years after first delivery | ||||
| 0 preterm | 3,143 | 35.4 | Reference | |
| 1 preterm | 462 | 52.2 | 1.39 (1.26, 1.53) | <0.001 |
| ≥2 preterm | 135 | 70.0 | 1.84 (1.55, 2.18) | <0.001 |
| Per additional preterm delivery | 1.33 (1.25, 1.41) | <0.001 | ||
| 20-29 years after first delivery | ||||
| 0 preterm | 5,666 | 97.8 | Reference | |
| 1 preterm | 727 | 124.2 | 1.20 (1.11, 1.30) | <0.001 |
| ≥2 preterm | 222 | 173.0 | 1.65 (1.44, 1.89) | <0.001 |
| Per additional preterm delivery | 1.22 (1.16, 1.28) | <0.001 | ||
| 30-43 years after first delivery | ||||
| 0 preterm | 6,039 | 209.3 | Reference | |
| 1 preterm | 822 | 291.4 | 1.34 (1.25, 1.44) | <0.001 |
| ≥2 preterm | 211 | 365.2 | 1.71 (1.49, 1.96) | <0.001 |
| Per additional preterm delivery | 1.30 (1.24, 1.36) | <0.001 |
Stroke incidence rate per 100,000 person-years.
Adjusted for maternal age (as Cox model time scale), year of delivery, parity, education, employment, income, region of origin, BMI, smoking, preeclampsia, other hypertensive disorders, and diabetes prior to delivery.
Both spontaneous and medically indicated deliveries at either preterm or early term were associated with higher stroke risks compared with full-term (e.g., adjusted HR, spontaneous preterm: 1.51; 95% CI, 1.35-1.70; P<0.001; medically indicated preterm: 1.84; 1.67-2.03; P<0.001; Table 6). However, medically indicated delivery was the stronger risk factor (P<0.001 for difference in HRs at either preterm or early term).
Table 6.
Spontaneous or medically indicated delivery and subsequent risk of stroke, Sweden, 1990-2015.
| Cases | Rate* | HR (95% CI)† | P | |
|---|---|---|---|---|
| Preterm | ||||
| Spontaneous | 310 | 67.7 | 1.51 (1.35, 1.70) | <0.001 |
| Medically indicated | 482 | 109.6 | 1.84 (1.67, 2.03) | <0.001 |
| Early term | ||||
| Spontaneous | 988 | 46.9 | 1.10 (1.03, 1.18) | <0.001 |
| Medically indicated | 1,009 | 72.6 | 1.40 (1.30, 1.50) | <0.001 |
| Full-term | 5,871 | 41.9 | Reference |
Stroke incidence rate per 100,000 person-years.
Adjusted for maternal age (as Cox model time scale), year of delivery, parity, education, employment, income, region of origin, BMI, smoking, preeclampsia, other hypertensive disorders, and diabetes prior to delivery.
A large majority (88.8%) of first-time strokes had no prior diagnosis of IHD or HF. Further adjustment for IHD and HF yielded only modestly lower risk estimates (e.g., adjusted HR at 0-43 years after delivery comparing preterm vs. full-term, 1.37; 95% CI, 1.32-1.41). When the main analyses were repeated while accounting for death as a competing event instead of censoring for death, all risk estimates were virtually unchanged (e.g., adjusted HR at 0-43 years after delivery comparing preterm vs. full-term, 1.42; 95% CI, 1.37-1.47).
DISCUSSION
In this large national cohort of women, shorter pregnancy duration was associated with higher future risks of both hemorrhagic and ischemic stroke. Women who delivered preterm or extremely preterm had 1.6- and 2.8-fold risks of any stroke in the next 10 years compared with those who delivered full-term, after adjusting for smoking, BMI, preeclampsia, diabetes, and other maternal factors. These risks subsequently declined but remained significantly elevated (~.4-fold) even 30-43 years after delivery. Early term delivery (37-38 weeks) also was associated with a modestly higher risk of stroke that persisted 30-43 years later. Furthermore, co-sibling analyses suggested that these findings were not explained by shared genetic or environmental determinants of both preterm delivery and stroke within families.
To our knowledge, this is the largest study to date of preterm delivery in relation to stroke risks, and the first to assess for potential confounding by shared familial factors using a co-sibling design. The overall risk estimates for stroke were consistent with those from previous smaller studies. For example, an Australian cohort study of 797,056 women (median follow-up 7.5 years)15 and a Danish cohort study of 427,775 women (mean follow-up 28 years)14 reported nearly 1.7-fold risks of stroke among those who delivered preterm (adjusted HR, 1.68; 95% CI, 1.46-1.95; and 1.67; 1.48-1.89, respectively). A Scottish cohort study of 119,668 women with 14-19 years of follow-up reported a 1.9-fold risk of stroke associated with preterm delivery (adjusted HR, 1.91; 95% CI, 1.35-2.70).16 A US cohort study of 70,182 women (median follow-up 32 years) reported a non-significant 1.3-fold risk of self-reported stroke associated with preterm delivery (adjusted HR, 1.28; 95% CI, 0.95-1.71).17 In a Taiwanese cohort of 4,715 pregnant women without hypertensive disorders (mean follow-up 6.4 years), preterm delivery was associated with a non-significant 1.5-fold subsequent risk of stroke (adjusted HR, 1.51; 95% CI, 0.77-2.93).18 A meta-analysis of these 5 studies reported a pooled relative risk of 1.65 (95% CI, 1.51-1.79).32
The present study extends this evidence by providing adjusted risk estimates in a large national cohort with >10-fold as many strokes as prior studies, affording the statistical power needed to examine narrowly defined pregnancy durations, stroke types, and co-sibling analyses. The findings suggest that women who delivered preterm have substantially higher risks of stroke that persist at least 40 years, especially those who delivered extremely or very preterm (<34 weeks). Preterm delivery was associated with both hemorrhagic and (even more strongly) ischemic stroke, consistent with evidence from only one smaller study in Scotland.16 Stroke risks were higher after either spontaneous or (even higher) medically indicated preterm delivery, consistent with findings from only one prior study in Australia (adjusted HR, spontaneous: 95% CI, 1.49; 95% CI, 1.24-1.78; medically indicated: 2.12; 1.70-2.65).15
Findings in the present study were largely independent of covariates as well as unmeasured shared genetic or environmental factors in families. Instead, they suggest that individual-specific processes involved in preterm delivery may have direct effects on future development of stroke. Preeclampsia and other hypertensive disorders of pregnancy are common causes of preterm delivery and associated with lifelong higher risks of hypertension33 (a major risk factor for both hemorrhagic and ischemic stroke)31 and stroke mortality.33, 34 Among all women with preterm delivery, the prevalence of preeclampsia was 11.5% in the present Swedish cohort and is reportedly higher (~5-20%) in the US.35 Preterm delivery even without hypertensive disorders during pregnancy has been associated with higher risk of hypertension later in life.12, 13 However, our findings suggested that hypertension only partially mediated associations between preterm delivery and either hemorrhagic or ischemic stroke. Other mechanisms may potentially involve inflammatory pathways that have been linked with preterm delivery and endothelial dysfunction. Increased production of proinflammatory cytokines, specifically IL-1, IL-6, and TNF, have been associated with uterine activation and the timing and initiation of preterm delivery.36-38 Recent evidence suggests that preterm delivery might be a key event that triggers endothelial-specific inflammation that was undetectable prior to pregnancy.39 Atherosclerosis may also be initiated by endothelial inflammation and expression of the adhesion molecule VCAM-1, triggering an inflammatory cell response, release of proinflammatory cytokines, and development of an atherosclerotic plaque,40-42 which are known precursors of ischemic stroke.43 Further elucidation of the underlying mechanisms is needed and may reveal new targets for intervention to prevent both preterm delivery and subsequent stroke.
The present findings are consistent with associations between preterm delivery and future risks of ischemic heart disease23 and all-cause and cardiovascular mortality24 that were previously reported in this cohort. These findings may have important clinical implications. Preterm delivery should be recognized by clinicians and patients as an important risk factor for stroke and other cardiovascular disease across the life course. Cardiovascular risk assessment in women should routinely include reproductive history that covers preterm delivery and other adverse pregnancy outcomes. Reproductive history should be a required element of electronic health records to facilitate access by clinicians across patients' life course.44 Women with a history of preterm delivery warrant early preventive actions and long-term clinical follow-up to reduce other modifiable risk factors for stroke, including obesity, hypertension, diabetes, hyperlipidemia, smoking, and physical inactivity. Better access to high-quality preconception and prenatal care is also critically needed to help reduce preterm delivery.45
Strengths and Limitations
A key strength of the present study is its large national cohort design with up to 43 years of follow-up. The availability of highly complete nationwide birth and medical registry data helped minimize potential selection and ascertainment biases. The large sample size enabled high statistical power to assess narrowly defined pregnancy durations and key subgroups. The results were controlled for many maternal factors, as well as unmeasured shared familial factors using co-sibling analyses.
Limitations included the lack of detailed clinical records needed to verify stroke diagnoses, although positive predictive values >90% have previously been reported using Swedish registry data.25-27 Lifestyle factors later in life may be important modifiers of stroke risk after preterm delivery and would be useful to examine in future studies with access to this information. Measurement of serum cytokines and other markers of endothelial dysfunction was infeasible in the present study but also may be useful to help delineate underlying mechanisms. The present study was limited to Sweden and will need further replication in other countries when feasible, including racially diverse populations to explore for potential heterogeneity of findings in racial/ethnic subgroups. Additional follow-up to older ages also will be needed in this or other large cohorts.
Conclusions
In this national cohort of >2 million women, preterm delivery was associated with higher future risks of both hemorrhagic and ischemic stroke. These associations remained substantially elevated at least 40 years later, and were largely independent of covariates and shared familial factors. Preterm delivery should be recognized as a risk factor for stroke across the life course. Women with a history of preterm delivery need early preventive evaluation and long-term clinical follow-up to reduce their lifetime risk of stroke.
Supplementary Material
CLINICAL PERSPECTIVE.
What is new?
In a national cohort of >2 million women, preterm delivery was associated with higher future risks of both hemorrhagic and ischemic stroke up to 40 years later.
These associations were largely independent of covariates and shared genetic and/or environmental factors within families.
What are the clinical implications?
Preterm delivery should be recognized as a risk factor for stroke in women across the life course.
Women with a history of preterm delivery need early preventive evaluation and long-term clinical follow-up to reduce their lifetime risk of stroke.
Acknowledgments
FUNDING SOURCES
This work was supported by the National Heart, Lung, and Blood Institute at the National Institutes of Health [R01 HL139536 to C.C. and K.S.]; the Swedish Research Council; the Swedish Heart-Lung Foundation; and Avtal om Läkarutbildning och Forskning (ALF) project grant, Region Skåne/Lund University, Sweden. The funding agencies had no role in the design and conduct of the study; in the collection, analysis, and interpretation of the data; or in the preparation, review, or approval of the manuscript.
Non-standard abbreviations and acronyms:
- BMI
body mass index
- HF
heart failure
- HR
hazard ratio
- ICD
International Classification of Diseases
- IHD
ischemic heart disease
Footnotes
DISCLOSURES
There are no conflicts of interest.
REFERENCES
- 1.Global Burden of Disease Causes of Death Collaborators. Global, regional, and national age-sex-specific mortality for 282 causes of death in 195 countries and territories, 1980-2017: a systematic analysis for the Global Burden of Disease Study 2017. Lancet. 2018;392:1736–1788. [DOI] [PMC free article] [PubMed] [Google Scholar]
- 2.Lundberg GP and Volgman AS. Burden of stroke in women. Trends Cardiovasc Med. 2016;26:81–88. [DOI] [PubMed] [Google Scholar]
- 3.Virani SS, Alonso A, Benjamin EJ, Bittencourt MS, Callaway CW, Carson AP, Chamberlain AM, Chang AR, Cheng S, Delling FN, et al. Heart Disease and Stroke Statistics-2020 Update: A Report From the American Heart Association. Circulation. 2020;141:e139–e596. [DOI] [PubMed] [Google Scholar]
- 4.Gargano JW, Reeves MJ and Paul Coverdell National Acute Stroke Registry Michigan Prototype Investigators. Sex differences in stroke recovery and stroke-specific quality of life: results from a statewide stroke registry. Stroke. 2007;38:2541–2548. [DOI] [PubMed] [Google Scholar]
- 5.Gall SL, Tran PL, Martin K, Blizzard L and Srikanth V. Sex differences in long-term outcomes after stroke: functional outcomes, handicap, and quality of life. Stroke. 2012;43:1982–1987. [DOI] [PubMed] [Google Scholar]
- 6.Appelros P, Stegmayr B and Terent A. Sex differences in stroke epidemiology: a systematic review. Stroke. 2009;40:1082–1090. [DOI] [PubMed] [Google Scholar]
- 7.Appelros P, Stegmayr B and Terent A. A review on sex differences in stroke treatment and outcome. Acta Neurol Scand. 2010;121:359–369. [DOI] [PubMed] [Google Scholar]
- 8.Cho NH, Shaw JE, Karuranga S, Huang Y, da Rocha Fernandes JD, Ohlrogge AW and Malanda B. IDF Diabetes Atlas: Global estimates of diabetes prevalence for 2017 and projections for 2045. Diabetes Res Clin Pract. 2018;138:271–281. [DOI] [PubMed] [Google Scholar]
- 9.Poorthuis MH, Algra AM, Algra A, Kappelle LJ and Klijn CJ. Female- and Male-Specific Risk Factors for Stroke: A Systematic Review and Meta-analysis. JAMA Neurol. 2017;74:75–81. [DOI] [PubMed] [Google Scholar]
- 10.Demel SL, Kittner S, Ley SH, McDermott M and Rexrode KM. Stroke Risk Factors Unique to Women. Stroke. 2018;49:518–523. [DOI] [PMC free article] [PubMed] [Google Scholar]
- 11.Chawanpaiboon S, Vogel JP, Moller AB, Lumbiganon P, Petzold M, Hogan D, Landoulsi S, Jampathong N, Kongwattanakul K, Laopaiboon M, et al. Global, regional, and national estimates of levels of preterm birth in 2014: a systematic review and modelling analysis. Lancet Glob Health. 2019;7:e37–e46. [DOI] [PMC free article] [PubMed] [Google Scholar]
- 12.Tanz LJ, Stuart JJ, Williams PL, Missmer SA, Rimm EB, James-Todd TM and Rich-Edwards JW. Preterm Delivery and Maternal Cardiovascular Disease Risk Factors: The Nurses' Health Study II. J Womens Health (Larchmt). 2019;28:677–685. [DOI] [PMC free article] [PubMed] [Google Scholar]
- 13.Lykke JA, Paidas MJ, Damm P, Triche EW, Kuczynski E and Langhoff-Roos J. Preterm delivery and risk of subsequent cardiovascular morbidity and type-II diabetes in the mother. BJOG. 2010;117:274–281. [DOI] [PubMed] [Google Scholar]
- 14.Catov JM, Wu CS, Olsen J, Sutton-Tyrrell K, Li J and Nohr EA. Early or recurrent preterm birth and maternal cardiovascular disease risk. Ann Epidemiol. 2010;20:604–609. [DOI] [PMC free article] [PubMed] [Google Scholar]
- 15.Ngo AD, Chen JS, Figtree G, Morris JM and Roberts CL. Preterm birth and future risk of maternal cardiovascular disease - is the association independent of smoking during pregnancy? BMC Pregnancy Childbirth. 2015;15:144. [DOI] [PMC free article] [PubMed] [Google Scholar]
- 16.Pell JP, Smith GC and Walsh D. Pregnancy complications and subsequent maternal cerebrovascular events: a retrospective cohort study of 119,668 births. Am J Epidemiol. 2004;159:336–342. [DOI] [PubMed] [Google Scholar]
- 17.Tanz LJ, Stuart JJ, Williams PL, Rimm EB, Missmer SA, Rexrode KM, Mukamal KJ and Rich-Edwards JW. Preterm Delivery and Maternal Cardiovascular Disease in Young and Middle-Aged Adult Women. Circulation. 2017;135:578–589. [DOI] [PMC free article] [PubMed] [Google Scholar]
- 18.Wang IK, Chang SN, Liao CC, Liang CC, Chang CT, Lin HH, Liu JH, Liu YL, Chuang FR, Hsu CY, et al. Hypertensive disorders in pregnancy and preterm delivery and subsequent stroke in Asian women: a retrospective cohort study. Stroke. 2011;42:716–721. [DOI] [PubMed] [Google Scholar]
- 19.Statistics Sweden. The Swedish Medical Birth Register. https://www.socialstyrelsen.se/en/statistics-and-data/registers/register-information/the-swedish-medical-birth-register/. Published April 15, 2019. Accessed September 1, 2020.
- 20.Stock S and Norman J. Preterm and term labour in multiple pregnancies. Semin Fetal Neonatal Med. 2010;15:336–341. [DOI] [PubMed] [Google Scholar]
- 21.Goldenberg RL, Culhane JF, Iams JD and Romero R. Epidemiology and causes of preterm birth. Lancet. 2008;371:75–84. [DOI] [PMC free article] [PubMed] [Google Scholar]
- 22.Crump C, Sundquist J, Winkleby MA and Sundquist K. Gestational age at birth and mortality from infancy into mid-adulthood: a national cohort study. Lancet Child Adolesc Health. 2019;3:408–417. [DOI] [PMC free article] [PubMed] [Google Scholar]
- 23.Crump C, Sundquist J, Howell EA, McLaughlin MA, Stroustrup A and Sundquist K. Pre-Term Delivery and Risk of Ischemic Heart Disease in Women. J Am Coll Cardiol. 2020;76:57–67. [DOI] [PMC free article] [PubMed] [Google Scholar]
- 24.Crump C, Sundquist J and Sundquist K. Preterm delivery and long term mortality in women: national cohort and co-sibling study. BMJ. 2020;370:m2533. [DOI] [PMC free article] [PubMed] [Google Scholar]
- 25.Koster M, Asplund K, Johansson A and Stegmayr B. Refinement of Swedish administrative registers to monitor stroke events on the national level. Neuroepidemiology. 2013;40:240–246. [DOI] [PubMed] [Google Scholar]
- 26.Merlo J, Lindblad U, Pessah-Rasmussen H, Hedblad B, Rastam J, Isacsson SO, Janzon L and Rastam L. Comparison of different procedures to identify probable cases of myocardial infarction and stroke in two Swedish prospective cohort studies using local and national routine registers. Eur J Epidemiol. 2000;16:235–243. [DOI] [PubMed] [Google Scholar]
- 27.Ludvigsson JF, Andersson E, Ekbom A, Feychting M, Kim JL, Reuterwall C, Heurgren M and Olausson PO. External review and validation of the Swedish national inpatient register. BMC Public Health. 2011;11:450. [DOI] [PMC free article] [PubMed] [Google Scholar]
- 28.Rubin DB. Multiple Imputation for Nonresponse in Surveys. New York: Wiley; 1987. [Google Scholar]
- 29.Fleiss JL, Levin B and Paik MC. Statistical Methods for Rates and Proportions (3rd ed.). New York: Wiley; 2003. [Google Scholar]
- 30.Grambsch PM. Goodness-of-fit and diagnostics for proportional hazards regression models. Cancer Treat Res. 1995;75:95–112. [DOI] [PubMed] [Google Scholar]
- 31.O'Donnell MJ, Chin SL, Rangarajan S, Xavier D, Liu L, Zhang H, Rao-Melacini P, Zhang X, Pais P, Agapay S, et al. Global and regional effects of potentially modifiable risk factors associated with acute stroke in 32 countries (INTERSTROKE): a case-control study. Lancet. 2016;388:761–775. [DOI] [PubMed] [Google Scholar]
- 32.Wu P, Gulati M, Kwok CS, Wong CW, Narain A, O'Brien S, Chew-Graham CA, Verma G, Kadam UT and Mamas MA. Preterm Delivery and Future Risk of Maternal Cardiovascular Disease: A Systematic Review and Meta-Analysis. J Am Heart Assoc. 2018;7: e007809. [DOI] [PMC free article] [PubMed] [Google Scholar]
- 33.Wilson BJ, Watson MS, Prescott GJ, Sunderland S, Campbell DM, Hannaford P and Smith WC. Hypertensive diseases of pregnancy and risk of hypertension and stroke in later life: results from cohort study. BMJ. 2003;326:845. [DOI] [PMC free article] [PubMed] [Google Scholar]
- 34.Theilen LH, Fraser A, Hollingshaus MS, Schliep KC, Varner MW, Smith KR and Esplin MS. All-Cause and Cause-Specific Mortality After Hypertensive Disease of Pregnancy. Obstet Gynecol. 2016;128:238–244. [DOI] [PMC free article] [PubMed] [Google Scholar]
- 35.Ananth CV and Vintzileos AM. Epidemiology of preterm birth and its clinical subtypes. J Matern Fetal Neonatal Med. 2006;19:773–782. [DOI] [PubMed] [Google Scholar]
- 36.Thomson AJ, Telfer JF, Young A, Campbell S, Stewart CJ, Cameron IT, Greer IA and Norman JE. Leukocytes infiltrate the myometrium during human parturition: further evidence that labour is an inflammatory process. Hum Reprod. 1999;14:229–236. [PubMed] [Google Scholar]
- 37.Challis JR, Lockwood CJ, Myatt L, Norman JE, Strauss JF 3rd and Petraglia F. Inflammation and pregnancy. Reprod Sci. 2009;16:206–215. [DOI] [PubMed] [Google Scholar]
- 38.Cappelletti M, Della Bella S, Ferrazzi E, Mavilio D and Divanovic S. Inflammation and preterm birth. J Leukoc Biol. 2016;99:67–78. [DOI] [PubMed] [Google Scholar]
- 39.Lane-Cordova AD, Gunderson EP, Carnethon MR, Catov JM, Reiner AP, Lewis CE, Dude AM, Greenland P and Jacobs DR Jr. Pre-pregnancy endothelial dysfunction and birth outcomes: The Coronary Artery Risk Development in Young Adults (CARDIA) Study. Hypertens Res. 2018;41:282–289. [DOI] [PMC free article] [PubMed] [Google Scholar]
- 40.Blake GJ and Ridker PM. Novel clinical markers of vascular wall inflammation. Circ Res. 2001;89:763–771. [DOI] [PubMed] [Google Scholar]
- 41.Libby P. Inflammation and cardiovascular disease mechanisms. Am J Clin Nutr. 2006;83:456S–460S. [DOI] [PubMed] [Google Scholar]
- 42.Libby P, Ridker PM, Hansson GK and Leducq Transatlantic Network on A. Inflammation in atherosclerosis: from pathophysiology to practice. J Am Coll Cardiol. 2009;54:2129–2138. [DOI] [PMC free article] [PubMed] [Google Scholar]
- 43.Maida CD, Norrito RL, Daidone M, Tuttolomondo A and Pinto A. Neuroinflammatory Mechanisms in Ischemic Stroke: Focus on Cardioembolic Stroke, Background, and Therapeutic Approaches. Int J Mol Sci. 2020;21:6454. [DOI] [PMC free article] [PubMed] [Google Scholar]
- 44.Quesada O, Shufelt C and Bairey Merz CN. Can We Improve Cardiovascular Disease for Women Using Data Under Our Noses?: A Need for Changes in Policy and Focus. JAMA Cardiol. 2020. September 16. doi: 10.1001/jamacardio.2020.4117. Online ahead of print. [DOI] [PMC free article] [PubMed] [Google Scholar]
- 45.Shapiro-Mendoza CK, Barfield WD, Henderson Z, James A, Howse JL, Iskander J and Thorpe PG. CDC Grand Rounds: Public Health Strategies to Prevent Preterm Birth. MMWR Morb Mortal Wkly Rep. 2016;65:826–830. [DOI] [PubMed] [Google Scholar]
Associated Data
This section collects any data citations, data availability statements, or supplementary materials included in this article.