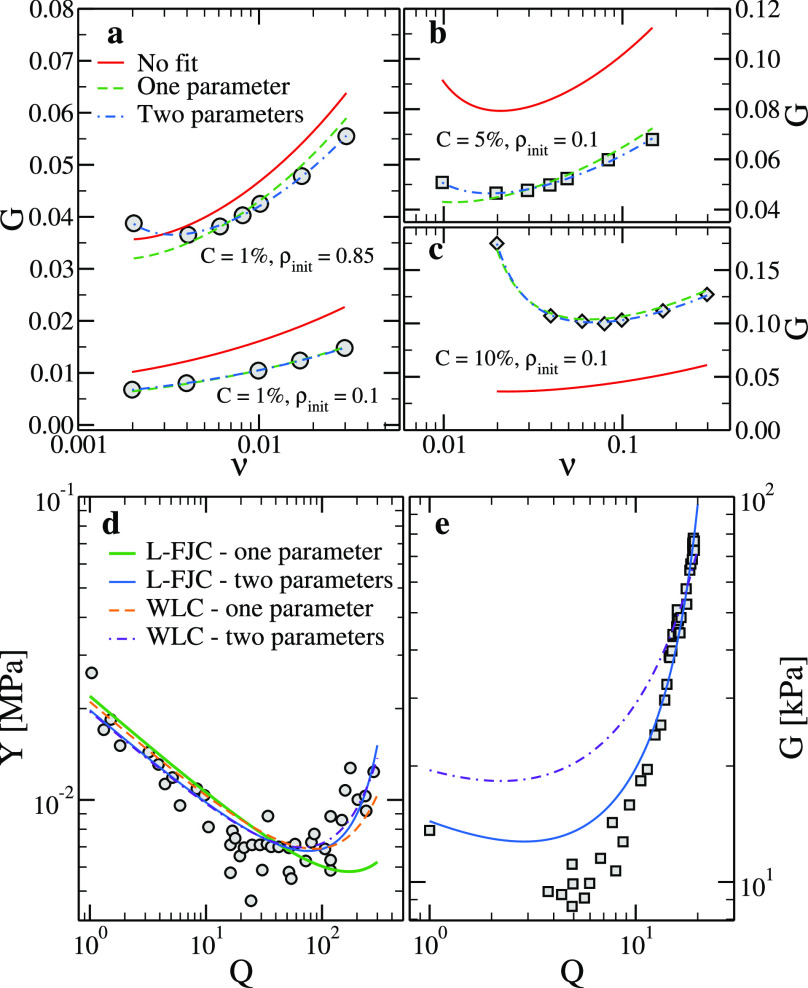
Figure 7.
Fitting results to (a–c) simulation data (a) C = 1%, (b) C = 5%, and (c) C = 10% and (d,e) experimental data: (d) Young’s modulus taken from Hoshino et al.21 and (e) shear modulus taken from Matsuda et al.30 The quality of the fits in panel e does not depend on whether the point at Q = 1 is considered or not or if we restrict the fit to swelling ratios Q ≲ 15.

