

Abstract
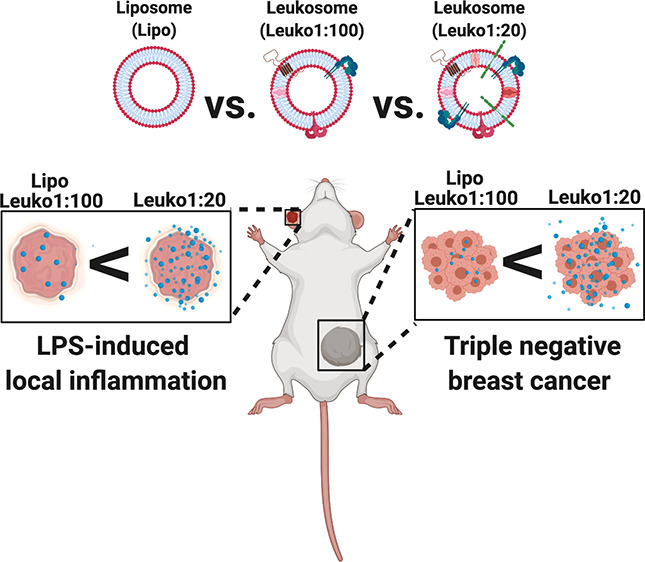
Biomimetic nanoparticles aim to effectively emulate the behavior of either cells or exosomes. Leukocyte-based biomimetic nanoparticles, for instance, incorporate cell membrane proteins to transfer the natural tropism of leukocytes to the final delivery platform. However, tuning the protein integration can affect the in vivo behavior of these nanoparticles and alter their efficacy. Here we show that, while increasing the protein:lipid ratio to a maximum of 1:20 (w/w) maintained the nanoparticle’s structural properties, increasing protein content resulted in improved targeting of inflamed endothelium in two different animal models. Our combined use of a microfluidic, bottom-up approach and tuning of a key synthesis parameter enabled the synthesis of reproducible, enhanced biomimetic nanoparticles that have the potential to improve the treatment of inflammatory-based conditions through targeted nanodelivery.
Keywords: biomimicry, nanoparticles, cancer, inflammation, microfluidics
Introduction
Nanoparticles (NPs) represent a broad range of drug delivery vehicles that offer the ability to target diseased sites while minimizing off-target effects.1 However, the complex biological milieu encountered by NPs upon entry into the bloodstream poses significant biological barriers that thwart their ability to deliver their payload to the target tissue.2 For example, systemic administration of NPs exposes them to rapid uptake and clearance by components of the mononuclear phagocyte system (MPS).3 As a result, these NPs do not reach the target site and, thereby, do not exert their therapeutic effects. Previous efforts to overcome these challenges have included the incorporation of polyethylene glycol (PEG) to improve circulation times4 and conjugation of targeting moieties, such as antibodies and peptides,5 to facilitate preferential accumulation to disease sites. Over time, increasing evidence highlighted the limitations of these strategies, such as the immune response to repeated injections of PEG and the high variability in conjugation densities of targeting moieties on NPs surface.6,7
Biomimetic NPs represent an emerging class of NPs that aim to address the current challenges faced by the field of nanomedicine through the biomimicry of native cells.8,9 Work in this field encompasses a broad range of NPs, ranging from those mimicking red blood cells10 to immune cells11 to even cancer cells.12 Use of these biomimetic approaches has shown how traditionally used NP platforms can now harness the features of native cells to achieve specific function while maintaining the superior delivery capabilities of a synthetic NP.13,14 Examples of this include red blood cell membrane-coated polymeric NPs that achieve longer circulation times for toxin removal in the blood15 and chemotherapy-loaded NPs cloaked with cancer cell membranes for homotypic targeting of tumor cells.16
The syntheses of biomimetic NPs have taken on two primary forms: top-down and bottom-up approaches. Isolation of whole cell membranes which are then applied in toto onto a synthetic NP core is an example of a top-down approach where the extracted component maintains the full biological complexity of the source.13 In contrast, bottom-up approaches utilize the incorporation of ligands or other components as the building blocks to integrate into the final NP,16 such as the integration of membrane proteins into synthetic NPs.17 While top-down approaches serve as a bridge between synthetic NPs and source cells, bottom-up approaches offer more control in the tuning of the final NP formulation.17,18 Regardless of the synthesis approach utilized, maintenance of key NP physicochemical and biological characteristics, both during and after the synthesis process, is a crucial component in the engineering of these platforms.19 Achievement of specific functionality using these complex biomimetic NPs warrants the careful and rational tuning of parameters associated with the synthesis process. Parameters such as the ratio of NP to extracted cell membrane, temperature used during the synthesis steps,20 and post-synthesis purification process21 are examples of the factors that must be carefully considered. The engineering of these design criteria has significant effects not only on the physicochemical properties of the NPs but also their biomimetic behavior under biological conditions.
Leukocyte-based biomimetic NPs for targeting inflamed tissues (i.e., leukosomes) were previously reported by our group.17 Leukosomes have demonstrated the ability to home to sites of inflammation and preferentially adhere to inflamed endothelia.22 Previously, we demonstrated the feasibility of synthesizing these NPs using two synthesis methods: thin-layer evaporation and a microfluidic-based approach.17,19 Upon synthesis, characterization of the NPs verified their physiochemical properties, while their biological functions were demonstrated in a local inflammation model. As inflamed endothelia are a common feature in a large number of disease conditions (e.g., tumor,23 sepsis,24 traumatic brain injury,25 atherosclerosis,26etc.), this NP platform provides a very powerful tool for effective targeting and therapeutic cargo delivery. Furthermore, the tunability of this targeting is important for the tailoring of these NPs to a specific disease condition.
Building off this foundational work, we aimed to demonstrate the tunability of this system within the context of inflammation. In particular, we chose to focus on the engineering of the synthesis parameters by establishing key design criteria. These design criteria included thresholds on size and polydispersity index (PDI), conservation of key leukocyte proteins, maintenance of the lipid bilayer structure, and NP stability. Recognizing the need for ease of scalability and translational strategies for NP synthesis, we chose to use the microfluidic-based approach for synthesis of the NPs in this study.
As the integration of proteins dictates the biological behavior of leukosomes, here we aimed to modulate this behavior by optimizing the protein:lipid (P:L) ratio utilized in the synthesis process. Therefore, we hypothesized that an increase in the protein content on the NPs will be directly correlated to their biomimetic targeting function in vitro and in vivo.
To this end, we assessed the effects of varying the P:L ratio of the leukosomes while using a microfluidic-based, bottom-up NP synthesis process. Preservation and stability of key physiochemical (e.g., size, ζ potential (ZP), NP concentration and morphology) and biomimetic (e.g., protein integration and presence of key leukocyte biological markers) parameters were first evaluated. Then, in order to assess the short and long-term stabilities of these biomimetic NPs, we assessed the changes in each of the aforementioned parameters over the duration of 21 days. From here, the different formulations were tested for in vitro targeting to inflamed endothelial cells, which are the most relevant cell population implicated in the innate targeting of leukocytes to sites of inflammation.27 Furthermore, preferential accumulation to sites of inflammation within the disease context was studied using murine lipopolysaccharide (LPS)-induced local inflammation (LLI) and triple negative breast cancer (TNBC) in vivo models.
An improved understanding of how tuning this biomimetic NPs targeting capabilities is vital for future therapeutic applications of this platform. Enhancing this behavior by increasing the P:L ratio while using native leukocyte membrane proteins encompasses a simple but powerful approach. With this information in hand, we will have a reproducible, potent biomimetic NP formulation that will specifically target the site of inflammation while reducing off-target effects on healthy tissues.
Results and Discussion
Synthesis, Physicochemical, and Biomimetic Characterization of Leukocyte-Based Biomimetic NP with Varying P:L Ratios
Prior to commencing the synthesis of the NPs with varying P:L ratios, we established design parameters that were critical to determining the success of synthesis and the ability of the NPs to achieve intended biological functions. To this end, we set the following measurement parameters: (1) size <200 nm, (2) PDI <0.2, (3) negative ZP following incorporation of proteins, (4) maintenance of lipid bilayer structure even when more proteins are added, (5) conservation of key leukocyte markers on the NP, and (6) NP stability for 21 days.
The synthesis of the NPs is divided into two parts: extraction of membrane proteins from leukocytes followed by microfluidic synthesis of NPs (Figure 1). Leukocytes were cultivated and membrane proteins extracted using a commercial kit.28 Synthesis on the NanoAssemblr involves feeding two phases, an organic phase containing lipids and an aqueous phase comprised of buffer with extracted membrane proteins, into the inlet ports of the chip. Mixing of these two phases within microstructures of the chip results in the formation of the desired NP. One of the main steps during the microfluidic synthesis that differentiates the NP groups is the amount of membrane proteins added to the aqueous phase before NP assembly. The protein amount dictated the P:L ratio associated with each NP group: Lipo, none; Leuko1:100, 0.058 mg/mL; Leuko1:40, 0.145 mg/mL; and Leuko1:20, 0.29 mg/mL. The incorporation of different amounts of proteins in the NP structure, although a simple concept, was not trivial. We found that the proteins’ suspension buffer dramatically affected the NP size and PDI. Thus, we determined the maximum amount of protein buffer that did not affect the desired physicochemical properties of the NP (Figure S1). With these design criteria in mind, 180 μL of the protein buffer was determined to be the max volume that could be used, which corresponded to a maximum P:L ratio of 1:20. In addition, we also demonstrated how the P:L ratio tested with our NP formulations compares to the P:L ratio found on native leukocyte membranes (Figure S2). Combining our empirical and mathematical calculations, the native P:L ratio was determined to be 1:100.
Figure 1.

Schematic of the different protein:lipid ratios (P:L) biomimetic NP microfluidic synthesis, characterization, and in vitro and in vivo experiments. (1) Leukocytes (J774 cell line) were cultivated in vitro and used to extract (2) membrane proteins for the synthesis of (3) different P:L NPs using a microfluidic approach by increasing the membrane protein concentration in the aqueous phase. For Lipo, no membrane proteins were added, while we added 0.058 mg/mL of protein extract for Leuko1:100, 0.145 mg/mL for Leuko1:40, and 0.29 mg/mL for Leuko 1:20. The physical, chemical, and biological properties of the NP were characterized (4) and then tested in vitro using inflamed endothelial cells (5). Finally, the enhanced targeting was evaluated in vivo using LLI and TNBC models. Figure 1 was created using Biorender.com.
Using this microfluidic approach, we demonstrated that the different NP groups can be synthesized in a reproducible manner (N = 4), while maintaining the desired P:L ratio. The size and PDI of Lipo, Leuko1:100, and Leuko1:40 were relatively similar, with a size of 100 nm and PDI of 0.12 (Figure 2A,B). Leuko1:20 NP was slightly larger in size (110 nm), but with lower PDI at 0.1 (Figure 2A,B). Particle concentration of the Lipo was 2.7 × 10¹² particles/mL, while Leuko1:100 and Leuko1:40 were around 2.5 × 10¹² particles/mL (Figure 2C). Leuko1:20 had a slightly larger particle concentration at 3 × 10¹² particles/mL (Figure 2C). Moreover, we validated that increasing the membrane protein concentration during the NP assembly did not affect the NP size, PDI, and concentration beyond the predetermined thresholds set in our design criteria (Figure 2A–C). However, a gradient decrease in ZP was observed as the membrane protein concentration was increased (Figure 2D). More specifically, Leuko1:20 demonstrated a 3.1-fold decrease in ZP compared to Lipo, 1.5-fold decrease in ZP compared to Leuko1:100, and 1.3-fold decrease in ZP compared to Leuko1:40. Interestingly, when we visualized the NPs using cryo-transmission electron microscopy (TEM), we noticed the NPs also preserved their bilayer structure even after increasing the membrane protein concentration during the synthesis process (Figure 2E).
Figure 2.

Physiochemical and biomimetic properties characterization of NPs. Physicochemical characterization of biomimetic NPs showed an increasing NP protein content, decreased ZP, and no effects on the size, PDI, concentration, and morphology. Multiple NP formulations of liposomes, Leuko1:100, Leuko1:40, and Leuko1:20 were assessed for their (A) size, (B) PDI, (C) concentration, and (D) ZP (N = 4). Lipo, Leuko1:100, Leuko1:40, and Leuko1:20 were imaged by cryo-TEM (E) and found to have a similar lipid bilayer morphology. Scale bars = 50 nm. SDS-PAGE gel (F) and Western blots (G) for five leukocytes membrane proteins markers (CD11b, CD18, CD45, CD47, and CD11a) indicate an increasing protein gradient as more membrane proteins were added during the synthesis step. Results are shown as mean ± SEM. One-way ANOVA followed by Tukey’s multiple comparison test were used to determine statistical probabilities. P value ≤0.05 among means was considered as statistically significant.
Following the physicochemical and structural studies, the NPs were examined for their biomimetic properties (i.e., leukocytes’ membrane protein content). SDS-PAGE analysis revealed that membrane protein content was retained through the NP microfluidic synthesis. Moreover, we observed that the NPs protein content exhibited a gradient increase with respect to increasing P:L ratio (Figure 2F). Using Western blots (WB), a similar gradient increase was observed for specific proteins, CD11b, CD18, CD45, CD47, and CD11a (Figure 2G), and quantified (Figure S3). When compared to the Leuko1:100, Leuko1:40 and Leuko1:20 exhibited over a 37-fold and 87-fold increase in CD11b and CD18 integration, respectively (Figure S3). On the other hand, CD45 presence on the NPs was 10- and 15-fold higher on the Leuko1:40 and Leuko1:20, respectively, when compared to the Leuko:100 (Figure S3). Notably, the presence of ACTB, an intracellular membrane protein marker, and NP62, a nuclear protein marker, that served as negative controls for this experiment, were not detected among the NP samples. In an effort to understand the spatial orientation of the integrated proteins on the NP, we used flow cytometry while focusing on one target protein: CD11b (Figure S4A). Orientation of the integrated protein was evaluated by whether the N-terminus (i.e., exoplasmic) or C-terminus (i.e., cytoplasmic) of the protein was exposed on the NP surface, using specific antibodies against the two termini of the same protein. The normalized quantification of the median fluorescence indicated no differences between N- or C-terminal orientation across all three NP groups (Figure S4B). In addition, the percentage of positive events in the singlet gate for each of these termini was found to be approximately the same across all the NP groups (Figure S4C). Taken together, this orientation study indicated that the integration of the CD11b protein occurs in a random manner, with an equal ratio of exposure of both the N- and C-termini on the NPs surface.
Characterization of Short and Long Storage Stability of NPs over 21 Days
We then assessed both the structural and biomimetic stability of the NPs when stored at 4 °C. For structural stability tests, dynamic light scattering (DLS) measurements for the NPs size, PDI, and ZP were done at both short and long time points postsynthesis: 1, 3, 14, and 21 days (Figure S5A–C). NanoSight was used to assess the NP concentration changes after 21 days (Figure S5D). For the biomimetic stability, SDS-PAGE was done every 7 days for 3 weeks in a row (Figure S5E). We did not observe any statistically significant differences between the NP structural and biomimetic properties. In fact, no changes in size were observed across all the NP formulations over the 21 day period (Figure S5A). Although the PDI of all the Leuko NPs remained around 0.12, Lipo did exhibit an increase from 0.12 to 0.15 PDI at day 21 (Figure S5B). In addition, ZP remained the same in all the NP formulations (Figure S5C). Although particle concentration remained the same for Lipo, Leuko1:100, and Leuko1:20, the Leuko1:40 formulation showed a slight decrease of 0.5 × 10¹² particles/mL by day 21 (Figure S5D). Lastly, SDS-PAGE gels indicated the maintained protein presence on the particles in all the Leuko formulations (Figure S5E). Taken together, this suggested that the NPs maintain their size, PDI, ZP, and concentration while retaining the gradient increase in membrane protein content on the different biomimetic NPs.
In Vitro Toxicity and Uptake of Biomimetic NPs by Inflamed Endothelial Cells
Given that the primary target of these NPs upon systemic administration will be sites of inflammation, we chose to test uptake of the NPs in vitro by the first inflamed cells they will encounter at these sites, endothelial cells. In particular, we inflamed murine endothelial cells with LPS, which also served as the basis of our LLI in vivo model.
Prior to verifying the targeting abilities of the various NP formulations in vitro, we first confirmed that varying the protein concentration on the particles did not result in increased cytotoxicity. The incubation of NPs with inflamed endothelial cells did not result in any cytotoxic effects after 24 h (Figure 3A). The cells maintained 100% of viability for all tested NP concentrations. Then, we evaluated the effect of the different P:L ratios on NP uptake using both confocal imaging and flow cytometry for the quantification (gating strategy in Figure S6). Control images of non-inflamed and LPS-inflamed endothelial cells, along with NP treated non-inflamed cells, were also acquired for comparison (Figures S7 and S8).
Figure 3.

In vitro toxicity and uptake of biomimetic NPs in inflamed endothelial cells. Increasing protein content on NPs resulted in no cytotoxicity and an increased association and uptake by inflamed endothelial cells. (A) Endothelial cells were incubated with NPs and toxicity evaluated by MTT assay. Cell viability after 24 h showed no significant decreases due to NPs. NPs association by inflamed endothelial cells (B) was confirmed by flow cytometry. Relative uptake, as measured by mean fluorescence intensity normalized to the liposomes treated cells, increased with increasing protein content on NPs. Inflamed endothelial uptake of fluorescent NPs (red) was also visualized by Z-stack confocal imaging (C). Following a 1 h incubation, Leuko1:20 demonstrated a significantly higher uptake across all NP formulations. Endothelial cells were stained for nuclei (blue) and cell membrane (green). Macroscale bar = 100 μm, microscale bar = 27 μm. Results are shown as mean ± SEM. Either one-way (A) or two-way (B) ANOVA followed by Tukey’s multiple comparison test were used to determine statistical probabilities. P value ≤0.05 among means was considered as statistically significant.
LPS-inflamed endothelial cells exhibited a gradient uptake pattern (Figure 3B and Figure S9) when evaluated by flow cytometry. More specifically, both Leuko1:40 and Leuko1:20 demonstrated significant uptake when compared to liposomes, with almost a 2-fold increase for the latter NP group. To further verify these observations, NP uptake by these cells was also visualized by confocal microscopy imaging. Once again, significant preferential uptake of the Leuko1:20 NP was evident, while very little uptake was observed in the other NP groups (Figure 3C).
In Vivo Biomimetic NP Targeting in a LLI and TNBC Models
To study the effects of varying the NP P:L ratio on their targeting of sites of inflammation, we used two different in vivo models. Both a LLI model and a TNBC tumor model were chosen to investigate the biodistribution of the NP upon systemic administration. Once again, the strain of mice used for both models matches the source of cells used for the NP synthesis. This was done to avoid immune responses associated with different cell sources.
For the LLI model, mice were injected in one ear (right ear) with a single administration of LPS. Shortly after, mice were injected with the NP formulations via tail vein injection (Figure 4A). Given the gradient behavior observed in our in vitro experiments, we chose to follow both biodistribution and target site accumulation of only the Lipo, Leuko1:100, and Leuko1:20 formulations. We recognized that these two Leuko groups represented the maximum and minimum thresholds of in vitro targeting, thereby, providing us an opportune window to observe the differential patterns of accumulation between the NP groups. Within 5 h of NP injection, significant differences could be observed in the NP accumulation in the inflamed ears only (right ears) (Figure 4B). No sign of NP accumulation was noticed in the non-inflamed ears (left ear) among all NP groups. Leuko1:20 demonstrated a 1.5-fold increase in inflamed ear accumulation over both the Lipo and Leuko1:100 groups (Figure 4C). This observed increase remained consistent also for the 8 h time point. Ex vivo imaging of the ears demonstrated once more that NP accumulation could be observed only in inflamed ears, while control ears showed no NP accumulation (Figure 4D and Figure S10). This further validated the ability of these biomimetic NPs to specifically target the site of inflammation. In addition, the Leuko1:20 group exhibited a 1.75-fold increase in particle accumulation over the other NP formulations (Figure 4E).
Figure 4.

In vivo targeting of NP in two inflammation models. Increasing the protein content on NPs resulted in increased targeting in LLI and TNBC. (A) LLI and (F) TNBC diseased mice were treated with NPs as shown. Inflamed right ear (B) and tumor (G) targeting of fluorescent NPs were imaged by an in vivo imaging system (IVIS). Following 3–5 h from systemic administration, Leuko1:20 demonstrated significantly higher targeting in both in vivo models (C, H) across all NP formulations. These results were also verified using ex vivo analysis for both targeted organs (D–J). Results are shown as mean ± SEM. Either one-way (E, J) or two-way ANOVA (C, H) followed by Tukey’s multiple comparison test were used to determine statistical probabilities. P value ≤0.05 among means was considered as statistically significant.
While the LLI represented an acute inflammation model, we aimed to further validate the robust targeting abilities of these biomimetic NPs in a tumor model, where inflammation stems from a host of underlying factors that emerge over time. Similar to the ear inflammation model, tumors were established in mice and verified by luminescence quantification to be similar in size prior to NP treatment (Figure S11). Mice were then administered with the different NP formulations via tail vein injections (Figure 4F). In vivo imaging of the whole mice indicated varying levels of accumulation in the tumor for up to 24 h (Figure 4G). Significant differences in tumor accumulation could be observed between the Leuko1:20 and Lipo beginning at 6 h, while these differences could be seen at all time points when comparing the Leuko1:20 and the Leuko1:100 (Figure 4H). Interestingly, the longer circulation time of the Leuko1:20 NPs could also be observed, where the signal of liver accumulation in the Lipo group is reduced significantly by 6 h. In contrast, the Leuko1:20 group maintained a strong signal in the liver for up to 8 h (Figure S12). Ex vivo imaging at 24 h confirmed the superior accumulation of the Leuko1:20 NPs in the tumor (Figure 4I and Figure S13). In fact, the Leuko1:20 exhibited a 1.4-fold and 2.7-fold increase in tumor accumulation over the Lipo and Leuko1:100 groups, respectively (Figure 4J). In addition to this whole organ quantification for NP accumulation, intravital microscopy (IVM) was also performed on TNBC tumors, with imaging focused on the inflamed tumor vasculature. Quantification of NP signal within the vessels indicated that increasing the protein content on the NPs improved the targeting of the NPs to the vasculature, with Leuko1:20 exhibiting a 3-fold more averaged accumulation in the vessels over liposomes (Figure S14).
Biodistribution and Safety of P:L Biomimetic NPs
To further study the biodistribution of each biomimetic NP group and evaluate their potential as improved delivery vehicles, either 9–10 mice for the LLI model or 4 mice for the TNBC model were injected with 100 μL of Cy5.5/Cy7-DSPE labeled NPs. At the respective end time point (8 h for LLI and 24 h for TNBC), the heart, lungs, spleen, liver, kidneys, and blood were collected for fluorescence quantification (Figures S15–S17). The organs were collected, washed in PBS, and then measured using IVIS. Upon euthanizing of the mice, blood was withdrawn from the hepatic vein.
In the LLI model, the highest fluorescent signal among the collected organs was found in the liver followed by the spleen, lungs, kidneys, and heart (Figure 5A). In contrast, for the TNBC model, the highest florescent signal among all the organs was measured in the kidneys, spleen, liver, lungs, and heart (Figure 5B). Interestingly, when compared to the Leuko1:100, higher fluorescent signal was measured in the blood of the Leuko1:20 group, both in the LLI and the TNBC models.
Figure 5.

In vivo biodistribution and safety of biomimetic NP. Increasing the protein content on NPs was well tolerated and resulted in a different biodistribution in vivo. Mice were administrated with NP groups via IV injection. Mice were euthanized after either 8 h (LLI model) (A) or 24 h hours (TNBC model) (B), and the organs were collected and imaged. Tissue sections of the liver, spleen, lungs, and kidneys were prepared for H&E staining (C). Scale bar = 100 μm. Results are shown as mean ± SEM. One-way ANOVA followed by Tukey’s multiple comparison test were used to determine statistical probabilities. P value ≤0.05 among means was considered as statistically significant.
Finally, in order to assess if the different P:L biomimetic NPs are well tolerated in vivo, tissue samples from the lungs, spleen, liver, kidneys, and heart of the LLI mice were fixed, sectioned, and stained for hematoxylin and eosin (H&E). In addition, the lungs of these mice were stained for Masson’s trichrome to assess the levels of fibrosis as an indication of inflammation. PBS injected mice and LPS only injected mice served as controls, and organs were processed in the same manner as previously described. No obvious injury was observed in any of organs from animals treated with P:L biomimetic NPs (Figure 5C). In addition, quantification of collagen fibers in the Masson’s trichrome stained lungs confirmed that the use of LPS did indeed induce inflammation, with no increase in fibrosis observed following treatment with biomimetic NPs (Figure S18).
Conclusions
In this work, we demonstrated the effect of tuning the P:L ratio of leukocyte-based biomimetic NPs on their physicochemical characteristics, biomimetic properties, and biological functionality in targeting inflammation in vitro and in vivo. These leukocyte-based biomimetic NPs were synthesized using a microfluidic-based, bottom-up approach, which aims to integrate leukocyte membrane proteins for improved targeting.11 Recognizing the crucial role played by the membrane proteins’ incorporation on the NPs, we aimed to understand how tuning of the protein content affects key NP characteristics. Prior to tuning of this biomimetic NP formulation, key design parameters were set to ensure the maintenance of stringent properties for the future therapeutic applications. These key design criteria included the size, PDI, surface charge, retention of key leukocyte markers, and 21 day stability after NP synthesis.
Upon successful synthesis of the NPs with varying P:L ratios, we discovered key insights associated with the synthesis process. First and foremost, increasing the protein content on the NPs did not affect the size, PDI, or concentration of the particles. This finding was crucial in our efforts to maintain the fundamental characteristics we know contribute to the functional behavior of the particles. More importantly, unlike previously reported solid core biomimetic NPs whose size increased after coated with cell membranes,10 no changes in NP were observed, validating the hypothesis that the proteins were incorporated into the lipid bilayer. Furthermore, increasing the protein amount did not negatively impact the structural integrity of the NP, as verified by cryo-TEM imaging. On the contrary, if the extra proteins added in the aqueous phase of synthesis had not successfully integrated into the lipid bilayer, this would have been apparent both in the DLS size and PDI measurements. In particular, we would have had a heterogeneous population of particles corresponding to a larger PDI.29 Moreover, the decrease in ZP with decreasing P:L ratio was further confirmation of the successful integration of proteins into the lipid bilayer. As more negatively charged proteins were incorporated, the surface charge became increasingly negative, as was previously reported by us.17 In addition, the assumption that the hydrophilic core precludes access for hydrophobic membrane proteins together with the removal of unbound membrane proteins from the NPs after the synthesis by dialysis further supports our claim that the extracted membrane proteins are integrated into the NP bilayer. Lastly, the protein buffer of the extracted membrane proteins was found to significantly impact the final size of the NPs, a parameter which was determined to be kept <200 nm. By identifying the maximal volume of protein buffer that could be utilized in the synthesis, reproducibility of the NP formulation across batches was improved due to this key insight.
The presence and orientation of surface markers integrated into our biomimetic NPs are imperative for their biological function (e.g., MPS evasion and inflammation targeting). SDS-PAGE confirmed the presence of more proteins with an increasing P:L ratio, and WB indicated the enrichment of key leukocyte markers on the NPs, proteins that we know dictate the innate behavior of these native immune cells. Markers of “self”, such as CD47 and CD45, enable these NPs to delay clearance by components of the MPS and maintain a longer circulation time.22,30 On the other hand, CD18, CD11a, and CD11b are proteins that mediate their ability to be the home sites of inflammation, bind to the associated receptors on the inflamed endothelia, and extravasate out into the surrounding tissue.31,32 While SDS-PAGE followed by WB for specific leukocyte membrane markers demonstrated the successful integration of proteins into the NP membrane, flow cytometry offered valuable insights on the orientation of these proteins. As a result of the NP self-assembly process and due to the fact that we had no engineered control over the way the membrane proteins would be integrated to the surface (e.g., cytoplasmic side of the membrane protein inside the NPs and exoplasmic side outside the NPs), the orientation of one leukocyte marker of interest (CD11b) known to be on our NP was studied (Figure S4). Specifically, our findings confirmed an equal distribution between the integrated cytoplasmic and exoplasmic parts of CD11b among all the biomimetic NP groups. Despite this finding, a higher association to inflamed endothelia was still assessed when the protein concentration was increased (Lipo < Leuko1:100 < Leuko1:40 < Leuko1:20), supporting our claim of tunable targeting affects with respect to the protein concentration. As more of these proteins are enriched on the NPs, we speculate that we improve the ability of the NP to reach the target site. Indeed, both of our in vitro and in vivo results validated this hypothesis.
Having confirmed the ability of our synthesis process to maintain the physicochemical and biomimetic characteristics of NPs with varying P:L ratios, we were able to demonstrate the associated tuned NP behaviors. Recognizing that inflamed endothelial cells comprise the first populations of cells our NPs encounter and interact with at the inflamed area in vivo, we confirmed the ability of our biomimetic NPs to be taken up by these cells in vitro without inducing cytotoxicity. In fact, the uptake of the NPs in this cell type followed a gradient pattern that correlated with an increasing P:L ratio without any changes in the toxicity levels. This result suggested that both the targeting and internalization properties of the NPs relied more on protein presence as opposed to other NP features, such as size, morphology, and particle concentration. This was particularly evident in endothelial cells, which are not phagocytic cells like macrophages.33 As a result, the endothelial cells showed a very low NP signal in all of the groups, except the Leuko1:20. This observation aligns with the behavior of native leukocytes that use their membrane proteins, which includes the CD11b and CD18 found on our NPs, to recognize sites of inflammations.31,32 Specifically, inflamed endothelial cells surrounding the site of inflammation upregulate proteins that mediate ligand–receptor interactions for the leukocyte homing to the inflamed tissue.34 We speculate our own NPs behave in the same manner and confirmed this through the results obtained in both of our in vivo models.
The use of two different inflammation models allowed us to test the robustness of the NP targeting efficiencies under two disparate disease conditions: acute vs chronic inflammatory response. While the in vivo models chosen for this study represent two different mechanisms of inflammation, the underlying mechanism of targeting for the NP remains the same: utilizing the integrated membrane proteins to specifically target the site of inflammation. As a result, the Leuko1:20 NPs exhibited up to a 2.7-fold increase in accumulation to the site of inflammation when compared against liposomes (which do not contain any protein). The increased targeting to the inflamed vasculature with increasing protein content was further corroborated by IVM imaging. The arrival of NPs to the target site improved with increasing P:L ratios, where Leuko1:20 demonstrated a 3-fold averaged increase in the accumulation with the lumen of the vessel. Taken together, these results validated the increased targeting efficiency associated with increasing the protein content on the NPs, particularly in preferential accumulation to sites of inflammation.
While maintenance of key NP properties and enhancement of NP targeting efficiency were of utmost importance in this study, the assessment of the effects of this tuning on healthy tissues was of equal importance. Although NP targeting emphasizes arrival at the target site, avoidance of organs that deter them from arriving to that site must also be considered. Previous work has shown that 100 nm NPs mostly accumulate in the liver and spleen,2 a phenomena also seen in our in vivo imaging of the TNBC tumors. While the liposomes appeared to show a decreased liver accumulation by 6 h, Leuko1:20 exhibited a liver accumulation even up to 8 h. This suggests a longer circulation time for the Leuko1:20, which could be attributed to the higher presence of CD47 and CD45 on these NPs. These cell markers might signal biological cues of “do not eat me” and “self” to the MPS. As these particles remained in circulation for a longer period of time, which was verified by the higher NPs presence in the blood for both in vivo models, Leuko1:20 was also able to achieve improved tumor targeting. On the other hand, the Leuko1:100 contains less of these “self” marker proteins which results in its reduced presence in the blood when compared to the Leuko1:20. In addition, our biodistribution results indicated that increasing the P:L ratio on the NPs did not skew the particle accumulation to a different healthy organ when compared to the liposomes. In fact, accumulation profiles remained relatively similar across all the organs at the end point of organ collection. Therefore, we are able to minimize any unintended targeting to healthy organs. The safety profile of the NP was furthered corroborated by the histological analysis that showed no obvious signs of toxicity or increased lung fibrosis resulting from systemic administration of the NPs. This absence of toxicity could be further explained by the use of naturally occurring membrane proteins on the NPs which reduce the instigation of a foreign body response.
In conclusion, this work demonstrates a microfluidic approach that allows for the synthesis of reproducible NPs as the P:L ratio of the desired biomimetic NPs is tuned. The resulting leukocyte membrane protein of integrated lipid NPs was shown to retain the biological behavior of native leukocytes without affecting the NP physicochemical properties of size, PDI, and concentration. In particular, these biomimetic NPs demonstrated improved inflammation targeting and MPS evasion, a behavior that improved with increasing P:L ratios. The approach described in this paper highlights the importance of tuning key biomimetic NP synthesis parameters, especially those that directly dictate the biological properties of these NPs. It is important to note that the protein extraction was a limiting factor in the maximum amount of protein that could be incorporated into the NPs. Therefore, one aspect of future work aims to address this by methods to improve the protein extraction and not be limited by the protein buffer in future formulations. Another aspect of future work will be to control the correct orientation of the membrane proteins during the NPs fabrication. Finding a way to control this aspect of the assembly process will further improve the efficacy of these biomimetic NPs.
In order to lay down the foundations for future NP therapeutics using our P:L synthesis microfluidic concept, structural and biomimetic stability tests were done for short and long-term storage at 4 °C. Both structural and biomimetic parameters remained constant over the 21 day test period, which would allow researchers to store these kinds of NPs for longer use.
The work described here serves as a stepping stone for the engineering of future biomimetic NPs which can be tuned for specific disease conditions using the body’s own cells. The therapeutic benefits of these NP platforms could be further enhanced through loading of drugs or biological agents that treat the underlying disease condition. With an improved understanding of the relationships between synthesis parameters and the biological properties of biomimetic NPs, future generations of NPs hold the potential to target and treat disease with greater efficacy.
Experimental Section
Reagents
Membrane protein extraction kit, chloroform, methanol, Tween 20, and 2-mercaptoethanol were purchased from Sigma-Aldrich (Missouri, United States). Dipalmitoylphosphatidylcholine (DPPC), 1,2-dioleoyl-sn-glycerol-3-phosphocholine (DOPC), and cholesterol (ovine wool, > 98%) were purchased from Avanti Polar Lipids, Inc. (Alabaster, United States). Float-A-Lyzer G2 dialysis devices was purchased from Spectrum Laboratories (Massachusetts, United States). Phosphate Buffered Saline (PBS) 10× solution, syringe filters 0.22 μm sterile PVDF, MilliporeSigma Milli-Q Ultrapure Water Systems Accessory, and Pierce Rapid Gold BCA Protein Assay Kit were purchased from Fisher Scientific (Pennsylvania, United States). Dynamic Light Scattering (DLS), NanoSight NS300, and disposable cuvettes primarily for the measurement of ZP were provided from Malvern, Instruments (Worcestershire, United Kingdom). Semi microvolume disposable polystyrene cuvettes for size measurements, 10× tris buffered saline (TBS), 10× Tris/Glycine/SDS, Precision Plus Protein Dual Color Standards, 10%Mini-PROTEAN TGX Precast Protein Gels, Trans-Blot Turbo Mini Nitrocellulose, 2× Laemmli sample buffer, and Clarity Western ECL Substrate were purchased from Bio-Rad Laboratories (California, United States). Sodium dodecyl sulfate (SDS) was purchased from GE Healthcare (Illinois, United States). Antibodies for Western blot (rabbit anti-CD11a (LS-C331613), rat anti-CD11b (MAB11241), goat anti-CD18 (AF2618), rabbit anti-CD45 (EPR20033), goat anti-CD47 (ab108415), mouse anti-ACTB (A5441), mouse anti-NP62(sc-48389), antirabbit IgG-HRP, antigoat IgG-HRP, antimouse IgG-HRP, and antirat IgG were purchased from Bio-Techne Corporation (Minnesota, United States). FLUOstar Omega microplate reader was purchased from BMG (Labtech Ortenberg, Germany). NanoAssemblr Benchtop and Microfluidic Cartridge were purchased from Precision Nanosystems (Vancouver, Canada). Gelatin coating solution was purchased from Cell Biologics (Chicago, IL).
Cell Lines
J774 murine macrophages were purchased from ATCC and cultured in DMEM high-glucose complete media supplemented with 1% l-glutamine and 1% Penstrep. BALB/c murine endothelial cells were purchased from Cell Biologics and cultured in complete murine endothelial media (Cell Biologics, Chicago, IL).
Membrane Protein Extraction and Quantification
MPs were extracted from J774 cells using a ProteoExtract Native Membrane protein extraction kit and subsequently quantified for their concentration. Briefly, J774 cells were resuspended in 2 mL of wash buffer and centrifuged twice at 4 °C, 300 g for 10 min. Afterward, the pellet was resuspended in 2 mL of buffer I with 10 μL of protease inhibitor cocktail, and the sample was incubated at 4 °C for 10 min followed by centrifugation at 4 °C, 16,000 g for 15 min. Subsequently, the pellet was resuspended in 1 mL of buffer II with 5 μL of protease inhibitor cocktail, and the sample was incubated at 4 °C for 30 min followed by final centrifugation at 4 °C, 16,000 g for 15 min. Lastly, the supernatant containing the MPs was transferred to another tube and stored at −80 °C. Quantification of the extracted protein concentration was determined using a Pierce Rapid Gold BCA Protein Assay kit. A calibration curve using albumin diluted in 1× PBS to the following concentrations was prepared: 0, 25, 125, 250, 500, 750, 1000, and 1500 μg/mL. MPs and extraction buffer II were diluted in 1× PBS 1:5 (v/v). Twenty μL of all samples was loaded in triplicate in a 96-well microplate and mixed with 200 μL of rapid Gold BCA reagent created by mixing reagents A and B 50:1 (v/v). The plate was then covered with aluminum foil and incubated for 10 min. The absorbance was measured at 480 nm with the plate reader.
NPs Synthesis
NPs were synthesized using DPPC, DOPC, and cholesterol (4:3:3 molar ratio) at a final lipid concentration of 9 mM. Lipids were dissolved in ethanol at 28, 22.5, and 11 mg/mL, respectively. All stocks were agitated and sonicated for 5 min at 45 °C. The starting volumes of the lipid solution for liposomes, Leuko1:100 (protein:lipid (w/w)), Leuko1:40 (w/w), and Leuko1:20 (w/w) were 333.33 μL, 94.3 μL of DPPC, 94.3 μL of DOPC, 94.3 μL of cholesterol, and 50.4 μL of ethanol, respectively. For the liposomes, aqueous buffer consisted of 667 μL of Milli-Q water. For all other NP formulations, the aqueous phase was comprised of MPs and Milli-Q water at a final volume of 667 μL. The volume of MPs to be added was based on the protein:lipid ratio (w/w) for each NP formulation. As the lipid mass for 1 mL of formulation equated to 5.8 mg, the following amounts of MPs were added: 0.058 mg for Leuko1:100, 0.145 mg for Leuko1:40, and 0.29 mg for Leuko1:20. The organic phase containing the lipids and the aqueous phase containing the MPs were heated at 45 °C for 3 and 1 min, respectively. The microfluidic cartridge was first cleaned with 4 mL of water (left inlet) and 4 mL of ethanol (right inlet), and the following parameters were used: total volume, 4 mL; flow ratio water:ethanol, 1:1 (v/v); total flow ratio, 4 mL/min; left and right syringe, 5 mL; start waste, 0.15 mL; and end waste, 0.05 mL. Next, the NPs were synthesized by loading the aqueous phase to the left inlet and the organic phase loaded to the right inlet of the cartridge using a 3 mL syringe (left inlet) and 1 mL syringe (right inlet) and using the following parameters: total volume, 1 mL; flow ratio water:ethanol, 2:1 (v/v); total flow ratio, 1 mL/min; start waste, 0.15 mL; and end waste, 0.05 mL.
NP Purification to Remove Unbound Membrane Proteins
After step 2 (Figure 1), the samples were loaded into a 1000 kDa Float-A-Lyzer and dialyzed separately in 1 L of Milli-Q water for each formulation. The buffer was changed after 1 and 3 h, and samples were collected after 19 h. Step 3 (Figure 1) was performed under gentle stirring at 4 °C. The samples were filtered using 0.22 μm PVDF filters after 19 h.
NPs Physiochemical Properties Characterization: Size, PDI, ZP Measurements, and NP Concentration and Stability Test
NP characterization (size, PDI, ZP, and NP concentration) was done. Briefly, size, PDI, and ZP were evaluated using a Malvern Zetasizer (Malvern Panalytical, Westbourough MA). For size and PDI measurements, the samples were diluted in Milli-Q water or 1× PBS 1:100 (v/v), and three measurements of 15 runs each were acquired. For ZP, samples were diluted in Milli-Q water 1:100 (v/v), and three measurements of 10 runs each were acquired. The final value for each sample was obtained by taking the average of the three measurements. The NP concentration was evaluated using a NanoSight NS300 (Malvern Panalytical, Westbourough MA). The samples were diluted in Milli-Q water 1:10000 (v/v) using the following parameters: 25 °C, screen gain, 1; camera level, 13; infusion rate, 100; and flow ratio, 1 mL/min. For each sample, five measurements were acquired with a duration of 60 s each. A detection threshold equal to 7 was used to calculate the final NP concentration. The NPs were stored in Milli-Q water at 4 °C, and characterization was repeated after 1, 3, 14, and 21 days. It should be noted, however, that NP concentration was only measured after 1 and 21 days postsynthesis.
Cryo-EM Sample Preparation
The various NP solutions were vitrified and imaged at the Baylor College of Medicine Cryo-Electron Microscopy Core Facility (BCM, Houston, TX). Quantifoil R2/1 + Cu 200 mesh holey carbon grids were pretreated with a 45 s air-glow discharge to make the carbon surface hydrophilic. Alongside these grids, Quantifoil R2/1 200Cu + 4 nm thin carbon grids were also glow discharged for 10 s to test the efficacy of the added layer of continuous carbon with binding the NP. Vitrification was performed using a Vitrobot Mark IV (FEI, Hillsboro, OR) operated at 18 °C and 100% humidity. Each grid had 3 μL of NP sample applied to it and was blotted for 1–3 s before being immediately submerged in liquid ethane. The frozen grids were then transferred into a JEOL 3200FS microscope (JEOL) outfitted with a Gatan K2 Summit 4k × 4k direct detector (Gatan, Pleasanton, CA) and a postcolumn energy filter set to 30 eV. Before imaging, the microscope was carefully aligned to prevent any beam-induced aberrations or astigmatism that can negatively impact image quality. Images were collected at magnifications of 15,000× and 30,000× with respective pixel sizes of 2.392 and 1.232 Å. Images were collected using an exposure time of 1 s with an approximate dose rate of ∼20e–/Å2/s per image.
SDS Gel and Western Blot Detections
After dialysis, NPs were diluted with Milli-Q water to a final lipid concentration of 6 mM. 150 μL of the samples were used for SDS gel and 300 μL (CD11b, CD18 detection), 600 μL (CD11a detection), 1200 μL (CD45, CD47 detection), and 3000 μL (ACTB, NP62 detection) for Western blot. The samples were centrifuged at 4 °C, 45,000 rpm for 1 h. 2× sample buffer was prepared by mixing 2× Laemmli sample buffer with 2-mercaptoethanol 20:1 (v/v). Then, the NP pellet for SDS gel was resuspended with 40 μL of 1× sample buffer (2× sample buffer mixed with water 1:1 (v/v)). For Western blot, the pellet was resuspended with 2.5% SDS samples buffer (2× sample buffer mixed with 30% SDS and water) for CD11b and CD18, and 5% SDS samples buffer for CD11a, as the final concentration of SDS. For CD45, CD47, ACTB, and NP62 detection, proteins in the pellets were purified and extracted with chloroform and methanol. Briefly, the NP pellets were resuspended with 50 μL of Milli-Q water, followed by gently mixing with 400 μL of methanol and 100 μL of chloroform. After centrifugation at 15000 g for 2 min, 400 μL of methanol was added and then centrifuged again. The protein pellets were dried by removing the supernatant, and the protein pellets were dissolved in the 1× sample buffer. Samples were denatured at 95 °C for 7 min. For SDS gel, 5 μg of MPs were resuspended in 1× sample buffer, while for the Western blot, 10 μg (CD11b, CD18) and 20 μg (CD11a) of MP were resuspended with each SDS sample buffer, and 40 μg (CD47) and 60 μg (CD45, ACTB, NP62) of MP were resuspended with 1× sample buffer. 10% Mini-PROTEAN TGX Precast protein gel was used for both SDS gel and Western blot and run on ice for approximately 2 h at 100 V.
The SDS gel was washed three times for 5 min with Milli-Q. Then, SimplyBlue SafeStain (Invitrogen, Carlsbad CA) was added, and the gel remained under constant agitation overnight at 4 °C. Finally, the gel was washed with Milli-Q water three times for 10 min. To enhance the staining contrast, sodium chloride was added during the final wash. The analysis of the gel was done using the ChemiDoc XRS+ System. For the Western blot, the gel was transferred to the membrane using the Trans-Blot Turbo Transfer System. The membrane was incubated under agitation at room temperature with 5% nonfat milk in 0.1% Tween 20 in TBS (TBST) for 1 h. Finally, the 5% nonfat milk was removed, and MP markers (CD11a, CD11b, CD18, CD45, CD47, ACTB, and NP62) were detected by incubating the membrane using the following primary antibodies: rabbit anti-CD11a (LS-C331613) (diluted with milk 1:500 (v/v)), rat anti-CD11b (MAB11241) (diluted with milk 1:3000 (v/v)), goat anti-CD18 (AF2618) (diluted with milk 1:3000 (v/v)), rabbit anti-CD45 (EPR20033) (diluted with milk 1:1000 (v/v)), goat anti-CD47 (ab108415) (diluted with milk 1:1000 (v/v)), mouse anti-ACTB (A5441) (diluted with milk 1:1000 (v/v)), and mouse anti-NP62(sc-48389) (diluted with milk 1:100 (v/v)) in agitation at 4 °C overnight. After washing with TBST, the membranes were incubated under agitation at room temperature with the following secondary antibodies antirabbit IgG-HRP (diluted with milk 1:1000 (v/v)), antigoat IgG-HRP (diluted with milk 1:1000 (v/v)), antirat IgG (diluted with milk 1:1000 (v/v)), and antimouse IgG (diluted with milk 1:1000 (v/v)) for 1 h. Afterward, membranes were incubated in western ECL substrate using the Clarity Max Western Peroxide and the Clarity Max Western Luminol/Enhancer reagents 1:1 (v/v) for 5 min while covered with aluminum foil. Finally, MPs were detected using the ChemiDoc XRS+ System with the following exposures times: 600 s for CD11a, 240 s for CD11b, 240 s for CD18, 600 s for CD45, 360 s for CD47, 5 s for ACTB, and 50 s for NP62.
NP Cytotoxicity
Prior to seeding, well plates were coated with gelatin coating solution, incubated for 30 min at 37 °C, and excess coating solution removed. Murine endothelial cells were seeded in complete media in a 96-well plate at a seeding density of 8000 cells/well. After 24 h, NPs were resuspended in complete media and added to the cells at the following concentrations: 10, 50, 100, 250, and 500 μM. These concentrations were based on the lipid concentration of the NPs after synthesis. Following a 24 h incubation with the NPs, media was aspirated and replaced with MTT resuspended in completed media at a concentration of 0.5 mg/mL. After 2 h, the MTT reagent was aspirated and replaced with an equal volume of DMSO. Following 30 min of gentle agitation at room temperature, absorbance was measured at 570 nm with reference wavelength of 630 nm.
Confocal Imaging of NP Uptake
Prior to seeding, chamber slides were coated with gelatin coating solution, incubated for 30 min at 37 °C, and excess coating solution removed. Murine endothelial cells were seeded in complete media in 8-well chamber slides at a seeding density of 10,000 cells/well. After 24 h, media was replaced with fresh media resuspended with LPS (Millipore Sigma, St. Louis, MO) at a concentration of 100 ng/mL. Following a 24 h incubation with LPS, cells were washed with 1× PBS and treated with rhodamine-labeled NPs resuspended in complete media at a concentration of 100 μM. After 1 h, cells were washed with 1× PBS, fixed with 4% PFA, and stained with WGA-Alexa 488 (Invitrogen, Carlsbad CA) and DAPI. Slides were then imaged on a Leica.
Flow Cytometry of NP Uptake
Prior to seeding, well plates were coated with gelatin coating solution, incubated for 30 min at 37 °C, and excess coating solution removed. Murine endothelial cells were seeded in complete media in 24-well plates at a seeding density of 50,000 cells/well. After 24 h, the media was replaced with fresh media resuspended with LPS at a concentration of 100 ng/mL. Following a 24 h incubation with LPS, cells were washed with 1× PBS and treated with rhodamine-labeled NPs resuspended in complete media at a concentration of 100 μM. After 1 h, cells were detached using TrypLExpress, spun down, and washed with 1× PBS. Cells were collected into flow cytometry tubes and run on BD LSRII flow cytometer.
In Vivo Targeting and Biodistribution Experiments
All animal experiments were performed in accordance with the guidelines of the Animal Welfare Act and the Guide for the Care and Use of Laboratory Animals approved by The Houston Methodist Institutional Animal Care and Use Committee guidelines (Houston, TX). The LLI model was generated with BALB/c mice (6–8 weeks years old and 25 g) (Charles River Laboratories, Wilmington, MA) by a one-time injection of LPS (50 μg) in the right ear. 100 μL of Cy5.5-labeled NPs was administrated via tail vein injection 30 min after LPS administration. Mice were prepared for IVIS at 3, 6, and 8 h after particle injection to assess targeting and biodistribution. IVIS image acquisition parameters were the following: Em = 720, Ex = 640, Epi-illumination, Bin:(HR)4, FOV: 18.4, f2, 0.5 s. After 8 h, ears, heart, lungs, liver, spleen, kidneys, and blood were collected and imaged on the IVIS. Quantification of IVIS images was done using the Living Image software.
The TNBC model was established by injecting a total of 3 × 10⁵ 4T1-Red-FLuc (PerkinElmer, Waltham MA) cells, suspended in 50 μL of 1× PBS, subcutaneously into the mammary fat pad of 10-week-old BALB/c female mice (Charles River Laboratories, Wilmington, MA). Approximately 14 days following tumor cell injection, tumor size was verified using luminescence imaging prior to NP injection. Mice were injected intraperitoneally with luciferin (10 mg/kg) and imaged 10 min postinjection. 100 μL of Cy7-labeled NP was administrated via tail vein injection, and animals were imaged on IVIS after 3, 6, 8, and 24 h. IVIS image acquisition parameters were the following: Em = 820, Ex = 745, Epi-illumination, Bin:(HR)4, FOV: 18.4, f2, 1s. After 24 h, ears, heart, lungs, liver, spleen, kidneys, and blood were collected and imaged on the IVIS. Quantification of IVIS images was done using the Living Image software. IVM imaging of the tumor was perfomed with an upright Nikon A1R laser scanning confocal microscope with a resonance scanner, motorized and heated stage, and Nikon long-working distance 4X and 20X dry plan-apochromat objectives. IVM images were analyzed with Nikon Elements software.
Histological Sample Preparation and Imaging
Tissue samples from the lungs, spleen, liver, kidneys, and heart from the LLI mice were washed using 1× PBS and then fixed using 10% natural buffer formalin. Samples were stored at 4 °C for 24 h before they were paraffin embedded, axial sectioned, and H&E stained. The slides were imaged using Keyence BZ-X810 microscope.
Acknowledgments
We would like to Dr. Omid Veiseh for his mentorship, support, and valuable feedback on this work. We thank Ms. Eliana Stetco and Dr. Christian Boada for their help in the in vitro and in vivo experiments and Mr. Forrester Isaac of the CryoEM Core at Baylor College of Medicine, Houston, TX for assistance with TEM imaging. We would also like to thank the Houston Methodist Research Institute’s Flow Cytometry Core and the Intravital Imaging Core for providing the use of these vital resources and providing technical assistance. Figures 1 and 4 and Figures S2 and S4 were created with Biorender.com.
Supporting Information Available
The Supporting Information is available free of charge at https://pubs.acs.org/doi/10.1021/acsnano.0c05792.
Effect of protein buffer on NP size (Figure S1). Native protein:lipid ratio (Figure S2). NP biomimetic markers, original WB membranes, and quantification (Figure S3). CD11b orientation studies revealed equal distribution of these cytoplasmic and exoplasmic parts (Figure S4). 21-day NP storage stability studies (Figure S5). Gating strategy for flow cytometry analysis of NP uptake (Figure S6). Non-inflamed and LPS-inflamed endothelial cells (Figure S7). In vitro association and uptake of biomimetic NP by non-inflamed murine endothelial cells (Figure S8). Percentage of positive cells in singlet gate of inflamed treated cells (Figure S9). Ex vivo imaging of left and right ears for biomimetic NP targeting in a LLI model (Figure S10). TNBC tumor luminescence quantification (Figure S11). In vivo biomimetic NP liver accumulation in TNBC model (Figure S12). Ex vivo imaging of TNBC tumors for NP accumulation after 24 h (Figure S13). Intravital microscopy for NP accumulation in inflamed vasculature of TNBC mice (Figure S14). Biomimetic NP accumulation in heart, lungs, and spleen in LLI model after 8 h (Figure S15). Biomimetic NP accumulation in liver, kidneys, and blood in LLI model after 8 h (Figure S16). Biomimetic NP accumulation in heart, lungs, spleen, liver, kidneys, and blood of TNBC tumor-bearing mice after 24 h (Figure S17). Image analysis of collagen fibers workflow (Figure S18) (PDF)
Author Contributions
# These authors contributed equally to this work.
Author Contributions
A.Z. conceived this research. A.Z., M.S., and T.N. designed the experiments and processed and analyzed the data. A.Z., T.N., and G.B. synthesized and characterized the NPs. A.Z. and M.S. performed the in vitro toxicity, uptake, and imaging experiments. A.Z., M.S., and T.N. performed the in vivo studies. A.Z., M.S. and E.DR. planned and performed the IVM studies. A.Z., M.S., G.B., E.DR. and F.T. wrote and edited this manuscript. F.T., J.C., and E.T. provided resources, funding acquisition, supervision, and administration. All authors reviewed, revised, and approved the final manuscript.
This work was supported by funding from the NCI and the Office of Women’s Health (1R56CA213859), NCI and the NIH Ruth L. Kirschstein Research Service Award (F31CA232705), Cancer Prevention Institute of Texas (RP170466), and the Kleberg Foundation.
The authors declare no competing financial interest.
Supplementary Material
References
- Patra J. K.; Das G.; Fraceto L. F.; Campos E. V. R.; Rodriguez-Torres M. d. P.; Acosta-Torres L. S.; Diaz-Torres L. A.; Grillo R.; Swamy M. K.; Sharma S.; Habtemariam S.; Shin H.-S. Nano Based Drug Delivery Systems: Recent Developments and Future Prospects. J. Nanobiotechnol. 2018, 16, 71. 10.1186/s12951-018-0392-8. [DOI] [PMC free article] [PubMed] [Google Scholar]
- Blanco E.; Shen H.; Ferrari M. Principles of Nanoparticle Design for Overcoming Biological Barriers to Drug Delivery. Nat. Biotechnol. 2015, 33, 941–951. 10.1038/nbt.3330. [DOI] [PMC free article] [PubMed] [Google Scholar]
- Alexis F.; Pridgen E.; Molnar L. K.; Farokhzad O. C. Factors Affecting the Clearance and Biodistribution of Polymeric Nanoparticles. Mol. Pharmaceutics 2008, 5, 505–515. 10.1021/mp800051m. [DOI] [PMC free article] [PubMed] [Google Scholar]
- Zinger A.; Koren L.; Adir O.; Poley M.; Alyan M.; Yaari Z.; Noor N.; Krinsky N.; Simon A.; Gibori H.; Krayem M.; Mumblat Y.; Kasten S.; Ofir S.; Fridman E.; Milman N.; Lubtow M. M.; Liba L.; Shklover J.; Shainsky-Roitman J.; et al. Collagenase Nanoparticles Enhance the Penetration of Drugs into Pancreatic Tumors. ACS Nano 2019, 13, 11008–11021. 10.1021/acsnano.9b02395. [DOI] [PMC free article] [PubMed] [Google Scholar]
- Pelaz B.; del Pino P.; Maffre P.; Hartmann R.; Gallego M.; Rivera-Fernandez S.; de la Fuente J. M.; Nienhaus G. U.; Parak W. J. Surface Functionalization of Nanoparticles with Polyethylene Glycol: Effects on Protein Adsorption and Cellular Uptake. ACS Nano 2015, 9, 6996–7008. 10.1021/acsnano.5b01326. [DOI] [PubMed] [Google Scholar]
- Alkilany A. M.; Zhu L.; Weller H.; Mews A.; Parak W. J.; Barz M.; Feliu N. Ligand Density on Nanoparticles: A Parameter with Critical Impact on Nanomedicine. Adv. Drug Delivery Rev. 2019, 143, 22–36. 10.1016/j.addr.2019.05.010. [DOI] [PubMed] [Google Scholar]
- Sroda K.; Rydlewski J.; Langner M.; Kozubek A.; Grzybek M.; Sikorski A. F. Repeated Injections of Peg-Pe Liposomes Generate Anti-Peg Antibodies. Cell Mol. Biol. Lett. 2005, 10, 37–47. [PubMed] [Google Scholar]
- Rodriguez P. L.; Harada T.; Christian D. A.; Pantano D. A.; Tsai R. K.; Discher D. E. Minimal″ Self″ Peptides That Inhibit Phagocytic Clearance and Enhance Delivery of Nanoparticles. Science 2013, 339, 971–975. 10.1126/science.1229568. [DOI] [PMC free article] [PubMed] [Google Scholar]
- Zinger A.; Brozovich A.; Pasto A.; Sushnitha M.; Martinez J. O.; Evangelopoulos M.; Boada C.; Tasciotti E.; Taraballi F. Bioinspired Extracellular Vesicles: Lessons Learned from Nature for Biomedicine and Bioengineering. Nanomaterials 2020, 10, 2172. 10.3390/nano10112172. [DOI] [PMC free article] [PubMed] [Google Scholar]
- Ben-Akiva E.; Meyer R. A.; Yu H.; Smith J. T.; Pardoll D. M.; Green J. J. Biomimetic Anisotropic Polymeric Nanoparticles Coated with Red Blood Cell Membranes for Enhanced Circulation and Toxin Removal. Science Advances 2020, 6, eaay9035 10.1126/sciadv.aay9035. [DOI] [PMC free article] [PubMed] [Google Scholar]
- Molinaro R.; Martinez J. O.; Zinger A.; De Vita A.; Storci G.; Arrighetti N.; De Rosa E.; Hartman K. A.; Basu N.; Taghipour N.; Corbo C.; Tasciotti E. Leukocyte-Mimicking Nanovesicles for Effective Doxorubicin Delivery to Treat Breast Cancer and Melanoma. Biomater. Sci. 2020, 8, 333–341. 10.1039/C9BM01766F. [DOI] [PubMed] [Google Scholar]
- Xie W.; Deng W. W.; Zan M.; Rao L.; Yu G. T.; Zhu D. M.; Wu W. T.; Chen B.; Ji L. W.; Chen L.; Liu K.; Guo S. S.; Huang H. M.; Zhang W. F.; Zhao X.; Yuan Y.; Dong W.; Sun Z. J.; Liu W. Cancer Cell Membrane Camouflaged Nanoparticles to Realize Starvation Therapy Together with Checkpoint Blockades for Enhancing Cancer Therapy. ACS Nano 2019, 13, 2849–2857. 10.1021/acsnano.8b03788. [DOI] [PubMed] [Google Scholar]
- Parodi A.; Molinaro R.; Sushnitha M.; Evangelopoulos M.; Martinez J. O.; Arrighetti N.; Corbo C.; Tasciotti E. Bio-Inspired Engineering of Cell- and Virus-Like Nanoparticles for Drug Delivery. Biomaterials 2017, 147, 155–168. 10.1016/j.biomaterials.2017.09.020. [DOI] [PubMed] [Google Scholar]
- Sushnitha M.; Evangelopoulos M.; Tasciotti E.; Taraballi F. Cell Membrane-Based Biomimetic Nanoparticles and the Immune System: Immunomodulatory Interactions to Therapeutic Applications. Front. Bioeng. Biotechnol. 2020, 8, 627. 10.3389/fbioe.2020.00627. [DOI] [PMC free article] [PubMed] [Google Scholar]
- Hu C. M.; Fang R. H.; Copp J.; Luk B. T.; Zhang L. A Biomimetic Nanosponge That Absorbs Pore-Forming Toxins. Nat. Nanotechnol. 2013, 8, 336–340. 10.1038/nnano.2013.54. [DOI] [PMC free article] [PubMed] [Google Scholar]
- Sun H.; Su J.; Meng Q.; Yin Q.; Chen L.; Gu W.; Zhang P.; Zhang Z.; Yu H.; Wang S.; Li Y. Cancer-Cell-Biomimetic Nanoparticles for Targeted Therapy of Homotypic Tumors. Adv. Mater. 2016, 28, 9581–9588. 10.1002/adma.201602173. [DOI] [PubMed] [Google Scholar]
- Molinaro R.; Corbo C.; Martinez J. O.; Taraballi F.; Evangelopoulos M.; Minardi S.; Yazdi I. K.; Zhao P.; De Rosa E.; Sherman M. B.; De Vita A.; Toledano Furman N. E.; Wang X.; Parodi A.; Tasciotti E. Biomimetic Proteolipid Vesicles for Targeting Inflamed Tissues. Nat. Mater. 2016, 15, 1037–1046. 10.1038/nmat4644. [DOI] [PMC free article] [PubMed] [Google Scholar]
- Zinger A.; Baudo G.; Naoi T.; Giordano F.; Lenna S.; Massaro M.; Ewing A.; Kim H. R.; Tasciotti E.; Yustein J. T.; Taraballi F. Reproducible and Characterized Method for Ponatinib Encapsulation into Biomimetic Lipid Nanoparticles as a Platform for Multi-Tyrosine Kinase-Targeted Therapy. ACS Applied Bio Materials 2020, 3, 6737–6745. 10.1021/acsabm.0c00685. [DOI] [PubMed] [Google Scholar]
- Molinaro R.; Evangelopoulos M.; Hoffman J. R.; Corbo C.; Taraballi F.; Martinez J. O.; Hartman K. A.; Cosco D.; Costa G.; Romeo I.; Sherman M.; Paolino D.; Alcaro S.; Tasciotti E. Design and Development of Biomimetic Nanovesicles Using a Microfluidic Approach. Adv. Mater. 2018, 30, 1702749 10.1002/adma.201702749. [DOI] [PubMed] [Google Scholar]
- Zook J. M.; Vreeland W. N. Effects of Temperature, Acyl Chain Length, and Flow-Rate Ratio on Liposome Formation and Size in a Microfluidic Hydrodynamic Focusing Device. Soft Matter 2010, 6, 1352–1360. 10.1039/b923299k. [DOI] [Google Scholar]
- Dimov N.; Kastner E.; Hussain M.; Perrie Y.; Szita N. Formation and Purification of Tailored Liposomes for Drug Delivery Using a Module-Based Micro Continuous-Flow System. Sci. Rep. 2017, 7, 12045. 10.1038/s41598-017-11533-1. [DOI] [PMC free article] [PubMed] [Google Scholar]
- Martinez J. O.; Molinaro R.; Hartman K. A.; Boada C.; Sukhovershin R.; De Rosa E.; Kuri D.; Zhang S.; Evangelopoulos M.; Carter A. M.; Bibb J. A.; Cooke J. P.; Tasciotti E. Biomimetic Nanoparticles with Enhanced Affinity Towards Activated Endothelium as Versatile Tools for Theranostic Drug Delivery. Theranostics 2018, 8, 1131–1145. 10.7150/thno.22078. [DOI] [PMC free article] [PubMed] [Google Scholar]
- Dudley A. C. Tumor Endothelial Cells. Cold Spring Harbor Perspect. Med. 2012, 2, a006536. 10.1101/cshperspect.a006536. [DOI] [PMC free article] [PubMed] [Google Scholar]
- Schouten M.; Wiersinga W. J.; Levi M.; van der Poll T. Inflammation, Endothelium, and Coagulation in Sepsis. J. Leukocyte Biol. 2008, 83, 536–545. 10.1189/jlb.0607373. [DOI] [PubMed] [Google Scholar]
- Stanimirovic D.; Satoh K. Inflammatory Mediators of Cerebral Endothelium: A Role in Ischemic Brain Inflammation. Brain Pathol. 2000, 10, 113–126. 10.1111/j.1750-3639.2000.tb00248.x. [DOI] [PMC free article] [PubMed] [Google Scholar]
- Gimbrone M. A. Jr.; Garcia-Cardena G. Endothelial Cell Dysfunction and the Pathobiology of Atherosclerosis. Circ. Res. 2016, 118, 620–636. 10.1161/CIRCRESAHA.115.306301. [DOI] [PMC free article] [PubMed] [Google Scholar]
- Nourshargh S.; Alon R. Leukocyte Migration into Inflamed Tissues. Immunity 2014, 41, 694–707. 10.1016/j.immuni.2014.10.008. [DOI] [PubMed] [Google Scholar]
- Bünger S.; Roblick U. J.; Habermann J. K. Comparison of Five Commercial Extraction Kits for Subsequent Membrane Protein Profiling. Cytotechnology 2009, 61, 153–159. 10.1007/s10616-009-9249-1. [DOI] [PMC free article] [PubMed] [Google Scholar]
- Danaei M.; Dehghankhold M.; Ataei S.; Hasanzadeh Davarani F.; Javanmard R.; Dokhani A.; Khorasani S.; Mozafari M. R. Impact of Particle Size and Polydispersity Index on the Clinical Applications of Lipidic Nanocarrier Systems. Pharmaceutics 2018, 10, 57. 10.3390/pharmaceutics10020057. [DOI] [PMC free article] [PubMed] [Google Scholar]
- Rodriguez P. L.; Harada T.; Christian D. A.; Pantano D. A.; Tsai R. K.; Discher D. E. Minimal ″Self″ Peptides That Inhibit Phagocytic Clearance and Enhance Delivery of Nanoparticles. Science 2013, 339, 971–975. 10.1126/science.1229568. [DOI] [PMC free article] [PubMed] [Google Scholar]
- Ley K. Molecular Mechanisms of Leukocyte Recruitment in the Inflammatory Process. Cardiovasc. Res. 1996, 32, 733–742. 10.1016/0008-6363(96)00066-1. [DOI] [PubMed] [Google Scholar]
- Ley K.; Laudanna C.; Cybulsky M. I.; Nourshargh S. Getting to the Site of Inflammation: The Leukocyte Adhesion Cascade Updated. Nat. Rev. Immunol. 2007, 7, 678–689. 10.1038/nri2156. [DOI] [PubMed] [Google Scholar]
- Arango Duque G.; Descoteaux A. Macrophages Tell the Non-Professionals What to Do. Dev. Cell 2016, 39, 633–635. 10.1016/j.devcel.2016.12.009. [DOI] [PubMed] [Google Scholar]
- Vestweber D. How Leukocytes Cross the Vascular Endothelium. Nat. Rev. Immunol. 2015, 15, 692–704. 10.1038/nri3908. [DOI] [PubMed] [Google Scholar]
Associated Data
This section collects any data citations, data availability statements, or supplementary materials included in this article.