

Abstract
Transposable elements (TEs) are major components of eukaryotic genomes and represent approximately 45% of the human genome. TEs can be important sources of novelty in genomes and there is increasing evidence that TEs contribute to the evolution of gene regulation in mammals. Gene duplication is an evolutionary mechanism that also provides new genetic material and opportunities to acquire new functions. To investigate how duplicated genes are maintained in genomes, here, we explored the TE environment of duplicated and singleton genes. We found that singleton genes have more short-interspersed nuclear elements and DNA transposons in their vicinity than duplicated genes, whereas long-interspersed nuclear elements and long-terminal repeat retrotransposons have accumulated more near duplicated genes. We also discovered that this result is highly associated with the degree of essentiality of the genes with an unexpected accumulation of short-interspersed nuclear elements and DNA transposons around the more-essential genes. Our results underline the importance of taking into account the TE environment of genes to better understand how duplicated genes are maintained in genomes.
Keywords: transposable elements, gene duplication, essential genes, gene evolution, SINE, LINE
Significance
Gene duplication is a major mechanism in the evolution of genomes, because it results in the appearance of new genes often with new functions. Transposable elements (TEs) represent 45% of the human genome and these repeated sequences contribute to the evolution of gene regulation in mammals in different ways. However, it is not known to what extent TEs are involved in the maintenance of genes after duplication. In this study, we show that classes of TEs have accumulated differently in the environments of duplicated genes than in the environments of singleton genes. The differences observed are associated with how essential the genes are. Our results point to possible roles for TEs in both the maintenance of human genes after duplication and the acquisition of gene essentiality.
Introduction
Transposable elements (TEs) are repeated genomic sequences that have the intrinsic capacity to multiply and move within genomes. They are a major component of eukaryotic genomes (Petersen et al. 2019; Wu and Lu 2019). For example, in fish, TEs represent 6% of the genome in the pufferfish Tetraodon nigroviridis but more than 55% in the zebrafish Danio rerio, whereas in mammals, the genome of the opossum Monodelphis domestica has the highest known proportion of TE sequences which compares with the human genome with approximately 45% (Lander et al. 2001; Cordaux and Batzer 2009; Chalopin et al. 2015). TEs can be divided into two major classes based on their mechanism of transposition. DNA transposons move by “cutting and pasting” a DNA intermediate whereas retrotransposons transpose through RNA intermediates in a “copy and paste” mechanism. Retrotransposons can be subdivided into two groups according to the presence or absence of long-terminal repeats (LTRs) (Wicker et al. 2007). Among the non-LTR retrotransposons, the autonomous long-interspersed nuclear elements (LINEs) and the nonautonomous short-interspersed nuclear elements (SINEs) can be distinguished.
The distribution of TEs in genomes is not random and can depend on recombination rates, gene density, and selective pressure (Lander et al. 2001; Rizzon et al. 2002; Tian et al. 2009; Zhang and Mager 2012; Kent et al. 2017). Nevertheless, TEs can move and insert virtually everywhere in a genome, so they can disrupt genes directly (Van Zelm et al. 2008), and once inserted can induce chromosomal rearrangements between regions with homologous TEs. Both types of events are expected to be under purifying selection to remove deleterious insertions (Kent et al. 2017). When TEs are inserted near genes (or regulatory regions) they may modify gene regulation. For example, the insertion of TEs into or near promoter regions can alter the normal pattern of gene expression (Lerat and Sémon 2007; Cordaux and Batzer 2009). Jordan et al. (2003) showed that in the human genome almost 25% of the analyzed promoter regions contain TE-derived sequences. Since then, much evidence has accumulated supporting the idea that TEs have contributed to the evolution of gene regulation in mammals (Lowe et al. 2007; Jacques et al. 2013; Sundaram et al. 2014; Trizzino et al. 2018). TEs are also found in protein-coding regions of genes. For example, around 4% of protein-coding human genes have intraexonic TEs (Nekrutenko and Li 2001). Entire new protein-coding genes can even be derived from TEs through molecular domestication (Sinzelle et al. 2009; Chénais et al. 2012). The case of the Recombination-Activating Gene 1 (RAG1) protein involved in V(D)J recombination in jaw vertebrates is a well-characterized example. There is evidence that the core of the RAG1 protein was derived from the transposase of the Transib DNA transposon (Kapitonov and Jurka 2005; Zhang et al. 2019). TEs can thus be an important source of novelty in genomes.
Another important way that genetic novelty arises in genomes is through gene duplication. Whether one gene is duplicated at a time or a whole genome, new genetic material is generated providing opportunities to evolve and acquire new functions (Ohno 1970; Zhang 2003; Conant and Wolfe 2008; Kondrashov 2012). Duplicated gene copies are mostly lost or pseudogenized after accumulating deleterious mutations (Lynch and Conery 2000; Jaillon et al. 2009; Naseeb et al. 2017). However, in some cases, duplicated genes are fixed and maintained in the genome. Examples are the odorant receptor genes in vertebrates (Kratz et al. 2002; Niimura and Nei 2003) and the unrelated but functionally analogous odorant receptor genes in ants (McKenzie and Kronauer 2018), which mostly appeared through tandem duplications.
Duplicated genes may therefore represent a significant part of genomes (Zhang 2003). Three main models help explain how duplicated genes are preserved in genomes. In the Ohno’s neofunctionalization model (Ohno 1970), one of the copies of a duplicated gene evolves toward a novel function whereas the ancestral function is maintained in the other. The subfunctionalization model differs by positing that mutations accumulate in the two copies such that both are necessary to provide the ancestral function (Ohno 1970; Force et al. 1999). Gene dosage models, by contrast, consider that any beneficial increase in dosage can be positively selected, like certain genes that control responses to stress (Kondrashov et al. 2002). Gene dosage models also account for dosage balance, mostly observed when the whole genome is duplicated, where the optimal dosage of duplicated genes is non-independent and both copies are maintained because deletion of either one would be deleterious (Conant and Wolfe 2008; Innan and Kondrashov 2010; Konrad et al. 2011).
There is strong evidence that two rounds of whole-genome duplications (WGD) occurred early in vertebrate evolution (McLysaght et al. 2002; Dehal and Boore 2005; Nakatani et al. 2007; Singh et al. 2015). Between 46% and 76% of human protein-coding genes are estimated to be duplicated genes (Shoja and Zhang 2006; Pan and Zhang 2008; Singh et al. 2014; Acharya and Ghosh 2016). Indeed, 30% of the protein-coding genes can be designated as having been duplicated as a result of these WGD events (McLysaght et al. 2002; Makino and McLysaght 2010; Singh et al. 2015). Aside from WGD, small-scale duplication can occur at any time through segmental duplication (Jiang et al. 2007; Marques-Bonet et al. 2009) and tandem duplication (Zhang et al. 2011; Lan and Pritchard 2016), both involving mostly homologous or non-homologous recombination (Zhang 2003) or messenger RNA-derived duplication also named retroposition (Zhang 2003; Carelli et al. 2016). In the retroposition mechanism, the messenger RNA from a host gene is reverse transcribed into a cDNA then inserted in another location of the genome via enzymes encoded by a retrotransposon (Lallemand et al. 2020). Messenger RNA-derived duplications have been discovered in different organisms including mammals. A specific example in hominoids is the glutamate dehydrogenase gene 2 (GLUD2) which originated by retroposition from GLUD1 in the hominoid ancestor (Burki and Kaessmann 2004). GLUD1 is expressed in many tissues whereas GLUD2 is specifically expressed in nerve tissues and in testis (Shashidharan et al. 1994). In the human genome, according to different studies, between 3,771 and 18,700 retropositions have been identified and an estimated 120–692 of them are likely to be functional genes (Casola and Betrán 2017).
Among the factors favoring gene duplication, Alu repeats (which are SINE) have been shown to increase local recombination rates (Witherspoon et al. 2009; Guo et al. 2011) and to be involved in segmental duplication through alu–alu mediated recombination events (Bailey et al. 2003; Zhou and Mishra 2005). This suggests that TEs could cause expansion and/or contraction of gene families (Hahn et al. 2007). For example, links between the presence of TEs and expansion of the Abp gene family in mouse have been described (Janoušek et al. 2013). Recently, a significant association was found between the presence of LINEs and LTR retrotransposons, and lineage-specific gene family expansions in both the human and mouse genomes. They hypothesized that LINEs could play a structural role by promoting gene duplication and that LTR retrotransposons would have a role in the maintenance of duplicated genes through their involvement in reshaping gene regulatory networks (Janoušek et al. 2016).
Given that TEs are now acknowledged as major contributors to genome evolution (Kidwell and Lisch 2000; Biémont and Vieira 2006) having an influence on genome structure (Chalopin et al. 2015), in this study, we explored the role of TEs in the evolution of duplicated genes in the human genome. For this, we focused on the following questions. Is the TE context different in terms of TE density and composition between duplicated genes, that are members of gene families, and those that are not, the so-called singleton genes? Can the observed patterns of TE density around duplicated and singleton genes be explained by selective pressure, GC content, gene length, and/or gene function? We also took advantage of the growing amount of available data on cell-essential genes to ask a third question. Could TEs be somehow associated with gene essentiality considering the duplication status of the genes?
Our study showed that proportionally more TEs, mainly SINEs and DNA transposons, have accumulated in the vicinity of singleton genes than in the vicinity of duplicated genes. Unexpectedly, we also discovered that more SINE elements and DNA transposons have accumulated in the more-essential genes.
Results
TEs Accumulate in Singleton Genes Compared with Duplicated Genes Independently of Selection Pressure and GC Content
Duplicated Genes and TE Number and Distribution
Protein sequences from the human reference genome (Ensembl hg38) were used to define the duplication status of 20,213 protein-coding genes (see Materials and Methods). Three datasets with different levels of stringency for the definition of duplicated genes were generated. The criteria defining homologous gene sets were of medium stringency for dataset 1 and we will mainly focus on this dataset, while highlighting notable differences observed with the more stringent dataset 2 and the less stringent dataset 3. The distribution of duplicated and singleton genes for each dataset is shown in table 1.
Table 1.
Numbers of Duplicated and Singleton Genes for the Three Human Datasets
| Dataset 1 | Dataset 2 | Dataset 3 | |
|---|---|---|---|
| Duplicated | 10,885 (53.9%) | 9,299 (46%) | 13,240 (65.5%) |
| Singleton | 9,328 (46.1%) | 10,914 (54%) | 6,973 (34.5%) |
| Total | 20,213 | 20,213 | 20,213 |
Before computing the TE environment of each gene, we sought to verify whether any structural bias between duplicated and singleton genes could confound our analyses. It has indeed been shown in plants that orthologs have accumulated significantly fewer structural differences than paralogs (Xu et al. 2012). Moreover, in mammalian gene introns, TE density decreases significantly near exons (Lev-Maor et al. 2008; Zhang et al. 2011), suggesting that overall TE density would be lower for genes with a higher density of exons. We thus tested whether the fraction of the gene length corresponding to introns differed between duplicated and singleton genes. We defined exonic regions as gene regions that correspond to an exon in at least one spliced variant, and intronic regions as the regions between exonic regions (see Materials and Methods). No significant difference in intronic fraction was detected (Wilcoxon test, P value = 0.77, supplementary fig. S1 and table S1, Supplementary Material online) except when considering the least stringently defined gene sets. Specifically, the intronic fraction was significantly larger for singleton genes compared with duplicated genes (Wilcoxon test, dataset 3, P value = 0.002 with Bonferonni correction, supplementary fig. S1C and table S1, Supplementary Material online). The median number of exonic regions is therefore nine for both duplicated and singleton genes. However, for the less stringently defined gene set, the median number of exonic regions is eight for singleton genes, but nine for duplicated genes. The median gene length was longer for duplicated compared with singleton genes although not at a significant level (Wilcoxon test, P value = 0.2432, supplementary fig. S2 and table S1, Supplementary Material online) except for the least stringently defined gene set (Wilcoxon test, dataset 3, P value = 1.9 × 10⁻⁶ with Bonferonni correction, supplementary fig. S2C and table S1, Supplementary Material online). To summarize, a structural bias between duplicated and singleton genes can be detected for one of the definitions of duplicated genes. We thus decided to take into account the exon–intron structure of genes when computing the TE environment of genes.
In human tissue-specific genes, TE density is on average greater in intronic regions than in exonic regions, indicating that the exons are more resistant to TE insertions because of functional constraints (Jin et al. 2012). We thus computed the TE environment of genes considering the intron–exon structure of genes with two measures: TE density and TE coverage (as fraction of sequence length). TE density and TE coverage were computed taking into account the flanking regions and intronic regions of genes but not exonic regions (see Materials and Methods). Please note, that in all the results, we refer to “2-kb (or 10-kb) flanking region” as the contiguous sequence going from 2 kb (or 10 kb) upstream of a gene to 2 kb (or 10 kb) downstream of the gene including the gene itself. The exonic sequences within these regions were not considered (see Materials and Methods).
The total numbers of TEs found in the environment of genes correspond to 826,444 and 967,135 insertions for 2- and 10-kb flanking regions respectively (see Materials and Methods and supplementary table S2, Supplementary Material online). Among the 20,213 genes included in the datasets, 833 and 76 genes did not contain any TEs inside and in their 2- and 10-kb flanking regions respectively. Table 2 shows how the four TE categories are distributed in and around genes according to the different sizes of flanking regions. SINEs were the most represented TEs in the human genome as a whole and in the environment of genes. In contrast, DNA transposons were the least common TE class. The distribution of TEs in terms of TE number is different in the gene environment relative to the global genome (2-kb flanking regions, χ2 = 26,436, df = 3, P value < 2.2 × 10⁻¹⁶; 10-kb flanking regions, χ2 = 28,026, df = 3, P value < 2.2 × 10⁻¹⁶). SINEs and DNA TEs are more concentrated in the gene environment compared with the total genome whereas LTR retrotransposons and LINE are less concentrated (supplementary tables S3–S5, Supplementary Material online). These values are consistent with previously reported results (Lander et al. 2001; Kidwell 2002; Cordaux and Batzer 2009; Bailly-Bechet et al. 2014).
Table 2.
Distribution of TE Classes Throughout the Entire Genome Compared with within Gene Environments, That Is Genes Plus Their Respective 2- and 10-kb Flanking Regions
| Genome | 2-kb | 2-kb | 10-kb | 10-kb | |
|---|---|---|---|---|---|
| TE Class | No. of Insertions (%) | No. of Insertions (%) | Length in % | No. of Insertions (%) | Length in % |
| DNA | 114,669 (6.78) | 59,394 (7.19) | 6.95 | 66,266 (6.85) | 6.52 |
| LINE | 256,320 (15.16) | 99,739 (12.07) | 33.85 | 114,558 (11.84) | 31.93 |
| LTR | 223,775 (13.23) | 70,226 (8.50) | 12.91 | 87,533 (9.05) | 13.84 |
| SINE | 1,096,177 (64.83) | 597,085 (72.25) | 46.29 | 698,778 (72.25) | 47.71 |
| Total | 1,690,941 (100) | 826,444 (100) | 100 | 967,135 (100) | 100 |
Note.—Numbers correspond to the –strict option of the tool One Code To Find Them All. Length in % corresponds to the TE coverage in the genes plus flanking regions.
Association between Gene Duplication Status and TE Densities
We first investigated the overall relationship between TE density and the duplication status of genes. The results indicated that TEs are significantly denser in the environments of singleton genes considering the 2- and 10-kb flanking regions than those for duplicated genes (Wilcoxon tests, for 2- and 10-kb flanking regions, all P values < 2 × 10⁻⁶, fig. 1 and supplementary fig. S3, Supplementary Material online).
Fig. 1.
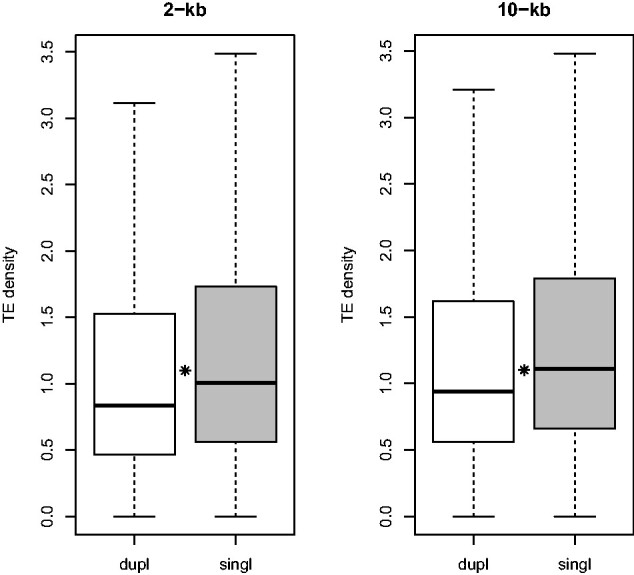
Distribution of the TE density in gene environments of duplicated and singleton genes including their 2- or 10-kb flanking regions. Dupl, duplicated genes; singl, singleton genes. Asterisks indicate a significant difference between the TE density distributions.
We also observed a greater TE coverage for singleton genes than for duplicated genes for both sizes of flanking region (Wilcoxon tests with Bonferroni correction, for 2-kb flanking regions; P value < 2 × 10⁻⁶; for 10-kb flanking regions; P value = 1.35 × 10⁻¹¹, supplementary table S2 and fig. S4, Supplementary Material online). The presence of more TEs in and around singleton genes compared with duplicated genes may be partly explained by differences in selection pressure on these sequences. Indeed, TEs are less likely to insert in regions expected to be under strong selective pressure (Simons et al. 2006). Human tissue-specific genes with TEs are subject to higher selective pressure than those without TEs (Jin et al. 2012). To test this hypothesis, we calculated the ratio between the number of nonsynonymous substitutions per nonsynonymous site (Ka) and the number of synonymous substitutions per synonymous site (Ks) for orthologs between human and chimpanzee. We were able to compute 15,587 Ka/Ks ratios out of the 16,645 putative human–chimpanzee orthologous gene pairs (see Materials and Methods and supplementary fig. S5, Supplementary Material online). Ka/Ks ratios were significantly higher for singleton genes than for duplicated genes (Wilcoxon test, P value < 2.2 × 10⁻¹⁶), suggesting there is less selective pressure on singleton genes compared with duplicated genes.
A negative association between TE density and meiotic recombination rates is a highly recurrent feature of eukaryotic genomes (Rizzon et al. 2002; Kent et al. 2017). To investigate a possible relationship between recombination rate and TE density, we estimated the meiotic recombination rates using Marey maps, an approach based on mapping genetic chromosome maps onto physical maps of chromosomes (see supplementary fig. S6, Supplementary Material online and Materials and Methods). We did not find any differences in recombination rates for duplicated genes compared with singleton genes after Bonferonni correction for multiple tests (Wilcoxon tests, dataset 1, raw P value = 0.03834; dataset 2, raw P value = 0.08513; dataset 3, raw P value = 0.02856).
It is known that TEs are not randomly inserted according to GC content (Lander et al. 2001; Grover et al. 2004). The higher numbers of TEs in the environment of singleton genes compared with those of duplicated genes might be partly explained by the GC content of genes and their vicinity (Vinogradov 2005; Jjingo et al. 2011). TE gene fractions have been highly correlated with human gene length (GL) (Jjingo et al. 2011). To study the specific relationship between the duplication status and the TE density in the vicinity of genes independently from selection pressure and the GC content, we considered a linear model with TE density as the dependent variable, the duplication status as the explanatory variable, and the Ka/Ks ratios, GC content, recombination rate, and GL as covariables. Table 3 displays the coefficient values and their significance for 2- and 10-kb flanking regions when testing association between the TE density and GC, GL, recombination rate, and duplication status (including pairwise interactions) according to linear models (see Materials and Methods). The overall TE density and the individual densities of SINE, LINE, LTR, and DNA TE categories were considered.
Table 3.
Coefficient Values for the Multiple Linear Regression Analyses Where TE Density Is the Response Variable and GC Content, Recombination Rate, Gene Length (GL), , and Duplication Status (Dataset 1) Are Predictors
| 2-kb |
10-kb |
|||||||||
|---|---|---|---|---|---|---|---|---|---|---|
| Variable | All TEs | DNA | LINE | SINE | LTR | All TEs | DNA | LINE | SINE | LTR |
| log(GC) | −5.127 ∗ | −2.278 ∗ | −2.012 ∗ | −5.704 ∗ | −1.576 ∗ | −1.739 ∗ | −2.220 ∗ | −5.414 ∗ | 0.001 | −3.895 ∗ |
| Recomb. | 1.879 ∗ | 1.053 ∗ | 0.036 | 1.770 ∗ | 0.899 ∗ | 1.538 ∗ | 1.570 ∗ | 0.849 ∗ | 1.759 ∗ | 0.839 ∗ |
| Log() | −1.661 ∗ | −0.813 ∗ | 0.504 ∗ | −2.284 ∗ | 0.086 ∗ | −1.073 ∗ | −1.133 ∗ | 1.138 ∗ | −1.904 ∗ | −0.178 ∗ |
| Log(GL) | −1.983 ∗ | −0.388 ∗ | 0.312 ∗ | −2.280 ∗ | −0.020 | −0.848 ∗ | −0.623 ∗ | −1.070 ∗ | −0.650 ∗ | −0.939 ∗ |
| Status | 1.871 ∗ | 1.598 ∗ | −1.652 ∗ | 2.782 ∗ | −0.539 | 1.145 ∗ | 3.064 ∗ | −2.616 ∗ | 2.935 ∗ | −0.094 ∗ |
| Log(GC)×Recomb. | −0.307 ∗ | −0.231 ∗ | / | −0.306 ∗ | −0.157 ∗ | −0.272 ∗ | −0.386 ∗ | −0.173 ∗ | −0.334 ∗ | −0.127 |
| Log(GC)×Log() | 0.363 ∗ | 0.167 ∗ | −0.121 ∗ | 0.464 ∗ | / | 0.205 ∗ | 0.237 ∗ | −0.211 ∗ | 0.359 ∗ | / |
| Log(GC)×Log(GL) | 0.602 ∗ | 0.190 ∗ | / | 0.750 ∗ | 0.092 ∗ | 0.252 ∗ | 0.218 ∗ | 0.285 ∗ | 0.220 ∗ | 0.273 ∗ |
| Log(GC)×Status | −0.281 | −0.346 ∗ | 0.271 ∗ | −0.531 ∗ | 0.127 | −0.190 | −0.597 ∗ | 0.448 ∗ | −0.505 ∗ | / |
| Recomb×Log(GL) | −0.060 ∗ | −0.017 ∗ | / | −0.051 ∗ | −0.022 ∗ | −0.041 ∗ | −0.012 | −0.014 | −0.040 ∗ | −0.022 |
| Recomb×Status | −0.041 | / | −0.047 ∗ | / | / | −0.035 | / | −0.058 ∗ | / | / |
| Log()×Log(GL) | 0.034 ∗ | 0.015 ∗ | / | 0.052 ∗ | / | 0.032 ∗ | 0.021 ∗ | −0.028 ∗ | 0.051 ∗ | 0.020 ∗ |
| Log()×Status | / | / | / | / | / | −0.021 | / | / | / | / |
| Log(GL)×Status | −0.054 ∗ | −0.018 | 0.064 ∗ | −0.052 ∗ | / | −0.026 | −0.065 ∗ | 0.088 ∗ | −0.077 ∗ | / |
| Recomb×Log() | / | / | 0.018 | / | / | / | / | 0.025 | / | 0.022 |
| Adjusted R2 | 0.067 | 0.377 | 0.487 | 0.251 | 0.292 | 0.027 | 0.186 | 0.295 | 0.084 | 0.092 |
Note.—/, variable not retained in the step Akaike Information Criterion (AIC) process; Status, categorical variable for duplication status with duplicated as reference category and singleton as second category; Bold with asterisk, significant values considering Bonferroni correction for multiple tests.
The overall TE density of singleton genes was significantly higher than for duplicated genes according to the linear models for both flanking region sizes and when interactions especially with GL were considered (table 3). When considering each class of TE separately, DNA tranposon and SINE densities were significantly higher in singleton than in duplicated genes for both flanking region sizes. On the contrary, LINE densities where higher around duplicated genes compared with singleton genes. LTR retrotransposons followed the same tendency but not to a significant extent for all datasets (table 3).
We observed significant relationships between the GC content and the TE density of gene contexts for all TE categories with negative relationships for LINEs, DNA transposons, and LTR retrotransposons for both flanking region sizes. SINEs have also accumulated significantly in the vicinity of genes with a lower GC content in 2-kb flanking regions and in 10-kb flanking regions when considering the interactions of GC content with recombination rates and ratio (table 3 and supplementary tables S7 and S8, Supplementary Material online).
According to our linear model analyses, ratio was significantly negatively associated with the overall TE densities for 2- and 10-kb flanking regions and for all datasets (supplementary tables S7 and S8, Supplementary Material online). This result was unexpected because, according to the hypothesis that a negative selection is acting on inserted TEs, TE numbers would be expected to be lower in genes with small ratios compared with genes with higher values. When considering each class of TE separately, SINE densities are negatively related to ratios for both flanking region sizes. The same tendency is observed for DNA transposon densities (supplementary tables S7 and S8, Supplementary Material online). Positive significant relationships were found for LINE densities and ratios for all flanking region sizes (table 3 and supplementary tables S7 and S8, Supplementary Material online). Similar but less significant results were found for LTR retrotransposon densities except for a negative relationship between LTR retrotransposon densities and ratios for the shortest genes (table 3 and supplementary tables S7 and S8, Supplementary Material online). It should be noted that we detected a negative relationship between GL and TE density when considering all TEs and DNA, SINE, and LTR elements separately. However, a positive relationship with GL was found for LINEs for 2-kb flanking region size.
According to the linear models, a positive relationship was found between TE densities and recombination rates for all TEs and DNA, SINE, LINE, and LTR elements separately for 2- and 10-kb flanking regions and all datasets. These relationships were significant with interactions taken into account, especially those with GL and GC. An exception was that no significant relationship was found for LINE density for 2-kb flanking regions. A negative relationship between recombination rates and TE distribution would be expected, but this expectation is based on considering intergenic regions too.
Results were also similar when TE coverage was considered, but less significant (supplementary tables S9 and S10, Supplementary Material online). Overall our results suggest that the duplication status of genes partly explains the distribution of TEs in the vicinity of the genes.
Gene Functions Are Associated to TE Environment and Duplication Status
To decipher whether the functions of the human genes could explain the relationship between the duplication status of a gene and its TE environment, we compared the functions of the human genes with different densities of TE. Gene functions were assigned by the PANTHER V14 software (Mi et al. 2019) to GO-slim annotations for the three GO ontologies Biological Process (BP), Molecular Function (MF), and Cellular Component (CC). In total, for the 2-kb flanking regions, 4,752 TE-poor genes, 9,821 TE-medium genes, and 4,922 TE-rich genes were assigned GO-slim annotations, and for the 10-kb flanking regions respectively 4,731, 9,826, and 4,937 genes (supplementary table S11, Supplementary Material online). We compared the functions of the duplicated genes and the singleton genes for each TE density category (see Materials and Methods). For clarity, we only present the GO-slim categories for which statistically significant differences (FDR correction <0.01) in the distribution of functions were found for either the 2- or the 10-kb flanking regions of the genes compared and for which at least 5% of either the duplicated or the singleton genes were involved (fig. 2).
Fig. 2.

Gene Ontology (GO) term enrichment analysis according to the duplicate status for the Biological Process ontology and 2-kb flanking region size (dataset 1). Comparison of function for duplicated genes (light gray bars) and singleton genes (black bars) for TE-rich, TE-medium, and TE-poor densities. Height of bars corresponds for each function to the percentage of involved genes. Asterisks indicate statistically significant differences (Fisher’s exact tests, FDR <0.01) and black triangles indicate statistically significant differences (Fisher’s exact tests, FDR <0.01) for comparison where one gene per each gene family is randomly chosen. Multicell. org. process, multicellular organismal process; reg. cellular process, regulation of cellular process; reg. biological process, regulation of biological process; CSR signaling pathway, cell surface receptor signaling pathway; reg. biological quality, regulation of biological quality; cell. comp. organization, cellular component organization; cell. protein localization, cellular protein localization; cell. macro. localization, cellular macromolecule localization; cell. macro. meta. process, cellular macromolecule metabolic process; intracell. signal transduction, intracellular signal transduction; macro. metabolic process, macromolecule metabolic process.
Biological Process Functions
Considering TE density in environments with 2-kb flanking regions and the BP ontology of the genes, we observed 27 GO-slim terms that were significantly overrepresented among duplicated genes compared with singleton genes whatever the TE density. Duplicated genes were significantly underrepresented only for the macromolecule metabolic process and the Unclassified GO-terms, the latter encompassing the numerous genes for which no specific function has yet been assigned (fig. 2). For most of the 27 GO-slim terms, results were significant for the three different TE density ranges. For example, duplicated genes were more likely to be involved than singleton genes in functions related to cellular process, biological regulation and regulation of biological process, cellular response to stimulus, and signal transduction at all TE densities. Genes of the same gene family are likely to share the same or similar functions, so to verify that the results were not solely due to family size, we reanalyzed the data by randomly choosing one gene per family in each list of duplicated genes (see Materials and Methods). Similar results were obtained (fig. 2) and the same trends were also observed for the 10-kb flanking regions (supplementary fig. S7, Supplementary Material online).
We observed that the proportion of genes in a particular functional class was often higher for TE-poor compared with TE-rich and TE-medium gene environments. For example, if we consider the biological regulation GO-slim term (), the biological regulation term was assigned to only around 15% of duplicated TE-rich genes whereas 23% of TE-poor duplicated genes were involved in this function. We thus specifically compared the functions of the human genes between TE-rich, TE-medium, and TE-poor genes for the BP ontology GO-slim terms with the same methodology (see Materials and Methods). In the case of 2-kb flanking region TE density, we observed 22 GO-slim terms with significantly different proportional representation in the different TE density ranges (fig. 3).
Fig. 3.

Gene Ontology (GO) term enrichment analysis according to the TE context for the Biological Process ontology and 2-kb flanking region size. Comparison of function between genes according to TE density; top, TE-rich genes versus TE-medium genes; middle, TE-rich genes versus TE-poor genes; bottom, TE-medium genes versus TE-poor genes. Black bars, TE-rich genes; Light gray bars, TE-medium genes; White bars, TE-poor genes. Asterisks indicate statistically significant differences (Fisher’s exact tests, FDR <0.01). Reg. cell. biosynthetic process, regulation of cellular biosynthetic process; reg. biosynthetic process, regulation of biosynthetic process; reg. metabolic process, regulation of metabolic process; reg. cell. process, regulation of cellular process; reg. biological process, regulation of biological process; cell. response to stimulus, cellular response to stimulus; CSR signaling pathway, cell surface receptor signaling pathway; multicell. org. dev., multicellular organism development; multicell. org. process, multicellular organismal process; transcr. RNA pol. II, transcription by RNA polymerase II; transcr. DNA-templated, transcription, DNA-templated; macro. metabolic process, macromolecule metabolic process; OS metabolic process, organic substance metabolic process.
TE-poor genes were overrepresented compared with TE-rich genes in 15 GO-slim term categories. Comparisons of TE-medium to TE-poor genes and of TE-rich to TE-medium genes showed the same tendency but were less pronounced for the former comparison (fig. 3). For example, we found that TE-poor genes are significantly overrepresented for the multicellular organism development GO-slim term (), in accordance with previous results (Simons et al. 2006; Mortada et al. 2010; Zhang and Mager 2012). TE-rich genes with functions related to metabolic processes are overrepresented compared with TE-poor genes as previously reported (Grover et al. 2003; Mortada et al. 2010; Zhang and Mager 2012). Overall our results suggest that genes with few TEs in their vicinity tend more often to have specific functions than genes with many TEs in their vicinity.
We next considered the GO-slim term representation results of TE-poor versus TE-rich genes and of duplicated genes versus singleton genes side by side. We noticed that for nine of the 15 GO-slim terms for which TE-poor genes were overrepresented compared with TE-rich genes, an overrepresentation of duplicated genes compared with singleton genes was also generally found (figs. 2 and 3). For example, when the biological regulation GO-slim term is considered, 13% of TE-rich genes versus 19% of TE-poor genes, and 18% of duplicated genes versus 12.5% of singleton genes have such a function. For only four GO-slim term functions were TE-rich genes more involved than TE-poor genes. Other than cellular localization, the functional categories did not correspond to those for which duplicated and singleton genes were represented significantly differently. Similar trends were observed for the 10-kb flanking regions (supplementary figs. S7 and S8, Supplementary Material online). Our results thus showed that nine GO-slim terms categories included an overrepresentation of duplicated genes compared with singleton genes and an overrepresentation of TE-poor genes compared with TE-rich genes.
Molecular Function and Cell Component
Significant associations were identified with Molecular Function (MF) and Cellular Component (CC) GO-slim terms. As for BP functions, MF GO-slim categories with significant associations with duplicated status were also mostly overpopulated by duplicated genes compared with singleton genes, for example, for 18 out of 21 significant GO-slim terms for the 2-kb flanking region size (supplementary fig. S9, Supplementary Material online). The main corresponding functions concern protein-binding, binding, catalytic activity, and molecular transducer activity. These observed patterns were similar between TE-rich, TE-medium, and TE-poor genes. When gene TE environment was taken into account without considering the duplication status, TE-rich versus TE-poor genes had a biased representation for 17 GO-slim terms, mostly in the sense of overrepresentation of TE-poor genes compared with TE-rich and TE-medium genes. Among these terms, 14 corresponded to GO-slim terms with biased representation in the duplication status of genes (supplementary figs. S9–S12, Supplementary Material online). Interestingly, TE-poor genes were significantly overrepresented compared with TE-rich and TE-medium genes for the protein binding, binding, and molecular transducer activity functions, but underrepresented for the catalytic activity function. We obtained the same type of observations for CC GO-slim terms, with significant associations corresponding mainly to categories with overrepresentation of duplicated genes and in similar patterns for the different TE densities (supplementary figs. S13–S16, Supplementary Material online). It is worth noting that for TE-medium genes only, singleton genes were significantly overrepresented in the CC ontology functions corresponding to nucleus parts and organelles. Interestingly, when gene TE context alone was taken into account regardless of duplication status, TE-rich genes were significantly overrepresented compared with TE-medium and TE-poor genes both for nucleus part and organelle GO-slim terms, unlike most of the other GO-slim terms (supplementary figs. S13–S16, Supplementary Material online).
TE Density Is Related to Gene Essentiality
To further explore the links between the duplication status of a gene and its TE context, we considered whether not only the function but the essentiality of a gene could be important. Essential genes can be defined as those indispensable for reproductive success of a living system or those required to support cellular life, for example. Rather than being a static binary property, recent studies suggest that gene essentiality is both context dependent and can evolve (Liu et al. 2015; Wang et al. 2015; Chen et al. 2017; Rancati et al. 2018). We retrieved human gene essentiality data from OGEE, (Chen et al. 2017) which is composed of 18 datasets, all but one corresponding to cancer cell line experiments. We observed that duplicated genes are less likely to be essential than singleton genes (χ2 = 237.6, df = 1, P value < 2.2 × 10⁻¹⁶table 4 and supplementary table S12, Supplementary Material online).
Table 4.
Number of Essential and Non-Essential Genes among Duplicated and Singleton Genes According to OGEE for All Test Conditions and for Genes Tested at least in Five Conditions (>5), Dataset 1
| Essential |
Non-Essential |
|||
|---|---|---|---|---|
| All Tests | >5 | All Tests | >5 | |
| Singleton | 3,841 (77.0%) | 3,750 (84.7%) | 4,989 (23.0%) | 4,424 (15.3%) |
| Duplicated | 3,267 (46.2%) | 3,143 (52.4%) | 7,069 (53.8%) | 5,999 (47.6%) |
| Total | 7,108 (58.9%) | 6,893 (66.1%) | 12,058 (41.1%) | 10,423 (33.9%) |
Note.—Essential genes correspond to genes found essential at least in one test condition.
We then defined five categories of essentiality for these genes, “Essential” (E) genes are defined as those that are essential in all the test datasets, “Conditional Restricted Essential” (CRE) genes as those that are essential in fewer than 25% of the test datasets, “Conditional Medium Essential” (CME) genes as those that are essential in between 25% and 75% of the test datasets and “Conditional Largely Essential” (CLE) genes as essential in more than 75% of the test datasets. The remaining genes were defined as “Non essential” (NoE) (see Materials and Methods and supplementary table S13 and fig. S17, Supplementary Material online). The distributions of TE densities in the 2-kb flanking regions of genes with respect to the different degrees of essentiality were significantly different when all TE types were considered together (fig. 4, Kruskal–Wallis χ2 = 591.86, df = 4, P value < 2.2 × 10⁻¹⁶) and individually (fig. 4, DNA transposons, Kruskal–Wallis χ2 = 72.504, df = 4, P value = 6.717 × 10⁻¹⁵; LINE, Kruskal–Wallis χ2 = 34.187, df = 4, P value = 6.821 × 10⁻⁷; SINE, Kruskal–Wallis χ2 = 804.12, df = 4, P value < 2.2 × 10⁻¹⁶; LTR retrotransposons, Kruskal–Wallis χ2 = 172.31, df = 4, P value < 2.2 × 10⁻¹⁶).
Fig. 4.

Boxplots of TE densities according to essentiality categories for 2-kb flanking region gene environment. Outlier points are not shown. NoE, Non-Essential genes; CRE, Conditional Restricted-Essential genes; CME, Conditional Medium-Essential genes; CLE, Conditional Largely Essential genes; E, Essential genes.
Results were similar for the 10-kb flanking regions, and when TE density was replaced by TE coverage in the comparisons (supplementary table S14, Supplementary Material online). Thus, to better study the relationship between the duplication status and the TE density of genes, we reverted to the linear models with TE density as the dependent variable, the duplication status as the explanatory variable, and GL, the Ka/Ks ratio, GC content, and recombination rate as covariables, and added a categorial covariable of gene essentiality (Ess), expressed as the proportion of OGEE datasets in which each gene was essential relative to the number of OGEE test datasets listing the gene. Genes were considered as non-essential when the essentiality value was below a threshold of 0.143, otherwise as essential genes (see Materials and Methods). The association between the TE density and each variable (including pairwise interactions between variables) was tested for 2- and 10-kb flanking regions. Analogous analyses with TE coverage as the dependent variable were also performed.
Table 5 displays the coefficient values obtained by testing associations between TE density and each variable with its interactions by pairs. The overall TE density and the densities for each TE type were considered. In each case, the linear model can be written where Status and Ess are binary variables expressing respectively the duplicated or singleton status of the gene and its non-essential or essential nature (see Materials and Methods).
Table 5.
Coefficient Values for the Multiple Linear Regression Analyses Where TE Density Is the Response Variable and GC Content, Recombination Rate, Gene Length (GL), , Duplication Status (Dataset 1), and Essentiality Are Predictors
| 2-kb |
10-kb |
|||||||||
|---|---|---|---|---|---|---|---|---|---|---|
| Variable | All TEs | DNA | LINE | SINE | LTR | All TEs | DNA | LINE | SINE | LTR |
| Log(GC) | −5.625 ∗ | −2.539 ∗ | −1.916 ∗ | −6.640 ∗ | −1.793 ∗ | −1.892 ∗ | −2.750 ∗ | −4.821 ∗ | −0.538 | −4.592 |
| Recomb | 2.124 ∗ | 1.260 ∗ | 0.028 | 1.962 ∗ | 0.845 ∗ | 1.770 ∗ | 1.233 ∗ | 0.603 ∗ | 1.993 ∗ | 0.775 |
| Log() | −1.097 ∗ | −0.904 ∗ | 0.215 | −1.703 ∗ | −0.339 | −0.794 ∗ | −1.088 ∗ | 0.752 ∗ | −1.347 ∗ | 0.062 ∗ |
| Log(GL) | −2.117 ∗ | −0.509 ∗ | 0.345 ∗ | −2.542 ∗ | −0.099 | −0.894 ∗ | −0.804 ∗ | −0.873 ∗ | −0.802 ∗ | −1.160 ∗ |
| Status | 0.179 ∗ | 0.909 ∗ | −1.114 ∗ | 0.142 ∗ | −0.042 | −0.033 | 1.885 ∗ | −1.536 ∗ | 0.133 ∗ | −1.525 ∗ |
| Ess | 2.647 ∗ | 1.763 ∗ | −0.822 | 3.532 ∗ | −1.966 ∗ | 1.516 ∗ | 2.698 ∗ | −1.369 | 3.064 ∗ | 0.212 |
| Log(GC)×Recomb | −0.339 ∗ | −0.265 ∗ | / | −0.325 ∗ | −0.144 ∗ | −0.307 ∗ | −0.330 ∗ | −0.145 ∗ | −0.367 ∗ | −0.119 |
| Log(GC)×Log() | 0.276 ∗ | 0.182 ∗ | −0.076 | 0.365 ∗ | 0.078 | 0.164 ∗ | 0.228 ∗ | −0.151 ∗ | 0.271 ∗ | / |
| Log(GC)×Log(GL) | 0.628 ∗ | 0.223 ∗ | / | 0.808 ∗ | 0.115 ∗ | 0.256 ∗ | 0.255 ∗ | 0.239 ∗ | 0.244 ∗ | 0.317 ∗ |
| Log(GC)×Status | / | −0.217 ∗ | 0.184 | / | / | / | −0.366 ∗ | 0.256 ∗ | / | 0.267 |
| Recomb×Log(GL) | −0.069 ∗ | −0.025 ∗ | / | −0.060 ∗ | −0.0208 | −0.049 ∗ | / | / | −0.048 ∗ | −0.021 |
| Recomb×Status | −0.045 | / | −0.039 | / | / | −0.032 | / | −0.051 | / | / |
| Log()×Log(GL) | 0.014 | 0.018 ∗ | 0.011 | 0.035 ∗ | 0.011 | 0.021 ∗ | 0.020 ∗ | −0.014 | 0.031 ∗ | / |
| Log()×Status | / | / | 0.024 | / | / | / | / | / | / | / |
| Log(GL)×Status | / | / | 0.046 ∗ | / | / | 0.015 | −0.039 ∗ | 0.056 ∗ | / | 0.042 ∗ |
| Recomb×Log() | / | / | 0.015 | / | / | / | / | 0.026 | / | / |
| Log(GC)×Ess | −0.220 | −0.452 ∗ | 0.166 | −0.571 ∗ | 0.446 ∗ | −0.170 | −0.627 ∗ | 0.245 | −0.485 ∗ | / |
| Recomb×Ess | −0.095 ∗ | / | / | −0.097 ∗ | / | −0.084 ∗ | / | / | −0.090 ∗ | / |
| Log()×Ess | −0.079 ∗ | / | −0.035 | −0.065 | / | −0.070 ∗ | / | / | −0.060 ∗ | −0.053 |
| Log(GL)×Ess | −0.139 ∗ | / | / | −0.087 ∗ | / | −0.057 ∗ | −0.027 | 0.029 | −0.074 ∗ | −0.055 ∗ |
| Status×Ess | / | / | 0.102 ∗ | / | 0.085 | / | / | / | / | 0.080 |
| Adjusted R2 | 0.080 | 0.367 | 0.496 | 0.237 | 0.293 | 0.048 | 0.185 | 0.292 | 0.010 | 0.106 |
Note.—/, variable not retained in the step Akaike Information Criterion (AIC) process; Status, categorical variable for duplication status with duplicated as reference category and singleton as second category; Ess, categorical variable for essentiality status with nonessential as reference category and essential as second category; Bold with asterisk, significant values considering Bonferroni correction for multiple tests.
The relationship between TE density and essentiality for total TEs, DNA transposons, and SINEs was significant for 2- and 10-kb flanking regions, but this was not true for LINEs. For LTR retrotransposons this relationship was also significant for all datasets, but sometimes only through interactions with GL or GC (table 5 and supplementary tables S15 and S16, Supplementary Material online). When all TEs are considered along with the interactions with GC, recombination rates, and GL (table 5), the positive relationship indicates that higher TE densities are found in the vicinity of essential genes compared with non-essential genes. This relationship is more nuanced when each TE type is considered separately. Higher densities of SINEs and DNA transposons are found around essential genes compared with non-essential genes, when interactions with GC, recombination rates, and GL are taken into account (table 5 and supplementary tables S15 and S16, Supplementary Material online). Densities of LTR retrotransposons were higher in the environments of non-essential genes compared with essential genes, when considering significant interactions with GC and GL (table 5 and supplementary tables S15 and S16, Supplementary Material online). The results were similar when TE coverage was the dependent variable (supplementary tables S17 and S18, Supplementary Material online).
It should be noted that when a measure of essentiality is included in the linear models and each TE type is considered separately, the relationship between the duplication status and the TE density is similar. To summarize, this relationship is significant for DNA transposons, SINEs, LINEs, and LTR retrotransposons for both 2- and 10-kb flanking regions and more or less stringent definitions of duplication status with few exceptions (table 5 and supplementary tables S15 and S16, Supplementary Material online). The exceptions often relate to the most stringent dataset 2, the 2-kb flanking regions, and some interactions. Our results thus indicate the tendency for DNA transposons and SINEs to be more dense in the environment of duplicated genes than in the environment of singleton genes.
However, when all TEs are considered together the relationship between duplication status and TE density varies from one dataset to another and between the two flanking region sizes (table 5 and supplementary tables S15 and S16, Supplementary Material online). When TE coverage was used instead of TE density, this relationship was significant for all analyses (supplementary tables S17 and S18, Supplementary Material online).
Analysis of TE Superfamilies
To understand at a finer scale the relationship between TE density and the duplication status of genes, we considered the age of TEs. For this, we calculated the median TE copy divergence as a proxy for the age of each TE superfamily (supplementary table S19 and fig. S18, Supplementary Material online). We only considered TE superfamilies for further analysis when the number of TE copies was high enough to be compatible with robust statistical analyses (fig. 5 and supplementary tables S4 and S5, Supplementary Material online). Among the SINEs, we thus analyzed the Alu and MIR superfamilies. The Alu superfamily is one of the youngest superfamilies, whereas the MIR superfamily is one of the oldest (Wilcoxon test W = 552,930,000, P value < 2.2 × 10⁻¹⁶, fig. 5). The LINE L1 and L2 superfamilies were also analyzed. L1 elements belong to one of the youngest superfamilies whereas the L2 elements belong to one of the oldest (Wilcoxon test W = 134,450,000, P value < 2.2 × 10⁻¹⁶, fig. 5). Among the LTR retrotransposons, superfamilies with enough copies in genes to be analyzed are ERV1, ERVK, and ERVL–MaLR. ERVK is one of the youngest superfamilies with a median divergence value for the retrieved copies of 8.22 whereas ERV1 and ERVL–MaLR superfamilies show medium median values for divergence (fig. 5). For DNA transposons, seven superfamilies were analyzed. TcMar–Mariner is one of the youngest superfamilies with a median divergence of 11.2 and the HAT-Blackjack and hAT-Tip100 superfamilies are among the oldest ones with respectively 18.5% and 18.2% divergence (Wilcoxon test, TcMar-Mariner and HAT-Blackjack W = 378,050, P value < 2.2 × 10⁻¹⁶; Wilcoxon test: TcMar-Mariner and hAT-Tip100 W = 884,510, P value < 2.2 × 10⁻¹⁶, fig. 5). These results are in accordance with the observation that Alu, L1, and possibly ERVK elements remain actively mobile in the human genome (Mills et al. 2007).
Fig. 5.

Divergence of TE copies according to superfamilies in the entire genome (--strict option of the tool One Code To Find Them All).
Tables 6 and 7 display the coefficient values and their significance when testing association between the TE superfamily density for 2- and 10-kb flanking regions and GC, GL, recombination rate, duplication status, and essentiality of genes (including pairwise interactions) according to linear models (see Materials and Methods). Among the different TE classes, the relationship between TE density and the duplication status of genes and the relationship between TE density and the apparent essentiality of genes differed according to the TE superfamily. The SINE Alu superfamily was present at significantly higher densities around singleton genes compared with duplicated genes (also for 10-kb flanking regions for datasets 2 and 3) and around highly essential genes compared with less-essential genes. The SINE MIR superfamily did not show a significant relationship between TE densities and duplication status. MIR densities were however significantly higher around highly essential genes compared with less-essential genes for all datasets and flanking regions sizes with the exception of dataset 1 for 2-kb flanking region (table 6 and supplementary tables S20–S23, Supplementary Material online). As for all LINE elements, the L1 superfamily showed significantly higher densities in duplicated genes compared with singleton genes, and a tendency, significant in most cases, to be denser in less-essential genes compared with highly essential genes. However, the L2 superfamily did not show any significant relationship with the duplication status and the apparent essentiality of genes. LTR superfamilies densities did not show significant relationships with the duplication status of genes. For ERV1 and ERVL-MaLR superfamilies, TE density was significantly higher in 10-kb flanking regions of highly essential genes compared with less-essential genes (table 6 and supplementary tables S20–S23, Supplementary Material online).
Table 6.
Coefficient Values for the Multiple Linear Regression Analyses for the TE Superfamilies: TE Density Is the Response Variable and GC Content, Recombination Rate, Gene Length (GL), , Duplication Status (Data Set 1), and Essentiality Are Predictors
| SINE |
LINE |
LTR |
||||||||||||
|---|---|---|---|---|---|---|---|---|---|---|---|---|---|---|
| Alu |
MIR |
L1 |
L2 |
ERV1 |
ERVK |
ERVL-MaLR |
||||||||
| Variable | 2-kb | 10-kb | 2-kb | 10-kb | 2-kb | 10-kb | 2-kb | 10-kb | 2-kb | 10-kb | 2-kb | 10-kb | 2-kb | 10-kb |
| Log(GC) | −1.760 ∗ | −0.185 | −0.579 | −5.202 ∗ | 7.909 ∗ | 2.221 ∗ | −0.894 | −5.137 ∗ | 5.685 ∗ | −0.141 | 0.173 | −5.276 ∗ | 7.596 ∗ | 2.456 ∗ |
| Recomb | 1.645 ∗ | 1.959 ∗ | 0.029 | 0.011 | −0.093 | 0.039 | / | −0.535 | −0.216 | 0.041 ∗ | 0.331 | 0.363 ∗ | 0.928 ∗ | 0.837 ∗ |
| Log() | −1.234 ∗ | −1.435 ∗ | −0.389 | −0.981 ∗ | 1.324 ∗ | 0.919 ∗ | / | −1.132 ∗ | 0.056 ∗ | −0.192 | −0.816 | −1.630 ∗ | 0.617 ∗ | 0.046 ∗ |
| Log(GL) | −1.157 ∗ | −0.687 ∗ | −1.321 ∗ | −2.691 ∗ | 3.093 ∗ | 1.352 ∗ | −1.245 ∗ | −2.431 ∗ | 1.347 ∗ | −0.372 ∗ | −0.846 ∗ | −2.515 ∗ | 2.105 ∗ | 0.670 ∗ |
| Status | 0.158 ∗ | 0.127 ∗ | 1.261 | 0.631 | −1.450 ∗ | −1.128 ∗ | / | −0.245 | −0.053 | −0.049 | −0.063 | −0.031 | −0.588 | −0.528 |
| Ess | 1.251 ∗ | 2.766 ∗ | 1.806 | 1.877 ∗ | −0.841 | −1.029 ∗ | 1.611 | 1.195 | −0.586 | 0.741 ∗ | / | 0.597 | 0.039 | 0.851 ∗ |
| Log(GC)×Recomb | −0.305 ∗ | −0.363 ∗ | / | / | / | / | / | 0.129 | / | / | / | / | −0.237 ∗ | −0.200 ∗ |
| Log(GC)×Log() | 0.255 ∗ | 0.283 ∗ | 0.094 | 0.169 ∗ | −0.244 ∗ | −0.195 ∗ | / | 0.161 ∗ | / | / | 0.148 | 0.286 ∗ | / | / |
| Log(GC)×Log(GL) | 0.304 ∗ | 0.209 ∗ | 0.144 ∗ | 0.573 ∗ | −0.898 ∗ | −0.392 ∗ | 0.091 | 0.479 ∗ | −0.528 ∗ | / | / | 0.530 ∗ | −0.663 ∗ | −0.226 ∗ |
| Log(GC)×Status | / | / | −0.260 | −0.165 | 0.246 | 0.153 | / | / | / | / | / | / | 0.148 | 0.146 |
| Recomb×Log(GL) | −0.036 ∗ | −0.046 ∗ | / | / | 0.013 | / | / | / | 0.024 | / | −0.025 | −0.032 ∗ | / | / |
| Recomb×Status | / | / | / | / | −0.063 ∗ | −0.051 ∗ | / | 0.043 | / | / | −0.045 | −0.056 | / | −0.034 |
| Log()×Log(GL) | 0.025 ∗ | 0.035 ∗ | / | 0.027 ∗ | −0.033 ∗ | −0.013 | / | 0.045 ∗ | / | 0.022 ∗ | 0.028 | 0.059 ∗ | −0.048 ∗ | / |
| Log(GL)×Status | / | / | −0.024 | / | 0.054 ∗ | 0.053 ∗ | / | 0.019 | / | / | / | / | / | / |
| Log(GC)×Ess | −0.205 | −0.462 ∗ | −0.311 | −0.341 | 0.262 | 0.231 | −0.263 | −0.222 | 0.364 | / | / | / | 0.240 | / |
| Log()×Ess | −0.120 ∗ | −0.091 ∗ | / | / | / | / | / | / | −0.073 | −0.060 | / | / | −0.064 | −0.064 |
| Log(GL)×Ess | / | −0.054 | −0.059 | −0.052 | −0.029 | / | −0.056 ∗ | −0.028 | −0.070 | −0.068 ∗ | / | −0.053 | −0.091 ∗ | −0.085 |
| Adjusted R2 | 0.099 | 0.105 | 0.867 | 0.803 | 0.218 | 0.185 | 0.941 | 0.909 | 0.512 | 0.356 | 0.887 | 0.809 | 0.302 | 0.169 |
Note.—/, variable not retained in the step Akaike Information Criterion (AIC) process; Status, categorical variable for duplication status with duplicated as reference category and singleton as second category; Ess, categorical variable for essentiality status with non-essential as reference category and essential as second category; Bold with asterisk, significant values considering Bonferroni correction for multiple tests. Predictors with no significant value for any superfamily are not shown.
Table 7.
Coefficient Values for the Multiple Linear Regression Analyses for the DNA TE Superfamilies: TE Density Is the Response Variable and GC Content, Recombination Rate, Gene Length (GL), , Duplication Status (Data Set 1), and Essentiality Are Predictors
| MULE-MuDR |
TcMar-Mariner |
TcMar-Tigger |
hAT |
hAT-Blackjack |
hAT-Charlie |
hAT-Tip100 |
||||||||
|---|---|---|---|---|---|---|---|---|---|---|---|---|---|---|
| Variable | 2-kb | 10-kb | 2-kb | 10-kb | 2-kb | 10-kb | 2-kb | 10-kb | 2-kb | 10-kb | 2-kb | 10-kb | 2-kb | 10-kb |
| Log(GC) | −1.528 ∗ | −7.441 ∗ | 2.927 ∗ | −3.255 ∗ | 8.355 ∗ | 3.835 ∗ | 0.212 ∗ | −2.532 ∗ | −0.907 | −5.873 ∗ | 3.409 ∗ | −0.301 | 0.213 ∗ | −4.833 ∗ |
| Recomb | −1.505 | −1.980 | / | 0.445 ∗ | −0.205 | 0.413 | / | / | 1.454 | 0.363 ∗ | 1.926 ∗ | 1.623 ∗ | / | 0.191 |
| Log() | 2.933 | 2.360 | / | / | 0.298 ∗ | / | / | −1.210 ∗ | −0.382 | −0.437 | −0.212 | −0.702 ∗ | −0.018 | −1.131 ∗ |
| Log(GL) | −1.065 ∗ | −2.633 ∗ | 0.088 | −1.652 ∗ | 2.439 ∗ | 1.159 ∗ | −0.870 ∗ | −1.631 ∗ | −1.379 ∗ | −2.758 ∗ | 0.400 | −0.606 ∗ | −0.907 | −2.451 ∗ |
| Status | −0.240 | −0.239 | 0.530 | / | 0.874 | 1.161 ∗ | 0.400 | 0.456 | / | −0.656 ∗ | 0.891 | 0.575 | / | −0.224 |
| Ess | 2.906 | 1.768 | / | / | 0.110 ∗ | 0.105 ∗ | / | 1.006 | / | −0.0572 | 0.572 | 1.221 | −0.970 | / |
| Log(GC)×Recomb | 0.422 | 0.556 | / | / | / | −0.101 | / | / | −0.244 | / | −0.437 ∗ | −0.353 ∗ | / | / |
| Log(GC)×Log() | −0.490 | −0.453 | / | / | / | / | / | 0.189 | 0.110 | 0.112 | 0.143 | 0.191 ∗ | / | 0.205 ∗ |
| Log(GC)×Log(GL) | / | 0.490 ∗ | −0.261 ∗ | 0.269 ∗ | −0.812 ∗ | −0.398 ∗ | / | 0.274 ∗ | 0.137 | 0.549 ∗ | −0.223 ∗ | 0.105 ∗ | / | 0.490 ∗ |
| Log(GC)×Status | / | / | / | / | −0.219 | −0.294 ∗ | / | / | / | / | −0.170 | −0.152 | / | / |
| Recomb×Log(GL) | / | / | / | −0.038 ∗ | 0.022 | / | / | / | −0.051 ∗ | −0.035 ∗ | −0.030 ∗ | −0.030 ∗ | / | −0.022 |
| Log()×Log(GL) | −0.084 | −0.047 | / | / | −0.026 ∗ | / | / | 0.042 ∗ | / | / | −0.027 ∗ | / | / | 0.033 ∗ |
| Log(GL)×Status | / | / | −0.047 | / | / | / | −0.033 | −0.030 | / | 0.056 ∗ | −0.023 | / | / | 0.022 |
| Log()×Ess | / | / | / | / | / | / | / | / | / | / | 0.056 ∗ | 0.033 | / | / |
| Log(GL)×Ess | −0.274 ∗ | −0.147 | / | / | / | / | / | / | / | / | −0.040 | −0.036 | / | / |
| Adjusted R2 | 0.903 | 0.878 | 0.906 | 0.879 | 0.484 | 0.342 | 0.927 | 0.890 | 0.951 | 0.923 | 0.443 | 0.249 | 0.930 | 0.894 |
Note.—/, variable not retained in the step Akaike Information Criterion (AIC) process; Status, categorical variable for duplication status with duplicated as reference category and singleton as second category; Ess, categorical variable for essentiality status with nonessential as reference category and essential as second category; Bold with asterisk, significant values considering Bonferroni correction for multiple tests.
Among DNA superfamilies, hAT-Blackjack densities are significantly higher in duplicated genes compared with singleton genes in the 10-kb flanking region contrary to the observations for all DNA transposons. The other DNA superfamilies do not show strong differences of density according to the duplication status of the genes. TcMar-Tigger elements significantly accumulate around highly essential genes compared with less-essential genes. No significant relationship between DNA element densities and the degree of gene essentiality was detected for the other superfamilies (table 7 and supplementary tables S20–S23, Supplementary Material online).
Discussion
The importance of transposable elements in the evolution of mammalian genomes is now recognized, particularly in gene family evolution (Lowe et al. 2007; Cordaux and Batzer 2009; Janoušek et al. 2013, 2016; Sundaram et al. 2014; Chalopin et al. 2015). Recently, we found that TEs influence the evolutionary divergence of human duplicated genes through variation in the epigenetic landscape of the genes (Lannes et al. 2019). To better understand the impact of the TE environment on the fate of duplicated genes, here, we analyzed the association between the presence of TEs surrounding genes (within 2- or 10-kb flanking sequences) and the duplication status of the genes, taking into account various genomic features known to influence TE distribution along chromosomes. We have also quantified the functional representation bias of duplicated genes compared with nonduplicated genes with respect to the TE environment, and evaluated how the essentiality of the genes influences the association of TE density with the duplication status of the genes.
What Is a Duplicated Gene?
We defined the gene families in the human genome by using several characteristics as a way of ensuring the robustness and relevance of our results in terms of what constitutes a duplicated gene. Estimations of the proportion of duplicated genes among protein-coding genes in human differ quite widely from around 46–76% (Shoja and Zhang 2006; Pan and Zhang 2008; Singh et al. 2014; Acharya and Ghosh 2016) and even up to 97% if very ancient duplications are considered (Britten 2006). We thus decided to use several definitions of a “duplicated gene” to allow for different theoretical and practical scenarios. We estimated that between 46% and 65.5% of human genes could be considered as duplicated genes, which is consistent with the range of values obtained in the previous studies cited. By using different definitions, our results highlighted differences or similarities in structure between singleton and duplicated genes. Thus, with a loose definition which assumes a larger proportion of genes are duplicated, the chosen genes are on average longer with more exons and with a smaller intronic fraction than singleton genes. Because criteria to define duplicated genes relied mainly on the similarity level between protein sequences and on the fraction of the length of the proteins involved in the obtained alignments, we expected the duplicated genes retrieved to include a higher number of old duplicated genes when the loose definition was used than when more stringent definitions were used. It has been reported by Bu and Katju (2015) that for 163 duplicated pairs, the older duplicated genes included different proportions of structural categories—such as incomplete and chimeric structures—than younger duplicated genes. This could explain some of the observed differences between our datasets. For example, it has been shown that chimeric duplicated gene copies may be longer with more exons than the original genes (Courseaux and Nahon 2001). In Populus trichocarpa, duplicated genes originating from WGD are longer than other genes, whereas tandem duplicated genes are significantly shorter (Rodgers-Melnick et al. 2012). According to Nakatani et al. (2007) and Makino and McLysaght (2010), about 20–30% of the protein-coding genes in the human genome are derived from WGD, relatively ancient events (McLysaght et al. 2002; Dehal and Boore 2005). Moreover, it has been estimated that 25–40% of the recent gene duplications are generated by tandem duplications in mouse and human (Pan and Zhang 2008), accounting for 10–18% of genes in the latter (Shoja and Zhang 2006). We can thus make the hypothesis that the differences in the distribution of duplicated genes observed in our datasets reflect how and when the genes were duplicated.
We thus chose to take into account the structure of genes when computing the TE environment to eliminate any bias due to structural differences between duplicated genes and singleton genes. In this respect, our results are consistent across our different datasets.
The TE Environment of Genes Differs According to Their Duplication Status
We found that the environments of duplicated genes have fewer TEs than singleton gene environments. This relationship differs according to the TE class under consideration. Singleton genes have more SINEs and DNA transposons in their vicinity than duplicated genes do. On the contrary, LINEs and LTR retrotransposons accumulate more near duplicated genes. We observed a relationship between the GC content and the TE environment of genes when all TE types are considered which is not in agreement with previous studies (Jin et al. 2012). Total TE densities are indeed lower overall in high GC regions than in low GC regions whereas the opposite trend was reported by Jin et al. (2012). We found LINEs had accumulated in low GC regions as previously shown by Gu et al. (2000). However, when individual superfamilies are considered the patterns are more nuanced. In our analyses, L2 accumulate in low GC regions but only to a significant extent when 10-kb flanking regions are considered. The L1, on the contrary, accumulate significantly in high GC regions. SINEs, more specifically the Alu and MIR superfamilies were found here to accumulate in low GC regions. This result contrasts with previous studies considering TE densities across the genome, where the Alu and MIR superfamilies were reported to accumulate in high GC regions (Gu et al. 2000; Lander et al. 2001; Medstrand et al. 2002; Grover et al. 2004; Jin et al. 2012).
DNA transposons and LTR retrotransposons accumulate rather in medium GC regions across the genome (Gu et al. 2000; Medstrand et al. 2002). Interestingly, we observed a negative relationship between GC content and the density of DNA transposons and LTR retrotransposons near genes, suggesting that insertions of these TE classes are distributed differently according to GC content if the sequence is in the vicinity of genes compared with the whole genome. Densities of LTR retrotransposons and L1 elements within human genes were lower in a previous study than predictions based on the surrounding GC content in human (Medstrand et al. 2002). A possible explanation for this difference could be that TEs preferentially insert in AT-rich sites around genes. For example, the LTR retrotransposons Tf1 in Schizosaccharomyces pombe are enriched in promoters of genes involved in the stress response (Guo and Levin 2010; Esnault et al. 2019) and they mostly integrate at genomic sequences bounded by Sap1, an essential DNA-binding protein (Hickey et al. 2015). We found that this tendency differed according the different LTR retrotransposon superfamilies.
The age of TE copies could also explain our observations. In a previous study, Alus distribution in various GC fractions of the human genome was shown to differ according to the divergence of the copies, when considering divergence over 20–25% (Medstrand et al. 2002). For some specific LTR retrotransposon superfamilies (MLT, MER4, and ERV1), the oldest copies (25–30% divergence) are found in lower GC regions compared with the youngest copies (Medstrand et al. 2002). We calculated the median divergence of copies of the relatively young Alu superfamily and the older MIR superfamily but this did not alter the relationship between TE density in the vicinity of genes and the GC content. DNA transposon copies inserted in AT-rich regions tend to be younger than those in more GC-rich regions especially copies with a sequence divergence of less than 20% from the reference (Lander et al. 2001). However, when we analyzed the TE densities of different DNA transposon superfamilies in linear models, considering the mean age of copies did not alter the relationship with GC content.
Our methodology to retrieve TE copies used criteria based on the 80–80–80 rule (Wicker et al. 2007), that is an element belongs to a specific TE family if its length is longer than 80 bp and if it has greater than 80% identity to the reference element (Bailly-Bechet et al. 2014). In addition, we did not separate copies into divergence groups because there was not enough data in the vicinity of genes to perform a robust statistical analysis. Discrepancies might therefore be resolved by using a different methodology.
We found similar values for Ka/Ks ratios between human and chimpanzee genes to those reported in previous studies with a median value of 0.225 and a mean of 0.354 (Sequencing et al. 2005; Mortada et al. 2010) (supplementary fig. S5, Supplementary Material online). Ka/Ks ratios were higher for singleton genes than for duplicated genes, in agreement with previous studies (Jordan et al. 2004) an indication that stronger purifying selection is acting on duplicated genes. We found that the proportion of essential genes among singleton genes is higher than among duplicated genes and Ka/Ks ratios were lower for essential genes than for non-essential genes (supplementary figs. S19–S21, Supplementary Material online). However, the proportion of essential singleton genes was not high enough to observe whether Ka/Ks ratios were higher in duplicated genes compared with singleton genes. More TEs in the vicinity of singleton genes are thus expected under the gene disruption model accounting for the distribution of TEs (Kent et al. 2017).
When we took into account the variations in GC content, gene length (GL), and duplication status, our results show the tendency for TEs, mainly SINEs and DNA transposons, to accumulate near the genes with lower Ka/Ks ratios. Indeed when each class of TEs is analyzed separately, the LINEs and, to a less extent, LTR retrotransposons behave as predicted by the gene disruption model. We observed that the L1 superfamily accumulates in higher Ka/Ks values. It has been recently shown that de novo L1 insertions occur at preintegration sites bearing an AT-rich consensus L1 target motif (Sultana et al. 2019). Moreover, at large genomic scales, L1 integration shows preferential targeting of early-replicating regions of the genome (Sultana et al. 2019). The distribution of these de novo L1 insertions differs from endogenous L1 distribution. The authors concluded that it was rather resulting from evolutionary selection which is in agreement with our own observations.
Our results are similar when we also considered how essential the genes are. These disparities from the model may be partly due to the fact that exons were excluded from the environment calculations. TEs are indeed more often found in intronic regions than in exons (Mortada et al. 2010; Jin et al. 2012), but TE densities calculated with and without exonic regions are still highly correlated (supplementary table S24, Supplementary Material online) indicating the possibility of a very small bias from that source.
It is also possible that the Ka/Ks ratios are valid for coding regions but do not represent selection pressure acting on noncoding flanking regions. Calculation of Ka/Ks ratios indeed deals with substitutions in DNA sequences at the level of codons, checking whether these substitutions change the amino acid in the peptide sequence, but we used TE insertions in flanking regions and introns to calculate TE densities. TE densities in flanking regions are highly significantly correlated with TE densities in introns (supplementary table S25, Supplementary Material online). In a previous study, it has been shown that for human genes with no TE, the percentage identities of their 2- and 10-kb flanking regions with orthologous regions in macaque are significantly higher with orthologous regions in macaque than for human genes with numerous TEs. In human–chimpanzee and human–orangutan comparisons, observations are similar although less often statistically significant (Mortada et al. 2010). These results suggest that through evolutionary time there has been better sequence conservation in the regions flanking TE-free genes than in those flanking TE-rich genes (Mortada et al. 2010). Note that Mortada et al. (2010) found higher Ka/Ks ratios for TE-free genes than for TE-rich genes in a human–chimpanzee comparison, in agreement with our results, and inverse results in a human–mouse comparison. Human and chimpanzee are indeed very closely related, making it difficult to detect the selection pressure acting on TEs at a sufficiently detailed level. Intriguingly our linear model analyses showed a significant and positive relationship between gene TE density and recombination rates which is not expected under the disruption model (Rizzon et al. 2002; Kent et al. 2017). This relationship remained true when DNA transposons, SINEs, LINEs, and LTR retrotransposons were considered separately. These results contrast with previous reports of LINEs that also considered TE density in intergenic regions (Jensen-Seaman et al. 2004). On the other hand, enrichment of particular families of SINEs (AluY), LINEs (L2), and LTR retrotransposons (THE1B and THE1A) was detected in recombination hot spots relative to recombination cold spots (Myers et al. 2008). Our estimated recombination rates do not account for hot and cold spots of recombination because we used a methodology which averages the values along chromosomes. Our approach does nevertheless recognize that the distribution of TEs can be different when all the regions of the genome are considered and when only coding regions are considered, both for recombination rates and Ka/Ks ratios. A positive relationship was previously found for the densities of total TEs and the recombination rate in human tissue-specific genes (Jin et al. 2012). Alus elements are also overrepresented in genes compared with what would be expected based on GC content (Medstrand et al. 2002). Overall our results suggest that TEs close to coding regions, if neutral or even potentially deleterious, could be protected from deletion because a deletion event removing a TE copy that is near or in a gene is also likely to remove valuable sequences around it (Brookfield 2001).
The TE Environment and Duplication Status of Genes Are Associated with Gene Ontology Functional Biases
Can we attribute any of the TE distribution bias between duplicated and singleton genes to gene function? Functional biases between duplicated genes and singleton genes have been considered in yeast (Hakes et al. 2007), human and mouse (Emes et al. 2003; Janoušek et al. 2016), and some plants (Rizzon et al. 2006; Rodgers-Melnick et al. 2012), but without considering the TE environment of the genes. Biases of function related to a gene’s TE environment have been studied in human and mouse more globally (Grover et al. 2003; Sironi et al. 2006; Mortada et al. 2010; Zhang and Mager 2012). Janoušek et al. (2016) found that among the genes attributed to the same GO term, LTR retrotransposon and LINE densities tend to be higher in large gene families than in small gene families and singletons. By contrast, the opposite pattern is found for SINE densities. This is in accordance with our observations that LTR retrotransposon and LINE densities are higher in duplicated genes than in singleton genes whereas SINE densities are higher in singleton genes, without considering gene function. We were curious to further evaluate the contribution of gene function to the observed bias of TE densities according to the duplication status.
Caution must be urged when interpreting GO-based results for at least two reasons. First, only a relatively small proportion of human genes have been assigned GO terms (around 47% for Molecular Function [MF] terms, 55% for Biological Process [BP] terms, and 44% for Cell Component [CC] terms according to PANTHER version 14.1). Second, there are inherent uncertainties and difficulties when dealing with paralogs because the annotation of a sequence that has not been tested experimentally may be extrapolated from the ancestral nodes on PANTHER family trees (Mi et al. 2019). Although it is parsimonious to infer that paralogs carry the same or similar functions, there is a risk of overlooking the possibility that maintaining paralogs in genomes through time may entail subfunctionalization and neofunctionalization (Force et al. 1999; Conant and Wolfe 2008; Rodgers-Melnick et al. 2012). For GO terms with significant biases of representation, we tended to find overrepresentations of duplicated genes compared with singleton genes, consistent with previous studies in yeast (Hakes et al. 2007) and in human (Janoušek et al. 2016).
For example, duplicated genes were overrepresented mainly for the following functions (corresponding to subfamily GO annotation sets; Mi et al. 2019): cellular process, regulation of biological process, cellular response to stimulus and signal, transduction, protein binding, binding, catalytic activity, molecular transducer activity but underrepresented for macromolecule metabolic process. These results are partly in agreement with previous studies although different sets of subfamily GO annotations may have been used (Emes et al. 2003; Janoušek et al. 2016). We also confirmed known biases of function for groups of genes with different TE densities, for example, TE-poor genes are associated with developmental functions, transcription, response to stimulus, cell surface receptor, signaling pathway and regulation of metabolic process, and TE-rich genes are overrepresented in the metabolic process and cellular localization functional groups (Mortada et al. 2010; Zhang and Mager 2012). Interestingly, we found patterns of over- and underrepresentation of genes according to the duplication status to be consistent across the three TE density ranges, though generally less pronounced for TE-rich genes. Notably, more than half of the GO-slim terms with overrepresentation of duplicated genes compared with singleton genes (nine out of 15 for the BP ontology and 14 out of 17 for the MF ontology) also correspond to GO-slim terms with an overrepresentation of genes with TE-poor compared with TE-rich genes. We cannot exclude the possibility that the observed tendencies would differ if TE classes were considered separately (Sironi et al. 2006). However, there is not enough data for gene environments with only one class of TEs to allow further inference from statistical analyses. Overall, our results show that both the duplication status and the TE-density of the gene environment are important when considering the functional representation of genes.
SINE and DNA Elements Are Associated with Essential Genes
We found that duplicated genes are less likely to be essential than singleton genes. These results are consistent with previous studies in human (Wang et al. 2015) and other organisms (Chen, Dahlstrom, et al. 2012; Woods et al. 2013) and with the idea that duplication can provide functional redundancy. We introduced a measure of how essential a gene is, calculated as the fraction of test conditions in which the gene is essential. Higly essential genes correspond to genes with an essentiality value above the median and less-essential genes have lower values. When considering the essentiality status of the genes in linear models we observed a significant link between the TE density and the level of essentiality with an accumulation of TEs in the genes that are highly essential in most test conditions. This is a surprising result. We observed that the essential genes had lower Ka/Ks ratios than non-essential genes (Wilcoxon test, P value < 2 × 10⁻⁶, supplementary fig. S17, Supplementary Material online), in agreement with previous studies (Wang et al. 2015), indicative of a stronger selection pressure on essential genes compared with non-essential genes. According to the disruption model for TE distribution, it is thus expected that TEs should accumulate more in the vicinity of non-essential genes because TE insertions in or near genes may modify their expression or regulation (Medstrand et al. 2002; Hollister and Gaut 2009; Makarevitch et al. 2015). TE insertions would then be more likely to be removed by selection from functionally important portions of the genome than from other parts of the genome. A possible explanation of the opposite relationship could be that essential genes are older than non-essential genes, as known in yeast, mouse, and Drosophila (Chen, Trachana, et al. 2012). Indeed TEs would have had time to accumulate in the neighborhood of essential genes. However, this is not consistent with the observation that among genes with conserved extremes of high or low TE density in the genomes of human, mouse, and cow, higher proportions of ancient genes have extremely low TE density (Zhang and Mager 2012). Moreover, the same relationship with essentiality was not observed when TE classes were considered separately; SINEs and DNA transposons accumulate around essential genes, whereas LINEs and LTR retrotransposons do not. If TEs accumulate in essential genes because they are mostly ancient genes, the TEs in question should also be relatively ancient. It is difficult to assess whether SINEs are more ancient than LINEs and LTR retrotransposons as they are very mobile; there are examples of recent mobilization in the human genome for several TEs from these three classes (Kazazian et al. 1988; Batzer et al. 1991; Medstrand and Mager 1998; Brouha et al. 2003; Wang et al. 2005; Fuchs et al. 2013). Our observations are in agreement with the disruption model for the LINEs and several previous studies are in favor of this argument (Medstrand et al. 2002; Han et al. 2004; Lerat and Sémon 2007). To better understand whether the age of TEs could explain the relationship between TE density and the essentiality status of the genes, we analyzed TE densities according to TE superfamilies, provided the TE copy number was sufficient for statistical analyses. Among SINE superfamilies, Alus are relatively young compared with MIRs. Both Alus and MIRs are denser around highly essential genes compared with less-essential genes. TE densities for the Tc1Mar-Tigger, one of the younger TE superfamilies among DNA transposons, are also significantly higher in highly essential genes compared with less-essential genes.
LINEs and LTR retrotransposons carry regulatory sequences that are likely to have an impact on fitness in or near genes. The observed depletion of these elements in essential genes compared with non-essential genes is in agreement with the disruption model (Medstrand et al. 2002). SINEs and DNA transposons are often small elements and lack the strong promoter sequences carried by LTR retrotransposons and autonomous LINEs. They could thus have a less negative impact near or in genes. This would explain their different pattern of distribution compared with LINEs and LTR retrotransposons. However, it is not in agreement with their accumulation in essential genes compared with non-essential genes which are under a lower selective pressure than essential genes.
The accumulation of SINEs and DNA transposons around essential genes relative to non-essential genes, could be explained at least partly by a relationship between their presence in the vicinity of the genes and gene expression. It has been shown that the fraction of SINEs in genes is positively correlated with the maximum expression level observed for a gene over various tissues. The fraction of human Alus was also positively correlated with the breadth of gene expression, that is the number of tissues in which the gene is expressed (Jjingo et al. 2011). Essential genes have been shown to be expressed at higher levels than dispensable genes (Wang et al. 2015), and they might be expected to be more broadly expressed. In their recent study of enrichment of TEs in regions of the human genome bearing epigenetic hallmarks of active or repressed chromatin, Trizzino et al. (2018) found that SINEs and DNA transposons are the most frequent TE classes enriched in active regions whereas LTR retrotransposons are often enriched in a tissue-specific manner. They proposed that active regions might be more frequently accessible providing more opportunities for TEs to insert in addition to a reduced likelihood of being silenced. Although this could account for a positive relationship between the number of TEs and the active genes that are essential genes, it does not account for our observation of the different distributions of some TE classes in the vicinity of essential genes.
Another possibility could be that TEs are retained in the vicinity of essential genes through their involvement in the regulation of the genes. LTR retrotransposons that escape repression can have a significant impact on the host gene regulation (Jacques et al. 2013; Chuong et al. 2016; Simonti et al. 2017), apparently in a mostly context-dependent manner (Simonti et al. 2017). Interestingly Trizzino et al. (2018) also highlighted a potential tissue-specific regulatory activity for the DNA transposon Charlie15a, that relies on binding regions that its TE copies can provide. Moreover, expression from genes having SINEs or to a less extent, DNA transposons in their vicinity has been shown to be more deregulated in tumors than from genes having no SINE or DNA transposon in their vicinity (Lerat and Sémon 2007). It should be noted that in this study we retrieved human gene essentiality data from OGEE (Chen et al. 2017) which is based on 18 datasets, all but one corresponding to experiments in cancer cell lines. We can hypothesize that an essential gene for a tumor cell line may be non-essential in a healthy cell. If the presence of SINEs and DNA transposons deregulates these genes in tumor conditions, it is possible that this deregulation confers an essentiality status on the genes in the cell line. It would be thus interesting to further study the deregulation of essential genes according to their TE environment.
Cases of exonization have been observed for the Alu sequences in humans (Amit et al. 2007; Sela et al. 2007). Such events seem to happen more often for the Alus than for the other TEs probably because of their structure (Sela et al. 2007; Lev-Maor et al. 2008). Although the TE density in gene introns is correlated with the number of TEs in the exons as shown in several studies (Lander et al. 2001; Jjingo et al. 2011; Jin et al. 2012), genes that are rich in SINEs probably also have relatively more SINEs at the exon level. Constitutive exonization cases are more frequently found in the UTRs or the last exon, which do not change the CDS, than with alternative splicing (Sela et al. 2007). The UTRs contain motifs that can regulate many aspects of mRNA function (Iacono et al. 2005). Considering that TE density in the vicinity of genes is correlated with TE density in gene bodies (Mortada et al. 2010), a possibility is that SINE insertions have been more conserved in the essential genes through their recruitment to regulatory functions of the gene, with a concomitant release of selection pressure for SINEs in the whole neighborhood of the gene. It remains to be demonstrated that the exonization events are correlated with the number of TEs in the neighborhood of the gene.
Interestingly, in Caenorhabditis elegans, it has been shown that the dynamic of non-essential and essential genes varies among duplicated genes. Non-essential genes are both more often duplicated and more often fixed or lost, whereas essential genes are less often duplicated but when the duplication is maintained in the genome, it is for longer periods (Woods et al. 2013). In our study, we have estimated that duplicated genes could account for around 39–58% of essential genes depending on the stringency of the definition used for duplicated genes. A more detailed analysis and comparison of the TE environment of human homologous duplicated genes in terms of their essentiality could help to chart the evolutionary dynamics of TEs and duplicated genes.
SINEs and DNA Transposons Accumulate in Singleton Genes
The relationship between TE density and duplication status of genes is significant for all TEs together and the different TE classes in most cases when considering the essentiality status of the genes, with an accumulation of DNA transposons and SINEs but lower densities of LINEs and LTR retrotransposons in singleton genes compared with duplicated genes. Are DNA transposons and SINEs involved in the process of maintaining duplicated genes? Due to their intrinsic repetitive characteristic, TEs can be anchors for ectopic recombination and participate in the generation of tandemly arrayed genes (Reams and Roth 2015; Lallemand et al. 2020). Evidence is accumulating on how the fate of duplicated genes differs according to the mode of duplication. For example, duplicated yeast genes which have arisen from WGD are not associated with the same sets of functions as duplicated genes generated by small-scale duplications (SSDs) (Hakes et al. 2007; Wapinski et al. 2007). This has also been shown in plants (Blanc and Wolfe 2004; Maere et al. 2005; Hanada et al. 2008; Rodgers-Melnick et al. 2012). For example, in Arabidopsis and rice, tandemly arrayed genes (TAGs) are enriched for genes that encode membrane proteins and function “in abiotic and biotic stress” relative to other duplicated genes. Transcription and DNA- or RNA-binding functions are also underrepresented among TAGs compared with non-TAG duplicated genes (Rizzon et al. 2006). In a recent study in Angiosperms, WGD-duplicated genes have been shown to be under stronger constraints to diverge at the sequence and expression level relative to SSDs (Defoort et al. 2019). Arsovski et al. (2015) examined the density of Arabidopsis DNaseI footprints, which reveal protein-binding sites, in duplicated genes and their vicinity. They found that WGD-duplicated genes have more footprints than TAGs. Moreover, WGD-duplicated genes form denser and more complex regulatory networks than TAGs when genome-wide regulatory networks are analyzed. It would thus be interesting to verify if the density of each TE class, varies both within and between duplicated gene pairs according to the underlying mechanism of duplication. Considering the possible role of TEs in the evolution of gene regulation in mammals (Lowe et al. 2007; Jacques et al. 2013; Sundaram et al. 2014; Trizzino et al. 2018) differing TE patterns between duplicated genes resulting from the same mode of duplication could help us to decipher whether TEs are involved in the retention of genes after duplication.
In conclusion, this study strongly supports the idea that the maintenance and evolution of duplicated genes in the genome are impacted by selection pressure, gene function, and the essentiality of that function. Our results also show that TE distribution in the vicinity of genes is associated to the duplication status of genes. With analyses integrating in particular the GC content of genes our results point to differences in the TE environment of duplicated genes relative to singleton genes according to the TE class. These results are strongly associated with how essential genes are. This suggests that TEs could be influencing the fate of duplicated genes in a way that is closely associated with the function of genes. A detailed analysis of the TE environment around duplicated pairs of genes considering both the mode of duplication and the level of functional conservation between paralogs should help us decipher the specific role of TEs in the fate of duplicated genes. Future work will also require further study of the deregulation of essential genes according to their TE environment.
Materials and Methods
Determination of Gene Families in the Human Genome
Human protein sequences and the positions of corresponding genes, exons, and introns were downloaded from Ensembl (http://www.ensembl.org) according to the latest version of the human genome (GRCh38.p7 = hg38). Only sequences from genes localized on main chromosomes were considered which corresponded to 95,061 protein sequences and 20,213 genes. An all-against-all BlastP search (BlastALL release 2.2.26; Altschul et al. 1997) was performed on protein sequences, using default parameters and an E-value cutoff of 1. For each pair of protein sequences, BLAST hits were merged to compute the total length and global similarity of aligned regions. Merging was an iterative process consisting of several steps: 1) BLAST hits were sorted according to their E-value; 2) the best hit between two proteins was selected and merged with the next best hit between those two proteins if the overlap between hits was <12 amino acids; 3) the process moved to the next best hit, which was merged if it did not overlap with previously selected hits by more than 12 amino acids; and 4) the process was repeated until all BLAST hits between two proteins were merged. When the merging was complete, we computed the percentage of the protein length aligned and the average percentage of identity over the aligned regions. After merging BLAST results, we constructed three gene family datasets according to the level of identity between putative gene family members. For this, protein pairs with 30% identity covering respectively 70%, 80%, and 50% of the protein length were retained as potential paralogous gene pairs forming, respectively, datasets 1–3. For each candidate gene pair, the highest bit score among all hits between their isoforms was included in the dataset.
We used the Walktrap method developed by Pons and Latapy (2005) to gather gene pairs into families for each dataset. To do so, a density parameter of a gene in a family was defined as the proportion of the other genes of the family it is linked to. Starting from the set of all genes, families were then recursively split by the Walktrap algorithm until each gene was either isolated or had a density parameter greater than a given threshold. Single-linked nodes were notably avoided by such a procedure. We constructed datasets of families according to density thresholds of 50%, 70%, and 30% respectively for the datasets 1–3. The chosen values for identity coverage and density levels are arbitrary, allowing us to verify that the analyses are relevant for more or less stringent definitions of homologous gene sets. According to our procedure, dataset 2 corresponds to the most stringent definitions of duplicated genes and dataset 3 the least stringent, whereas dataset 1 can be considered as a trade-off between the two. Results for dataset 1 alone are presented except when results are notably different for the other two datasets. For the purposes of our analyses, the term “duplicated genes” corresponds to members of gene families as defined by the datasets. “Singleton genes” are genes for which no homologous gene was detected inside the human genome so are not included in the corresponding gene family datasets.
Computation of the Density and Coverage of TEs in the Vicinity of Genes
Positions of TE sequences were determined using RepeatMasker annotations (reference of the human genome UCSC hg38) and parsed with the perl tool “One code to find them all” (Bailly-Bechet et al. 2014) using the --strict option. We first estimated the number of TEs within and around genes using each TE position to allocate it to a gene vicinity. To define the vicinity of a gene, we considered either the 2- and 10-kb flanking regions located upstream and downstream of the gene as described by Mortada et al. (2010). Indeed, it has been demonstrated that the promoter regions of human genes can be located as much as 10 kb upstream of the gene start, although the majority of promoters are within a 2-kb region upstream (Kim et al. 2005). We considered the intron–exon structure of genes to compute the density and coverage of TEs. As each gene can have several isoforms, we used localizations of introns and exons obtained from Ensembl to determine the different exonic regions of each gene as the regions overlapping at least one exon in the different isoforms. Regions that did not overlap any exons in the different isoforms were defined as intronic regions. The TE density in the vicinity of each gene, within the 2- and 10-kb flanking regions, was defined as the number of insertions per base pair (E1). TE coverage was defined as the percentage of the gene with flanking regions covered by TE sequences (E2). Both estimations were computed without considering exonic regions or the TE sequences therein.
| (1) |
| (2) |
where N is the number of TEs, Lg the length of the gene, Lf the length of the flanking region (2 or 10 kb), Lexonic the total length of exonic regions of the gene, LTEintronic the length of the TEs overlapping intronic regions, and LTEflanking the length of TEs overlapping upstream and downstream flanking regions. For each TE type (DNA transposons, LTR retrotransposons, LINEs, and SINEs), and where possible each TE superfamily (see supplementary tables of number of copies S2–S5), we computed the TE density and the TE coverage in the same way (see also Grégoire et al. [2016]). As a proxy for estimating the age of TE copies, we calculated the average divergence of TE copies present in the 2- and 10-kb flanking regions upstream and downstream of the genes and in the genes, still without considering exons.
Estimation of the Selection Pressure
Chimpanzee protein sequences were downloaded from Ensembl (https://www.ensembl.org/ release 88, March 2017). For each human and chimpanzee gene, the longest encoded protein was considered. To retrieve orthologous gene pairs between human and chimpanzee the Best Reciprocal Hits (BRH) method was performed as follows. Two all-against-all BlastP comparisons were run on human versus chimpanzee proteins and then on chimpanzee versus human proteins with a maximum E-value threshold of 1 × 10⁻³. BLAST-hits were merged as described above (see the paragraph on the detection of duplicated and singleton genes) with an overlap between hits of less than ten amino acids. Merged hits were filtered according to scores ≥25, E value ≤1 × 10⁻⁵, and coverage length such that at least 40% of the human and chimpanzee proteins were included in the alignment for each merged hit. Between the two BLAST processes, only the BRH was retained. We obtained 16,645 putative human–chimpanzee orthologous gene pairs in this way. Multiple sequence alignments of coding sequence (CDS) and corresponding proteins (in FASTA format) were performed using CLUSTALW (Thompson et al. 1994) using default options. Protein sequence alignments were subsequently imposed on the coding region of nucleotide sequences using a PERL script based on Bioperl functions. For all pairwise alignments, the number of nonsynonymous substitutions per nonsynonymous site (Ka), the number of synonymous substitutions per synonymous site (Ks), and the Ka/Ks ratio were calculated using the PAML package (Yang 1997, 2007) according to the Yang and Nielsen (2000) model.
Estimation of the Recombination Rate
Both physical and genetic distances were used to estimate recombination rates (Recomb, measured in cM/Mb) along human chromosomes. The average genetic and physical position of 5,076 deCODE markers (Kong et al. 2002) were downloaded from UCSC (https://genome.ucsc.edu/cgi-bin/hgTables) in June 2020. For each chromosome, we calculated the best-fitting LOESS curve between physical and genetic distance data using the MareyMap Online tool (http://lbbe-shiny.univ-lyon1.fr/MareyMapOnline/) (Siberchicot et al. 2017). The recombination rate (Recomb) was estimated as the derivative of the LOESS curve using the MareyMap Online tool. Negative Recomb estimates were removed from the analysis.
Calculation of GC Content
We calculated the GC content for each gene plus its 2- and 10-kb flanking regions excluding any TEs. The human chromosome sequences were downloaded from Ensembl (https://www.ensembl.org/ release 88, March 2017) and masked using a Python program if the presence of TE sequences was detected with the program “One code to find them all” (see above) with the result that each base of a TE sequence was replaced with an X. For each gene localized on the masked chromosomes, we extracted the sequences plus its 2- and 10-kb flanking regions. GC content in the vicinity of genes was defined as:
where NG is the number of G bases, NC the number of C bases, Lg the length of the gene, Lf the length of the chosen flanking region (2 or 10 kb), and NX the number of Xs. Fifteen genes were removed from the analysis because their 2-kb flanking regions contained only Xs.
Analysis of Protein Function Distribution
We obtained human phenotypic data from the database of Online GEne Essentiality (OGEE) (Chen et al. 2017). We retrieved 21,556 different genes whose essentiality have been tested under 18 conditions by Chen et al. (2017). Among these genes (Chen et al. 2017), 6,985 are conditional essential genes (CEGs) (37% of tested genes) as defined by Chen et al. (2017) as they are only essential in certain conditions, whereas 183 were defined as essential genes because they are essential in all conditions tested, making a total of 7,168 genes with some degree of essentiality. In OGEE, each of the 21,556 genes tested was considered as essential if found to be so in a minimum of 1 and a maximum of 11 datasets among the 18. To redefine different levels of essentiality and conditional essentiality, we first selected only genes that had been tested for their essentiality in at least five datasets, a total of 17,322 genes. We then defined five categories of essentiality for these genes: “Essential” (E) genes were essential in all the test datasets in which they appeared: “Conditional Restricted Essential” (CRE) genes were essential in fewer than 25% of the test datasets, “Conditional Medium Essential” (CME) genes were essential in between 25% and 75% of the test datasets and “Conditional Largely Essential” (CLE) genes were essential in more than 75% of the test datasets. Other genes were defined as “Non essential” (NoE). We thus retrieved 118 E genes, 3,808 CRE genes, 1,983 CME genes, 984 CLE genes, and 10,423 NoE genes.
GO term enrichments for groups of genes were calculated with the web-based application PANTHER version 14.1 (Mi et al. 2019). We defined gene categories according to their TE density. We did not categorize according to TE coverage for two reasons: 1) TE density is a better estimator of the evolutionary dynamics of TEs than coverage because TE density takes insertion events into account as TE copy numbers are used in the calculation, which is not the case for TE coverage; 2) for simplicity knowing that TE density and TE coverage are highly correlated (Grégoire et al. 2016). The TE-poor gene category was defined as the 25% of genes with the lowest TE densities (for the 2-kb flanking region this corresponds to a TE density <0.51 and for the 10-kb flanking region TE density <0.6009). The TE-rich gene category encompasses the 25% of genes with the highest TE densities (for the 2-kb flanking region this corresponds to a TE density ≥1.63 and for the 10-kb flanking region TE density ≥1.703). The remaining genes were assigned to the TE-medium gene category. For each TE density category, genes were also defined as duplicated genes or singleton genes according to dataset 1. PANTHER was used to extract Gene Ontology (GO) slim terms defined according to the PANTHER classification system (Mi et al. 2019) that were significantly over- or underrepresented in each comparison. PANTHER GO-slim annotations are structured in three ontologies according to GO functions related to Biological Process, Molecular Function section, and Cellular Component. We compared the functions of duplicated genes and singleton genes for each TE density category and flanking region size. Genes of the same gene family are likely to share the same or similar function which is also an assumption of the PANTHER classification system (Mi et al. 2016), so we built random gene sets to ensure that any over- and underrepresentation of GO-slim terms could not be mainly due to gene family sizes. For each set of duplicated genes in TE-poor, TE-medium, and TE-rich categories, one gene was randomly chosen from a gene family. The functions of duplicated genes from these random sets and singleton genes were compared as well as the complete sets. We then compared the functions of sets of genes according to their TE environment (TE-poor vs. TE-rich, TE-poor vs. TE-medium, TE-medium vs. TE-rich) for the two sizes of flanking regions. The statistical tests used were Fisher’s exact tests with false discovery rate (FDR) correction according to the Benjamini–Hochberg procedure.
Statistical Analysis
All statistical calculations were performed using R software (Version 3.4.3). We considered for each dataset, each TE category, and each TE superfamily the following linear model for TE density and TE coverage. In each case, the full linear model can be written where TE corresponds either to TE density or to TE coverage, Status corresponds to a binary variable (one for singleton genes and zero for duplicated genes), GL is the gene length, GC the GC content, the ratio, and Recomb the recombination rate. We also considered for each dataset, each TE category, and each TE superfamily a similar linear model adding essentiality as a covariable for TE density and TE coverage. In each case, the full linear model can be written where Ess corresponds to essentiality. We verified the absence of significant colinearity between the explicative variables of the linear models. TE density, , GC, and GL values were log-transformed to obtain more symmetrical distributions. Analyses of linear models were performed with model selection by Akaike Information Criterion (AIC) in a stepwise algorithm, using the R stepAIC function. When considering TE superfamilies, genes with no copy of the considered superfamily were removed from the analysis.
Supplementary Material
Supplementary data are available at Genome Biology and Evolution online.
Supplementary Material
Acknowledgments
We would like to thank Eduardo Corel, Claudine Devauchelle, Yolande Diaz, and Emma Saulnier for helpful discussions on the determination of duplicated genes and gene family definition. We would like to thank again Yolande Diaz for her technical assistance on the C code of the merge program. We are also grateful to Agathe Guilloux for help for statistical analysis and to Rachel Carol for English proofreading of the manuscript.
Data Availability
The datasets were derived from sources in the public domain: Ensembl (http://www.ensembl.org) and UCSC Genome Browser (http://hgdownload.cse.ucsc.edu/goldenPath/hg38/bigZips/). List and positions of the duplicated genes and transposable elements used in this work are available on request.
Literature Cited
- Acharya D, Ghosh TC.. 2016. Global analysis of human duplicated genes reveals the relative importance of whole-genome duplicates originated in the early vertebrate evolution. BMC Genomics 17(1):1.. [DOI] [PMC free article] [PubMed] [Google Scholar]
- Altschul SF, et al. 1997. Gapped BLAST and PSI-BLAST: a new generation of protein database search programs. Nucleic Acids Res. 25(17):3389–3402. [DOI] [PMC free article] [PubMed] [Google Scholar]
- Amit M, et al. 2007. Biased exonization of transposed elements in duplicated genes: a lesson from the TIF-IA gene. BMC Mol Biol. 8(1):109.. [DOI] [PMC free article] [PubMed] [Google Scholar]
- Arsovski AA, Pradinuk J, Guo XQ, Wang S, Adams KL.. 2015. Evolution of cis-regulatory elements and regulatory networks in duplicated genes of Arabidopsis. Plant Physiol. 169(4):2982–2991. [DOI] [PMC free article] [PubMed] [Google Scholar]
- Bailey JA, Liu G, Eichler EE.. 2003. An Alu transposition model for the origin and expansion of human segmental duplications. Am J Hum Genet. 73(4):823–834. [DOI] [PMC free article] [PubMed] [Google Scholar]
- Bailly-Bechet M, Haudry A, Lerat E.. 2014. “One code to find them all”: a perl tool to conveniently parse RepeatMasker output files. Mob DNA. 5(1):13. [Google Scholar]
- Batzer MA, et al. 1991. Amplification dynamics of human-specific (HS) Alu family members. Nucleic Acids Res. 19(13):3619–3623. [DOI] [PMC free article] [PubMed] [Google Scholar]
- Biémont C, Vieira C.. 2006. Junk DNA as an evolutionary force. Nature 443(7111):521–524. [DOI] [PubMed] [Google Scholar]
- Blanc G, Wolfe KH.. 2004. Functional divergence of duplicated genes formed by polyploidy during Arabidopsis evolution. Plant Cell 16(7):1679–1691. [DOI] [PMC free article] [PubMed] [Google Scholar]
- Britten RJ.2006. Almost all human genes resulted from ancient duplication. Proc Natl Acad Sci U S A. 103(50):19027–19032. [DOI] [PMC free article] [PubMed] [Google Scholar]
- Brookfield JF.2001. Selection on alu sequences? Curr Biol. 11(22):R900–R901. [DOI] [PubMed] [Google Scholar]
- Brouha B, et al. 2003. Hot L1s account for the bulk of retrotransposition in the human population. Proc Natl Acad Sci U S A. 100(9):5280–5285. [DOI] [PMC free article] [PubMed] [Google Scholar]
- Bu L, Katju V.. 2015. Early evolutionary history and genomic features of gene duplicates in the human genome. BMC Genomics 16(1):621.. [DOI] [PMC free article] [PubMed] [Google Scholar]
- Burki F, Kaessmann H.. 2004. Birth and adaptive evolution of a hominoid gene that supports high neurotransmitter flux. Nat Genet. 36(10):1061–1063. [DOI] [PubMed] [Google Scholar]
- Carelli FN, et al. 2016. The life history of retrocopies illuminates the evolution of new mammalian genes. Genome Res. 26(3):301–314. [DOI] [PMC free article] [PubMed] [Google Scholar]
- Casola C, Betrán E.. 2017. The genomic impact of gene retrocopies: what have we learned from comparative genomics, population genomics, and transcriptomic analyses? Genome Biol Evol. 9(6):1351–1373. [DOI] [PMC free article] [PubMed] [Google Scholar]
- Chalopin D, Naville M, Plard F, Galiana D, Volff J-N.. 2015. Comparative analysis of transposable elements highlights mobilome diversity and evolution in vertebrates. Genome Biol Evol. 7(2):567–580. [DOI] [PMC free article] [PubMed] [Google Scholar]
- Chen L, Dahlstrom JE, Lee S-H, Rangasamy D.. 2012. Naturally occurring endo-siRNA silences LINE-1 retrotransposons in human cells through DNA methylation. Epigenetics 7(7):758–771. [DOI] [PubMed] [Google Scholar]
- Chen W-H, Lu G, Chen X, Zhao X-M, Bork P.. 2017. OGEE v2: an update of the online gene essentiality database with special focus on differentially essential genes in human cancer cell lines. Nucleic Acids Res. 45(D1):D940–D944. [DOI] [PMC free article] [PubMed] [Google Scholar]
- Chen W-H, Trachana K, Lercher MJ, Bork P.. 2012. Younger genes are less likely to be essential than older genes, and duplicates are less likely to be essential than singletons of the same age. Mol Biol Evol. 29(7):1703–1706. [DOI] [PMC free article] [PubMed] [Google Scholar]
- Chénais B, Caruso A, Hiard S, Casse N.. 2012. The impact of transposable elements on eukaryotic genomes: from genome size increase to genetic adaptation to stressful environments. Gene 509(1):7–15. [DOI] [PubMed] [Google Scholar]
- Chuong EB, Elde NC, Feschotte C.. 2016. Regulatory evolution of innate immunity through co-option of endogenous retroviruses. Science 351(6277):1083–1087. [DOI] [PMC free article] [PubMed] [Google Scholar]
- Conant GC, Wolfe KH.. 2008. Turning a hobby into a job: how duplicated genes find new functions. Nat Rev Genet. 9(12):938–950. [DOI] [PubMed] [Google Scholar]
- Cordaux R, Batzer MA.. 2009. The impact of retrotransposons on human genome evolution. Nat Rev Genet. 10(10):691–703. [DOI] [PMC free article] [PubMed] [Google Scholar]
- Courseaux A, Nahon J-L.. 2001. Birth of two chimeric genes in the Hominidae lineage. Science 291(5507):1293–1297. [DOI] [PubMed] [Google Scholar]
- Defoort J, Van de Peer Y, Carretero-Paulet L.. 2019. The evolution of gene duplicates in Angiosperms and the impact of protein–protein interactions and the mechanism of duplication. Genome Biol Evol. 11(8):2292–2305. [DOI] [PMC free article] [PubMed] [Google Scholar]
- Dehal P, Boore JL.. 2005. Two rounds of whole genome duplication in the ancestral vertebrate. PLoS Biol. 3(10):e314.. [DOI] [PMC free article] [PubMed] [Google Scholar]
- Emes RD, Goodstadt L, Winter EE, Ponting CP.. 2003. Comparison of the genomes of human and mouse lays the foundation of genome zoology. Hum Mol Genet. 12(7):701–709. [DOI] [PubMed] [Google Scholar]
- Esnault C, Lee M, Ham C, Levin HL.. 2019. Transposable element insertions in fission yeast drive adaptation to environmental stress. Genome Res. 29(1):85–95. [DOI] [PMC free article] [PubMed] [Google Scholar]
- Force A, et al. 1999. Preservation of duplicate genes by complementary, degenerative mutations. Genetics 151(4):1531–1545. [DOI] [PMC free article] [PubMed] [Google Scholar]
- Fuchs NV, et al. 2013. Human endogenous retrovirus K (HML-2) RNA and protein expression is a marker for human embryonic and induced pluripotent stem cells. Retrovirology 10(1):115.. [DOI] [PMC free article] [PubMed] [Google Scholar]
- Grégoire L, Haudry A, Lerat E.. 2016. The transposable element environment of human genes is associated with histone and expression changes in cancer. BMC Genomics 17(1):588.. [DOI] [PMC free article] [PubMed] [Google Scholar]
- Grover D, Majumder PP, Rao CB, Brahmachari SK, Mukerji M.. 2003. Nonrandom distribution of alu elements in genes of various functional categories: insight from analysis of human chromosomes 21 and 22. Mol Biol Evol. 20(9):1420–1424. [DOI] [PubMed] [Google Scholar]
- Grover D, Mukerji M, Bhatnagar P, Kannan K, Brahmachari SK.. 2004. Alu repeat analysis in the complete human genome: trends and variations with respect to genomic composition. Bioinformatics 20(6):813–817. [DOI] [PubMed] [Google Scholar]
- Gu Z, Wang H, Nekrutenko A, Li W-H.. 2000. Densities, length proportions, and other distributional features of repetitive sequences in the human genome estimated from 430 megabases of genomic sequence. Gene 259(1-2):81–88. [DOI] [PubMed] [Google Scholar]
- Guo X, Freyer L, Morrow B, Zheng D.. 2011. Characterization of the past and current duplication activities in the human 22q11.2 region. BMC Genomics 12(1):71.. [DOI] [PMC free article] [PubMed] [Google Scholar]
- Guo Y, Levin HL.. 2010. High-throughput sequencing of retrotransposon integration provides a saturated profile of target activity in Schizosaccharomyces pombe. Genome Res. 20(2):239–248. [DOI] [PMC free article] [PubMed] [Google Scholar]
- Hahn MW, Demuth JP, Han S-G.. 2007. Accelerated rate of gene gain and loss in primates. Genetics 177(3):1941–1949. [DOI] [PMC free article] [PubMed] [Google Scholar]
- Hakes L, Pinney JW, Lovell SC, Oliver SG, Robertson DL.. 2007. All duplicates are not equal: the difference between small-scale and genome duplication. Genome Biol. 8(10):R209.. [DOI] [PMC free article] [PubMed] [Google Scholar]
- Han JS, Szak ST, Boeke JD.. 2004. Transcriptional disruption by the L1 retrotransposon and implications for mammalian transcriptomes. Nature 429(6989):268–274. [DOI] [PubMed] [Google Scholar]
- Hanada K, Zou C, Lehti-Shiu MD, Shinozaki K, Shiu S-H.. 2008. Importance of lineage-specific expansion of plant tandem duplicates in the adaptive response to environmental stimuli. Plant Physiol. 148(2):993–1003. [DOI] [PMC free article] [PubMed] [Google Scholar]
- Hickey A, et al. 2015. Single-nucleotide-specific targeting of the Tf1 retrotransposon promoted by the DNA-binding protein Sap1 of Schizosaccharomyces pombe. Genetics 201(3):905–924. [DOI] [PMC free article] [PubMed] [Google Scholar]
- Hollister JD, Gaut BS.. 2009. Epigenetic silencing of transposable elements: a trade-off between reduced transposition and deleterious effects on neighboring gene expression. Genome Res. 19(8):1419–1428. [DOI] [PMC free article] [PubMed] [Google Scholar]
- Iacono M, Mignone F, Pesole G.. 2005. uAUG and uORFs in human and rodent 5’ untranslated mRNAs. Gene 349:97–105. [DOI] [PubMed] [Google Scholar]
- Innan H, Kondrashov F.. 2010. The evolution of gene duplications: classifying and distinguishing between models. Nat Rev Genet. 11(2):97–108. [DOI] [PubMed] [Google Scholar]
- Jacques P-E, Jeyakani J, Bourque G.. 2013. The majority of primate-specific regulatory sequences are derived from transposable elements. PLoS Genet. 9(5):e1003504.. [DOI] [PMC free article] [PubMed] [Google Scholar]
- Jaillon O, Aury J-M, Wincker P.. 2009. “Changing by doubling”, the impact of whole genome duplications in the evolution of eukaryotes. C R Biol. 332(2-3):241–253. [DOI] [PubMed] [Google Scholar]
- Janoušek V, Karn RC, Laukaitis CM.. 2013. The role of retrotransposons in gene family expansions: insights from the mouse Abp gene family. BMC Evol Biol. 13(1):107.. [DOI] [PMC free article] [PubMed] [Google Scholar]
- Janoušek V, Laukaitis CM, Yanchukov A, Karn RC.. 2016. The role of retrotransposons in gene family expansions in the human and mouse genomes. Genome Biol Evol. 8(9):2632–2650. [DOI] [PMC free article] [PubMed] [Google Scholar]
- Jensen-Seaman MI, et al. 2004. Comparative recombination rates in the rat, mouse, and human genomes. Genome Res. 14(4):528–538. [DOI] [PMC free article] [PubMed] [Google Scholar]
- Jiang Z, et al. 2007. Ancestral reconstruction of segmental duplications reveals punctuated cores of human genome evolution. Nat Genet. 39(11):1361–1368. [DOI] [PubMed] [Google Scholar]
- Jin P, et al. 2012. Evolutionary rate of human tissue-specific genes are related with transposable element insertions. Genetica 140(10-12):513–523. [DOI] [PubMed] [Google Scholar]
- Jjingo D, Huda A, Gundapuneni M, Mariño-Ramírez LJIK. 2011. Effect of the transposable element environment of human genes on gene length and expression. Genome Biol Evol. 3:259–271. [DOI] [PMC free article] [PubMed] [Google Scholar]
- Jordan IK, Rogozin IB, Glazko GV, Koonin EV.. 2003. Origin of a substantial fraction of human regulatory sequences from transposable elements. Trends Genet. 19(2):68–72. [DOI] [PubMed] [Google Scholar]
- Jordan IK, Wolf YI, Koonin EV.. 2004. Duplicated genes evolve slower than singletons despite the initial rate increase. BMC Evol Biol. 4(1):22.. [DOI] [PMC free article] [PubMed] [Google Scholar]
- Kapitonov VV, Jurka J.. 2005. RAG1 core and V (D) J recombination signal sequences were derived from Transib transposons. PLoS Biol. 3(6):e181.. [DOI] [PMC free article] [PubMed] [Google Scholar]
- Kazazian HH Jr, et al. 1988. Haemophilia A resulting from de novo insertion of L1 sequences represents a novel mechanism for mutation in man. Nature 332(6160):164–166. [DOI] [PubMed] [Google Scholar]
- Kent TV, Uzunović J, Wright SI.. 2017. Coevolution between transposable elements and recombination. Phil Trans R Soc B. 372(1736):20160458.. [DOI] [PMC free article] [PubMed] [Google Scholar]
- Kidwell MG.2002. Transposable elements and the evolution of genome size in eukaryotes. Genetica 115(1):49–63. [DOI] [PubMed] [Google Scholar]
- Kidwell MG, Lisch DR.. 2000. Transposable elements and host genome evolution. Trends Ecol Evol. 15(3):95–99. [DOI] [PubMed] [Google Scholar]
- Kim TH, et al. 2005. A high-resolution map of active promoters in the human genome. Nature 436(7052):876–880. [DOI] [PMC free article] [PubMed] [Google Scholar]
- Kondrashov FA.2012. Gene duplication as a mechanism of genomic adaptation to a changing environment. Proc Biol Sci. 279(1749):5048–5057. [DOI] [PMC free article] [PubMed] [Google Scholar]
- Kondrashov FA, Rogozin IB, Wolf YI, Koonin EV.. 2002. Selection in the evolution of gene duplications. Genome Biol. 3(2):research0008–1. [DOI] [PMC free article] [PubMed] [Google Scholar]
- Kong A, et al. 2002. A high-resolution recombination map of the human genome. Nat Genet. 31(3):241–247. [DOI] [PubMed] [Google Scholar]
- Konrad A, Teufel AI, Grahnen JA, Liberles DA.. 2011. Toward a general model for the evolutionary dynamics of gene duplicates. Genome Biol Evol. 3:1197–1209. [DOI] [PMC free article] [PubMed] [Google Scholar]
- Kratz E, Dugas JC, Ngai J.. 2002. Odorant receptor gene regulation: implications from genomic organization. Trends Genet. 18(1):29–34. [DOI] [PubMed] [Google Scholar]
- Lallemand T, Leduc M, Landès C, Rizzon C, Lerat E.. 2020. An overview of duplicated gene detection methods: why the duplication mechanism has to be accounted for in their choice. Genes 11(9):1046.. [DOI] [PMC free article] [PubMed] [Google Scholar]
- Lan X, Pritchard JK.. 2016. Coregulation of tandem duplicate genes slows evolution of subfunctionalization in mammals. Science 352(6288):1009–1013. [DOI] [PMC free article] [PubMed] [Google Scholar]
- Lander ES, et al. 2001. Initial sequencing and analysis of the human genome. Nature 409(6822):860–921. [DOI] [PubMed] [Google Scholar]
- Lannes R, Rizzon C, Lerat E.. 2019. Does the presence of transposable elements impact the epigenetic environment of human duplicated genes? Genes 10(3):249.. [DOI] [PMC free article] [PubMed] [Google Scholar]
- Lerat E, Sémon M.. 2007. Influence of the transposable element neighborhood on human gene expression in normal and tumor tissues. Gene 396(2):303–311. [DOI] [PubMed] [Google Scholar]
- Lev-Maor G, et al. 2008. Intronic Alus influence alternative splicing. PLoS Genet. 4(9):e1000204.. [DOI] [PMC free article] [PubMed] [Google Scholar]
- Liu G, et al. 2015. Gene essentiality is a quantitative property linked to cellular evolvability. Cell 163(6):1388–1399. [DOI] [PubMed] [Google Scholar]
- Lowe CB, Bejerano G, Haussler D.. 2007. Thousands of human mobile element fragments undergo strong purifying selection near developmental genes. Proc Natl Acad Sci U S A. 104(19):8005–8010. [DOI] [PMC free article] [PubMed] [Google Scholar]
- Lynch M, Conery JS.. 2000. The evolutionary fate and consequences of duplicate genes. Science 290(5494):1151–1155. [DOI] [PubMed] [Google Scholar]
- Maere S, et al. 2005. Modeling gene and genome duplications in eukaryotes. Proc Natl Acad Sci U S A. 102(15):5454–5459. [DOI] [PMC free article] [PubMed] [Google Scholar]
- Makarevitch I, et al. 2015. Transposable elements contribute to activation of maize genes in response to abiotic stress. PLoS Genet. 11(1):e1004915.. [DOI] [PMC free article] [PubMed] [Google Scholar]
- Makino T, McLysaght A.. 2010. Ohnologs in the human genome are dosage balanced and frequently associated with disease. Proc Natl Acad Sci U S A. 107(20):9270–9274. [DOI] [PMC free article] [PubMed] [Google Scholar]
- Marques-Bonet T, Girirajan S, Eichler EE.. 2009. The origins and impact of primate segmental duplications. Trends Genet. 25(10):443–454. [DOI] [PMC free article] [PubMed] [Google Scholar]
- McKenzie SK, Kronauer DJ.. 2018. The genomic architecture and molecular evolution of ant odorant receptors. Genome Res. 28(11):1757–1765. [DOI] [PMC free article] [PubMed] [Google Scholar]
- McLysaght A, Hokamp K, Wolfe KH.. 2002. Extensive genomic duplication during early chordate evolution. Nat Genet. 31(2):200–204. [DOI] [PubMed] [Google Scholar]
- Medstrand P, Mager DL.. 1998. Human-specific integrations of the HERV-K endogenous retrovirus family. J Virol. 72(12):9782–9787. [DOI] [PMC free article] [PubMed] [Google Scholar]
- Medstrand P, Van De Lagemaat LN, Mager DL.. 2002. Retroelement distributions in the human genome: variations associated with age and proximity to genes. Genome Res. 12(10):1483–1495. [DOI] [PMC free article] [PubMed] [Google Scholar]
- Mi H, et al. 2019. Protocol Update for large-scale genome and gene function analysis with the PANTHER classification system (v. 14.0). Nat Protoc. 14(3):703–721. [DOI] [PMC free article] [PubMed] [Google Scholar]
- Mi H, Poudel S, Muruganujan A, Casagrande JT, Thomas PD.. 2016. PANTHER version 10: expanded protein families and functions, and analysis tools. Nucleic Acids Res. 44(D1):D336–D342. [DOI] [PMC free article] [PubMed] [Google Scholar]
- Mills RE, Bennett EA, Iskow RC, Devine SE.. 2007. Which transposable elements are active in the human genome? Trends Genet. 23(4):183–191. [DOI] [PubMed] [Google Scholar]
- Mortada H, Vieira C, Lerat E.. 2010. Genes devoid of full-length transposable element insertions are involved in development and in the regulation of transcription in human and closely related species. J Mol Evol. 71(3):180–191. [DOI] [PubMed] [Google Scholar]
- Myers S, Freeman C, Auton A, Donnelly P, McVean G.. 2008. A common sequence motif associated with recombination hot spots and genome instability in humans. Nat Genet. 40(9):1124–1129. [DOI] [PubMed] [Google Scholar]
- Nakatani Y, Takeda H, Kohara Y, Morishita S.. 2007. Reconstruction of the vertebrate ancestral genome reveals dynamic genome reorganization in early vertebrates. Genome Res. 17(9):1254–1265. [DOI] [PMC free article] [PubMed] [Google Scholar]
- Naseeb S, Ames RM, Delneri D, Lovell SC.. 2017. Rapid functional and evolutionary changes follow gene duplication in yeast. Proc R Soc B. 284(1861):20171393.. [DOI] [PMC free article] [PubMed] [Google Scholar]
- Nekrutenko A, Li W-H.. 2001. Transposable elements are found in a large number of human protein-coding genes. Trends Genet. 17(11):619–621. [DOI] [PubMed] [Google Scholar]
- Niimura Y, Nei M.. 2003. Evolution of olfactory receptor genes in the human genome. Proc Natl Acad Sci U S A. 100(21):12235–12240. [DOI] [PMC free article] [PubMed] [Google Scholar]
- Ohno S.1970. Evolution by gene duplication. Berlin/Heidelberg, Germany: Springer.
- Pan D, Zhang L.. 2008. Tandemly arrayed genes in vertebrate genomes. Comp Funct Genomics. 2008:1–11. [DOI] [PMC free article] [PubMed] [Google Scholar]
- Petersen M, et al. 2019. Diversity and evolution of the transposable element repertoire in arthropods with particular reference to insects. BMC Evol Biol. 19(1):11.. [DOI] [PMC free article] [PubMed] [Google Scholar]
- Pons P, Latapy M.. 2005. Computing communities in large networks using random walks. In: Yolum P, Güngör T, Gürgen F, Özturan C, editors. Computer and Information Sciences - ISCIS 2005. Lecture Notes in Computer Science. Vol. 3733. Berlin, Heidelberg:. Springer. p. 284–293. [Google Scholar]
- Rancati G, Moffat J, Typas A, Pavelka N.. 2018. Emerging and evolving concepts in gene essentiality. Nat Rev Genet. 19(1):34–49. [DOI] [PubMed] [Google Scholar]
- Reams AB, Roth JR.. 2015. Mechanisms of gene duplication and amplification. Cold Spring Harb Perspect Biol. 7(2):a016592.. [DOI] [PMC free article] [PubMed] [Google Scholar]
- Rizzon C, Marais G, Gouy M, Biémont C.. 2002. Recombination rate and the distribution of transposable elements in the Drosophila melanogaster genome. Genome Res. 12(3):400–407. [DOI] [PMC free article] [PubMed] [Google Scholar]
- Rizzon C, Ponger L, Gaut BS.. 2006. Striking similarities in the genomic distribution of tandemly arrayed genes in Arabidopsis and rice. PLoS Comput Biol. 2(9):e115.. [DOI] [PMC free article] [PubMed] [Google Scholar]
- Rodgers-Melnick E, et al. 2012. Contrasting patterns of evolution following whole genome versus tandem duplication events in Populus. Genome Res. 22(1):95–105. [DOI] [PMC free article] [PubMed] [Google Scholar]
- Sela N, et al. 2007. Comparative analysis of transposed element insertion within human and mouse genomes reveals Alu’s unique role in shaping the human transcriptome. Genome Biol. 8(6):R127.. [DOI] [PMC free article] [PubMed] [Google Scholar]
- Sequencing TC, Consortium A, et al. 2005. Initial sequence of the chimpanzee genome and comparison with the human genome. Nature 437(7055):69–87. [DOI] [PubMed] [Google Scholar]
- Shashidharan P, et al. 1994. Novel human glutamate dehydrogenase expressed in neural and testicular tissues and encoded by an X-linked intronless gene. J Biol Chem. 269(24):16971–16976. [PubMed] [Google Scholar]
- Shoja V, Zhang L.. 2006. A roadmap of tandemly arrayed genes in the genomes of human, mouse, and rat. Mol Biol Evol. 23(11):2134–2141. [DOI] [PubMed] [Google Scholar]
- Siberchicot A, Bessy A, Guéguen L, Marais GA.. 2017. Mareymap online: a user-friendly web application and database service for estimating recombination rates using physical and genetic maps. Genome Biol Evol. 9(10):2506–2509. [DOI] [PMC free article] [PubMed] [Google Scholar]
- Simons C, Pheasant M, Makunin IV, Mattick JS.. 2006. Transposon-free regions in mammalian genomes. Genome Res. 16(2):164–172. [DOI] [PMC free article] [PubMed] [Google Scholar]
- Simonti CN, Pavličev M, Capra JA.. 2017. Transposable element exaptation into regulatory regions is rare, influenced by evolutionary age, and subject to pleiotropic constraints. Mol Biol Evol. 34(11):2856–2869. [DOI] [PMC free article] [PubMed] [Google Scholar]
- Singh PP, Affeldt S, Malaguti G, Isambert H.. 2014. Human dominant disease genes are enriched in paralogs originating from whole genome duplication. PLoS Comput Biol. 10(7):e1003754.. [DOI] [PMC free article] [PubMed] [Google Scholar]
- Singh PP, Arora J, Isambert H.. 2015. Identification of ohnolog genes originating from whole genome duplication in early vertebrates, based on synteny comparison across multiple genomes. PLoS Comput Biol. 11(7):e1004394.. [DOI] [PMC free article] [PubMed] [Google Scholar]
- Sinzelle L, Izsvak Z, Ivics Z.. 2009. Molecular domestication of transposable elements: from detrimental parasites to useful host genes. Cell Mol Life Sci. 66(6):1073–1093. [DOI] [PMC free article] [PubMed] [Google Scholar]
- Sironi M, et al. 2006. Gene function and expression level influence the insertion/fixation dynamics of distinct transposon families in mammalian introns. Genome Biol. 7(12):R120.. [DOI] [PMC free article] [PubMed] [Google Scholar]
- Sultana T, et al. 2019. The landscape of l1 retrotransposons in the human genome is shaped by pre-insertion sequence biases and post-insertion selection. Mol Cell. 74(3):555–570. [DOI] [PubMed] [Google Scholar]
- Sundaram V, et al. 2014. Widespread contribution of transposable elements to the innovation of gene regulatory networks. Genome Res. 24(12):1963–1976. [DOI] [PMC free article] [PubMed] [Google Scholar]
- Thompson JD, Higgins DG, Gibson TJ.. 1994. CLUSTAL W: improving the sensitivity of progressive multiple sequence alignment through sequence weighting, position-specific gap penalties and weight matrix choice. Nucleic Acids Res. 22(22):4673–4680. [DOI] [PMC free article] [PubMed] [Google Scholar]
- Tian Z, et al. 2009. Do genetic recombination and gene density shape the pattern of DNA elimination in rice long terminal repeat retrotransposons? Genome Res. 19(12):2221–2230. [DOI] [PMC free article] [PubMed] [Google Scholar]
- Trizzino M, Kapusta A, Brown CD.. 2018. Transposable elements generate regulatory novelty in a tissue-specific fashion. BMC Genomics 19(1):468.. [DOI] [PMC free article] [PubMed] [Google Scholar]
- Van Zelm MC, et al. 2008. Gross deletions involving IGHM, BTK, or Artemis: a model for genomic lesions mediated by transposable elements. Am J Hum Genet. 82(2):320–332. [DOI] [PMC free article] [PubMed] [Google Scholar]
- Vinogradov AE.2005. Dualism of gene GC content and CpG pattern in regard to expression in the human genome: magnitude versus breadth. Trends Genet. 21(12):639–643. [DOI] [PubMed] [Google Scholar]
- Wang H, et al. 2005. SVA elements: a hominid-specific retroposon family. J Mol Biol. 354(4):994–1007. [DOI] [PubMed] [Google Scholar]
- Wang T, et al. 2015. Identification and characterization of essential genes in the human genome. Science 350(6264):1096–1101. [DOI] [PMC free article] [PubMed] [Google Scholar]
- Wapinski I, Pfeffer A, Friedman N, Regev A.. 2007. Natural history and evolutionary principles of gene duplication in fungi. Nature 449(7158):54–61. [DOI] [PubMed] [Google Scholar]
- Wicker T, et al. 2007. A unified classification system for eukaryotic transposable elements. Nat Rev Genet. 8(12):973–982. [DOI] [PubMed] [Google Scholar]
- Witherspoon DJ, et al. 2009. Alu repeats increase local recombination rates. BMC Genomics 10(1):530.. [DOI] [PMC free article] [PubMed] [Google Scholar]
- Woods S, et al. 2013. Duplication and retention biases of essential and non-essential genes revealed by systematic knockdown analyses. PLoS Genet. 9(5):e1003330.. [DOI] [PMC free article] [PubMed] [Google Scholar]
- Wu C, Lu J.. 2019. Diversification of transposable elements in Arthropods and its impact on genome evolution. Genes 10(5):338.. [DOI] [PMC free article] [PubMed] [Google Scholar]
- Xu G, Guo C, Shan H, Kong H.. 2012. Divergence of duplicate genes in exon–intron structure. Proc Natl Acad Sci U S A. 109(4):1187–1192. [DOI] [PMC free article] [PubMed] [Google Scholar]
- Yang Z.1997. PAML: a program package for phylogenetic analysis by maximum likelihood. Comput Appl Biosci. 13(5):555–556. [DOI] [PubMed] [Google Scholar]
- Yang Z.2007. Paml 4: phylogenetic analysis by maximum likelihood. Mol Biol Evol. 24(8):1586–1591. [DOI] [PubMed] [Google Scholar]
- Yang Z, Nielsen R.. 2000. Estimating synonymous and nonsynonymous substitution rates under realistic evolutionary models. Mol Biol Evol. 17(1):32–43. [DOI] [PubMed] [Google Scholar]
- Zhang J.2003. Evolution by gene duplication: an update. Trends Ecol Evol. 18(6):292–298. [Google Scholar]
- Zhang Y, et al. 2019. Transposon molecular domestication and the evolution of the rag recombinase. Nature 569(7754):79–84. [DOI] [PMC free article] [PubMed] [Google Scholar]
- Zhang Y, Mager DL.. 2012. Gene properties and chromatin state influence the accumulation of transposable elements in genes. PLoS One 7(1):e30158.. [DOI] [PMC free article] [PubMed] [Google Scholar]
- Zhang Y, Romanish MT, Mager DL.. 2011. Distributions of transposable elements reveal hazardous zones in mammalian introns. PLoS Comput Biol. 7(5):e1002046.. [DOI] [PMC free article] [PubMed] [Google Scholar]
- Zhou Y, Mishra B.. 2005. Quantifying the mechanisms for segmental duplications in mammalian genomes by statistical analysis and modeling. Proc Natl Acad Sci U S A. 102(11):4051–4056. [DOI] [PMC free article] [PubMed] [Google Scholar]
Associated Data
This section collects any data citations, data availability statements, or supplementary materials included in this article.
Supplementary Materials
Data Availability Statement
The datasets were derived from sources in the public domain: Ensembl (http://www.ensembl.org) and UCSC Genome Browser (http://hgdownload.cse.ucsc.edu/goldenPath/hg38/bigZips/). List and positions of the duplicated genes and transposable elements used in this work are available on request.