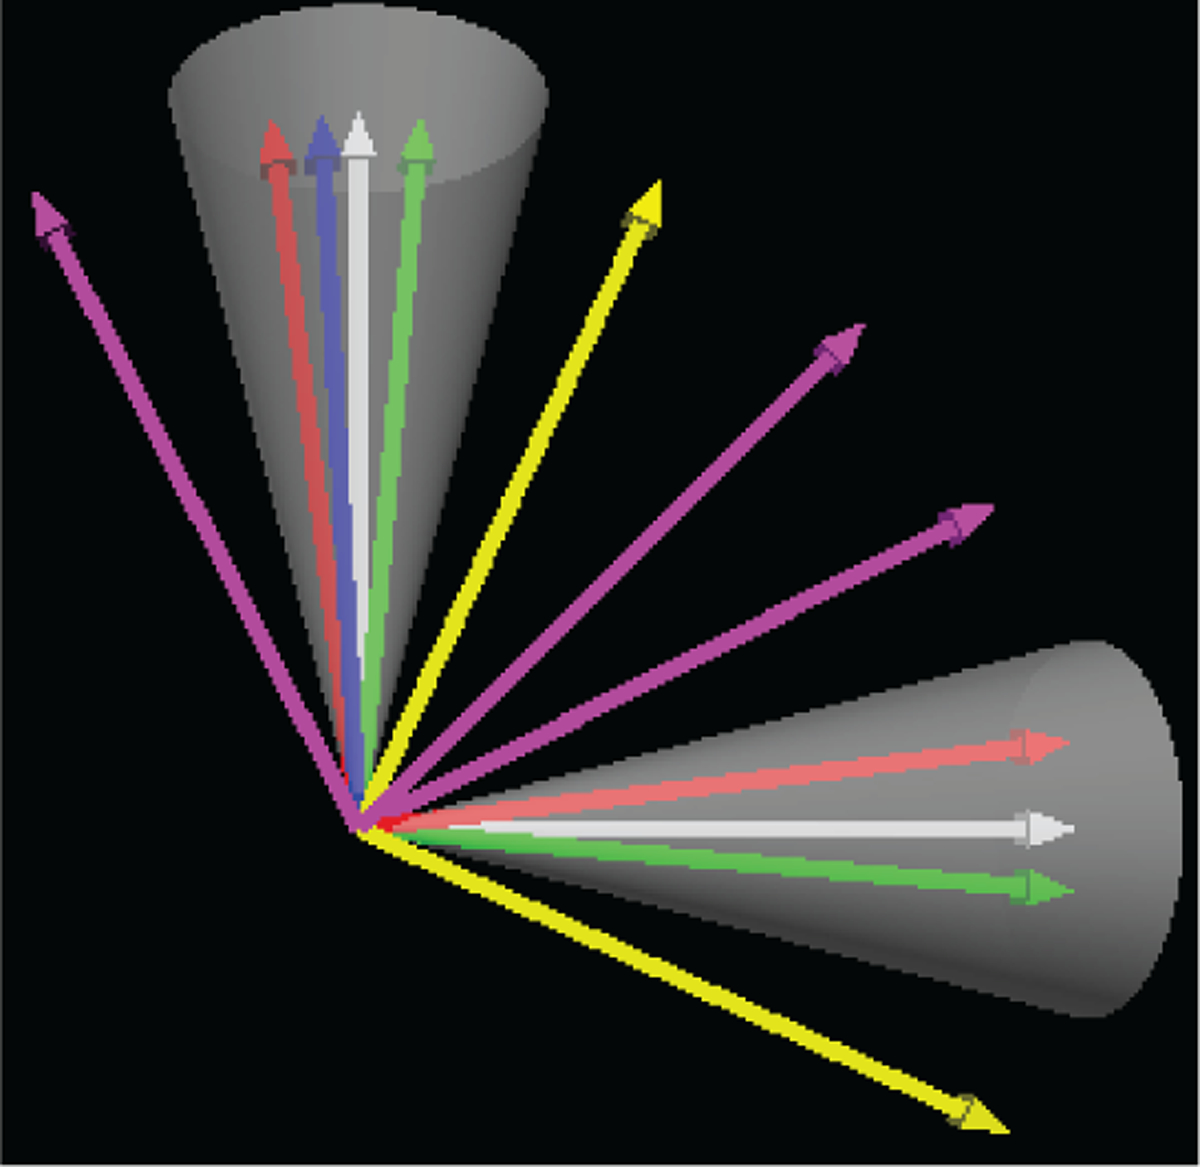
Figure 1: Peak Consistency.

The peaks detected from each fODF are indicated by identically colored arrows. The cones cover peak orientations subtending an angle θC with the white arrows. The white peaks are said to be consistent with the peaks within these cones. In this case, SPC = 3/5 and SPC = 2/5, respectively for the vertical and horizontal white peaks, and MPC = 2/5.
