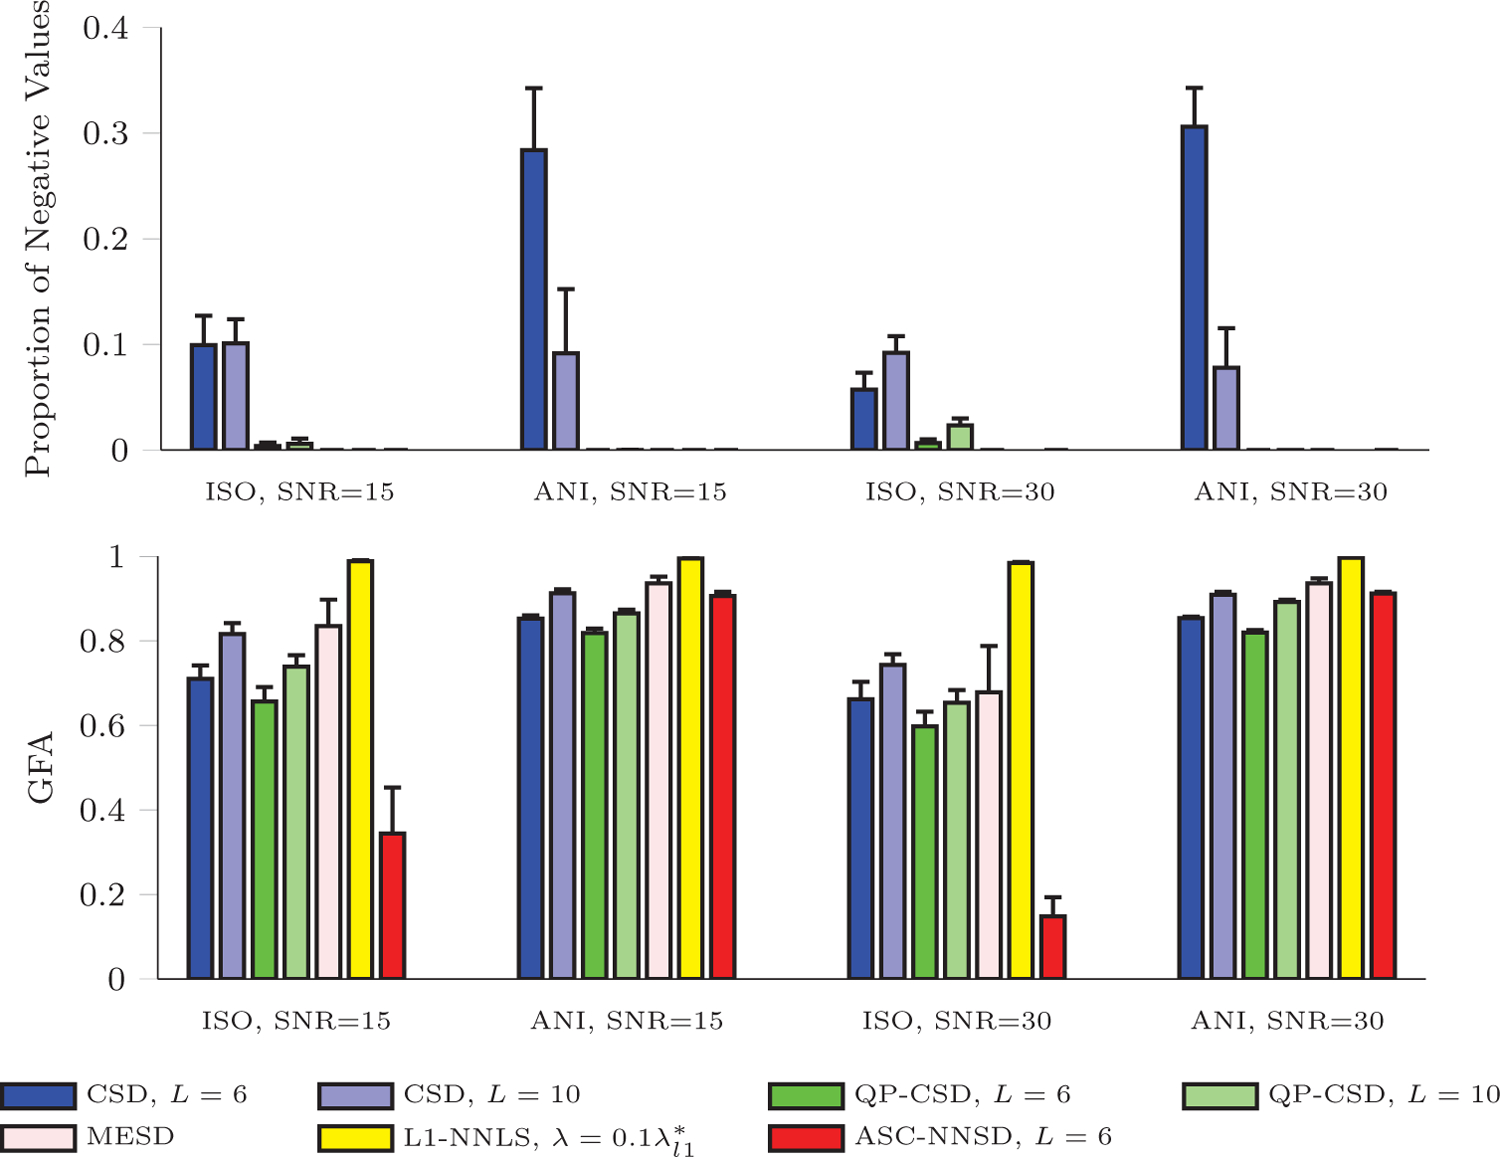
Figure 3: Nonnegativity and Anisotropy.

Proportions of negative values and GFA values of fODFs estimated from isotropic (ISO) and anisotropic (ANI) data. The error bars indicate standard deviations.

Proportions of negative values and GFA values of fODFs estimated from isotropic (ISO) and anisotropic (ANI) data. The error bars indicate standard deviations.