Ho et al. demonstrate that old HSCs are extremely resistant to bloodborne systemic rejuvenation approaches and long-term exposure to a young BM niche microenvironment, maintaining a cell-intrinsic aged state. They also show that young HSCs are not affected by old blood or blood-derived factors, an important finding for transplantations in older patients and other emerging anti-aging interventions.
Abstract
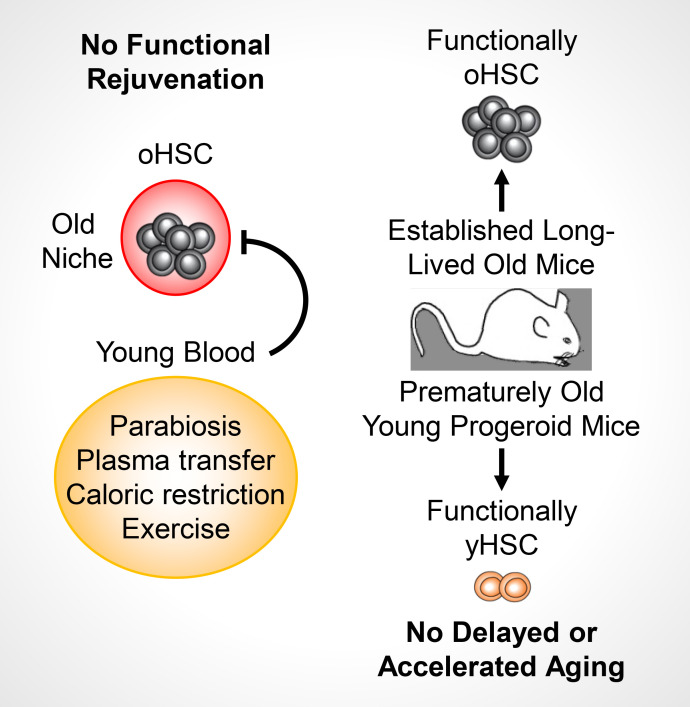
While young blood can restore many aged tissues, its effects on the aged blood system itself and old hematopoietic stem cells (HSCs) have not been determined. Here, we used transplantation, parabiosis, plasma transfer, exercise, calorie restriction, and aging mutant mice to understand the effects of age-regulated systemic factors on HSCs and their bone marrow (BM) niche. We found that neither exposure to young blood, nor long-term residence in young niches after parabiont separation, nor direct heterochronic transplantation had any observable rejuvenating effects on old HSCs. Likewise, exercise and calorie restriction did not improve old HSC function, nor old BM niches. Conversely, young HSCs were not affected by systemic pro-aging conditions, and HSC function was not impacted by mutations influencing organismal aging in established long-lived or progeroid genetic models. Therefore, the blood system that carries factors with either rejuvenating or pro-aging properties for many other tissues is itself refractory to those factors.
Graphical Abstract
Introduction
Aging is characterized by a stereotypical decline in tissue function and regenerative capability (López-Otín et al., 2013) and is the greatest risk factor for most major diseases (Niccoli and Partridge, 2012). In particular, the deterioration of somatic stem cells is a leading cause of tissue decline in organismal aging (Rando, 2006). Recent studies have shown the remarkable ability of young blood to restore aged tissues, including brain, vasculature, and skeletal muscle, in part by improving stem cell function (Conboy et al., 2005; Villeda et al., 2014; Katsimpardi et al., 2014; Sinha et al., 2014). Likewise, known longevity-promoting interventions, such as exercise and calorie restriction, have many tissue-rejuvenating properties that are also linked to enhanced stem cell activity (López-Otín et al., 2013; Garatachea et al., 2015; Horowitz and Villeda, 2017).
Hematopoietic stem cells (HSCs) are responsible for the lifelong production of the blood system, and their stereotypical decline with age causes anemia, immune deficiency, clonal hematopoiesis, and hematological malignancy (Rossi et al., 2008; Jaiswal et al., 2014; Genovese et al., 2014). Blood aging arises through a combination of cell-intrinsic and cell-extrinsic deregulations that act in concert to alter HSC function, representing potential targets for rejuvenation interventions (Verovskaya et al., 2019). Many cell-intrinsic regulators of HSC aging have been identified so far, including genomic instability associated with DNA repair deficiency (Rossi et al., 2007; Mohrin et al., 2010) or replication stress (Flach et al., 2014), autophagy and metabolic deregulation (Ho et al., 2017), mitochondrial stress (Mohrin et al., 2015; Luo et al., 2019), epigenetic drift linked to replicative lifespan (Beerman et al., 2013; Sun et al., 2014), and altered cell polarity and Wnt signaling (Florian et al., 2012, 2013). While it still remains poorly understood how these dysregulated processes integrate with each other to drive HSC aging, approaches targeting certain cell-intrinsic features of the old HSC state have been effective at reverting some aspects of old HSC dysfunction (Chen et al., 2009; Florian et al., 2012; Cheng et al., 2014; Mohrin et al., 2015; Chang et al., 2016; Luo et al., 2019). In addition, changes to the old bone marrow (BM) microenvironment, such as remodeling of BM niche cells (Kusumbe et al., 2016; Guidi et al., 2017; Poulos et al., 2017; Maryanovich et al., 2018; Ho et al., 2019) and the development of a localized pro-inflammatory milieu (Ergen et al., 2012; Frisch et al., 2019; Valletta et al., 2020), directly contribute to HSC aging and the biased output of the old blood system. Interventions restoring the functionality of old BM niche populations or targeting specific factors in the aged BM milieu have likewise ameliorated certain features of old age in the blood system (Maryanovich et al., 2018; Valletta et al., 2020); however, it remains unknown whether the dysfunctional properties of old HSCs and their inflamed and degraded BM niche can be restored by systemic anti-aging interventions.
The blood carries oxygen and circulating hematopoietic cells to every tissue across the body, as well as secreted factors that systemically regulate organ function (Conboy et al., 2013; Rebo et al., 2016; Khrimian et al., 2017). In particular, exposure to circulating blood constituents from young animals via parabiosis and plasma transfer has been shown to have profound rejuvenating properties for almost every tissue and stem cell population examined so far (Conese et al., 2017). This raises the exciting possibility that HSC aging might also be reverted by exposure to young blood. Here, we used an array of techniques, including heterochronic parabiosis and transplantation approaches, plasma transfer experiments, known anti-aging interventions, and both short-lived and long-lived aging mutant mice, to understand the effects of systemic bloodborne factors and altered aging conditions on old HSCs and their niche.
Results
Transplantation does not improve old HSC function
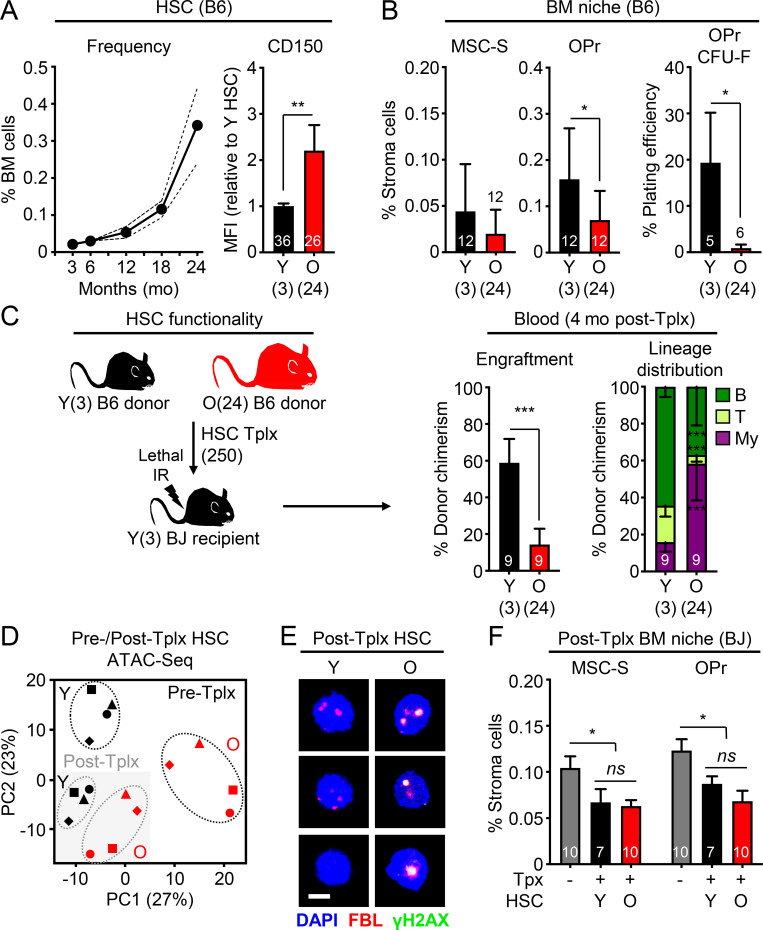
To obtain a timeline of age-associated HSC expansion in wild-type C57Bl6-CD45.2 (B6) mice, we immunophenotyped Lin−/Sca-1+/c-Kit+/Flk2−/CD48−/CD150+ HSCs and confirmed the stereotypical aging phenotype of elevated frequency of HSCs with high CD150 expression starting by 12 mo of age (middle age), and then markedly expanding by 18 mo, and even more by 24 mo of age (Fig. 1 A and Fig. S1 A). This age-related increase was present irrespective of the mouse sex, and we used both males and females to isolate young (Y) HSCs from ∼3-mo-old and old (O) HSCs from 24-mo-old B6 mice. We also quantified the deterioration of the aged BM niche microenvironment in 24-mo-old B6 mice by evaluating the changes in endosteal peri-arteriolar Sca-1+ mesenchymal stromal cells (MSC-S) and bone-forming CD51+ osteoprogenitors (OPrs; Fig. S1 B; Schepers et al., 2013). In old mice, we found a trending decrease in MSC-S frequency associated with a significant reduction in both frequency and fibroblast CFU (CFU-F) capacity of their OPr progeny (Fig. 1 B). Finally, we confirmed the well-documented functional impairment of old HSCs using transplantation of 250 purified B6 HSCs into lethally irradiated young C57Bl6-CD45.1 (BJ) syngeneic recipients. We tracked B6 donor cell chimerism in the peripheral blood over time and lineage distribution at 4 mo after transplantation, the gold standard for evaluating HSC regenerative function (Orford and Scadden, 2008). As expected, we observed reduced engraftment capacity and impaired lymphoid output leading to myeloid-biased reconstitution activity from transplanted old HSCs (Fig. 1 C and Fig. S1 C). These analyses established the baseline aging phenotypes that we are attempting to rejuvenate.
Figure 1.
The stress of transplantation precludes improvement of old HSC function by young niches. (A) Kinetics of HSC expansion and CD150 levels with age. Expansion results are means from five pooled mice per age group with confidence interval derived from another 6–11 mice analyzed individually at 3, 18, and 24 mo. CD150 results are a compilation of all control young and old HSCs used in this study. (B) Age-associated BM niche deterioration in young and old mice with frequency of endosteal MSC-S and both frequency and CFU-F activity of their OPr derivatives. Results are a compilation of all control young and old mice used in this study. (C) Regenerative ability of 250 young or old B6 donor HSCs transplanted (Tplx) into lethally irradiated young BJ recipient mice with experimental setup (left), donor chimerism (middle), and lineage distribution (right) at 4 mo after transplantation in peripheral blood. (D) Principal component (PC) analysis of ATAC-seq data for paired samples of young and old HSCs before (Pre-Tplx) and 3 mo after transplantation (Post-Tplx). (E) γH2AX/FBL immunofluorescence staining in post-transplantation (4 mo) young and old HSCs. Scale bar, 10 µm. (F) Frequency of MSC-S and OPr in post-transplantation (4 mo) BJ recipient mice engrafted with young or old HSCs. Levels for those populations in non-irradiated and non-transplanted young BJ mice are shown in gray. MFI, mean fluorescence intensity. Data are means ± SD except when indicated; *, P ≤ 0.05; **, P ≤ 0.01; ***, P ≤ 0.001.
Figure S1.
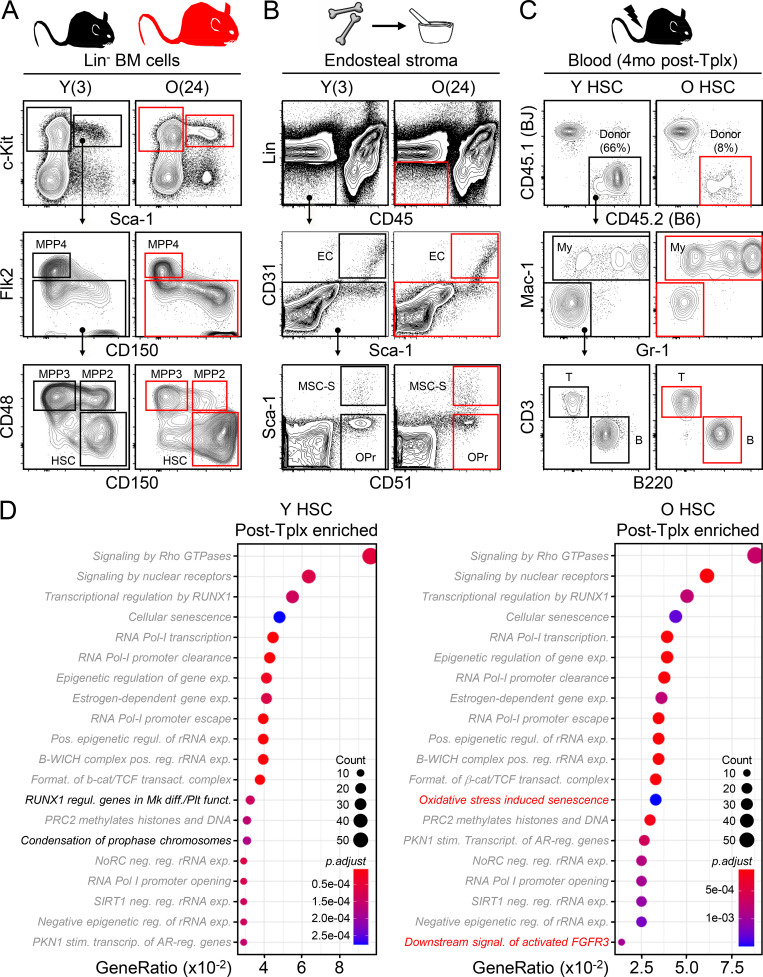
Gating strategies and ATAC-seq results for young and old HSC transplantations. (A) Gating strategy for BM analyses in young (Y, 3 mo old) and old (O, 24 mo old) mice. MPP2 and MPP3, myeloid-biased MPP; MPP4, lymphoid-biased MPP; GMP, granulocyte/macrophage progenitor. (B) Preparation and gating strategy for endosteal BM niche populations. EC, endothelial cell. (C) Gating strategy for peripheral blood chimerism analyses. Results are shown at 4 mo after transplantation. My, myeloid; B, B cells; T, T cells. (D) Top 20 pathways enriched in differentially accessible peaks at promoters (±1 kb from TSS) in post-transplantation vs. pre-transplantation young (left) and old (right) HSC samples. Gray indicates common pathways and black/red refers to pathways specific to each population.
We then addressed why transplantation into young mice does not improve the old HSC functional state. Since an altered epigenetic signature is one of the more reproducible characteristics of old HSCs (Beerman and Rossi, 2015), we performed ATAC (Assay for Transposase-Accessible Chromatin) sequencing (ATAC-seq) on biologically paired pre- and post-transplantation young and old HSCs. We used mice at 3 to 4 mo after transplantation for these analyses to exclude the initial stress of engraftment in an irradiated BM microenvironment and to investigate donor-derived HSCs that have re-entered quiescence after regenerating the blood system. Principal component analyses revealed an intriguing convergence in chromatin accessibility between young and old HSCs after transplantation, while pretransplantation samples expectedly displayed a large age-associated divergence (Fig. 1 D). Analyses of differentially accessible peaks at promoters confirmed enrichment in both young and old post-transplantation samples of almost identical pathways linked to specific signaling mechanisms (Rho GTPase, nuclear receptors, etc.), RNA Pol I activity and rRNA regulation, senescence, and chromatin remodeling (Fig. S1 D). In addition, post-transplantation old HSCs showed persistence of fibrillarin (FBL) and γH2AX double-positive nucleolar foci (Fig. 1 E), which are characteristic of ongoing replication stress in old HSCs (Flach et al., 2014) and were never observed in either pre- or post-transplantation young HSCs. Finally, analyses of the recipient BM niches confirmed persisting deterioration associated with the irradiation conditioning regardless of reconstitution by either young or old HSCs (Fig. 1 F). These results indicate that the stress of the transplantation procedure and the functional requirement for homing, engraftment, and tissue regeneration in a damaged niche impart lasting and dominant effects on the chromatin state of transplanted HSCs regardless of age. These effects appear to override any potential benefits of transplanting old HSCs into young recipients, even without a conditioning regimen (Kuribayashi et al., 2021), while also exacerbating old HSC replication stress and defective regeneration potential.
Old HSC function is not restored by young blood
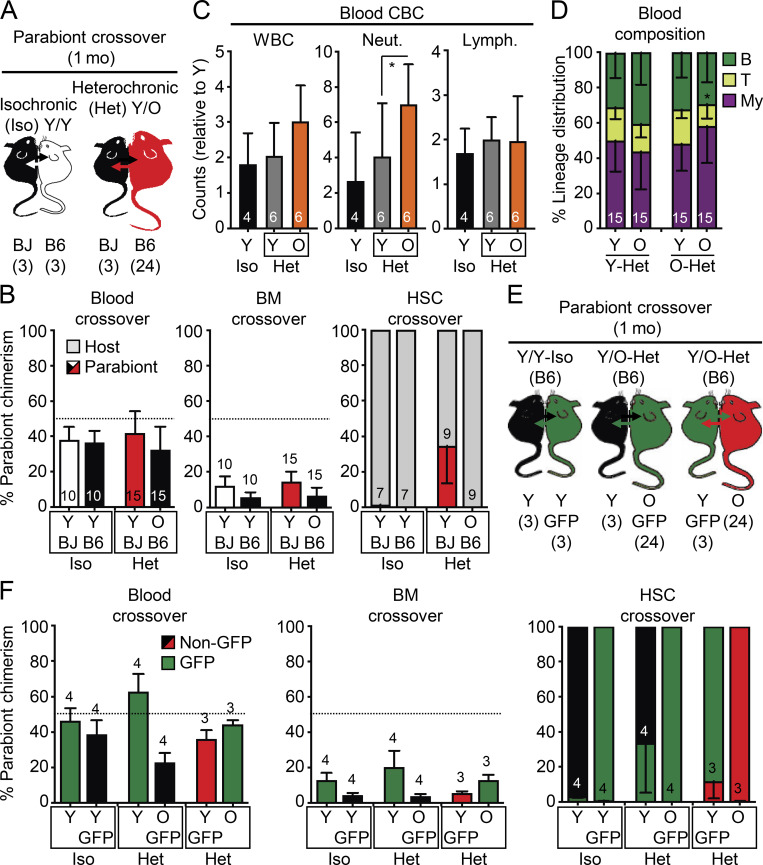
To surmount the confounding effects of transplantation, we used the well-established heterochronic parabiosis approach to assess how exposure to young blood or homing into an intact young BM niche impacts old HSC function. We surgically linked pairs of mice for 4–5 wk (average of 1 mo), matching the duration of parabiosis in several prior studies that showed robust rejuvenation effects in other tissues (Conese et al., 2017; Villeda et al., 2011; Villeda et al., 2014). We linked either 2- or 23-mo-old B6 mice with 2-mo-old BJ mice for isochronic (Iso) Y/Y and heterochronic (Het) Y/O pairs, respectively, and 23-mo-old B6 mice together for Iso O/O pairs (Fig. 2 A). Tracking of CD45.1/CD45.2 chimerism in each partner from these (3/24) cohorts after 1 mo of parabiosis indicated ∼40% crossover of circulating blood cells between parabionts, with convergence of mature blood cell parameters in intermixed young and old blood, except for elevated myeloid cell counts and a persistent decrease in T cell chimerism in O-Het parabionts (Fig. 2, B–D). Exchange of BM cells between parabionts was more limited, averaging only 10% crossover in both Y/Y Iso and Y/O Het pairs and ≤1% HSC crossover in Y/Y Iso pairs (Fig. 2 B). Strikingly, we observed a significant crossover of old HSCs into Y-Het parabionts (>30%), while almost no young HSCs (<0.1%) were found in O-Het parabionts. To exclude any bias due to differences in B6 vs. BJ background competitiveness (Mercier et al., 2016), we repeated these experiments using young and old β-actin-Gfp B6 mice parabiosed to wild-type B6 mice for Y/Y Iso and Y/O Het pairs (Fig. 2 E). We consistently observed ∼40% blood and ∼10% BM mixing between B6 genotypes, again with a specific crossover of old HSCs into Y-Het parabionts (Fig. 2 F). To ensure accurate analysis of each parabiont HSC population, we only used CD45.1+ host HSCs isolated from young BJ mice as Y-Iso and Y-Het HSCs, and CD45.2+ host HSCs isolated from old B6 mice as O-Het and O-Iso HSCs for the follow-up analyses.
Figure 2.
Crossover features of heterochronic parabiosis pairs. (A) Crossover scheme to track the percentage of B6 cells in BJ parabionts or BJ cells in B6 parabionts. (B) Blood (left), BM (middle), and HSC (right) crossover in indicated mice. (C) Complete blood count (CBC) analyses in indicated mice. WBC, white blood cells; Neut., neutrophils; Lymph., lymphocytes. (D) Lineage distribution analyses in the blood of indicated mice. (E) Crossover scheme to track the percentage of B6 GFP+ cells in young and old B6 parabionts. (F) Blood (left), BM (middle), and HSC (right) crossover in the indicated mice. Data are means ± SD; *, P ≤ 0.05.
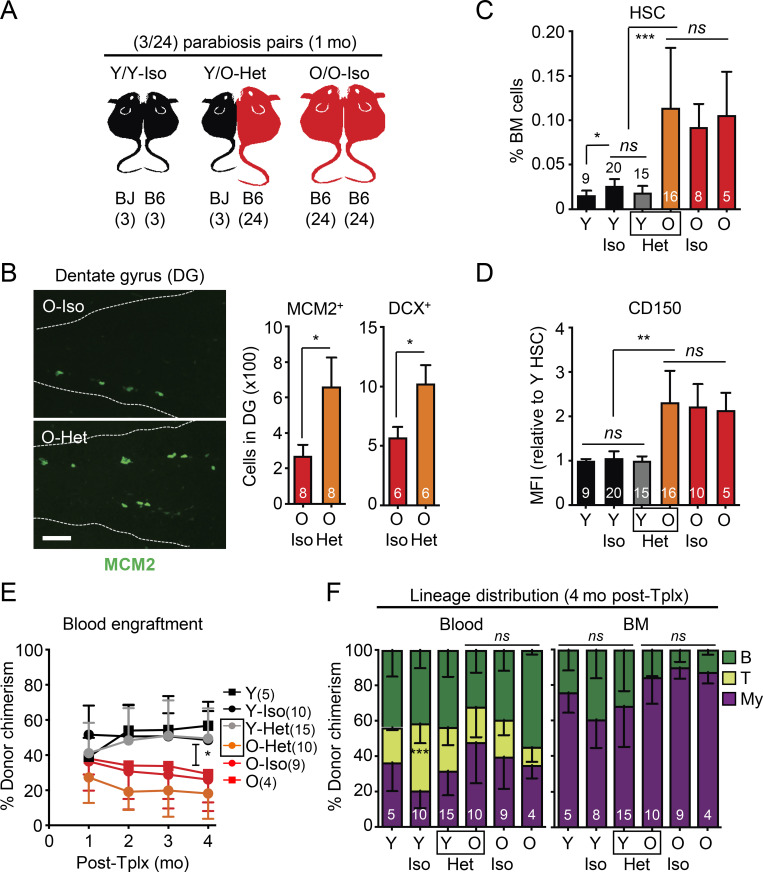
Next, we validated the success of our parabiosis surgeries (Fig. 3 A) by confirming a rejuvenating effect on neurogenesis (Villeda et al., 2011; Katsimpardi et al., 2014). As expected, we observed more MCM2+ neural progenitors and newly born doublecortin (DCX)-positive neurons in the dentate gyrus (DG) of O-Het parabionts compared with O-Iso parabionts (Fig. 3 B). In contrast, BM analyses in Y/O-Het pairs showed no change in either young or old HSCs, with persistence of an elevated frequency of HSCs with high CD150 levels in O-Het parabionts and maintenance of youthful HSC numbers in Y-Het parabionts (Fig. 3, C and D). Moreover, we found that all old HSC populations, regardless of exposure to young blood, still exhibited reduced regenerative capability with a persistent myeloid-biased output compared with young HSCs in transplantation assays (Fig. 3, E and F). Altogether, these results demonstrate a lack of rejuvenating effects of young blood on old HSCs.
Figure 3.
Exposure to young blood in heterochronic parabiosis mice does not functionally rejuvenate old HSCs. (A) Experimental setup for the (3/24) parabiosis cohorts. Survival results after surgery are shown in Fig. S2 A. (B) Representative images (left) and quantification of MCM2- and DCX-positive cells (right) in the DG of O-Iso and O-Het parabionts. (C) HSC frequency in indicated mice. Age-matched non-parabiosed young (Y) and old (O) controls are included for comparison. (D) CD150 mean fluorescence intensity (MFI) levels for the indicated HSC populations. (E) Regenerative capacity for the indicated HSC populations following transplantation into lethally irradiated recipients (250 HSCs/recipient). Results show overall engraftment in the peripheral blood over time. (F) Lineage distribution for the indicated HSC populations at 4 mo after transplantation in blood (right) and BM (left). Data are means ± SD; *, P ≤ 0.05; **, P ≤ 0.01; ***, P ≤ 0.001.
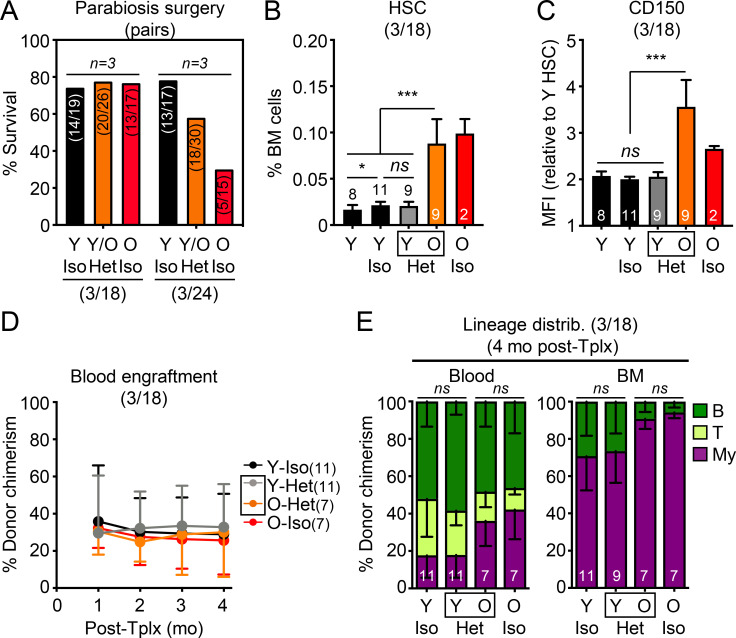
Because prior publications studying other tissues used 18-mo-old mice for parabiosis experiments (Villeda et al., 2011; Katsimpardi et al., 2014), we repeated our analyses with 17-mo-old animals at the time of surgery to test whether their HSCs would be more amenable to systemic rejuvenation. While these younger (3/18) parabiosis cohorts survived the procedure better, we still did not observe restoration of the expansion of HSCs with high CD150 levels in O-Het parabionts (Fig. S2, A–C). Interestingly, old HSCs isolated from the (3/18) parabiosis cohorts did not show engraftment defects in transplantation assays (Fig. S2 D), suggesting that 18 mo might be a borderline age to observe overt functional decline in old HSC regeneration potential; however, 18-mo-old HSCs did display myeloid-biased reconstitution activity, which was also not reverted upon parabiosis to young mice (Fig. S2 E). These results confirm that young blood does not rejuvenate old HSCs in mice that are closer to middle age.
Figure S2.
Additional characterization of (3/24) and (3/18) parabiosis cohorts. (A) Postsurgery survival in the (3/18) and (3/24) parabiosis cohorts. Results represent the number of surviving pairs out of the total number of pairs established for each group in the three independent cohorts performed at each age range. (B–E) Analyses of young controls and (3/18) parabiosis pairs with (B) frequency, (C) CD150 level, (D) regenerative capacity (250 donor HSCs/recipient), and (E) lineage distribution at 4 mo after transplantation for the indicated HSC populations. MFI, mean fluorescence intensity. Data are means ± SD; *, P ≤ 0.05; **, P ≤ 0.01; ***, P ≤ 0.001.
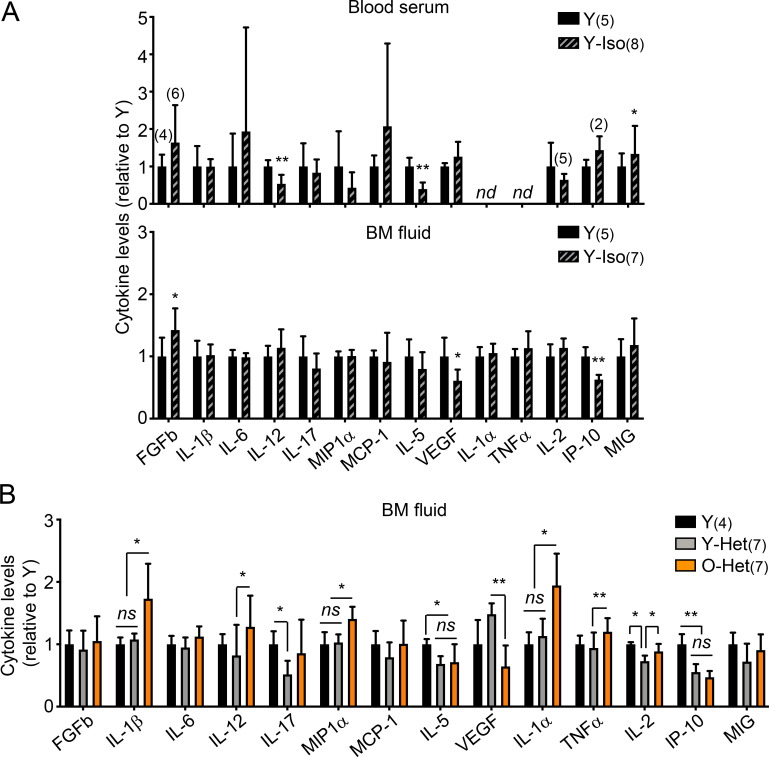
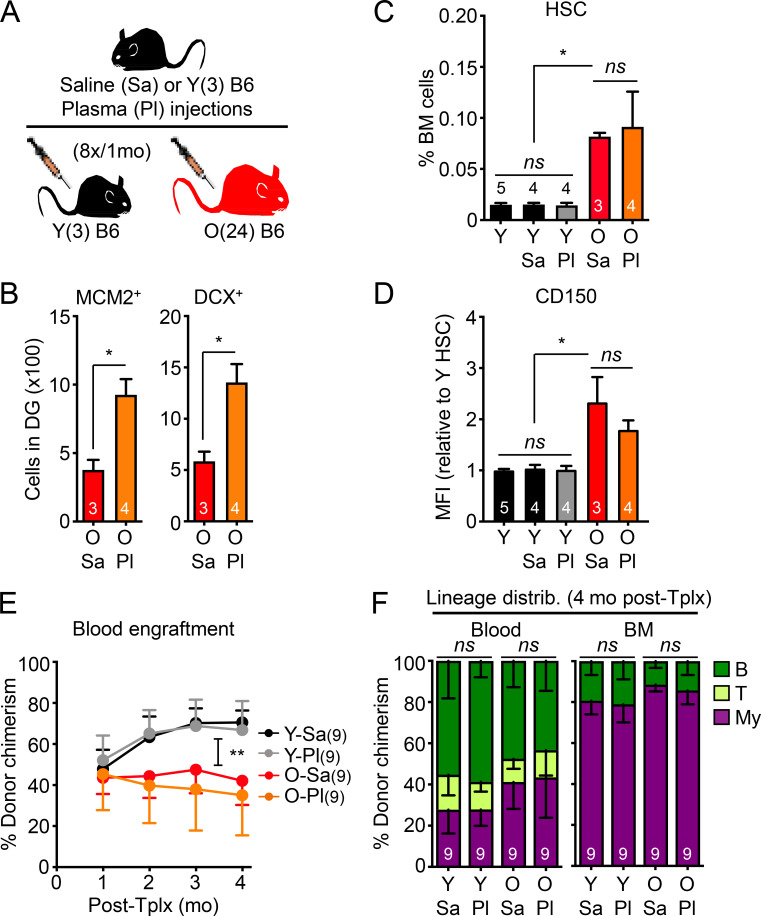
Parabiosis surgery is also known to cause significant tissue damage and inflammation (Rebo et al., 2016), which could perturb the blood system and HSCs themselves, potentially leading to functional impairment in transplantation assays (Olson et al., 2020); however, analyses of blood serum and BM fluid gave little indication of persisting inflammation 1 mo after parabiosis surgery (Fig. S3 A). Still, to exclude any such possible confounding factors, we used an established plasma injection model in 2- and 23-mo-old mice (Villeda et al., 2014), in which eight injections of either saline or plasma harvested from 3-mo-old young B6 mice were administered over a 1-mo period (Fig. 4 A). In this cohort, we also confirmed the brain-rejuvenating effects of young plasma, with increased numbers of MCM2+ neural progenitors and DCX+ newly born neurons in the DG of old mice injected with young plasma (Fig. 4 B); however, we still did not observe any changes in the expanded numbers of old HSCs with high CD150 levels, or restoration of their defective and myeloid-biased regenerative capability (Fig. 4, C–F). Taken together, these results demonstrate that old HSCs are not rejuvenated by exposure to young blood or blood-derived factors and, conversely, that young HSCs are not functionally altered by old blood or blood-derived factors.
Figure S3.
Inflammation in parabiosis cohorts. (A) Luminex-based cytokine analyses of serum and BM fluid from the indicated 3-mo-old young controls and Y/Y-Iso pairs from the (3/24) parabiosis cohorts. nd, not detected. (B) Luminex-based cytokine analyses of the BM fluid of the indicated 3-mo-old young controls and Y/O-Het pairs from an independent (6/23) parabiosis cohort. Data are means ± SD; *, P ≤ 0.05; **, P ≤ 0.01; ***, P ≤ 0.001.
Figure 4.
Injection of young plasma does not functionally rejuvenate old HSCs. (A) Experimental setup for the saline (Sa) or young plasma (Pl) injection experiments in young and old mice. (B) Quantification of MCM2- and DCX-positive cells in the DG of old saline- or plasma-injected mice. (C) HSC frequency in indicated mice. Uninjected Y controls are included for comparison. (D) CD150 mean fluorescence intensity (MFI) levels for the indicated HSC populations. (E) Regenerative capacity for the indicated HSC populations following transplantation into lethally irradiated recipients (250 HSCs/recipient). Results show overall engraftment in the peripheral blood over time. (F) Lineage distribution for the indicated HSC populations at 4 mo after transplantation in blood (right) and BM (left). Data are means ± SD; *, P ≤ 0.05; **, P ≤ 0.01.
Young blood does not rejuvenate old HSC molecular features or the old BM niche
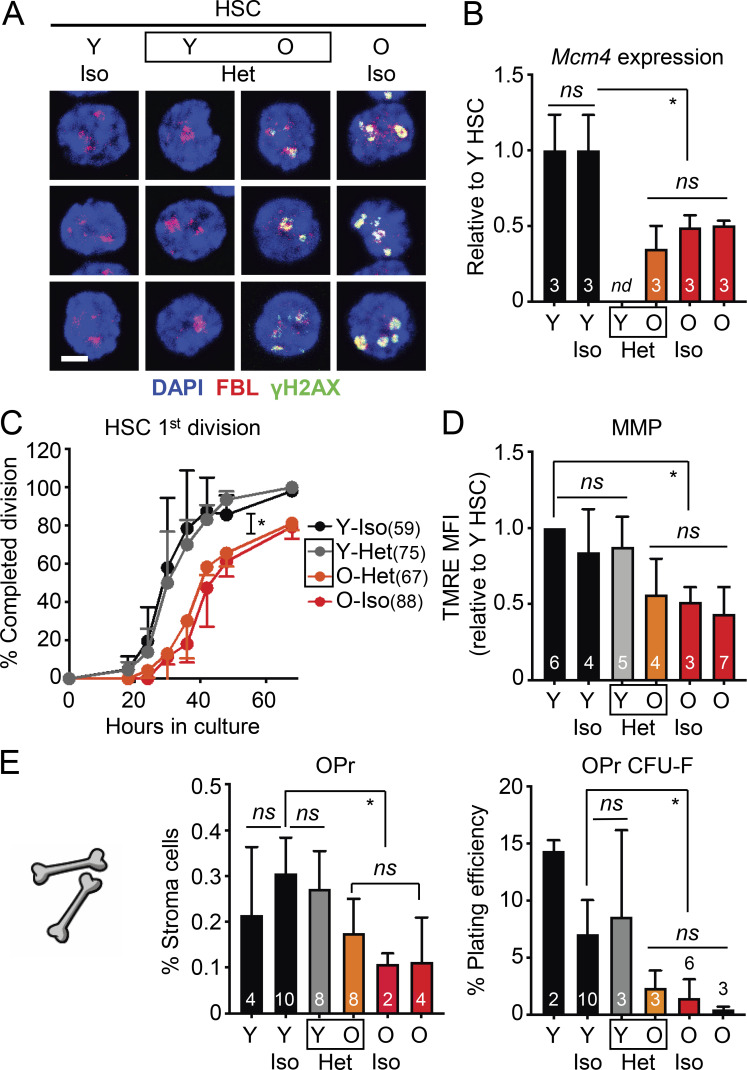
To determine whether exposure to young blood had any effect on cell-intrinsic hallmarks of old HSCs, we isolated young and old HSCs from the (3/24) parabiosis cohorts and investigated several well-established characteristics of the old HSC state. With age, quiescent HSCs accumulate nucleolar γH2AX foci due to ongoing replication stress, with dampened expression of mini-chromosome maintenance (Mcm) DNA helicase genes, leading to slower division kinetics (Flach et al., 2014). We found persistence of nucleolar γH2AX foci in all old HSC populations, which were absent from all young HSC populations (Fig. 5 A). Likewise, Mcm4 expression was lower and single-cell division kinetics were slower in all old HSC populations (Fig. 5, B and C), which demonstrates the persistence of replication stress in old HSCs exposed to young blood. We previously discovered that old HSCs also exhibit deregulated oxidative metabolism with reduced mitochondrial membrane potential (MMP; Ho et al., 2017), and we found low MMP in all old HSCs, regardless of exposure to young blood (Fig. 5 D). Collectively, these results confirm the resilience of both young and old HSC states, neither of which are affected by heterochronic parabiosis over the 1-mo period of shared circulation.
Figure 5.
Exposure to young blood fails to reverse molecular hallmarks of aging in HSCs and the BM niche. (A–C) Age-associated replication stress features in (3/24) parabiosis cohorts with (A) γH2AX/FBL immunofluorescence staining (scale bar, 10 µm), (B) Mcm4 mRNA expression levels, and (C) single-cell division kinetics (n = cells) for the indicated HSC populations. nd, not determined. (D) Age-associated mitochondrial dysfunction in (3/24) parabiosis cohorts. MMP results are expressed as relative mean fluorescence intensity (MFI) of tetramethylrhodamine-ethyl-ester (TMRE) staining for the indicated HSC populations. Experiments performed on different days were normalized to 1 for each internal Y HSC control, and then averaged together. (E) Age-associated BM niche cell deterioration in (3/24) parabiosis cohorts with frequency and colony forming activity of endosteal OPrs in the indicated mice. Data are means ± SD; *, P ≤ 0.05.
We also investigated whether exposure to young blood could improve the deteriorated old BM niche in these cohorts. However, parabiosis with young mice did not restore the age-related loss of endosteal BM niche cells, with old mice showing a significant decrease in the frequency and colony-forming activity of OPr cells compared with young mice, regardless of exposure to young blood (Fig. 5 E). Furthermore, elevated levels of age-associated pro-inflammatory cytokines were still observed in the BM fluid of O-Het parabionts, notably IL-1α, IL-1β, TNFα, and MIP1α, while Y-Het parabionts had mostly unchanged levels compared with young controls (Fig. S3 B). These results illustrate the rigid nature of the BM microenvironment, with exposure to young blood not improving the deteriorated aged BM niche and exposure to old blood not damaging the healthy young BM niche. These results also indicate that old HSCs that crossed over into the young BM did not have a significant impact on the young microenvironment.
Old HSCs relocate to young BM niches but are not rejuvenated
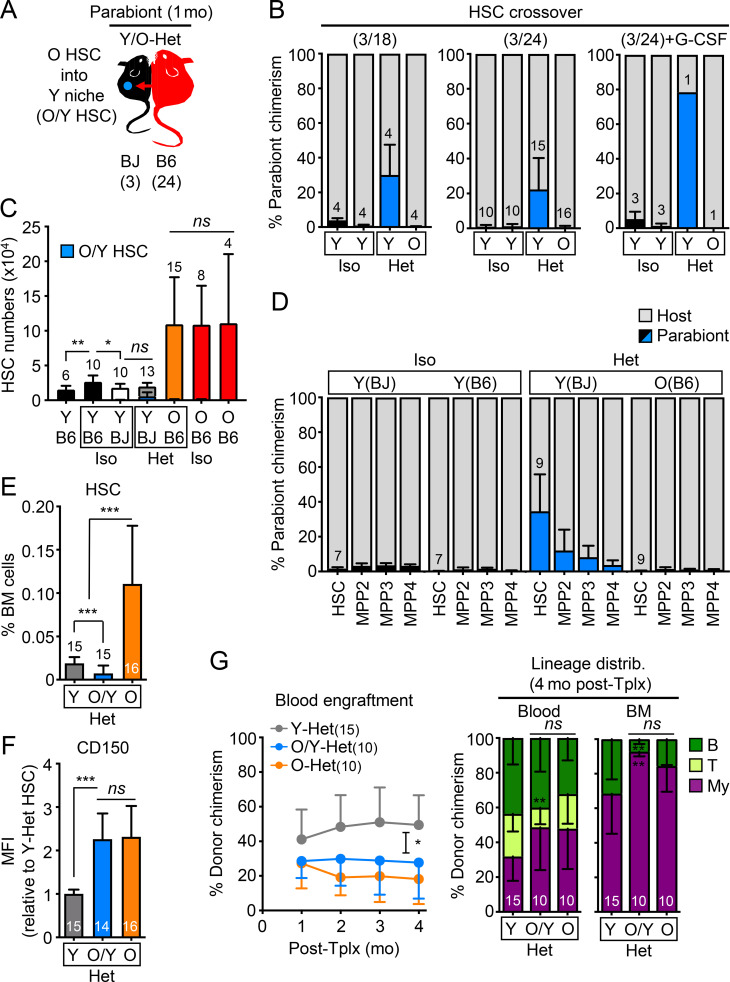
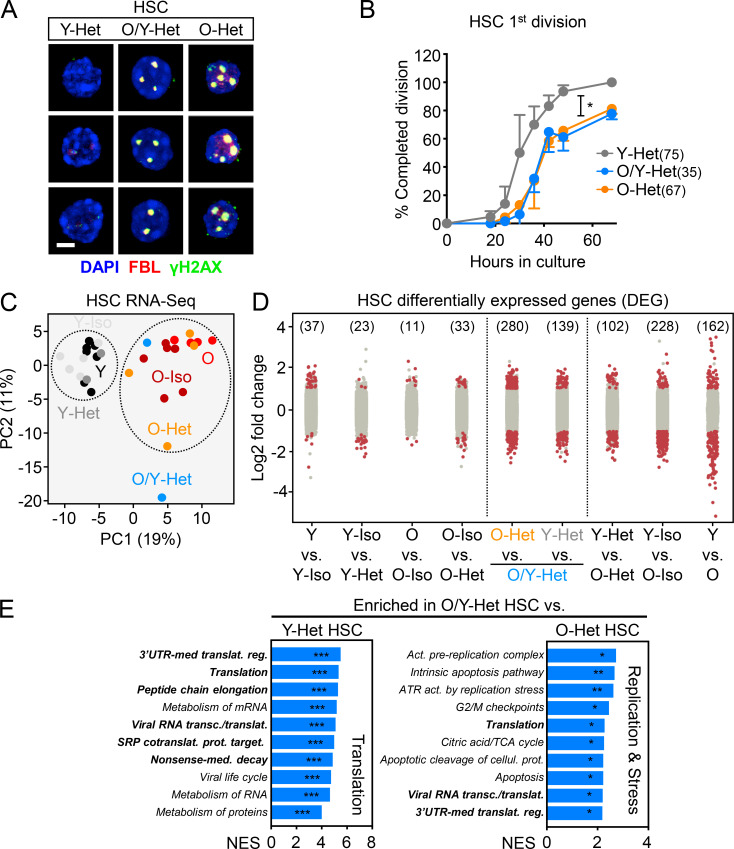
To address whether a recalcitrant niche could limit any potential benefit of parabiosis on old HSCs, we next focused on old HSCs that spontaneously relocated to the BM of Y-Het parabionts (O/Y HSCs; Fig. 6 A). A similar amount of crossover of old HSCs into Y-Het parabionts was observed in both (3/18) and (3/24) parabiosis cohorts, averaging 25% and reaching up to 80% in the sole surviving Y/O Het pair out of three pairs treated with the HSC mobilizing agent, G-CSF (Abkowitz et al., 2003), in a (3/24) cohort (Fig. 6 B). Still, O/Y HSCs represented a relatively small number that did not significantly increase the total combined size of the HSC pool in Y-Het mice (Fig. 6 C). This relocation was also specific to the HSC compartment, with sharply decreasing contributions of old cells to downstream progenitors in Y-Het pairs (Fig. 6 D). Conversely, we almost never found young HSCs in O-Het parabionts, even upon G-CSF mobilization (Fig. 6 B), which further illustrates the hostile nature of the aged BM microenvironment. We next isolated O/Y HSCs from Y-Het parabionts (3/24 cohorts) to determine whether they might be rejuvenated by direct exposure to a healthy young microenvironment; however, we again found no changes in CD150 levels or functional improvement of O/Y HSC engraftment capability or myeloid-biased reconstitution activity compared with old HSCs that remained in the BM of O-Het parabionts (Fig. 6, E–G). Moreover, nucleolar γH2AX foci and delayed replication kinetics still persisted in O/Y HSCs (Fig. 7, A and B). These results indicate that, while some old HSCs preferentially colonize young BM niches and are positioned to benefit from exposure to a young niche, young blood cells, and young organ function, they are neither a subset of functionally superior old HSCs, nor are they rejuvenated by the young microenvironment.
Figure 6.
Migration to young BM niches does not functionally rejuvenate old HSCs. (A) Experimental setup for the analyses of old HSCs homed into Y-Het mice (O/Y HSCs) in the (3/24) cohorts and analyzed after 1 mo of parabiosis. (B) Frequency of HSC crossover in the indicated parabiosis cohorts. Of note, three Het pairs were initially injected with G-CSF. (C) Total numbers of HSCs showing both host and crossover O/Y HSCs. (D) Percentage of crossover in the HSC/MPP compartments of indicated mice. (E) HSC frequency in indicated mice. (F) CD150 mean fluorescence intensity (MFI) levels for the indicated HSC populations. (G) Regenerative capacity following transplantation in lethally irradiated recipients (250 HSCs/recipient) showing overall engraftment in the peripheral blood over time (left) and lineage distribution at 4 mo after transplantation in blood and BM (left) for the indicated HSC populations. Data are means ± SD; *, P ≤ 0.05; **, P ≤ 0.01; ***, P ≤ 0.001. HSC crossover data in B and D are part of Fig. 2, B and F, and are shown for comparison.
Figure 7.
Unchanged aging phenotypes and altered transcriptome of old HSCs relocated into young BM niches. (A) γH2AX/FBL immunofluorescence staining for the indicated HSC populations. Scale bar, 10 µm. (B) Single-cell division kinetics (n = cells) for the indicated HSC populations. (C) Principal component (PC) analysis of RNA sequencing data for young and old control HSCs and HSCs isolated from the indicated parabiosed pairs. (D) Number of DEGs with log2 fold change greater than or equal to 1 or less than or equal to −1 and FDR < 0.05 for the indicated comparisons. (E) Gene-set enrichment analyses of O/Y-Het HSCs compared with either Y-Het HSCs (left) or O-Het HSCs (right). Bold highlights pathways commonly found enriched in old HSCs in Fig. S4 A. NES, normalized enrichment score with FDR–adjusted P values. Data are means ± SD; *, P ≤ 0.05; **, P ≤ 0.01; ***, P ≤ 0.001. Y-Het and O-Het HSC results in A and B are from Fig. 5 and are shown for comparison. SRP, signal recognition particle; UTR, untranslated region.
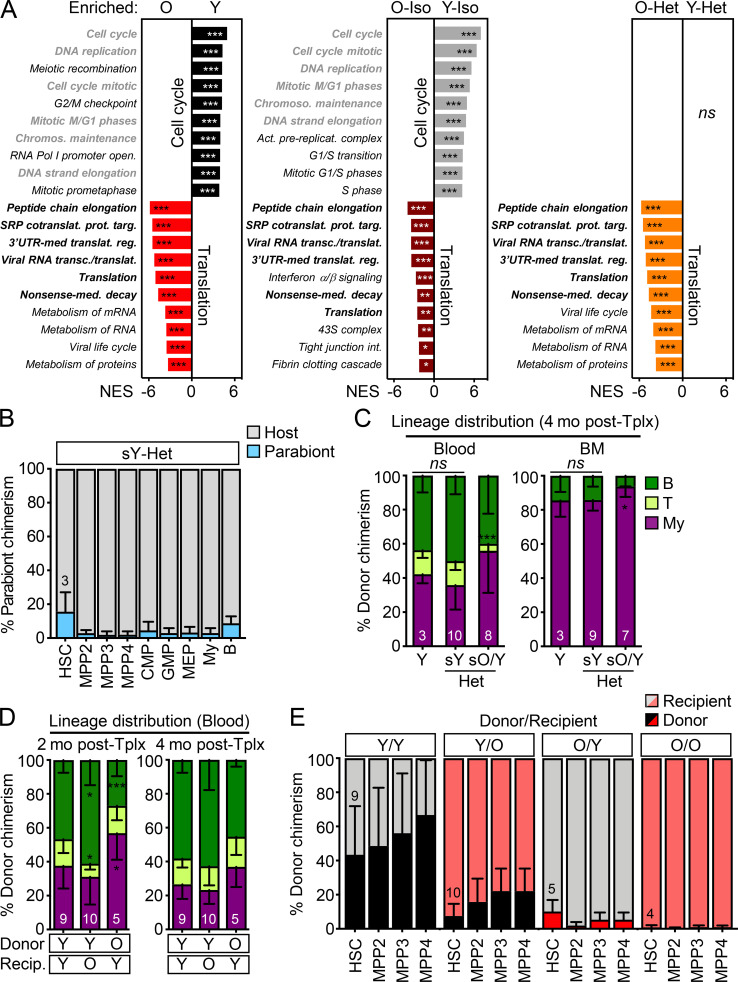
To determine whether old HSCs exposed to young blood or residing in a young BM niche were molecularly distinct, we performed RNA sequencing on HSCs isolated from both Iso and Het pairs (3/24 cohorts) and age-matched young and old controls. Principal component analyses revealed separation of young and old HSCs by age, regardless of parabiosis or parabiont partners (Fig. 7 C). Consistently, analyses of differentially expressed genes (DEGs) revealed few changes in young or old HSCs due to the age of the parabiont partner or the surgical procedure itself (Fig. 7 D). Most DEGs were between young and old HSCs, with similar changes in pathways regulating cell cycle and translation control observed in both control groups and Iso/Het pairs (Fig. S4 A). Strikingly, O/Y HSCs that had relocated into young parabionts displayed significant changes compared with not only young HSCs, but also with old HSCs that stayed in their original old niches. Most DEGs between relocated O/Y HSCs and young HSCs reflected the same age-related changes in translation regulation found in other old vs. young HSC comparisons. In contrast, increased signatures of replication, mitochondrial metabolism, and cell stress response pathways were the defining features of the migratory O/Y HSC subset compared with non-migratory old HSCs (Fig. 7 E). These results indicate that old HSCs that relocate into young BM niches represent a mobilized and metabolically more activated subset of old HSCs, rather than old HSCs with a more youthful transcriptome.
Figure S4.
Gene expression signatures of young and old HSCs and further characterization of transplanted mice. (A) RNA sequencing analyses of HSCs isolated from young and old controls and (3/24) pairs with gene-set enrichment analyses showing the top 10 differentially expressed pathways in the indicated comparisons. Gray indicates pathways enriched in Y HSCs and black in O HSCs, with bold highlighting common pathways. NES, normalized enrichment score with FDR–adjusted P values. (B) Percentage of old B6 BM cells in the indicated populations in young BJ Het parabionts 4.5 mo after separation. CMP, common myeloid progenitor; GMP, granulocyte/macrophage progenitor; MEP, megakaryocyte/erythrocyte progenitor. (C) Lineage distribution at 4 mo after transplantation in blood (left) and BM (right) for the parabiosis separation transplantation experiment shown in Fig. 8 E. (D) Lineage distribution in blood at 2 mo (left) and 4 mo (right) after transplantation for the heterochronic transplantation experiment shown in Fig. 8 G. O/O samples were excluded from this analysis due to failed engraftment. (E) Donor chimerism in HSC/MPP compartments after heterochronic transplantations. SRP, signal recognition particle; UTR, untranslated region. Data are means ± SD; *, P ≤ 0.05; **, P ≤ 0.01; ***, P ≤ 0.001.
Old HSCs are unaffected by long-term exposure to young BM niches
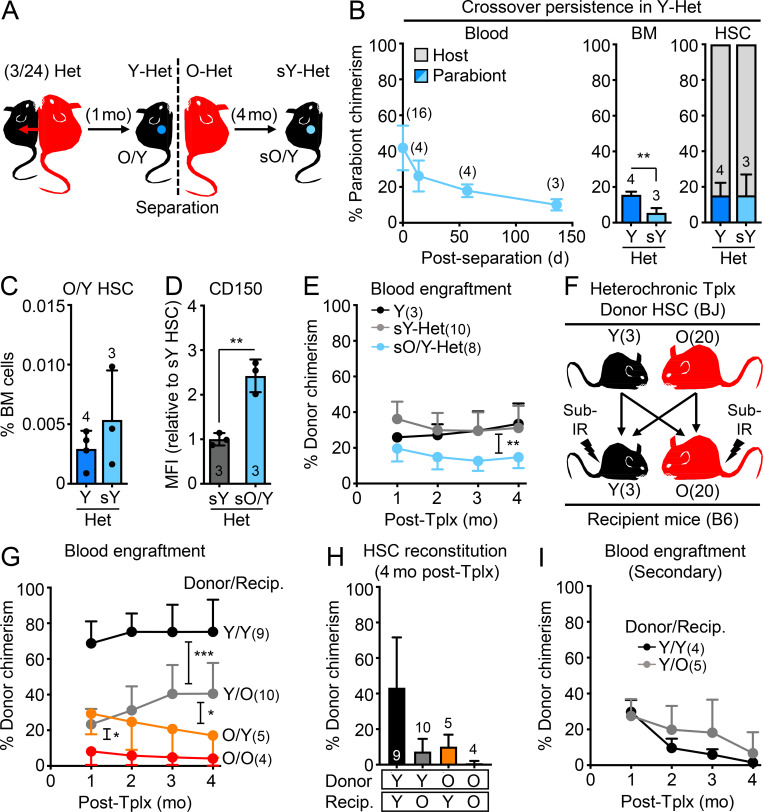
We reasoned that activated old HSCs that homed into Y-Het parabionts could be early immigrants that have not yet restored quiescence or benefited from a lengthy exposure to the young BM milieu. To address this, we separated (3/24) Y/O-Het pairs after 1 mo of shared circulation and continued monitoring the separated young parabionts (sY-Het) for over 4 mo (Fig. 8 A). Following separation, we observed a steady decline in old cell chimerism in the blood and BM; however, we found a remarkably stable HSC chimerism between pre- and post-separation Y-Het mice (Fig. 8 B and Fig. S4 B), indicating long-term survival and eventual expansion of old HSCs in young niches (Fig. 8 C). However, despite extended exposure to a young BM milieu, O/Y HSCs still maintained high CD150 expression and displayed defective engraftment and myeloid-biased regeneration compared with young HSCs isolated from the same separated sY-Het parabionts or young control animals (Fig. 8, D and E; and Fig. S4 C). These results demonstrate that even long-term residence in a healthy, young microenvironment with constant exposure to young cells, blood, and organ function neither restores the functionality of old HSCs, nor limits their expansion phenotype.
Figure 8.
Old HSC states persist after long-term residence in young BM niches. (A–E) Age-associated phenotypes of old HSCs residing in separated Y Het mice (sO/Y HSCs) with (A) experimental setup for postparabiosis separation (3/24 cohorts); (B) frequency of crossover over time in blood (left), BM (middle), and HSC (right) compartment at the time of separation (Y-Het) and 4.5 mo afterward (sY-Het); (C) O/Y HSC BM frequency before and after separation; and (D) CD150 levels and (E) regenerative capacity following transplantation into lethally irradiated recipients (250 HSCs/recipient) for the indicated HSC populations. Both sY-Het HSCs and sO/Y-Het HSCs were isolated from individual sY-Het donor mice and transplanted into two to three recipients each. Y HSCs were isolated from two pooled young donor mice and transplanted into three recipients. (F–I) Heterochronic transplantation of 2,000 young or old BJ HSCs into sublethally irradiated young or old B6 recipients (recip.) with (F) experimental setup; (G) blood engraftment over time; (H) BM HSC chimerism at 4 mo after transplantation; and (I) regenerative capacity following transplantation into lethally irradiated secondary recipients (500 HSCs/recipient) for the indicated HSC populations. Data are means ± SD; *, P ≤ 0.05; **, P ≤ 0.01; ***, P ≤ 0.001.
Since young HSCs rarely crossed over to O-Het mice upon parabiosis, we reverted to heterochronic transplantation experiments to further study the effect of old BM niches on young HSCs. We transplanted 2,000 young or old HSCs isolated from 3- or 20-mo-old BJ donor mice into sublethally irradiated 3- or 20-mo-old B6 recipient mice (Fig. 8 F). We first confirmed that the engraftment of old HSCs into young mice was still significantly reduced in these more competitive transplantation conditions, with a myeloid-biased output that was most pronounced at 2 mo after transplantation (Fig. 8, G and H; and Fig. S4 D). As expected from previous BM heterochronic transplantation experiments (Ergen et al., 2012; Guidi et al., 2017), we also found poor engraftment of young HSCs into the hostile old BM niche (Figs. 8 G); however, young HSCs that did engraft still strongly contributed to peripheral blood output, despite low HSC chimerism in the BM (Fig. 8, G and H). In fact, we observed youthful blood production with robust B cell chimerism in old recipients reconstituted with young HSCs, especially at 2 mo after transplantation (Fig. S4 D). Finally, engraftment of old HSCs into old mice was almost nonexistent, with extremely limited blood chimerism and no remaining donor-derived HSCs 4 mo after transplantation. Downstream progenitors showed a pattern of BM chimerism similar to HSCs in each of the heterochronic transplantation conditions (Fig. S4 E). Moreover, young HSCs that engrafted into old recipients behaved similarly to young HSCs that engrafted into young recipients in secondary transplantation assays, with limited reconstitution capability in both cases (Fig. 8 I). These results further confirm that, despite the stress of transplantation and change in chromatin state in both young and old HSCs, the young BM niche is still more permissive to HSC engraftment than the old BM microenvironment. These results also indicate minimal permanent effects of the inflamed aged BM milieu on the functionality and lineage output of transplanted young HSCs that are actually able to engraft. Collectively, they demonstrate the resilience of young or old HSC states to different niche environments.
HSCs are refractory to other systemic rejuvenation and pro-aging paradigms
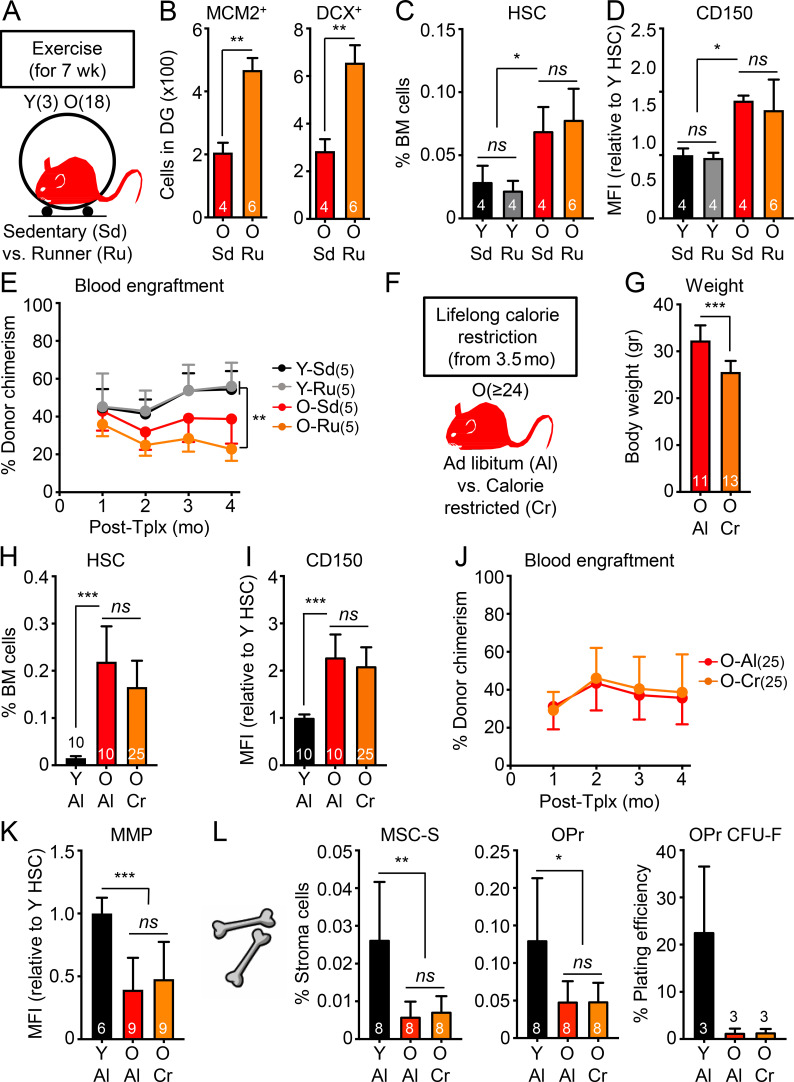
We next asked whether the lack of rejuvenation on blood, HSCs, and BM stroma was generalizable to other systemic anti-aging interventions. Exercise improves many aspects of health in humans and model organisms, enhancing the function of aged neural stem cells (Wu et al., 2008; Garatachea et al., 2015) and having some reported benefits to HSCs in both humans (Thijssen et al., 2006) and mice (De Lisio and Parise, 2012; Frodermann et al., 2019). We set up cohorts of 3- and 18-mo-old mice that were kept with or without free access to running wheels for 7 wk (Fig. 9 A), with young mice running an average ∼35 km/wk and old mice ∼14 km/wk. We confirmed increased numbers of MCM2+ neural progenitors and DCX+ newly born neurons observed in the DG of old runner mice (Fig. 9 B). We also demonstrated enhanced neurogenesis and cognition in the same cohorts of exercised young and old mice in a separate publication (Horowitz et al., 2020). However, old runner mice exhibited similarly elevated frequencies of old HSCs with high CD150 levels and defective engraftment with myeloid-biased lineage reconstitution as old sedentary mice (Fig. 9, C–E; and Fig. S5 A). Calorie restriction is another anti-aging intervention that extends healthspan and lifespan in many model organisms and improves the function of some somatic stem cells during aging (Mercken et al., 2012; Anton and Leeuwenburgh, 2013; Cerletti et al., 2012). Some regimens have also been reported to enhance HSC function in middle-age mice (Tang et al., 2016), albeit with conflicting results for older mice (Chen et al., 2003; Ertl et al., 2008; Lazare et al., 2017). Here, we conducted lifelong calorie restriction using mice obtained from the National Institute on Aging (NIA) calorie-restricted aging colony that were started with 10% restriction at 14 wk of age, increased to 25% restriction at 15 wk, and to 40% restriction at 16 wk, which was then maintained throughout the life of the animal, with both ad libitum–fed and calorie-restricted mice finally analyzed at 24 mo of age (Fig. 9, F and G). Similar to one previous report (Lazare et al., 2017), we found equivalent expansion of old HSCs with high CD150 levels, defective engraftment capability, and myeloid-biased lineage reconstitution in calorie-restricted and ad libitum–fed old mice (Fig. 9, H–J; and Fig. S5 A). Furthermore, calorie restriction had no effect on the age-associated reduction in MMP in old HSCs or the deteriorated BM niche in old mice (Fig. 9, K and L). Altogether, these results demonstrate the limited effects of established systemic anti-aging interventions in ameliorating HSC and blood aging.
Figure 9.
Known longevity-promoting interventions also fail to rejuvenate old HSCs. (A–E) Effect of exercise on HSCs isolated from young and old sedentary (Sd) or runner (Ru) mice with (A) experimental setup; (B) neurogenesis quantification in the DG of old sedentary or runner mice; and (C) frequency, (D) CD150 levels, and (E) regenerative capacity following transplantation into lethally irradiated recipients (500 HSCs/recipient) for the indicated HSC populations. (F–L) Effects of lifelong calorie restriction on HSCs isolated from old mice fed ad libitum (Al) or calorie restricted (Cr) compared with young controls with (F) experimental setup; (G) weights of the animals; (H) frequency, (I) CD150 levels, (J) regenerative capacity following transplantation into lethally irradiated recipients (500 HSCs/recipient), and (K) MMP for the indicated HSC populations; and (L) frequency and colony-forming activity for the indicated endosteal BM niche populations. MFI, mean fluorescence intensity. Data are means ± SD; *, P ≤ 0.05; **, P ≤ 0.01; ***, P ≤ 0.001.
Figure S5.
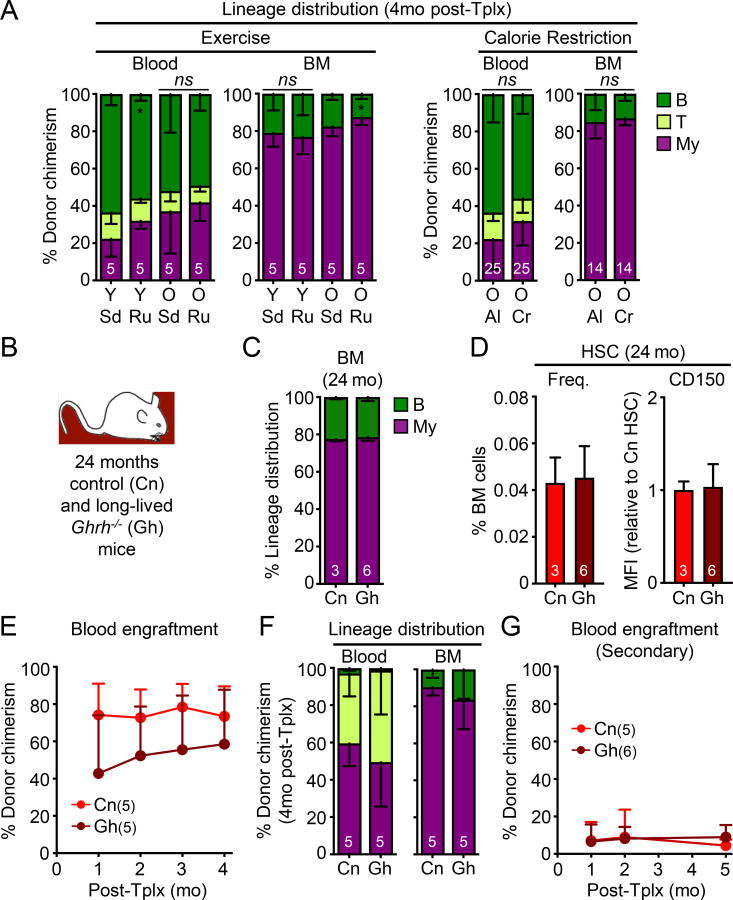
Additional characterization of rejuvenation interventions and aging mutant mice. (A) Lineage distribution at 4 mo after transplantation in both blood and BM for the exercise transplantation experiment shown in Fig. 9 E (left) and calorie restriction transplantation experiment shown in Fig. 9 J (right). (B–G) Analysis of 24-mo-old control (Cn) and long-lived Ghrh−/− mutant mice (Gh) with (B) experimental setup; (C) lineage distribution in the BM of primary animals; and (D) frequency and CD150 levels, (E) regenerative capacity (250 HSCs/recipient), and (F) lineage distribution in primary recipients; and (G) regenerative capacity (250 HSCs/recipient) in secondary transplantation for the indicated HSC populations. Data are means ± SD; *, P ≤ 0.05; **, P ≤ 0.01; ***, P ≤ 0.001.
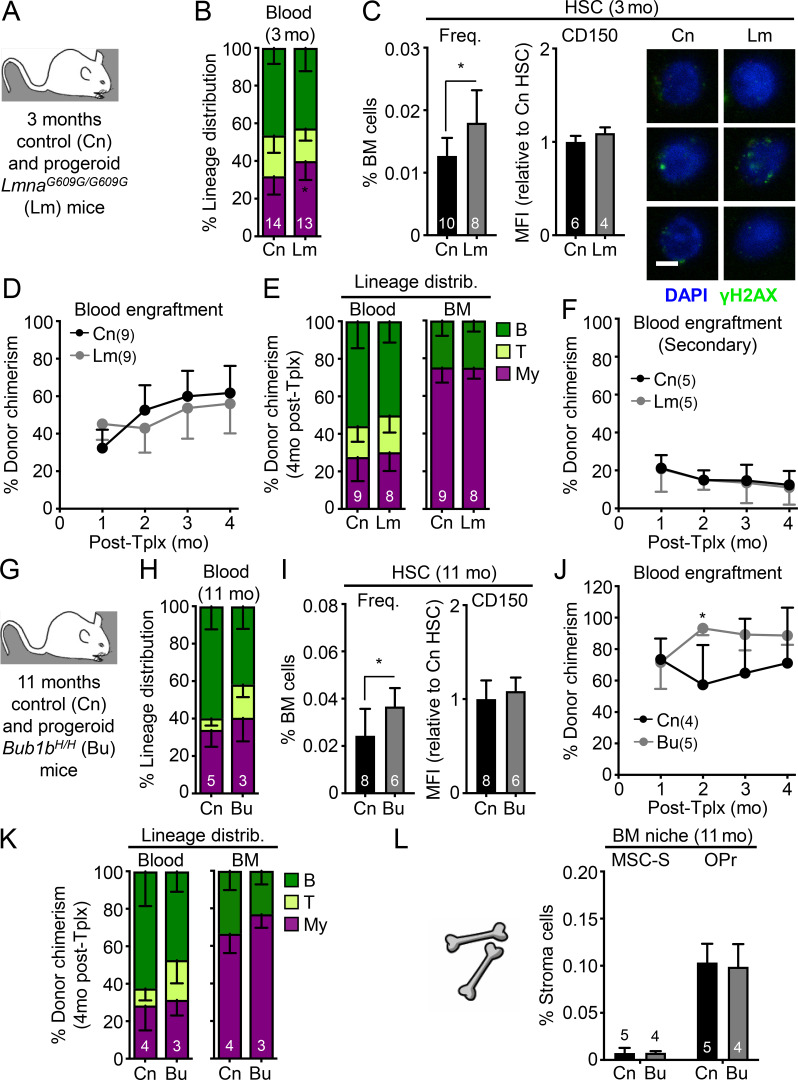
Finally, we studied aging mutant mice to determine whether genetic alterations that affect healthspan and lifespan at the organismal level might also affect HSC function. We first investigated whether pro-aging conditions found in progeroid mouse models promote premature aging in young HSCs. We studied both LmnaG609G/G609G (Lm) and Bub1bH/H (Bu) progeroid mice, which are two well-established and studied models of clinical premature aging. Both models exhibited rapid aging phenotypes in most tissue systems as a result of defective nuclear architecture and chromosomal integrity during cellular replication, respectively, and premature death around 3 mo of age for Lm mutant mice (Osorio et al., 2011) and 11 mo of age for Bu mutant mice (Baker et al., 2004). We conducted studies on mice at these late stages to allow maximum time for potential premature aging phenotype to manifest in HSCs. We confirmed the modest increase in myeloid cell production and HSC frequency previously reported in 3-mo-old Lm progeroid mice (Fig. 10, A–C; Ho et al., 2019), which could be due to elevated inflammation associated with Lamin deregulation (Tran et al., 2016). Otherwise, we found no other signs of premature aging in Lm HSCs, with no increase in CD150 levels or features of replication stress, and no loss of regenerative ability or lineage distribution in serial transplantation assays (Fig. 10, D–F). While 11-mo-old Bu mice also had a slightly elevated HSC frequency compared with age-matched controls, we likewise found no other signs of premature aging in Bu HSCs with regard to these same parameters (Fig. 10, G–K). This is consistent with a study in young 3-mo-old Bu mice reporting no differences in engraftment following BM transplantation (Pfau et al., 2016). Furthermore, the endosteal BM niche composition of 11-mo-old Bu progeroid mice was indistinguishable from aged-matched control mice (Fig. 10 L). Conversely, we also examined long-lived mutant mice to address whether a mutation extending lifespan and healthspan could delay HSC aging. The growth hormone–releasing hormone knockout (Ghrh−/− or Gh) mouse model has a remarkable 46% increase in lifespan and youthful preservation of many metabolic, physiological, and stress-response phenotypes (Sun et al., 2013). However, analyses of 24-mo-old Gh and control mice indicated no differences in BM composition or HSC frequency, CD150 levels, or functionality in serial transplantations (Fig. S5, B–G). This is in line with a study showing that growth hormone receptor signaling is dispensable for HSC function (Stewart et al., 2014). These results demonstrate that HSCs are neither prematurely aged in two short-lived progeroid mouse models, nor delayed in their acquisition of aging features in a long-lived mouse model, in contrast to many other tissues. Collectively, they establish that the blood system is remarkably unaffected by systemic interventions that readily rejuvenate other tissues as well as to mutations that affect the overall rate of organismal aging.
Figure 10.
Minimal pro-aging effects are observed in HSCs from progeroid mice. (A–F) Analysis of 3-mo-old control (Cn) and progeroid Lm mice with (A) experimental setup; (B) lineage distribution in the peripheral blood of primary animals; and (C) frequency, CD150 levels, and γH2AX immunofluorescence staining (scale bar, 10 µm), (D) regenerative capacity following transplantation into lethally irradiated primary recipients (250 HSCs/recipient), (E) lineage distribution in primary recipients, and (F) regenerative capacity following transplantation into lethally irradiated secondary recipients (500 HSCs/recipient) for the indicated HSC populations. (G–L) Analysis of 11-mo-old control (Cn) and progeroid Bubr1H/H (Bu) mice with (G) experimental setup; (H) lineage distribution in the peripheral blood of primary animals; (I) frequency and CD150 levels, (J) regenerative capacity following transplantation into lethally irradiated recipients (250 HSCs/recipient), and (K) lineage distribution of the indicated HSC populations; and (L) frequency of the indicated endosteal BM niche populations. MFI, mean fluorescence intensity. Data are means ± SD; *, P ≤ 0.05.
Discussion
Parabiosis, young blood factors, and interventions that affect the nutrient-sensing axis have been widely found to rejuvenate many tissues and their associated stem cell populations, generating widespread enthusiasm for aging research (Conese et al., 2017). While these interventions have provided insights into the mechanisms of aging and rejuvenation—and even hold promise for forays into human trials (Horowitz and Villeda, 2017)—it is important to consider that they may not have universal benefits or pan-tissue effects. Here, we studied the effects of numerous systemic rejuvenation interventions in aged mice and found that, although the blood system is the carrier for many rejuvenation factors, it does not itself derive benefits from exposure to young blood or blood-derived factors. We show that old HSCs, which have already accumulated replication-associated DNA damage, have significantly altered epigenetic and transcriptional states, and demonstrate severely diminished regenerative capacity with both impaired engraftment and myeloid-biased reconstitution activity in transplantation assays, are not rejuvenated by systemic bloodborne interventions. We also found that old HSCs are largely impervious to other highly conserved, systemic anti-aging paradigms, such as exercise and calorie restriction. Furthermore, we show that HSCs are not affected by mutations that promote highly altered physiology in aging mutant mice. We believe that our comprehensive analyses demonstrate a fundamental aspect of the old HSC state and its striking resilience to rejuvenation by systemic bloodborne factors. These results raise important considerations for understanding the limitations of currently published rejuvenation interventions and for refining the targets and goals of anti-aging strategies for the blood system.
First, it is important to stress the difference between repopulation and lineage output in assessing the regenerative potential of old HSCs in transplantation assays. While HSCs display skewed lineage output following transplantation relatively early in aging, it takes longer for old HSCs to lose engraftment and reconstitution capabilities. In our experience, significantly decreased repopulation ability is most consistently found for old HSCs isolated from 20- to 24-mo-old mice and rarely observed before (Flach et al., 2014; Ho et al., 2017). Although the reasons for the myeloid-biased output of transplanted old HSCs are still not fully understood, they likely relate to their changed chromatin landscape and differential response to signals from the recipient BM niche. It is also unclear how relevant the causes of the myeloid bias upon transplantation are to the altered lineage output of old HSCs in their native niche, where the inflamed BM milieu and remodeled niche microenvironment likely play key roles. In contrast, the defective repopulation ability of old HSCs is directly linked to replication stress upon transplantation (Flach et al., 2014) and the impaired metabolic and mitochondrial activation response of old HSCs following replication challenges (Ito et al., 2006; Ho et al., 2017; Hinge et al., 2020). Therefore, rejuvenation approaches restoring a balanced lineage output of transplanted old HSCs likely target different mechanisms than those responsible for the loss of engraftment and regenerative potential. This is a source of confusion in many published HSC rejuvenation strategies, which often only demonstrate a restored myeloid-biased output of transplanted old HSCs by showing improved lymphoid/myeloid ratio (Satoh et al., 2013; Cheng et al., 2014; Guidi et al., 2017; Frisch et al., 2019). However, as lymphoid cells are long lived and myeloid cells have a lifespan of a few days, an increased proportion of lymphoid cells at low engraftment levels can indicate a lack of HSC myeloid cell production rather than a true rejuvenating effect. Therefore, without robust improvement in the repopulation activity of transplanted old HSCs, an increased lymphoid/myeloid ratio can be misleading. Furthermore, many reports of improved old HSC engraftment following an intervention or a genetic manipulation do not benchmark improvements to young HSCs and instead focus on relative improvements from old HSC controls (Mohrin et al., 2015; Luo et al., 2019). Absent a young HSC comparator, the magnitude of potential benefit and its physiological relevance are difficult to assess.
Another source of confusion is overreliance on ex vivo culture treatments. Despite recent progress at identifying culture conditions that better maintain functional HSCs (Wilkinson et al., 2019), both young and old HSCs ineluctably differentiate upon in vitro culture, which makes it difficult to separate an in vitro anti-differentiation effect from a true rejuvenation outcome (Florian et al., 2012; Brown et al., 2013; Satoh et al., 2013; Mohrin et al., 2015; Jung et al., 2016; Guidi et al., 2017; Luo et al., 2019). For example, the Cdc42 activity–specific inhibitor can alter the polarity and epigenetic state of old HSCs upon in vitro exposure and improve the myeloid-biased reconstitution, but not total chimerism, of old HSCs (Florian et al., 2012); however, without a direct comparison to freshly isolated, unmanipulated young and old HSCs, it is impossible to distinguish between a change in lineage poising and differentiation rates versus a true reversion to a young state. Without in vivo treatment of old mice, it is also unclear how much of these changes in lineage bias following transplantation of ex vivo cultured old HSCs will be effective at correcting the altered output of the native old blood system. We argue that in vivo restoration of defective repopulation ability should be the key benchmark for bona fide rejuvenation of old HSC function in transplantation assays. With this distinction in mind, there is very limited evidence in the literature of true functional rejuvenation of old HSCs, in agreement with our results showing the resilience of old HSCs to many systemic interventions.
Perhaps our most surprising finding is the refractory nature of old HSCs to direct and prolonged exposure to an unmanipulated young BM niche. Based on published results showing improvement of old HSC lineage output in transplantation assays upon targeting of the niche by ex vivo exposure to osteopontin (Guidi et al., 2017) or in vivo infusion of an ADRβ3 agonist (Maryanovich et al., 2018), we would have expected some beneficial effects from long-term residence of old HSCs in young BM niches following parabiosis separation. The fact that we did not further illustrates the resilience of established cell-intrinsic drivers of old HSC biology, and demonstrates that HSC aging cannot easily be reversed by only modifying some environmental influences. This is in line with a prior study showing that rejuvenation of BM niches did not improve HSC function in middle-aged mice (Kusumbe et al., 2016). Our findings that neither the BM niche, nor the external milieu are promising targets for reversing the old HSC state are therefore critical to inform the design of more effective anti-aging approaches for the blood system. Strategies directly targeting the molecular characteristics of old HSCs, as well as earlier interventions aimed at delaying aging rather than reversing established features of old age, may prove essential for effectively promoting HSC functional longevity. It may also turn out that, instead of rejuvenating all old HSCs, other strategies, such as killing off the most damaged HSCs, may be an appropriate alternative (Chang et al., 2016). Finally, rejuvenating old HSC function might not be the only way—or even the most important way—to improve blood production in the elderly, as suggested by other studies on lymphoid progenitors (Dorshkind et al., 2020). Taken together, our work on HSCs indicates that systemic bloodborne approaches may not rejuvenate all tissue systems and types of stem cells, and emphasizes the importance of developing multifaceted or combined rejuvenation approaches as effective anti-aging strategies.
Our results also demonstrate that the young HSC state is similarly resilient to the effects of old blood, old blood–derived factors, and old niches, as well as mutations that accelerate organismal aging. They provide indirect support for the intriguing hypothesis that HSC aging is instead strongly regulated by an internal clock that may be coupled to replicative lifespan (Bernitz et al., 2016). Accordingly, transplantation itself seems to have a significant and lasting effect on HSC epigenetic state and function, regardless of age, possibly due to metabolic activation (Ho et al., 2017), subsequent mitochondrial dysfunction (Hinge et al., 2020), and eventual replicative exhaustion (Ito et al., 2006; Beerman et al., 2013; Bernitz et al., 2016). This may explain why HSCs can only be retransplanted a limited number of times (Rossi et al., 2008). However, transplanted young HSCs can still provide youthful blood production, even when engrafted into inflamed and damaged old BM niches. This is an important finding for older patients undergoing BM transplantation and emerging anti-aging therapies that rely on engraftment of banked autologous young HSCs (Das et al., 2019; Smith et al., 2020).
Limitations of the study
Here, we studied the potential rejuvenation of the entire old HSC compartment and not of any specific lineage-biased subsets (Haas et al., 2018), which may show more individually modulated responses. We also focused on specific components of the niche (e.g., endosteal peri-arteriolar MSC-S and their OPr derivatives), and it remains to be determined whether features of aging in other elements, like peri-sinusoidal LepR+ MSCs, the vasculature, macrophages, or the parasympathetic nervous system, are also resistant to systemic rejuvenation interventions. While we show that the relocation of old HSCs into young niches during parabiosis does not affect those young niches, it is still possible that more long-term residence of old HSCs after separation could have an impact, eventually remodeling young niches into an aging-permissive microenvironment favoring old HSC expansion. While we did not observe any particular sex effects in our experiments with old mice, it does not preclude an effect at younger ages. We also cannot exclude the possibility that HSCs transition over time into an even more advanced geriatric phenotype as shown for muscle satellite cells isolated from 30-mo-old mice (Sousa-Victor et al., 2014). In this context, interventions that fail to rejuvenate 18- or 24-mo-old HSCs may be more efficient when applied at an even earlier age, although our results with lifelong calorie restriction suggest that an intervention with some beneficial effects at midlife does not necessarily translate into a long-term anti-aging effect. Finally, while we studied a wide array of well-established systemic rejuvenation paradigms, we cannot exclude the possibility that other approaches not examined here may prove more effective at rejuvenating the old HSC state. Similarly, we cannot exclude the possibility that other aging mutant mouse models may have stronger phenotypes of HSC aging.
Materials and methods
Experimental model and subject details
Mice
Young and old wild-type C57Bl6-CD45.2 (B6), wild-type C57Bl/6-CD45.1 (BJ), and β-actin-Gfp-CD45.2 (GFP) mice of both sexes were bred and aged in-house, either at University of California, San Francisco (UCSF), or Columbia University Irving Medical Center (CUIMC). Some old mice and all calorie-restricted wild-type B6 mice were also obtained from the NIA aged rodent colonies. Young NOD.Cg-Prkdcscid/J (NOD/SCIDD) mice were purchased from The Jackson laboratory. Lm (B6 background; Osorio et al., 2011) and Bu (mixed background; Baker et al., 2004) progeroid mice and age-matched controls were bred and aged at the Buck Institute for Research on Aging and the Mayo Clinic, respectively. Bones from Bu mice were initially shipped to our laboratory to setup transplantation experiments, until Bu mice bred and aged in-house at UCSF were used to confirm all the results. Ghrh−/− (mixed background; Sun et al., 2013) long-lived mice and age-matched controls were bred and aged at Southern Illinois University, and bones were shipped to our laboratory for experiments. Unless otherwise indicated, young mice used for Iso and Het parabiosis experiments were between 7–8 wk (∼2 mo) of age, and old mice were either ∼17 or ∼23 mo of age at the time of the surgeries. Young and old donor mice used for Het transplantation experiments were 7–15 wk (∼3 mo) and 20 mo of age, respectively, at the time of the transplantations, and recipients mice were either 7–10 wk (∼3 mo) or 19–21 mo (∼20 mo) of age for young and old recipients, respectively. Young and old control mice and mice used for the different rejuvenation interventions were 3 mo and 24 mo of age, respectively, unless otherwise indicated. Young recipient mice for HSC primary and secondary transplantation assays were ∼2 mo of age. No specific randomization or blinding protocol was used, and both male and female animals were used indiscriminately in all experiments. All mice were maintained in mouse facilities at UCSF or CUIMC in accordance with institutional animal care and use committee protocols approved at each institution.
Method details
Parabiosis
Parabiosis surgery followed previously described procedures (Villeda et al., 2014). Mirror-image incisions at the left and right flanks were made through the skin and shorter incisions were made through the abdominal wall. The peritoneal openings of the adjacent parabionts were sutured together. Elbow and knee joints from each parabiont were sutured together and the skin of each mouse was stapled (9-mm Autoclip; Clay Adams) to the skin of the adjacent parabiont. Each mouse was injected subcutaneously with Baytril antibiotic and Buprenex, as directed, for pain and monitored during recovery. For overall health and maintenance behavior, several recovery characteristics were analyzed at various times after surgery, including paired weights and grooming behavior. Parabiosed pairs were analyzed 4–5 wk (∼1 mo) after surgery. For G-CSF injections, each parabiont was injected subcutaneously with 200 µg/kg of recombinant mouse G-CSF (PeproTech) for 4 d consecutively on days 17, 18, 19, and 20 after surgery. For separation experiments, a cohort of (3/24) Het pairs were separated ∼1 mo after surgery and Y parabionts were kept to monitor for the contribution of O HSCs to blood production for an additional 4.5 mo. For BM cytokine analyses, an independent (6/23) parabiosis cohort established for a separate study was used to harvest BM fluid. For analyses, mice from distinct (3/18) or (3/24) cohorts were combined together.
Plasma injections
Y plasma was collected from eight pooled B6 mice of 3 mo of age as described (Villeda et al., 2014). Blood was collected by intracardial bleed with PBS/EDTA at the time of euthanasia, and plasma was obtained following centrifugation at 1,000 g. All plasma aliquots were stored at −80°C until use. Before administration, plasma was dialyzed using 3.5-kD D-tube dialyzers (EMD Millipore) in PBS to remove EDTA. Y and O mice were then injected with Y plasma or PBS control (100 µl per injection) via retro-orbital delivery eight times, 3 d apart over a 24-d period (∼1 mo).
Other rejuvenation interventions
For exercise cohorts, exercise wheels were placed in half the cages for 7 wk of voluntary use, and mice were monitored to ensure active use as described (Horowitz et al., 2020). For lifelong calorie restriction cohorts, both ad libitum controls and calorie-restricted mice were obtained from the NIA calorie restriction mouse colony and aged in-house at UCSF on appropriate chows (also provided by the NIA). Calorie-restricted mice were placed on a 10% restricted diet at 14 wk of age, increased to 25% restriction at 15 wk, and to 40% restriction at 16 wk that was maintained throughout the life of the animals until analyses at 24 mo of age (over 20 mo of calorie restriction total).
Transplantations
Recipient mice were irradiated using either a 137Cs source (J.L. Shepherd) or an x-ray irradiator (MultiRad225; Precision X-Ray Irradiation), and purified HSCs were delivered via retro-orbital injections. Except when indicated, HSCs were isolated from the pooled BM of several donor mice and transplanted into five recipient mice per group, with two to three repeats with different donors per group. For HSC transplantations assays, congenic recipients were irradiated with 11 Gy (delivered in split doses 3 h apart) and transplanted with either 250 or 500 HSCs delivered together with 300,000 Sca-1–depleted helper congenic BM cells. For parabiosis experiments, old B6 HSCs from Iso O/O and Het Y/O pairs were injected into young BJ recipients, and young BJ HSCs from Iso Y/Y and Het Y/O pairs were injected into young B6 recipients. For other interventions and the Lm progeroid model, young or old B6 HSCs were injected into young BJ recipients. For Bu progeroid and Ghrh−/− long-lived mice on mixed backgrounds, young NOD/SCIDD mice sublethally irradiated with 3.5 Gy were used as recipients. For Het transplantation experiments, young or old B6 recipients were sublethally irradiated with 9 Gy (delivered in split doses 3 h apart) and transplanted with 2,000 young or old BJ HSCs. Transplanted mice were kept on polymyxin/neomycin containing water for 4 wk. Peripheral blood was analyzed monthly for donor-derived chimerism via retro-orbital bleeding and collected in either 4 ml ACK (150 mM NH4Cl/10 mM KHCO3) containing 10 mM EDTA for flow cytometry analyses or EDTA-coated tubes (Becton Dickinson) for complete blood count analyses using a Genesis (Oxford Science) hematology system. For each cohort, the number of transplanted mice that were followed over time and the numbers of mice that were analyzed at 4 mo after transplantation for reconstitution are indicated on the figures. Recipient mice with chimerism levels ≤1% in the BM were excluded from analyses.
Flow cytometry
HSCs and other progenitor populations were analyzed and/or purified as described (Pietras et al., 2015). Briefly, BM cells were obtained by crushing leg, arm, and pelvic bones (with sternum and spines for some experiments) in staining media composed of HBSS containing 2% heat-inactivated FBS (B003L52; Cellgro). Unless indicated, bones were not combined between individual mice. Red blood cells were removed by ACK lysis, and single-cell suspensions of BM cells were purified on a Ficoll gradient (Histopaque 1119; Sigma-Aldrich). BM cells were then enriched for c-Kit+ cells using c-Kit microbeads (130–091-224; Miltenyi Biotec) and an AutoMACS cell separator (Miltenyi Biotec). For cell analyses, unfractionated BM cells were incubated with purified rat anti-mouse lineage antibodies (CD3 from BioLegend; and CD4, CD5, CD8, B220, Ter119, Mac-1, and Gr-1 from eBioscience) followed by goat anti-rat-PE-Cy5 (A10691; Invitrogen) and subsequently blocked with purified rat IgG (Sigma-Aldrich). Cells were then stained with c-Kit-APC-eFluor780 (47–1171-82; eBioscience), Sca-1-PB (108120; BioLegend), CD48-A647 (103416; BioLegend), CD150-PE (115904; BioLegend), and Flk2-bio (13–1351-82; eBioscience) followed by either SA-PeCy7 (25–4317-82; eBioscience) or SA-Qdot605 (Q10101MP; Invitrogen) for HSC staining, or together with CD34-FITC (11–0341-85; eBioscience) and FcγR-PerCP-eFluor710 (46–0161-82; eBioscience) for combined HSC/myeloid progenitor staining. For HSC chimerism analyses, HSCs were stained with Lin/PE-Cy5, c-Kit-APC-eFluor780, Sca-1-PB, CD48-A647, CD150-PE, and Flk2-bio followed by SA-Qdot605, together with CD45.2-FITC (11–0454-85; eBioscience) and CD45.1-PE-Cy7 (25–0453-82; eBioscience). For mature cell analyses, unfractionated BM cells were stained with Mac-1-PE-Cy7 (25–0112-82; eBioscience), Gr-1-PB (57–5931-82; eBioscience), B220-APC-Cy7 (47–0452-82; eBioscience), CD19-PE (12–0193-82; eBioscience), CD4-FITC (553729; BD Biosciences), and CD8-PE (100908; BioLegend). For peripheral blood chimerism analyses, cells were stained with Mac-1-PE-Cy7, Gr-1-PB, B220-APC-Cy7, CD3-APC (17–0032-82; eBioscience), and Ter-119-PE-Cy5 (15–5921-83; eBioscience), together with either CD45.2-FITC or CD45.2-Bio followed by SA-Qdot605 and CD45.1-PE (12–0453; eBioscience). BM endosteal stromal cells were isolated from hematopoietic-depleted, collagenase-treated bone chips, as described (Schepers et al., 2013), and were incubated with purified rat Lin/goat anti-rat-Qdot605 (Q11601MP; Life Technologies), Sca-1-PB, CD45-APC-Cy7 (557659; BD Biosciences), CD31-FITC or CD31-PE (553373; BD Biosciences), and either CD51-PE or CD51-Bio (551380; BD Biosciences) followed by SA-APC (17–4317-82; eBioscience). Both hematopoietic and stromal cells were finally resuspended in staining media with 1 µg/ml propidium iodide to exclude dead cells. Cell isolation was performed on a BD FACS Aria II (UCSF) or FACS ARIA II SORP (CUIMC) using single (stroma) or double (hematopoiesis) sorting, and cell analyses were performed either on the same FACS ARIA or a BD LSR II (UCSF) or either a BD Celesta or a Bio-Rad ZE5 cell analyzer (CUIMC). For MMP analyses, sorted HSCs were incubated for 15 min at 37°C with tetramethylrhodamine-ethyl-ester (200 nM; enz-52309; Enzo Life Sciences) in staining media. HSCs were then washed and resuspended in staining media containing 1 µg/ml propidium iodide and analyzed for dye fluorescence in the PE channel. Results were analyzed with BD FlowJo software.
Cell culture
All cultures were performed at 37°C in a 5% CO2 water jacket incubator (Thermo Fisher Scientific). HSCs were grown in IMDM (06200; StemCell Technology) supplemented with 5% FBS (06200; StemCell Technology), penicillin (50 U/ml)/streptomycin (50 µg/ml), nonessential amino acids (0.1 mM), sodium pyruvate (1 mM), L-glutamine (2 mM), 2-mercaptoethanol (50 µM) and stem cell factor (25 ng/ml), Flt3L (25 ng/ml), IL-11 (25 ng/ml), IL-3 (10 ng/ml), GM-CSF (10 ng/ml), erythropoietin (4 U/ml), and thrombopoietin (25 ng/ml; all from PeproTech). For single-cell kinetics analyses, cells were sorted directly into a 96-well plate (one cell per 100 µl per well, 96 wells scored per condition), and then visually inspected after 12 h to confirm successful single-cell sort and again at the indicated time points to establish the kinetics of the first cell division with appearance of two or more cells per well. Results from two to three independent experiments were combined to provide the indicated cell counts. Stromal populations were grown in MEM Eagle α modification supplemented with 10% FBS (B003L52; CellGo), penicillin (50 U/ml)/streptomycin (50 µg/ml), and 2-mercaptoethanol (50 µM) as described (Schepers et al., 2013). For CFU-F assays, endosteal MSC-S (15–300 cells) or OPr (170–300 cells) were sorted directly in a 6-well plate containing 1.5 ml/well and cultured for 11 d with medium exchange every 2–3 d before staining with Giemsa-Wright to score colonies of 25 or more cells.
Immunofluorescence staining
HSCs (400–1,500 cells) were sorted directly onto poly-lysine–coated slides (P-4981; VWR International) and fixed in PBS/4% PFA for 10 min at room temperature as described (Flach et al., 2014). Slides were permeabilized in PBS/0.15% Triton X-100 for 2 min at room temperature and blocked in PBS/1% BSA for 1 h at room temperature. Slides were then incubated in PBS/1% BSA with mouse anti–phospho-H2AX (Ser139; 05–636; Millipore) and rabbit anti-FBL (2639; Cell Signaling Technology) for 1 h at 37°C. Slides were then washed three times in PBS and incubated for 1 h at 37°C in PBS/1% BSA with A488-conjugated goat anti-mouse (A-11029; Life Technologies) and A594-conjugated goat anti-rabbit (A-11037; Life Technologies) secondary antibodies. Slides were finally washed three times in PBS and mounted using VectaShield (Vector Laboratories) containing 1 µg/ml DAPI. Cells were imaged on a SP5 Leica Upright Confocal Microscope (20× or 63× objective), and images were processed using Volocity software (version 4.4; Improvision) and ImageJ. Between five and eight z-stacks were taken per image, and total fluorescence per cell was measured using Volocity on ≥20 cells per condition.
Brain immunohistochemistry
Tissue processing and immunohistochemistry was performed on free-floating sections according to standard published techniques (Villeda et al., 2014). Briefly, mice were anesthetized with 400 mg/kg chloral hydrate (Sigma-Aldrich) and transcardially perfused with 0.9% saline. Brains were removed and fixed in phosphate-buffered 4% paraformaldehyde (pH 7.4) at 4°C for 48 h before embedding in 30% sucrose for cryoprotection. Brains were then sectioned coronally at 40 Mm with a cryomicrotome (Leica Camera) and stored in cryoprotective medium. Sections were incubated overnight with mouse anti-MCM2 (1:500; 610700; clone: 46/BM28; BD Biosciences) or goat anti-DCX (1:7,500; Santa Cruz Biotechnology) primary antibodies, and revealed using appropriate A488-conjugated fluorescent secondary antibody (Life Technologies). To estimate the total number of positive cells per DG, immunopositive cells in the granule cell and subgranular cell layer of the DG were counted in every sixth coronal hemibrain section through the hippocampus for a total of six sections and multiplied by 12.
Cytokine profiling
Serum was harvested from blood collected by cardiac puncture. The blood was left to clot for 10–15 min at room temperature, followed by centrifugation at 15,300 g for 10 min to collect supernatants. Serum aliquots were stored at −80°C. BM fluid was flushed out from the four hind leg bones (two femurs and two tibiae) using the same 200 µl HBSS/2% FBS in a 1-ml syringe with 26-G needle. BM cells were sedimented by centrifugation at 300 g for 5 min and collected supernatants were purified by an additional centrifugation at 15,300 g for 10 min. BM fluids were stored at −80°C until use. For bead array analysis, 50 µl of 2× diluted sample was analyzed using Mouse 20-Plex panel (Thermo Fischer Scientific) using either a Magpix or Luminex 200 analyzer according to manufacturer’s protocol.
Quantitative RT-PCR analyses
Total RNA was isolated from ∼5,000 HSCs sorted directly into TRIzol-LS (Invitrogen) according to the manufacturer’s protocol. RNA was treated with DNase I and reverse transcribed using SuperScriptIII kit with random hexamers (Invitrogen). Runs were performed on a 7900HT Fast Real-Time PCR System (Applied Biosystems) using SYBR Green reagents (Applied Biosystems) and the cDNA equivalent of 200 HSC per reaction. Sequences for quantitative RT-PCR primers were as follows: Mcm4: forward, 5′-ACAGGAATGAGTGCCACTTCTCGT-3′; reverse, AAAGCTCGCAGGGCTTCTTCAAAC-3′ (NM_008565.3); and Actb: forward, 5′-GACGGCCAGGTCATCACTATTG-3′; reverse, 5′-AGGAAGGCTGGAAAAGAGCC-3′ (NM_007393). Values were normalized to Actb expression.
RNA sequencing library preparation
RNA was purified from a range of 2,000–20,000 HSCs using the Arcturus PicoPure RNA Isolation Kit (Thermo Fisher Scientific). RNA was quantified and quality controlled using an Agilent Bionalyzer with 3 out of 35 samples excluded from further library preparation on the basis of low RNA quality and/or quantity. Illumina sequencing libraries were prepared and sequenced at the New York University Genome Technology Center. The NuGen Ovation Trio low input RNA sequencing library preparation kit was used for library preparation, with all libraries prepared at the same time to minimize batch effects. Libraries were sequenced using an Illumina HiSEQ 4000 instrument with single-end 50-base pair sequencing to a target depth of 40 million unique reads per sample. Two additional samples were excluded from downstream analysis on the basis of low sequencing depth.
Analysis of RNA sequencing data
Sequencing quality control was performed using FastQC and MultiQC. Transcripts were quantified against a transcriptome index built using the GENCODE GRCm38.p5 vM16 CHR FASTA file using Salmon in mapping-based mode. Transcript counts were collapsed to gene level by summing mapped reads of all transcripts per gene using Tximport and the GENCODE GRCm38.p5 vM16 comprehensive gene annotation GTF file. Gene counts were imported into a DDS object using DESeq2, removing genes with less than 100 reads summed across all included samples. The variance-stabilizing transformation implemented in DESeq2 was used to normalize sample read counts for exploratory data analysis, including principal component analysis and hierarchical clustering. We created a linear model regressing out the effect of the sample genotype, design(dds) = formula (~genotype + group), to test for differential expression among indicated pairwise comparisons using the results function and the DESeq2 estimator. The Benjamini-Hochberg algorithm was used for multiple testing correction, with a false discovery rate (FDR) of 0.05 significance threshold. Gene-set enrichment analyses were performed for the indicated pairwise comparisons using gene symbol log2 fold change preranked files using the classic enrichment statistic, gene sets with a minimum size of 15 and maximum size of 500 genes, the mouse gene symbol remapping MSigDB.v7.0 chip, and the c2.cp.recatome.v6.2.symbols curated gene database.
ATAC-seq sample and library preparation
For the ATAC-seq analyses of young and old HSCs before and after transplantation, we used a paired approach. For each replicate, pools of three to four young B6 mice and individual old B6 mouse were used to isolate 10,000 pretransplantation HSCs for ATAC-seq sample preparation and to transplant 1,000 HSCs each into five lethally irradiated young BJ recipient mice alongside 300,000 Sca-1–depleted BJ helper BM cells. Post-transplantation samples were collected 3 mo after transplantation from the pooled BM of the five recipient mice to obtain 10,000 post-transplantation HSCs for ATAC-seq sample preparation. At the time of harvest, ATAC-seq samples were lysed and transposed as described (Corces et al., 2017), with some minor modifications. Briefly, HSCs were sorted into 400 µl staining media, washed with 1 ml PBS and spun down at 500 g for 5 min at 4°C. Liquid was carefully aspirated and pellets were resuspended in 50 µl ATAC-seq lysis buffer (ATAC-RSB composed of 1M Tris-HC1 [pH 7.4], 5M NaCl, and 1M MgCl2 in water, with 0.1% Tween 20, 0.01% digitonin, and 0.1% NP-40) and left on ice for 3 min. Samples were then washed with 1 ml ATAC wash buffer (ATAC-RSB with 0.1% Tween 20), inverted to mix, spun for 10 min at 500 g at 4°C, and resuspended in 20 µl ATAC transposition buffer (1× Nextera TD Buffer [Illumina], 100 nM Nextera Transposase [Illumina], 0.01% digitonin, and 0.01% Tween 20 in PBS). DNA was transposed for 30 min at 37°C, purified using the ZYMO clean and concentrator-5 kit (Zymo), eluted in 22 µl Zymo Elution buffer, and then stored at −20°C until library preparation. Preparation of all pre- and post-transplantation ATAC-seq samples were spread over 3 d each, processing both Y and O samples together on the same day to limit sorting-associated batch effects. Libraries were preamplified with a common Ad1 adapter and unique Ad2 adapter sequences (Buenrostro et al., 2013), and additionally amplified using quantitative PCR cycle determination with the NEBNext High-Fidelity 2X PCR Master Mix (New England Biolabs). All libraries were prepared on the same day to limit library preparation-associated batch effects. Double-sided AMPure XP bead purification kit (Beckman Coulter) was used to remove primer-dimers and large fragments >1,000 bp. Libraries were quality controlled using Qubit and Agilent Bioanalyzer at the Columbia University Medical Center Herbert Irving Comprehensive Cancer Center Molecular Pathology core. Samples were sequenced by GENEWIZ using paired-end 150-bp sequencing on a HiSeq400 instrument to a target depth of 100 million unique reads per sample.
ATAC-seq data analysis
Sequencing quality control was performed using FastQC and MultiQC, which revealed Nextera sequencing adapter contamination that was removed using the Trim Galore Cutadapt wrapper in paired-end mode, followed by confirmation of adapter removal with FastQC. Rsubread was used to align samples to the mm10 genome. Rsamtools was used to sort and index output BAM files. BAM files were quality controlled by looking at the distribution of reads aligning to chromosomes and the distribution of insert sizes. We next used Genrich (Harvard FAS Informatics) to call peaks in ATAC-seq mode using a maximum q value threshold of 0.05 for peak calling, removing PCR duplicates, and excluding reads that mapped to the mitochondrial genome and the Y chromosome. NarrowPeak files generated by Genrich were quality controlled for distribution of reads mapping to mm10 genomic regions using the R CHIPseeker package and Tx.Db.mmusculus.UCSC.mm10.knowngene annotation. For differential ATAC-seq, a GRanges consensus peak object was generated using ChIPQC containing nonredundant open regions present in any sample, excluding known mm10 ATAC-seq blacklisted regions obtained from Encode (ENCFF547MET). Nucleosome-free regions (<100-bp fragment length) from sample BAM files were counted using FeatureCounts against the consensus peak annotation. Sample counts were imported into a dds object using DESeq2, and exploratory data analysis was performed using rlog normalized count data and principal component analysis. For differential peak accessibility calling between groups, we used DESeq2 using the results function and the DESeq2 estimator. For pathway enrichment analyses, we annotated promoter proximal peaks within ±1,000 bp of the transcription start site using TxDb.Mmusculus.UCSC.mm10.knownGene. We used ReactomePA to test for Reactome pathway enrichment in peaks with increased relative peak accessibility in a given comparison using a log2 fold change threshold of greater than or equal to 0.5 or less than or equal to −0.5, and a P value cutoff of 0.05.
Quantitation and statistical analysis
Experiments were repeated two or more times to generate the number of independent samples listed on each figure. All experimental measurements were done with technical repeats. Unless indicated, data are expressed as mean ± SD. Mice for treatment and transplantation were randomized, samples were alternated whenever possible, and no blinding protocol was used. No statistical method was used to predetermine sample size. Pairwise statistical significance was evaluated by two-tailed Student’s t test. P values <0.05 were considered statistically significant. Figures were made with GraphPad Prism software.
Online supplemental material
Fig. S1 shows gating strategies and ATAC-seq results for young and old HSC transplantations. Fig. S2 provides additional characterization of (3/24) and (3/18) parabiosis cohorts. Fig. S3 shows inflammation in parabiosis cohorts. Fig. S4 shows gene expression signatures of young and old HSCs and further characterization of transplanted mice. Fig. S5 provides additional characterization of rejuvenation interventions and aging mutant mice.
Acknowledgments
We thank Dr. B. Kennedy (Buck Institute, Novato, CA) for the Lm mice, Dr. J. van Deursen and Darren Baker (Mayo Clinic, Rochester, MN) for the Bu mice, Dr. A. Bartke (Southern Illinois University, Springfield, IL) for the Ghrh−/− mice, M. Lee (UCSF) and M. Kissner (Columbia University Medical Center) for management of our flow cytometry core facilities, and all members of the Villeda and Passegué laboratories for insights and suggestions.
T.T. Ho was supported by American Heart Association and Hillblom Center for the Biology of Aging predoctoral fellowships; P.V. Dellorusso by National Institutes of Health grant F31HL151140; E.V. Verovskaya by a Rubicon Grant from The Netherlands Organization for Scientific Research, a Stem Cell Grant from BD Biosciences, and an NYSTEM training grant; and S.T. Bakker by a California Institute for Regenerative Medicine postdoctoral fellowship. This work was supported by NIA grant R01AG055797 (S.A. Villeda) and National Institutes of Health grant R35HL135763, Program for Breakthrough Biomedical Research New Frontier Award, Glenn Foundation for Medical Research Research Award, and Samuel Waxman Cancer Research Foundation Aging and Cancer grant (E. Passegué).
Author contributions: T.T. Ho, P.V. Dellorusso, and E.V. Verovskaya contributed to all the experiments described in the manuscript with the initial participation of S.T. Bakker and J. Flach, and the technical assistance of O.M. Lansinger, A. Hérault, S.Y. Zhang, Y.-A. Kang, and C.A. Mitchell. Parabiosis surgeries and brain analyses were done by L.K. Smith and P.B. Ventura. Together, T.T. Ho, P.V. Dellorusso, E.V. Verovskaya, S.T. Bakker, S.A. Villeda, and E. Passegué designed the experiments and interpreted the results. T.T. Ho, P.V. Dellorusso, and E. Passegué wrote the manuscript.
Data availability
Datasets that support the findings of this study have been deposited in the Gene Expression Omnibus under accession no. GSE134417 for RNA sequencing files and GSE151665 for ATAC-seq files. All other data are available from the corresponding author upon reasonable request.
References
- Abkowitz, J.L., Robinson A.E., Kale S., Long M.W., and Chen J.. 2003. Mobilization of hematopoietic stem cells during homeostasis and after cytokine exposure. Blood. 102:1249–1253. 10.1182/blood-2003-01-0318 [DOI] [PubMed] [Google Scholar]
- Anton, S., and Leeuwenburgh C.. 2013. Fasting or caloric restriction for healthy aging. Exp. Gerontol. 48:1003–1005. 10.1016/j.exger.2013.04.011 [DOI] [PMC free article] [PubMed] [Google Scholar]
- Baker, D.J., Jeganathan K.B., Cameron J.D., Thompson M., Juneja S., Kopecka A., Kumar R., Jenkins R.B., de Groen P.C., Roche P., and van Deursen J.M.. 2004. BubR1 insufficiency causes early onset of aging-associated phenotypes and infertility in mice. Nat. Genet. 36:744–749. 10.1038/ng1382 [DOI] [PubMed] [Google Scholar]
- Beerman, I., and Rossi D.J.. 2015. Epigenetic control of stem cell potential during homeostasis, aging, and disease. Cell Stem Cell. 16:613–625. 10.1016/j.stem.2015.05.009 [DOI] [PMC free article] [PubMed] [Google Scholar]
- Beerman, I., Bock C., Garrison B.S., Smith Z.D., Gu H., Meissner A., and Rossi D.J.. 2013. Proliferation-dependent alterations of the DNA methylation landscape underlie hematopoietic stem cell aging. Cell Stem Cell. 12:413–425. 10.1016/j.stem.2013.01.017 [DOI] [PubMed] [Google Scholar]
- Bernitz, J.M., Kim H.S., MacArthur B., Sieburg H., and Moore K.. 2016. Hematopoietic stem cells count and remember self-renewal divisions. Cell. 167:1296–1309.e10. 10.1016/j.cell.2016.10.022 [DOI] [PMC free article] [PubMed] [Google Scholar]
- Brown, K., Xie S., Qiu X., Mohrin M., Shin J., Liu Y., Zhang D., Scadden D.T., and Chen D.. 2013. SIRT3 reverses aging-associated degeneration. Cell Rep. 3:319–327. 10.1016/j.celrep.2013.01.005 [DOI] [PMC free article] [PubMed] [Google Scholar]
- Buenrostro, J.D., Giresi P.G., Zaba L.C., Chang H.Y., and Greenleaf W.J.. 2013. Transposition of native chromatin for fast and sensitive epigenomic profiling of open chromatin, DNA-binding proteins and nucleosome position. Nat Methods 10, 1213-1218 (2013). Nat. Methods. 10:1213–1218. 10.1038/nmeth.2688 [DOI] [PMC free article] [PubMed] [Google Scholar]
- Cerletti, M., Jang Y.C., Finley L.W., Haigis M.C., and Wagers A.J.. 2012. Short-term calorie restriction enhances skeletal muscle stem cell function. Cell Stem Cell. 10:515–519. 10.1016/j.stem.2012.04.002 [DOI] [PMC free article] [PubMed] [Google Scholar]
- Chang, J., Wang Y., Shao L., Laberge R.M., Demaria M., Campisi J., Janakiraman K., Sharpless N.E., Ding S., Feng W., et al. 2016. Clearance of senescent cells by ABT263 rejuvenates aged hematopoietic stem cells in mice. Nat. Med. 22:78–83. 10.1038/nm.4010 [DOI] [PMC free article] [PubMed] [Google Scholar]
- Chen, J., Astle C.M., and Harrison D.E.. 2003. Hematopoietic senescence is postponed and hematopoietic stem cell function is enhanced by dietary restriction. Exp. Hematol. 31:1097–1103. 10.1016/S0301-472X(03)00238-8 [DOI] [PubMed] [Google Scholar]
- Chen, C., Liu Y., Liu Y., and Zheng P.. 2009. mTOR regulation and therapeutic rejuvenation of aging hematopoietic stem cells. Sci. Signal. 2:ra75. 10.1126/scisignal.2000559 [DOI] [PMC free article] [PubMed] [Google Scholar]
- Cheng, C.W., Adams G.B., Perin L., Wei M., Zhou X., Lam B.S., Da Sacco S., Mirisola M., Quinn D.I., Dorff T.B., et al. 2014. Prolonged fasting reduces IGF-1/PKA to promote hematopoietic-stem-cell-based regeneration and reverse immunosuppression. Cell Stem Cell. 14:810–823. 10.1016/j.stem.2014.04.014 [DOI] [PMC free article] [PubMed] [Google Scholar]
- Conboy, I.M., Conboy M.J., Wagers A.J., Girma E.R., Weissman I.L., and Rando T.A.. 2005. Rejuvenation of aged progenitor cells by exposure to a young systemic environment. Nature. 433:760–764. 10.1038/nature03260 [DOI] [PubMed] [Google Scholar]
- Conboy, M.J., Conboy I.M., and Rando T.A.. 2013. Heterochronic parabiosis: historical perspective and methodological considerations for studies of aging and longevity. Aging Cell. 12:525–530. 10.1111/acel.12065 [DOI] [PMC free article] [PubMed] [Google Scholar]
- Conese, M., Carbone A., Beccia E., and Angiolillo A.. 2017. The fountain of youth: a tale of parabiosis, stem cells, and rejuvenation. Open Med. (Wars.). 12:376–383. 10.1515/med-2017-0053 [DOI] [PMC free article] [PubMed] [Google Scholar]
- Corces, M.R., Trevino A.E., Hamilton E.G., Greenside P.G., Sinnott-Armstrong N.A., Vesuna S., Satpathy A.T., Rubin A.J., Montine K.S., Wu B., et al. 2017. An improved ATAC-seq protocol reduces background and enables interrogation of frozen tissues. Nat. Methods. 14:959–962. 10.1038/nmeth.4396 [DOI] [PMC free article] [PubMed] [Google Scholar]
- Das, M.M., Godoy M., Chen S., Moser V.A., Avalos P., Roxas K.M., Dang I., Yáñez A., Zhang W., Bresee C., et al. 2019. Young bone marrow transplantation preserves learning and memory in old mice. Commun. Biol. 2:73. 10.1038/s42003-019-0298-5 [DOI] [PMC free article] [PubMed] [Google Scholar]
- De Lisio, M., and Parise G.. 2012. Characterization of the effects of exercise training on hematopoietic stem cell quantity and function. J Appl Physiol (1985). 113:1576–1584. 10.1152/japplphysiol.00717.2012 [DOI] [PMC free article] [PubMed] [Google Scholar]
- Dorshkind, K., Höfer T., Montecino-Rodriguez E., Pioli P.D., and Rodewald H.-R.. 2020. Do haematopoietic stem cells age? Nat. Rev. Immunol. 20:196–202. 10.1038/s41577-019-0236-2 [DOI] [PMC free article] [PubMed] [Google Scholar]
- Ergen, A.V., Boles N.C., and Goodell M.A.. 2012. Rantes/Ccl5 influences hematopoietic stem cell subtypes and causes myeloid skewing. Blood. 119:2500–2509. 10.1182/blood-2011-11-391730 [DOI] [PMC free article] [PubMed] [Google Scholar]
- Ertl, R.P., Chen J., Astle C.M., Duffy T.M., and Harrison D.E.. 2008. Effects of dietary restriction on hematopoietic stem-cell aging are genetically regulated. Blood. 111:1709–1716. 10.1182/blood-2007-01-069807 [DOI] [PMC free article] [PubMed] [Google Scholar]
- Flach, J., Bakker S.T., Mohrin M., Conroy P.C., Pietras E.M., Reynaud D., Alvarez S., Diolaiti M.E., Ugarte F., Forsberg E.C., et al. 2014. Replication stress is a potent driver of functional decline in ageing haematopoietic stem cells. Nature. 512:198–202. 10.1038/nature13619 [DOI] [PMC free article] [PubMed] [Google Scholar]
- Florian, M.C., Dörr K., Niebel A., Daria D., Schrezenmeier H., Rojewski M., Filippi M.D., Hasenberg A., Gunzer M., Scharffetter-Kochanek K., et al. 2012. Cdc42 activity regulates hematopoietic stem cell aging and rejuvenation. Cell Stem Cell. 10:520–530. 10.1016/j.stem.2012.04.007 [DOI] [PMC free article] [PubMed] [Google Scholar]
- Florian, M.C., Nattamai K.J., Dörr K., Marka G., Überle B., Vas V., Eckl C., Andrä I., Schiemann M., Oostendorp R.A., et al. 2013. A canonical to non-canonical Wnt signalling switch in haematopoietic stem-cell ageing. Nature. 503:392–396. 10.1038/nature12631 [DOI] [PMC free article] [PubMed] [Google Scholar]
- Frisch, B.J., Hoffman C.M., Latchney S.E., LaMere M.W., Myers J., Ashton J., Li A.J., Saunders J. II, Palis J., Perkins A.S., et al. 2019. Aged marrow macrophages expand platelet-biased hematopoietic stem cells via Interleukin1B. JCI Insight. 5:e124213. 10.1172/jci.insight.124213 [DOI] [PMC free article] [PubMed] [Google Scholar]
- Frodermann, V., Rohde D., Courties G., Severe N., Schloss M.J., Amatullah H., McAlpine C.S., Cremer S., Hoyer F.F., Ji F., et al. 2019. Exercise reduces inflammatory cell production and cardiovascular inflammation via instruction of hematopoietic progenitor cells. Nat. Med. 25:1761–1771. 10.1038/s41591-019-0633-x [DOI] [PMC free article] [PubMed] [Google Scholar]
- Garatachea, N., Pareja-Galeano H., Sanchis-Gomar F., Santos-Lozano A., Fiuza-Luces C., Morán M., Emanuele E., Joyner M.J., and Lucia A.. 2015. Exercise attenuates the major hallmarks of aging. Rejuvenation Res. 18:57–89. 10.1089/rej.2014.1623 [DOI] [PMC free article] [PubMed] [Google Scholar]
- Genovese, G., Kähler A.K., Handsaker R.E., Lindberg J., Rose S.A., Bakhoum S.F., Chambert K., Mick E., Neale B.M., Fromer M., et al. 2014. Clonal hematopoiesis and blood-cancer risk inferred from blood DNA sequence. N. Engl. J. Med. 371:2477–2487. 10.1056/NEJMoa1409405 [DOI] [PMC free article] [PubMed] [Google Scholar]
- Guidi, N., Sacma M., Ständker L., Soller K., Marka G., Eiwen K., Weiss J.M., Kirchhoff F., Weil T., Cancelas J.A., et al. 2017. Osteopontin attenuates aging-associated phenotypes of hematopoietic stem cells. EMBO J. 36:1463. 10.15252/embj.201796968 [DOI] [PMC free article] [PubMed] [Google Scholar]
- Haas, S., Trumpp A., and Milsom M.D.. 2018. Causes and consequences of hematopoietic stem cell heterogeneity. Cell Stem Cell. 22:627–638. 10.1016/j.stem.2018.04.003 [DOI] [PubMed] [Google Scholar]
- Hinge, A., He J., Bartram J., Javier J., Xu J., Fjellman E., Sesaki H., Li T., Yu J., Wunderlich M., et al. 2020. Asymmetrically segregated mitochondria provide cellular memory of hematopoietic stem cell replicative history and drive HSC attrition. Cell Stem Cell. 26:420–430.e6. 10.1016/j.stem.2020.01.016 [DOI] [PMC free article] [PubMed] [Google Scholar]
- Ho, T.T., Warr M.R., Adelman E.R., Lansinger O.M., Flach J., Verovskaya E.V., Figueroa M.E., and Passegué E.. 2017. Autophagy maintains the metabolism and function of young and old stem cells. Nature. 543:205–210. 10.1038/nature21388 [DOI] [PMC free article] [PubMed] [Google Scholar]
- Ho, Y.H., Del Toro R., Rivera-Torres J., Rak J., Korn C., García-García A., Macías D., González-Gómez C., Del Monte A., Wittner M., et al. 2019. Remodeling of bone marrow hematopoietic stem cell niches promotes myeloid cell expansion during premature or physiological aging. Cell Stem Cell. 25:407–418.e6. 10.1016/j.stem.2019.06.007 [DOI] [PMC free article] [PubMed] [Google Scholar]
- Horowitz, A.M., and Villeda S.A.. 2017. Therapeutic potential of systemic brain rejuvenation strategies for neurodegenerative disease. F1000 Res. 6:1291. 10.12688/f1000research.11437.1 [DOI] [PMC free article] [PubMed] [Google Scholar]
- Horowitz, A.M., Fan X., Bieri G., Smith L.K., Sanchez-Diaz C.I., Schroer A.B., Gontier G., Casaletto K.B., Kramer J.H., Williams K.E., and Villeda S.A.. 2020. Blood factors transfer beneficial effects of exercise on neurogenesis and cognition to the aged brain. Science. 369:167–173. 10.1126/science.aaw2622 [DOI] [PMC free article] [PubMed] [Google Scholar]
- Ito, K., Hirao A., Arai F., Takubo K., Matsuoka S., Miyamoto K., Ohmura M., Naka K., Hosokawa K., Ikeda Y., and Suda T.. 2006. Reactive oxygen species act through p38 MAPK to limit the lifespan of hematopoietic stem cells. Nat. Med. 12:446–451. 10.1038/nm1388 [DOI] [PubMed] [Google Scholar]
- Jaiswal, S., Fontanillas P., Flannick J., Manning A., Grauman P.V., Mar B.G., Lindsley R.C., Mermel C.H., Burtt N., Chavez A., et al. 2014. Age-related clonal hematopoiesis associated with adverse outcomes. N. Engl. J. Med. 371:2488–2498. 10.1056/NEJMoa1408617 [DOI] [PMC free article] [PubMed] [Google Scholar]
- Jung, H., Kim D.O., Byun J.-E., Kim W.S., Kim M.J., Song H.Y., Kim Y.K., Kang D.-K., Park Y.-J., Kim T.-D., et al. 2016. Thioredoxin-interacting protein regulates haematopoietic stem cell ageing and rejuvenation by inhibiting p38 kinase activity. Nat. Commun. 7:13674. 10.1038/ncomms13674 [DOI] [PMC free article] [PubMed] [Google Scholar]
- Katsimpardi, L., Litterman N.K., Schein P.A., Miller C.M., Loffredo F.S., Wojtkiewicz G.R., Chen J.W., Lee R.T., Wagers A.J., and Rubin L.L.. 2014. Vascular and neurogenic rejuvenation of the aging mouse brain by young systemic factors. Science. 344:630–634. 10.1126/science.1251141 [DOI] [PMC free article] [PubMed] [Google Scholar]
- Khrimian, L., Obri A., Ramos-Brossier M., Rousseaud A., Moriceau S., Nicot A.S., Mera P., Kosmidis S., Karnavas T., Saudou F., et al. 2017. Gpr158 mediates osteocalcin’s regulation of cognition. J. Exp. Med. 214:2859–2873. 10.1084/jem.20171320 [DOI] [PMC free article] [PubMed] [Google Scholar]
- Kuribayashi, W., Oshima M., Itokawa N., Koide S., Nakajima-Takagi Y., Yamashita M., Yamazaki S., Rahmutulla B., Miura F., Ito T., et al. 2021. Limited rejuvenation of aged hematopoietic stem cells in young bone marrow niche. J. Exp. Med. 218:e20192283. 10.1084/jem.20192283 [DOI] [PMC free article] [PubMed] [Google Scholar]
- Kusumbe, A.P., Ramasamy S.K., Itkin T., Mäe M.A., Langen U.H., Betsholtz C., Lapidot T., and Adams R.H.. 2016. Age-dependent modulation of vascular niches for haematopoietic stem cells. Nature. 532:380–384. 10.1038/nature17638 [DOI] [PMC free article] [PubMed] [Google Scholar]
- Lazare, S., Ausema A., Reijne A.C., van Dijk G., van Os R., and de Haan G.. 2017. Lifelong dietary intervention does not affect hematopoietic stem cell function. Exp. Hematol. 53:26–30. 10.1016/j.exphem.2017.06.002 [DOI] [PubMed] [Google Scholar]
- López-Otín, C., Blasco M.A., Partridge L., Serrano M., and Kroemer G.. 2013. The hallmarks of aging. Cell. 153:1194–1217. 10.1016/j.cell.2013.05.039 [DOI] [PMC free article] [PubMed] [Google Scholar]
- Luo, H., Mu W.C., Karki R., Chiang H.H., Mohrin M., Shin J.J., Ohkubo R., Ito K., Kanneganti T.D., and Chen D.. 2019. Mitochondrial stress-initiated aberrant activation of the NLRP3 inflammasome regulates the functional deterioration of hematopoietic stem cell aging. Cell Rep. 26:945–954.e4. 10.1016/j.celrep.2018.12.101 [DOI] [PMC free article] [PubMed] [Google Scholar]
- Maryanovich, M., Zahalka A.H., Pierce H., Pinho S., Nakahara F., Asada N., Wei Q., Wang X., Ciero P., Xu J., et al. 2018. Adrenergic nerve degeneration in bone marrow drives aging of the hematopoietic stem cell niche. Nat. Med. 24:782–791. 10.1038/s41591-018-0030-x [DOI] [PMC free article] [PubMed] [Google Scholar]
- Mercier, F.E., Sykes D.B., and Scadden D.T.. 2016. Single targeted exon mutation creates a true congenic mouse for competitive hematopoietic stem cell transplantation: the C57BL/6-CD45.1(STEM) mouse. Stem Cell Reports. 6:985–992. 10.1016/j.stemcr.2016.04.010 [DOI] [PMC free article] [PubMed] [Google Scholar]
- Mercken, E.M., Carboneau B.A., Krzysik-Walker S.M., and de Cabo R.. 2012. Of mice and men: the benefits of caloric restriction, exercise, and mimetics. Ageing Res. Rev. 11:390–398. 10.1016/j.arr.2011.11.005 [DOI] [PMC free article] [PubMed] [Google Scholar]
- Mohrin, M., Bourke E., Alexander D., Warr M.R., Barry-Holson K., Le Beau M.M., Morrison C.G., and Passegué E.. 2010. Hematopoietic stem cell quiescence promotes error-prone DNA repair and mutagenesis. Cell Stem Cell. 7:174–185. 10.1016/j.stem.2010.06.014 [DOI] [PMC free article] [PubMed] [Google Scholar]
- Mohrin, M., Shin J., Liu Y., Brown K., Luo H., Xi Y., Haynes C.M., and Chen D.. 2015. Stem cell aging. A mitochondrial UPR-mediated metabolic checkpoint regulates hematopoietic stem cell aging. Science. 347:1374–1377. 10.1126/science.aaa2361 [DOI] [PMC free article] [PubMed] [Google Scholar]
- Niccoli, T., and Partridge L.. 2012. Ageing as a risk factor for disease. Curr. Biol. 22:R741–R752. 10.1016/j.cub.2012.07.024 [DOI] [PubMed] [Google Scholar]
- Olson, O.C., Kang Y.A., and Passegué E.. 2020. Normal hematopoiesis is a balancing act of self-renewal and regeneration. Cold Spring Harb. Perspect. Med. 10:a035519. 10.1101/cshperspect.a035519 [DOI] [PMC free article] [PubMed] [Google Scholar]
- Orford, K.W., and Scadden D.T.. 2008. Deconstructing stem cell self-renewal: genetic insights into cell-cycle regulation. Nat. Rev. Genet. 9:115–128. 10.1038/nrg2269 [DOI] [PubMed] [Google Scholar]
- Osorio, F.G., Navarro C.L., Cadiñanos J., López-Mejía I.C., Quirós P.M., Bartoli C., Rivera J., Tazi J., Guzmán G., Varela I., et al. 2011. Splicing-directed therapy in a new mouse model of human accelerated aging. Sci. Transl. Med. 3:106ra107. 10.1126/scitranslmed.3002847 [DOI] [PubMed] [Google Scholar]
- Pfau, S.J., Silberman R.E., Knouse K.A., and Amon A.. 2016. Aneuploidy impairs hematopoietic stem cell fitness and is selected against in regenerating tissues in vivo. Genes Dev. 30:1395–1408. 10.1101/gad.278820.116 [DOI] [PMC free article] [PubMed] [Google Scholar]
- Pietras, E.M., Reynaud D., Kang Y.A., Carlin D., Calero-Nieto F.J., Leavitt A.D., Stuart J.M., Göttgens B., and Passegué E.. 2015. Functionally distinct subsets of lineage-biased multipotent progenitors control blood production in normal and regenerative conditions. Cell Stem Cell. 17:35–46. 10.1016/j.stem.2015.05.003 [DOI] [PMC free article] [PubMed] [Google Scholar]
- Poulos, M.G., Ramalingam P., Gutkin M.C., Llanos P., Gilleran K., Rabbany S.Y., and Butler J.M.. 2017. Endothelial transplantation rejuvenates aged hematopoietic stem cell function. J. Clin. Invest. 127:4163–4178. 10.1172/JCI93940 [DOI] [PMC free article] [PubMed] [Google Scholar]
- Rando, T.A. 2006. Stem cells, ageing and the quest for immortality. Nature. 441:1080–1086. 10.1038/nature04958 [DOI] [PubMed] [Google Scholar]
- Rebo, J., Mehdipour M., Gathwala R., Causey K., Liu Y., Conboy M.J., and Conboy I.M.. 2016. A single heterochronic blood exchange reveals rapid inhibition of multiple tissues by old blood. Nat. Commun. 7:13363. 10.1038/ncomms13363 [DOI] [PMC free article] [PubMed] [Google Scholar]
- Rossi, D.J., Bryder D., Seita J., Nussenzweig A., Hoeijmakers J., and Weissman I.L.. 2007. Deficiencies in DNA damage repair limit the function of haematopoietic stem cells with age. Nature. 447:725–729. 10.1038/nature05862 [DOI] [PubMed] [Google Scholar]
- Rossi, D.J., Jamieson C.H.M., and Weissman I.L.. 2008. Stems cells and the pathways to aging and cancer. Cell. 132:681–696. 10.1016/j.cell.2008.01.036 [DOI] [PubMed] [Google Scholar]
- Satoh, Y., Yokota T., Sudo T., Kondo M., Lai A., Kincade P.W., Kouro T., Iida R., Kokame K., Miyata T., et al. 2013. The Satb1 protein directs hematopoietic stem cell differentiation toward lymphoid lineages. Immunity. 38:1105–1115. 10.1016/j.immuni.2013.05.014 [DOI] [PMC free article] [PubMed] [Google Scholar]
- Schepers, K., Pietras E.M., Reynaud D., Flach J., Binnewies M., Garg T., Wagers A.J., Hsiao E.C., and Passegué E.. 2013. Myeloproliferative neoplasia remodels the endosteal bone marrow niche into a self-reinforcing leukemic niche. Cell Stem Cell. 13:285–299. 10.1016/j.stem.2013.06.009 [DOI] [PMC free article] [PubMed] [Google Scholar]
- Sinha, M., Jang Y.C., Oh J., Khong D., Wu E.Y., Manohar R., Miller C., Regalado S.G., Loffredo F.S., Pancoast J.R., et al. 2014. Restoring systemic GDF11 levels reverses age-related dysfunction in mouse skeletal muscle. Science. 344:649–652. 10.1126/science.1251152 [DOI] [PMC free article] [PubMed] [Google Scholar]
- Smith, L.K., Verovskaya E., Bieri G., Horowitz A.M., von Ungern-Sternberg S.N.I., Lin K., Seizer P., Passegué E., and Villeda S.A.. 2020. The aged hematopoietic system promotes hippocampal-dependent cognitive decline. Aging Cell. 19:e13192. 10.1111/acel.13192 [DOI] [PMC free article] [PubMed] [Google Scholar]
- Sousa-Victor, P., Gutarra S., García-Prat L., Rodriguez-Ubreva J., Ortet L., Ruiz-Bonilla V., Jardí M., Ballestar E., González S., Serrano A.L., et al. 2014. Geriatric muscle stem cells switch reversible quiescence into senescence. Nature. 506:316–321. 10.1038/nature13013 [DOI] [PubMed] [Google Scholar]
- Stewart, M.H., Gutierrez-Martinez P., Beerman I., Garrison B., Gallagher E.J., LeRoith D., and Rossi D.J.. 2014. Growth hormone receptor signaling is dispensable for HSC function and aging. Blood. 124:3076–3080. 10.1182/blood-2014-05-575308 [DOI] [PMC free article] [PubMed] [Google Scholar]
- Sun, L.Y., Spong A., Swindell W.R., Fang Y., Hill C., Huber J.A., Boehm J.D., Westbrook R., Salvatori R., and Bartke A.. 2013. Growth hormone-releasing hormone disruption extends lifespan and regulates response to caloric restriction in mice. eLife. 2:e01098. 10.7554/eLife.01098 [DOI] [PMC free article] [PubMed] [Google Scholar]
- Sun, D., Luo M., Jeong M., Rodriguez B., Xia Z., Hannah R., Wang H., Le T., Faull K.F., Chen R., et al. 2014. Epigenomic profiling of young and aged HSCs reveals concerted changes during aging that reinforce self-renewal. Cell Stem Cell. 14:673–688. 10.1016/j.stem.2014.03.002 [DOI] [PMC free article] [PubMed] [Google Scholar]
- Tang, D., Tao S., Chen Z., Koliesnik I.O., Calmes P.G., Hoerr V., Han B., Gebert N., Zörnig M., Löffler B., et al. 2016. Dietary restriction improves repopulation but impairs lymphoid differentiation capacity of hematopoietic stem cells in early aging. J. Exp. Med. 213:535–553. 10.1084/jem.20151100 [DOI] [PMC free article] [PubMed] [Google Scholar]
- Thijssen, D.H., Vos J.B., Verseyden C., van Zonneveld A.J., Smits P., Sweep F.C., Hopman M.T., and de Boer H.C.. 2006. Haematopoietic stem cells and endothelial progenitor cells in healthy men: effect of aging and training. Aging Cell. 5:495–503. 10.1111/j.1474-9726.2006.00242.x [DOI] [PubMed] [Google Scholar]
- Tran, J.R., Chen H., Zheng X., and Zheng Y.. 2016. Lamin in inflammation and aging. Curr. Opin. Cell Biol. 40:124–130. 10.1016/j.ceb.2016.03.004 [DOI] [PMC free article] [PubMed] [Google Scholar]
- Valletta, S., Thomas A., Meng Y., Ren X., Drissen R., Sengül H., Di Genua C., and Nerlov C.. 2020. Micro-environmental sensing by bone marrow stroma identifies IL-6 and TGFβ1 as regulators of hematopoietic ageing. Nat. Commun. 11:4075. 10.1038/s41467-020-17942-7 [DOI] [PMC free article] [PubMed] [Google Scholar]
- Verovskaya, E.V., Dellorusso P.V., and Passegué E.. 2019. Losing sense of self and surroundings: hematopoietic stem cell aging and leukemic transformation. Trends Mol. Med. 25:494–515. 10.1016/j.molmed.2019.04.006 [DOI] [PMC free article] [PubMed] [Google Scholar]
- Villeda, S.A., Luo J., Mosher K.I., Zou B., Britschgi M., Bieri G., Stan T.M., Fainberg N., Ding Z., Eggel A., et al. 2011. The ageing systemic milieu negatively regulates neurogenesis and cognitive function. Nature. 477:90–94. 10.1038/nature10357 [DOI] [PMC free article] [PubMed] [Google Scholar]
- Villeda, S.A., Plambeck K.E., Middeldorp J., Castellano J.M., Mosher K.I., Luo J., Smith L.K., Bieri G., Lin K., Berdnik D., et al. 2014. Young blood reverses age-related impairments in cognitive function and synaptic plasticity in mice. Nat. Med. 20:659–663. 10.1038/nm.3569 [DOI] [PMC free article] [PubMed] [Google Scholar]
- Wilkinson, A.C., Ishida R., Kikuchi M., Sudo K., Morita M., Crisostomo R.V., Yamamoto R., Loh K.M., Nakamura Y., Watanabe M., et al. 2019. Long-term ex vivo haematopoietic-stem-cell expansion allows nonconditioned transplantation. Nature. 571:117–121. 10.1038/s41586-019-1244-x [DOI] [PMC free article] [PubMed] [Google Scholar]
- Wu, C.W., Chang Y.T., Yu L., Chen H.I., Jen C.J., Wu S.Y., Lo C.P., and Kuo Y.M.. 2008. Exercise enhances the proliferation of neural stem cells and neurite growth and survival of neuronal progenitor cells in dentate gyrus of middle-aged mice. J Appl Physiol (1985). 105:1585–1594. 10.1152/japplphysiol.90775.2008 [DOI] [PubMed] [Google Scholar]
Associated Data
This section collects any data citations, data availability statements, or supplementary materials included in this article.
Data Availability Statement
Datasets that support the findings of this study have been deposited in the Gene Expression Omnibus under accession no. GSE134417 for RNA sequencing files and GSE151665 for ATAC-seq files. All other data are available from the corresponding author upon reasonable request.


