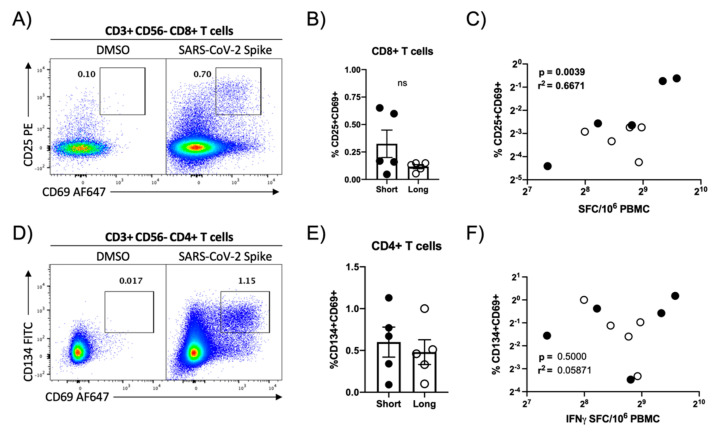
Figure 3.
Flow cytometric quantification of SARS-CoV-2 spike protein-specific cellular immunity. (A) Representative flow cytometry plot demonstrating CD25 and CD69 upregulation in CD8+ T cells following in vitro SARS-CoV-2 spike protein peptide pool stimulation. (B) Magnitude of SARS-CoV-2 spike-specific CD8+ T cell responsiveness in select study participants split by duration of self-reported duration of COVID-19 symptoms. Plotted values are background subtracted from a total of 10 subjects. (C) Correlation analysis of SARS-CoV-2-specific cellular immunity as defined by CD8+ flow cytometry and IFN-γ ELISPOT. r2 and p value calculated by 2-tailed Pearson Correlation test. (D) Representative flow cytometry plot demonstrating CD134 and CD69 upregulation in CD4+ T cells following SARS-CoV-2 spike protein peptide pool stimulation. (E) Magnitude of SARS-CoV-2 spike-specific CD4+ T cell immunity in select study participants split by duration of self-reported duration of COVID-19 symptoms. Plotted values are background subtracted from a total of 10 subjects. (F) Correlation analysis of SARS-CoV-2-specific cellular immunity as defined by CD4+ flow cytometry and IFN-γ ELISPOT. r2 and p value calculated by 2-tailed Pearson correlation test.

