Abstract
Precise measurement of particulate matter (PM) on skin is important for managing and preventing PM-related skin diseases. This study aims to directly visualize the deposition and penetration of PM into human skin using a multimodal nonlinear optical (MNLO) imaging system. We successfully obtained PM particle signals by merging two different sources, C–C vibrational frequency and autofluorescence, while simultaneously visualizing the anatomical features of the skin via keratin, collagen, and elastin. As a result, we found morphologically dependent PM deposition, as well as increased deposition following disruption of the skin barrier via tape-stripping. Furthermore, PM penetrated more and deeper into the skin with an increase in the number of tape-strippings, causing a significant increase in the secretion of pro-inflammatory cytokines. Our results suggest that MNLO imaging could be a useful technique for visualizing and quantifying the spatial distribution of PM in ex vivo human skin tissues.
Keywords: particulate matter, nonlinear optical imaging, spatial analysis, human skin
1. Introduction
High levels of ambient particulate matter (PM) in pollutants due to industrialization and urbanization have been associated with outbreaks of human diseases. A complex mixture of solid and liquid particles, PM contains nitrates, sulfates, hydrocarbons, benzene, toluene, metals, and other substances, and is classified by size as coarse (mean diameter <10 μm), fine (PM2.5, mean diameter <2.5 μm), and ultrafine (mean diameter <0.1 μm). PM has been reported to cause various health problems, including respiratory disease, cardiovascular diseases such as hypertension, and neurotoxicity [1,2,3,4]. Moreover, long-term exposure to PM has been shown to effect a decrease in life expectancy [5].
Particulate matter also exerts detrimental effects on human skin by inducing the acceleration of inflammatory skin diseases such as atopic dermatitis, acne, and psoriasis [6,7,8]. Additionally, chronic PM exposure is associated with extrinsic skin aging and an increase in wrinkles and pigment spots [9]. However, it should be noted that these previous reports are epidemiologic studies. Cell-based experiments, on the other hand, have revealed that PM2.5 significantly alters the expression of genes related to epidermal development, differentiation, and inflammation in normal human epidermal keratinocytes [10]. In addition, benzo(a)pyrene (BaP), a type of polycyclic aromatic hydrocarbon (PAH) in PM, enhances oxidative stress-mediated inflammatory cytokines in human keratinocytes [11]. Due to the limitations of in vitro systems, though, PM effects need to be understood in a spatial environment.
In terms of skin penetration, while a number of studies have observed PM in various epidermal layers, details about the process of PM penetration into the stratum corneum (SC), which is the first interface between the human body and its environment, have yet to be explored. Generally, percutaneous penetration of PM-like microparticles is related to various factors such as age, the integrity of the skin barrier, and the anatomic site [12]. As for the penetration pathway, two previous studies have reported that microparticles can penetrate skin through the hair transfollicular route [13,14]. Techniques to study PM penetration traditionally include transmission electron microscopy (TEM), which has been used to show penetration into the barrier-disrupted epidermis of mice [15], as well as energy dispersive X-ray spectroscopy (EDS) and Raman spectroscopy, which have been applied to visualize the spatial distributions of PM [16,17,18]. However, such approaches are insufficient to directly visualize and precisely quantify the accumulation of PM.
Nonlinear optics (NLO) is a useful technique that in principle enables the imaging of a non-labeled target biomolecule in terms of its molecular structures via atomic vibrations [19]. We have previously developed the multimodal nonlinear optical (MNLO) imaging system, which combines coherent anti-Stokes Raman scattering (CARS), second harmonic generation (SHG), and two-photon excitation fluorescence (TPEF), and have applied it to various label-free ex vivo investigations [20,21,22]. The primary advantage of the MNLO system is that it provides for the simultaneous visualization of the target molecule as well as the features of the tissue sample; CARS is in charge of molecular structure-specific visualization, while SHG and TPEF provide extracellular matrix information.
In the present study, we postulate that PM penetrates deeper into damaged skin, consequently accelerating human skin diseases. To verify the penetration of PM, we employ our developed MNLO system based on the inherent molecular structures of PM and the skin. This study is performed on human skin biopsy samples using collected airborne PM2.5. We obtain precise spatial information of the PM from en face three-dimensional (3D) MNLO images, with which we can consider the effect of skin damage on the level of PM penetration. We additionally measure inflammatory responses and find that they are increased in damaged skin containing infiltrated PM. Thus, with direct evidence visualizing both deposited and penetrated PM, the results of this work support the hypothesis that damaged skin is more sensitive to PM exposure, which could eventually lead to worsened skin diseases or other conditions.
2. Results
2.1. Demonstration of MNLO Imaging of Airborne PM2.5
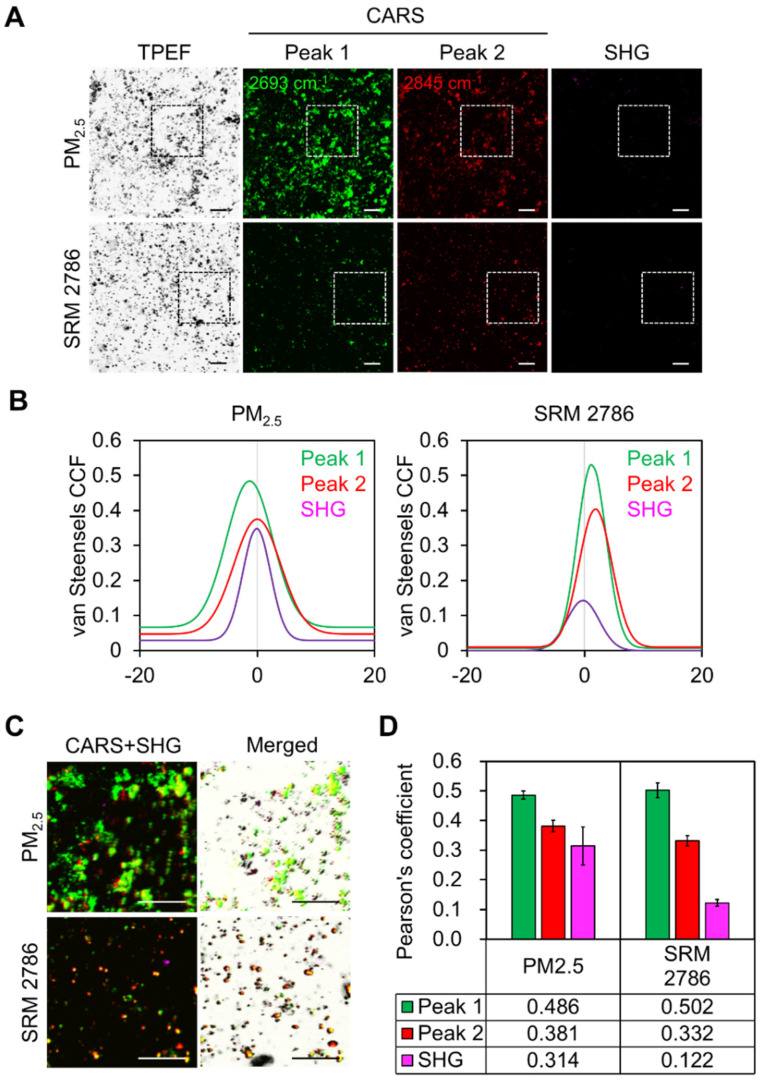
To demonstrate the MNLO imaging of PM2.5, we optimized the wavelengths of the lasers in CARS based on its molecular vibrational characteristics. Since PM2.5 is a complex mixture of carbonaceous materials [23], two wavelengths (peak 1 and peak 2) were assigned for the C–C and C–H vibrational modes at ~2693 ± 20 cm−1 and at ~2840 ± 20 cm−1, respectively. We interpret that CARS peak 1 corresponds to the two-dimensional (2D) band of Raman spectra in carbon nanotubes [24,25] and that CARS peak 2 indicates the C–H vibrational mode that is expected to produce a strong signal when carbon complexes such as PAHs are hydrated. The airborne PM2.5 was validated with the standard reference material (SRM) 2786 from NIST via MNLO imaging. As shown in Figure 1A, strong intensities were measured at peaks 1 and 2, indicating C–C and C–H molecular bonding enrichment in airborne PM2.5 and SRM 2786. Along with CARS in MNLO, TPEF also showed a high intensity of both PM sources resulting from the fluorescence of PAHs. To confirm the reliability of the multimode signals from the PM sources, we analyzed the pixel colocalization of all images using van Steensel’s cross-correlation of PM [26]. As shown in Figure 1B, two peaks of CARS and SHG are highly overlapped with TPEF, indicating an identical source. Furthermore, MNLO imaging is capable of sensitively detecting the multiple components of the diverse mixture conditions of PM, as shown in Figure 1C,D. Therefore, we conducted all MNLO imaging in this work using peaks 1 and 2 of CARS and SHG. In the subsequent experiments, the airborne collected PM2.5 (hereafter, PM2.5) was used in our investigations with human skin biopsy samples.
Figure 1.
Characterization of PM2.5 and optimization of MNLO imaging. (A) MNLO images of airborne-collected PM2.5 and SRM 2786. Images from TPEF (dark gray), SHG (magenta), and CARS (green and red) were obtained from the same region. Two wavelengths (peak 1 and peak 2) of CARS were assigned as the C–C and C–H vibrational modes at ~2693 ± 20 cm−1 and at ~2840 ± 20 cm−1, respectively. The square indicated by the dotted line indicates the enlarged images of ROI in (C). Scale bars, 20 μm. (B) Overlap of the two CARS signals or the SHG signal by van Steensel’s CCF based on the TPEF signal f0rom PM2.5 and SRM 2786. (C) Enlarged images of the CARS (peak 1 and peak 2), the SHG, and the TPEF of the ROIs shown in (A). Scale bars, 20 μm. (D) Pearson’s coefficient analysis of the CARS (peak 1 and peak 2) and the SHG based on the TPEF signal from PM2.5 and SRM 2786.
2.2. Label-Free Visualization of PM2.5 on Human Skin by En Face MNLO 3D Imaging: The Necessity of CARS for Discriminating PM from Skin Autofluorescence
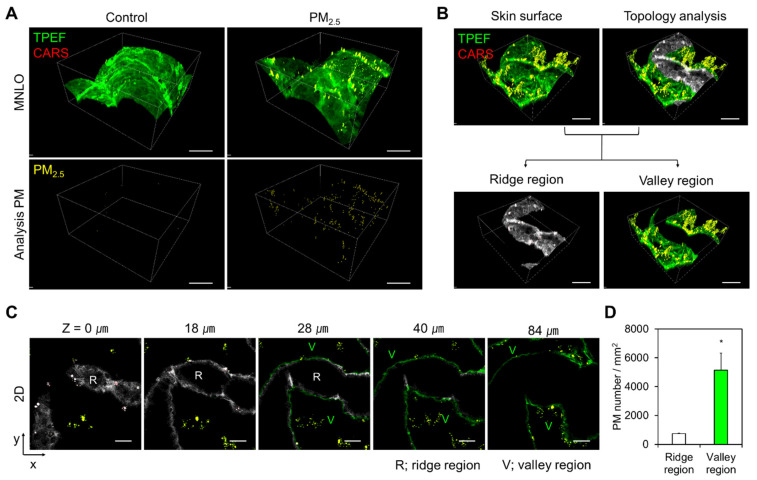
To fully apply the advantages of MNLO imaging, we first assigned the CARS modality for the molecular features of the PM2.5, as explained above, and then utilized the TPEF and SHG modalities for elastin and collagen, respectively, for the simultaneous analysis of skin anatomy. To do this, human skin biopsy samples were exposed to PM2.5 for 24 h, and then en face 3D imaging was conducted without pretreatment processes. Figure 2A and Supplementary Video S1 show representative en face MNLO 3D imaging results with a volume of 420 (x) × 420 (y) × 200 (z) μm3. The hexagonal structure of the SC was imaged using the autofluorescence of keratin by TPEF. To identify the source of the fluorescence signal from PM2.5, we investigated whether PAHs, as a main component of PM2.5 [27], generate fluorescence signals. As shown in Supplementary Figure S1, PAHs were imaged in small particle form, displaying both autofluorescence with a wavelength of 495–540 nm by TPEF and a C–C vibrational signal at 2693 cm−1 by CARS. Given this, we assumed that a substantial amount of the TPEF imaging signals from PM2.5 derive from PAHs. To distinguish the autofluorescence signals from the skin and from the PM2.5, it is necessary to detect the specific molecular vibrations of the PAHs via CARS. As shown in the lower panels of Figure 2A, PM2.5 on the skin surface needs to be visualized by both CARS and TPEF.
Figure 2.
En face MNLO 3D imaging of PM2.5 in human skin biopsy samples. (A) En face MNLO images of the label-free stratum corneum (TPEF, green) and PM2.5 (CARS, red in the upper panels and yellow in the lower panels) in human skin biopsy samples after PM2.5 exposure. Consecutive en face MNLO image slices were reconstructed in 3D. The measurement volume was 420 (x) × 420 (y) × 200 (z) μm3. Scale bars, 100 μm. (B) Topological analysis of the en face MNLO 3D images. Ridge and valley regions of the skin microrelief are indicated in gray and green, respectively. Scale bars, 100 μm. (C) En face MNLO image slices from indicated z-depths after topological analysis. Scale bars, 60 μm. (D) Number of PM2.5 particles in the ridge and valley regions of the skin microrelief (mean ± S.E.M., * p < 0.05; two-tailed Student’s t-test).
2.3. Wide-View 3D MNLO Imaging of PM2.5 on Skin Showing Morphological Dependency
To demonstrate topological analysis, we performed wide-view 3D MNLO imaging of human skin samples and found a topological tendency for PM2.5 to deposit more in the valleys of the skin microrelief than on the ridges [28]. As shown in Figure 2B, we divided the 3D-rendered MNLO images of the skin surface into ridge (gray) and valley (green) regions based on the morphology of the skin microrelief. The two regions were divided at a z-depth of approximately 30 μm, as shown in Figure 2C. According to the quantification results for each region in Figure 2D, PM2.5 was predominantly deposited in the valleys compared with the ridges. This result indicates that MNLO imaging-based PM2.5 analysis could be useful to more precisely measure PM2.5 in a z-depth manner.
2.4. Volumetric Quantification of PM2.5 Deposition between Healthy and Damaged Skin
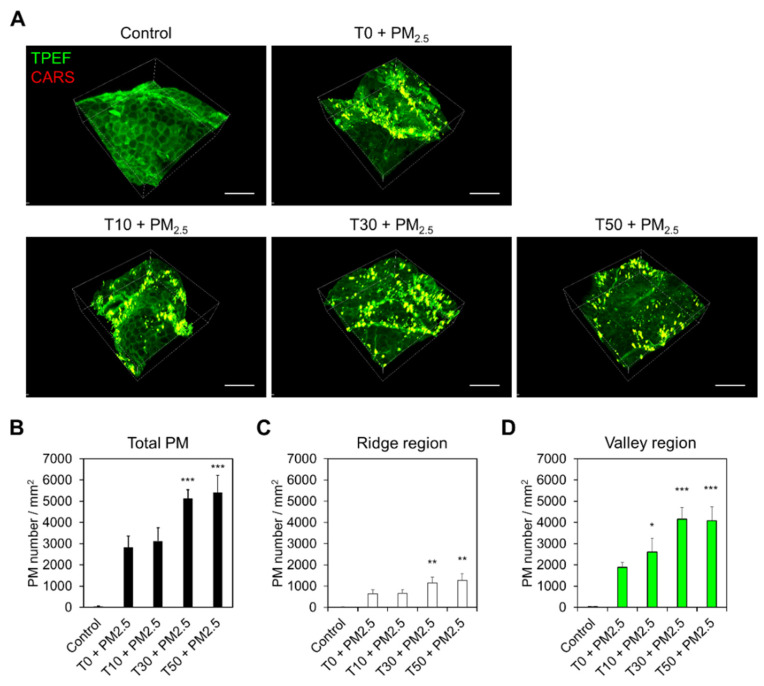
Employing 3D MNLO imaging, we quantitatively analyzed the deposition of PM2.5 on damaged compared to healthy skin. The tape-stripping (T) method was applied to human skin biopsy samples in order to disrupt the skin barrier function of the SC [29]. The level of damage was controlled by the number of strippings; in this work, 0, 10, 30, and 50 strippings were applied (T0, T10, T30, and T50, respectively) prior to exposure to PM2.5. Representative images in Figure 3A show the results of visualizing human skin with deposited PM2.5 using en face MNLO 3D imaging. In the quantitative analysis in Figure 3B–D, the deposition of PM2.5 in the T30 sample was significantly increased (by approximately two-fold) compared to T0 and T10. Interestingly, as the number of strippings increased, not only did the total amount of PM2.5 deposition increase, but the proportion of deposition in the valley regions increased as well.
Figure 3.
Visualization of PM2.5 deposition on the skin surface by skin barrier disruption. (A) En face MNLO 3D images of the label-free stratum corneum (TPEF, green) and PM2.5 (CARS, red) in PM2.5-exposed human skin biopsy samples after tape-stripping (T). T10, T30, and T50 indicate strippings of 10, 30, and 50 times, respectively. Scale bars, 100 μm. (B–D) Number of PM2.5 particles on the skin surface, ridge, and valley regions by the number of tape-strippings (mean ± S.E.M., * p < 0.05, ** p < 0.01, *** p < 0.001; two-tailed Student’s t-test).
2.5. Percutaneous Penetration of PM2.5 Deepens with Severe Skin Damage
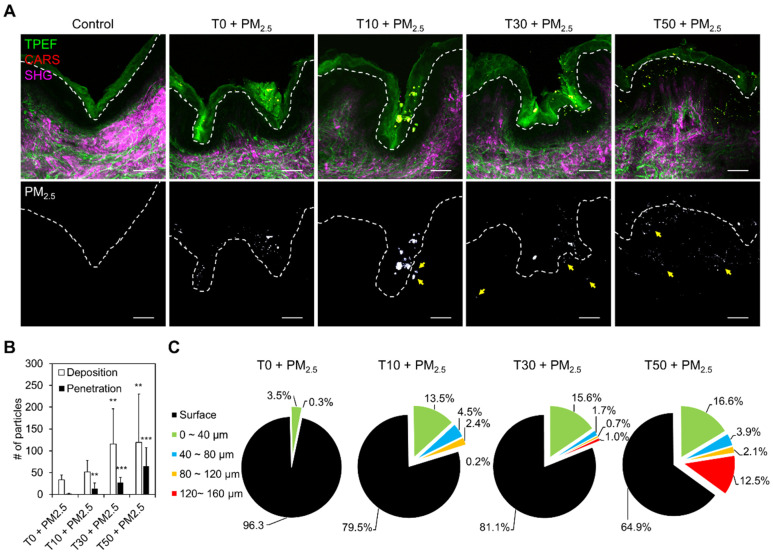
To investigate the percutaneous penetration of PM2.5, we performed cross-sectional MNLO imaging on human skin samples considering the same levels of skin damage as in the previous section. As shown in Figure 4A and Supplementary Video S2, TPEF (green) and SHG (magenta) signals highlight the anatomy of the skin without any staining method; TPEF signals indicate keratin in the SC and elastin in the connective tissue, while SHG indicates collagen in the connective tissue. To clearly visualize penetrated PM2.5, CARS intensity is shown in the black/white scale with dotted lines that divide the SC and the stratum spinosum (SS) in the lower panels of Figure 4A. In the quantitative analysis, the region above the dotted line, or SC, was regarded as PM2.5 deposition, and the region below, or SS, was counted as penetration. Like the previous en face analysis, deposition significantly increased as the number of strippings increased from T30 to T50 (white bar in Figure 4B). However, even at T10, the penetration of PM2.5 could already be visualized (black bar in Figure 4B). This percutaneous penetration was further investigated in terms of the depth from the top of the SS measured in 40 μm sections (Figure 4C). At a shallow depth (<40 μm z-depth), PM2.5 penetration was maintained regardless of the level of skin damage. Remarkably, in the most severely damaged sample, T50, a substantial percentage of PM2.5 penetrated to a depth of 120–160 μm, as shown in red in Figure 4C.
Figure 4.
Analysis of PM2.5 penetration by skin barrier disruption. (A) MNLO images of label-free elastin and keratin (TPEF, green), PM2.5 (CARS, red), and collagen (SHG, magenta) in cross-sectioned PM2.5-exposed human skin biopsy samples after tape-stripping (T). The dashed lines mark the boundary between the stratum corneum and the stratum spinosum. Scale bars, 60 μm. (B) Number of PM2.5 particles deposited or penetrated in the cross-sectioned samples (mean ± S.E.M., ** p < 0.01, *** p < 0.001; two-tailed Student’s t-test). (C) PM2.5 penetration depths by number of strippings, from measuring the distance between the penetrated PM2.5 and the dashed lines.
2.6. Increased Inflammatory Gene Expression Induced by PM2.5 Exposure with Skin Barrier Disruption
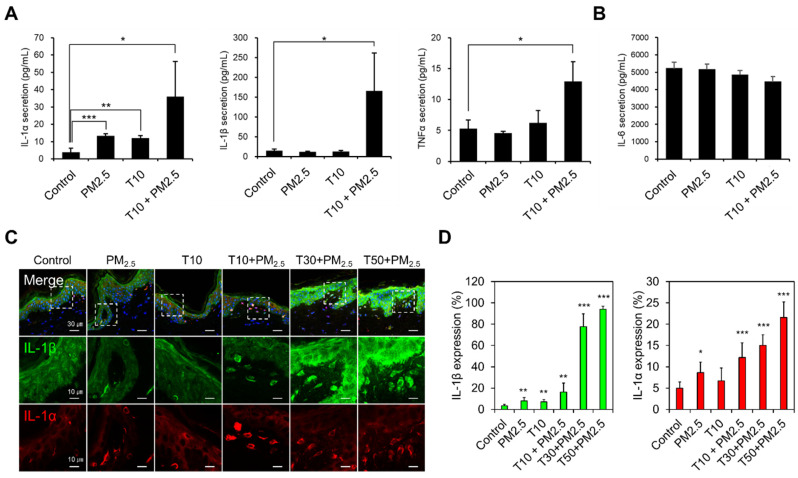
PM has been reported to cause oxidative stress and inflammatory response in skin [30]. To further examine the biological responses of penetrated PM2.5, we performed ELISA and immunofluorescence staining of ex vivo human skin tissue considering damage (T10) and PM2.5 exposure. First, several cytokines secreted to the culture medium were measured by ELISA. In both PM2.5-treated and non-damaged skin (control), IL-1α was increased, while IL-1β and TNF-α were unchanged. However, in T10-damaged skin, IL-1α, IL-1β, and TNF-α were significantly increased (Figure 5A). IL-6 was not changed by either PM2.5 exposure or T10 (Figure 5B). To confirm the inflammatory responses induced by penetrated PM2.5, expression of the cytokines inside the tissue was confirmed by immunofluorescence staining. Results show that IL-1α- and IL-1β-positive cells were found underneath the SC in PM2.5-treated T10, T30, and T50 (Figure 5C). In PM2.5-treated T30 and T50, IL-1β-positive cells increased significantly compared to PM2.5-treated T10, but IL-1α-positive cells did not (Figure 5D). This prominent change in IL-1β is expected as a result of overlapping effects of skin damage and PM exposure, suggesting that IL-1β is a cytokine that leads to an inflammatory response. Such results indicate that PM2.5 exposure may lead to increased inflammatory responses in damaged compared to healthy skin.
Figure 5.
Inflammatory response induced by PM2.5 exposure and skin barrier disruption. (A,B) Secreted cytokines (IL-1α, IL-1β, TNF-α, and IL-6) measured in culture medium by ELISA. (C) Confocal images of cross-sectioned PM2.5-exposed human skin biopsy samples after tape-stripping (T). IL-1β (green) and IL-1α (red) were stained with antibodies, and nuclei were counter-stained with DAPI (blue). The white dashed boxes in the merged images (upper row) are enlarged in the separated images (lower rows). Scale bars, 30 μm for the merged images and 10 μm for the enlarged images. (D) The cells with a high expression of IL-1β and IL-1α were quantified in each condition (mean ± S.E.M., * p < 0.05, ** p < 0.01, *** p < 0.001; two-tailed Student’s t-test).
3. Discussion
Even though the skin represents the largest organ with substantial direct contact to the atmosphere, measuring PM on the skin as a potential harmful factor has, to date, not been straightforward, and thus the toxicity of PM to the skin is not yet fully understood. Here, the principle of multimodal nonlinear optics was utilized for the direct 3D visualization of both adhesive and penetrated PM2.5 on human skin without labeling. Depending on the skin morphology, PM2.5 was differentially accumulated in the valleys and ridges of the skin microrelief. The application of MNLO was also able to demonstrate that damaged skin could be more susceptible to PM2.5 by deeper penetration toward the dermis compared to healthy skin.
Nonlinear optics such as TPEF and SHG has already been applied in dermatological studies, enabling deep optical imaging [31]. Both of these optical techniques are useful to provide skin morphological information, since autofluorescent biomolecules (keratin, melanin, elastin, etc.) can be imaged by TPEF and anisotropic fibrous molecules such as collagen can be visualized by SHG. Despite these advantages, nonlinear optics technologies have yet to be more widely expanded in dermatological research. In the case of TPEF, as endogenous fluorescent molecules can be imaged with exogenous target molecules, signal interferences need to be technically figured out. Likewise in our study, PM fluorescence needs to be selectively distinguished from autofluorescent biomolecules [32]. We therefore additionally installed CARS to detect the intrinsic molecular fingerprints of PM giving the Raman peaks, so that PM can be selectively imaged along with the morphological features of the skin without interference (Supplementary Figure S1) [24,25]. Unlike conventional Raman scattering mapping that takes several hours, CARS provides fast scanning in under 1 s, possibly opening the door to other applications.
To date, it has been taken for granted that PM infiltrates the skin through transfollicular routes, with no direct evidence for the morphologically dependent deposition and penetration of PM yet observed. Although PM penetration into skin was demonstrated by Jin et al. through TEM [15], such sectional views are limited to supporting a good conformational analysis of the skin. In our en face 3D MNLO imaging, we showed that PM2.5 significantly accumulated in the valley regions compared to the ridge regions of the skin microrelief (Figure 2). This morphological dependency might provide supporting evidence for PM2.5 infiltration through transfollicular routes.
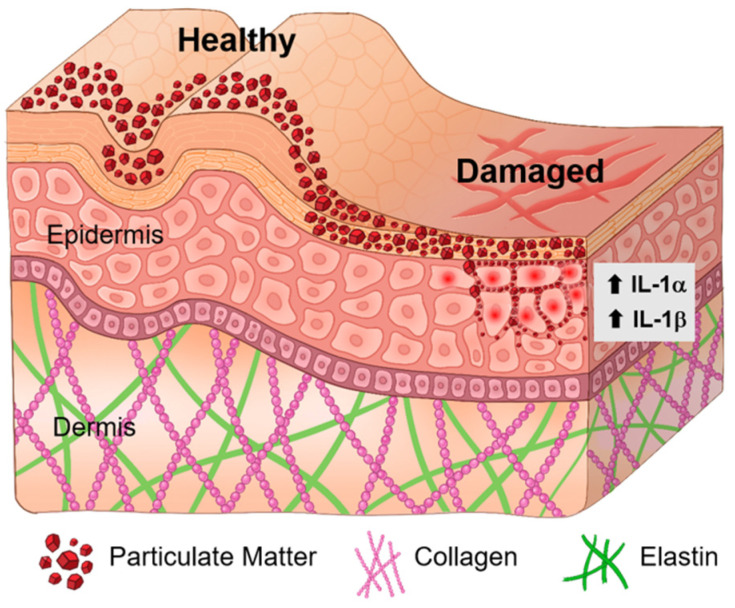
Skin conditions in which the skin barrier is compromised, such as atopic dermatitis, could be worsened by exogenous factors [33]. To investigate PM effects, we employed human skin biopsy samples ranging from healthy to severely damaged conditions by the tape-stripping technique. Since over 30 strippings remove about 30% of the epidermis [29], meaning the almost complete removal of the SC, we tested 10, 30, and 50 strippings for comparison with no stripping. The results showed the following distinctive characteristics. First, the total deposition of PM2.5 increased with the number of strippings from the loss of the SC (Figure 3). Although PM was treated under the same conditions, the accumulated amount of PM on the skin particularly increased in T30 and T50, implying that the SC might provide defensive physiological functions. Second, the amount of penetrated PM2.5 also increased with the number of strippings (Figure 4); however, a substantial amount (about 13–16%) was consistently detected at <40 μm depth in all tape-stripping samples. This depth could be an important inner border possibly generated by the increased cohesion between cells in deeper layers [34]. Remarkably, in the T50 sample, about 12.5% of the PM2.5 penetrated to a depth of 120–160 μm; since T50 represents severely damaged skin, this result implies that serious skin conditions may have an increased sensitivity to PM exposure. Third, the sizes of the individual infiltrated particles were relatively smaller than those by deposition. It is worth noting that the infiltrated PM2.5 accumulated along the line of the dermis layer. Although the penetration mechanism needs to be studied further, smaller-sized PM2.5 particles might more easily pass through the cohesive SS. To our knowledge, this is the first demonstration of the 3D spatial distribution of PM2.5 both deposited on and penetrated into healthy and damaged human skin. Overall results are summarized in a schematic diagram in Figure 6.
Figure 6.
Model of PM deposition and penetration in response to skin barrier damage. This diagram shows 3D spatial deposition and penetration of PM depending on skin barrier disruption. In healthy condition, the topology-dependent distribution of PM is identified. In damaged skin, a substantial amount of PM infiltrated in terms of skin barrier damage level. Inflammatory IL-1α- and IL-1β-positive cells were found underneath the SC in PM2.5-treated damaged skin.
4. Materials and Methods
4.1. PM2.5 Preparation and Analysis
PM2.5 was collected from the atmosphere at the rooftop of the Amorepacific Corporation R&D building located in Yongin, Republic of Korea (37°15′ N 127°06′ E) during January–April 2018. A high-volume air sampler (TE6070, Tisch Environmental, Cleves, OH, USA) was operated at a flow rate of 1.13 m3/min for 24 h and a polytetrafluoroethylene (PTFE) filter (Zefluor, Pall Corporation, Ann Arbor, MI, USA) was placed in front of the instrument to collect PM2.5. After extraction–sonication–evaporation, the extracted PM2.5 was resuspended in 20% EtOH and stored at –20 °C until use. SRM 2786 was purchased from Sigma Aldrich (St. Louis, MO, USA).
4.2. Human Skin Tissue and Exposure to PM2.5
Human skin explant NativeSkinTM models purchased from Genoskin (Toulouse, France) were collected from punch biopsies of non-sun-exposed skin of healthy donors. After plastic surgery, tape-stripping was performed, and then the tissues were embedded in a matrix and fixed in a cell culture insert. Informed consent was obtained from the donors and the experimental use of the skin biopsies was approved by the Comité de Protection des Personnes (CPP) in France and the ECU Human Research Ethics Committee. Eighteen NativeSkin models were separated into two groups (6 non-tape-stripping and 12 tape-stripping groups). The number of strippings was 10, 30, and 50 (n = 3 per group). NativeSkin models were cultured in a 5% CO2 incubator at 37 °C for 24 h. On days 0, 2, and 4, 6 µg/cm2 of PM2.5 in phosphate-buffered saline (PBS) was treated on the surface of the NativeSkin models. On day 6, the skin tissues were washed with PBS three times and then measured by MLNO microscopy.
4.3. Multimodal Nonlinear Optical (MNLO) Imaging
We applied our previously developed MNLO imaging method [20,21,22]. Briefly, we used two separate laser systems: a picosecond-pulsed laser system (pico-EMERALD; HighQ Laser, APE, Berlin, Germany) for CARS imaging, and a femtosecond-pulsed laser system (Chameleon Vision-S; Coherent Inc., Santa Clara, CA, USA) for TPEF imaging. To obtain CARS signals corresponding to Raman peaks 1 and 2 of PM2.5 and SRM 2786, we set the center wavelengths of the pump beam to 827 nm and 817 nm, respectively, and the center wavelength of the Stokes beam to 1064 nm. To obtain TPEF and SHG signals, we set the wavelength of the fs-pulsed laser to 810 nm. All images were obtained using FluoView software (FV10-ASW; Olympus Corp., Tokyo, Japan).
For en face 3D MNLO imaging, human skin biopsy samples were mounted with the stratum corneum (SC) region facing down on a coverglass-bottom chamber and then covered with a coverslip. z-depth images were obtained to measure depths of 0–150 μm. For side-view imaging, samples were cross-sectioned into 50 μm thick slices.
4.4. Enzyme-Linked Immunosorbent Assay for Pro-Inflammatory Cytokines
To measure pro-inflammatory cytokines, 6 µg/cm2 of PM2.5 in PBS was applied on the surface of the human skin explant models for 24 h, after which the tissue culture medium was harvested for enzyme-linked immunosorbent assay (ELISA). The secretion levels of the pro-inflammatory cytokines (IL-1α, IL-1β, TNFα, and IL-6) were measured using a Human Cytokine/Chemokine Magnetic Bead Panel (#HCYTOMAG-60K, Merck-Millipore, Burlington, MA, USA) according to the manufacturer’s instructions.
4.5. Immunofluorescence Imaging
For immunofluorescence imaging, cross-sectioned slices of human skin biopsy samples were fixed with 4% paraformaldehyde for 15 min. After washing three times with 1× PBS containing 0.1% Triton X-100 (Sigma Aldrich, St. Louis, MO, USA), the samples were permeated and blocked with a 1× PBS solution containing 5% normal horse serum and 0.5% Triton X-100 for an additional 90 min. IL-1α (MAB200, R&D Systems, Minneapolis, MN, USA) and IL-1β (ab9722, Abcam, Cambridge, MA, USA) antibodies were incubated with the samples overnight at 4 °C. After washing three times with 1× PBS containing 0.1% Triton X-100, secondary antibodies conjugated with Alexa Fluor 488 (A21206; Thermo Fisher Scientific, Waltham, MA, USA) and Alexa Fluor 594 (A11007; Thermo Fisher Scientific, Waltham, MA, USA) were incubated with the samples for 60 min at room temperature. Counter-staining was performed with 1 μg/mL DAPI for 3 min at room temperature. Images were obtained using confocal microscopy (FV3000, Olympus Corp., Tokyo, Japan).
5. Conclusions
We have developed a suitable methodology for human dermatological investigations using MNLO imaging. We point out the strength of this system is that it can cover investigations of not only PM but also other factors by assigning the given molecular specificities simultaneously with the anatomical information of the skin. The results may help to identify the effects of various factors on human skin, which will benefit the development of therapeutic interventions in the future.
Supplementary Materials
The following are available online at https://www.mdpi.com/article/10.3390/ijms22105199/s1: Supplementary Figure S1: En face MNLO imaging of human skin biopsy samples treated with PAH, Supplementary Video S1: Visualization of PM2.5 in human skin by en face 3D MNLO imaging, Supplementary Video S2: Visualization and analysis of PM2.5 penetration into human skin by MNLO imaging.
Author Contributions
E.-S.L. and S.K. designed the study. S.-W.L. set up the MNLO imaging system, and E.-S.L., S.K., and S.H.L. performed the MNLO experiments with human skin biopsy samples. H.-W.N. prepared the PM. J.J. analyzed the PM and discussed the analyzing methods. H.-J.K., Y.D.H., W.S.P., T.G.L., D.-G.J., and S.-H.K. supervised the research. All authors contributed to the writing and editing of the manuscript. All authors have read and agreed to the published version of the manuscript.
Funding
This research was supported by the Development of Measurement Standards and Technology for Biomaterials and Medical Convergence project funded by the Korea Research Institute of Standards and Science (KRISS-2021-GP2021-0004), the Nano Material Technology Development Program (2016M3A7B6908929) of the National Research Foundation (NRF) funded by the Ministry of Science and ICT, and the AMOREPACIFIC CORPORATION.
Data Availability Statement
Not applicable.
Conflicts of Interest
The authors declare no conflict of interest.
Footnotes
Publisher’s Note: MDPI stays neutral with regard to jurisdictional claims in published maps and institutional affiliations.
References
- 1.Wang T., Moreno-Vinasco L., Huang Y., Lang G.D., Linares J.D., Goonewardena S.N., Grabavoy A., Samet J.M., Geyh A.S., Breysse P.N., et al. Murine lung responses to ambient particulate matter: Genomic analysis and influence on airway hyperresponsiveness. Environ. Health Perspect. 2008;116:1500–1508. doi: 10.1289/ehp.11229. [DOI] [PMC free article] [PubMed] [Google Scholar]
- 2.Wang T., Wang L., Moreno-Vinasco L., Lang G.D., Siegler J.H., Mathew B., Usatyuk P.V., Samet J.M., Geyh A.S., Breysse P.N., et al. Particulate matter air pollution disrupts endothelial cell barrier via calpain-mediated tight junction protein degradation. Part. Fibre Toxicol. 2012;9:35. doi: 10.1186/1743-8977-9-35. [DOI] [PMC free article] [PubMed] [Google Scholar]
- 3.Gillespie P., Tajuba J., Lippmann M., Chen L.C., Veronesi B. Particulate matter neurotoxicity in culture is size-dependent. Neurotoxicology. 2013;36:112–117. doi: 10.1016/j.neuro.2011.10.006. [DOI] [PMC free article] [PubMed] [Google Scholar]
- 4.Chen H., Burnett R.T., Kwong J.C., Villeneuve P.J., Goldberg M.S., Brook R.D., van Donkelaar A., Jerrett M., Martin R.V., Kopp A., et al. Spatial association between ambient fine particulate matter and incident hypertension. Circulation. 2014;129:562–569. doi: 10.1161/CIRCULATIONAHA.113.003532. [DOI] [PubMed] [Google Scholar]
- 5.Brook R.D., Rajagopalan S., Pope C.A., 3rd, Brook J.R., Bhatnagar A., Diez-Roux A.V., Holguin F., Hong Y., Luepker R.V., Mittleman M.A., et al. Particulate matter air pollution and cardiovascular disease: An update to the scientific statement from the American Heart Association. Circulation. 2010;121:2331–2378. doi: 10.1161/CIR.0b013e3181dbece1. [DOI] [PubMed] [Google Scholar]
- 6.Ahn K. The role of air pollutants in atopic dermatitis. J. Allergy Clin. Immunol. 2014;134:993–999. doi: 10.1016/j.jaci.2014.09.023. [DOI] [PubMed] [Google Scholar]
- 7.Magnani N.D., Muresan X.M., Belmonte G., Cervellati F., Sticozzi C., Pecorelli A., Miracco C., Marchini T., Evelson P., Valacchi G. Skin Damage Mechanisms Related to Airborne Particulate Matter Exposure. Toxicol. Sci. 2016;149:227–236. doi: 10.1093/toxsci/kfv230. [DOI] [PubMed] [Google Scholar]
- 8.Liu W., Pan X., Vierkotter A., Guo Q., Wang X., Wang Q., Seite S., Moyal D., Schikowski T., Krutmann J. A Time-Series Study of the Effect of Air Pollution on Outpatient Visits for Acne Vulgaris in Beijing. Skin Pharmacol. Physiol. 2018;31:107–113. doi: 10.1159/000484482. [DOI] [PubMed] [Google Scholar]
- 9.Vierkotter A., Schikowski T., Ranft U., Sugiri D., Matsui M., Kramer U., Krutmann J. Airborne particle exposure and extrinsic skin aging. J. Investig. Dermatol. 2010;130:2719–2726. doi: 10.1038/jid.2010.204. [DOI] [PubMed] [Google Scholar]
- 10.Kim H.J., Bae I.H., Son E.D., Park J., Cha N., Na H.W., Jung C., Go Y.S., Kim D.Y., Lee T.R., et al. Transcriptome analysis of airborne PM2.5-induced detrimental effects on human keratinocytes. Toxicol. Lett. 2017;273:26–35. doi: 10.1016/j.toxlet.2017.03.010. [DOI] [PubMed] [Google Scholar]
- 11.Tsuji G., Takahara M., Uchi H., Takeuchi S., Mitoma C., Moroi Y., Furue M. An environmental contaminant, benzo(a)pyrene, induces oxidative stress-mediated interleukin-8 production in human keratinocytes via the aryl hydrocarbon receptor signaling pathway. J. Dermatol. Sci. 2011;62:42–49. doi: 10.1016/j.jdermsci.2010.10.017. [DOI] [PubMed] [Google Scholar]
- 12.Kim K.E., Cho D., Park H.J. Air pollution and skin diseases: Adverse effects of airborne particulate matter on various skin diseases. Life Sci. 2016;152:126–134. doi: 10.1016/j.lfs.2016.03.039. [DOI] [PubMed] [Google Scholar]
- 13.Lademann J., Schaefer H., Otberg N., Teichmann A., Blume-Peytavi U., Sterry W. Penetration of microparticles into human skin. Hautarzt. 2004;55:1117–1119. doi: 10.1007/s00105-004-0841-1. [DOI] [PubMed] [Google Scholar]
- 14.Toll R., Jacobi U., Richter H., Lademann J., Schaefer H., Blume-Peytavi U. Penetration profile of microspheres in follicular targeting of terminal hair follicles. J. Investig. Dermatol. 2004;123:168–176. doi: 10.1111/j.0022-202X.2004.22717.x. [DOI] [PubMed] [Google Scholar]
- 15.Jin S.P., Li Z., Choi E.K., Lee S., Kim Y.K., Seo E.Y., Chung J.H., Cho S. Urban particulate matter in air pollution penetrates into the barrier-disrupted skin and produces ROS-dependent cutaneous inflammatory response in vivo. J. Dermatol. Sci. 2018;91 doi: 10.1016/j.jdermsci.2018.04.015. [DOI] [PubMed] [Google Scholar]
- 16.Ji Z., Dai R., Zhang Z. Characterization of fine particulate matter in ambient air by combining TEM and multiple spectroscopic techniques—NMR, FTIR and Raman spectroscopy. Environ. Sci. Process. Impacts. 2015;17:552–560. doi: 10.1039/C4EM00678J. [DOI] [PubMed] [Google Scholar]
- 17.Genga A., Siciliano T., Siciliano M., Aiello D., Tortorella C. Individual particle SEM-EDS analysis of atmospheric aerosols in rural, urban, and industrial sites of Central Italy. Environ. Monit. Assess. 2018;190:456. doi: 10.1007/s10661-018-6826-9. [DOI] [PubMed] [Google Scholar]
- 18.Shakeri Yekta S., Hedenstrom M., Svensson B.H., Sundgren I., Dario M., Enrich-Prast A., Hertkorn N., Bjorn A. Molecular characterization of particulate organic matter in full scale anaerobic digesters: An NMR spectroscopy study. Sci. Total Environ. 2019;685:1107–1115. doi: 10.1016/j.scitotenv.2019.06.264. [DOI] [PubMed] [Google Scholar]
- 19.Yue S., Slipchenko M.N., Cheng J.X. Multimodal Nonlinear Optical Microscopy. Laser Photonics. Rev. 2011;5 doi: 10.1002/lpor.201000027. [DOI] [PMC free article] [PubMed] [Google Scholar]
- 20.Kim S.H., Lee E.S., Lee J.Y., Lee E.S., Lee B.S., Park J.E., Moon D.W. Multiplex coherent anti-stokes Raman spectroscopy images intact atheromatous lesions and concomitantly identifies distinct chemical profiles of atherosclerotic lipids. Circ. Res. 2010;106:1332–1341. doi: 10.1161/CIRCRESAHA.109.208678. [DOI] [PubMed] [Google Scholar]
- 21.Lee E.S., Park J.H., Lee S.W., Hahn J., Lee H., Chae S.W., Lee T.G., Moon D.W., Kim S.H. Lipid crystals mechanically stimulate adjacent extracellular matrix in advanced atherosclerotic plaques. Atherosclerosis. 2014;237:769–776. doi: 10.1016/j.atherosclerosis.2014.10.018. [DOI] [PubMed] [Google Scholar]
- 22.Kim S., Lee E.S., Lee S.W., Kim Y.H., Lee C.H., Jo D.G., Kim S.H. Site-specific impairment of perivascular adipose tissue on advanced atherosclerotic plaques using multimodal nonlinear optical imaging. Proc. Natl. Acad. Sci. USA. 2019;116:17765–17774. doi: 10.1073/pnas.1902007116. [DOI] [PMC free article] [PubMed] [Google Scholar]
- 23.Schwarze P.E., Ovrevik J., Lag M., Refsnes M., Nafstad P., Hetland R.B., Dybing E. Particulate matter properties and health effects: Consistency of epidemiological and toxicological studies. Hum. Exp. Toxicol. 2006;25:559–579. doi: 10.1177/096032706072520. [DOI] [PubMed] [Google Scholar]
- 24.Dresselhaus M.S., Jorio A., Hofmann M., Dresselhaus G., Saito R. Perspectives on carbon nanotubes and graphene Raman spectroscopy. Nano Lett. 2010;10:751–758. doi: 10.1021/nl904286r. [DOI] [PubMed] [Google Scholar]
- 25.Rebelo S.L., Guedes A., Szefczyk M.E., Pereira A.M., Araujo J.P., Freire C. Progress in the Raman spectra analysis of covalently functionalized multiwalled carbon nanotubes: Unraveling disorder in graphitic materials. Phys. Chem. Chem. Phys. 2016;18:12784–12796. doi: 10.1039/C5CP06519D. [DOI] [PubMed] [Google Scholar]
- 26.van Steensel B., van Binnendijk E.P., Hornsby C.D., van der Voort H.T., Krozowski Z.S., de Kloet E.R., van Driel R. Partial colocalization of glucocorticoid and mineralocorticoid receptors in discrete compartments in nuclei of rat hippocampus neurons. J. Cell Sci. 1996;109:787–792. doi: 10.1242/jcs.109.4.787. [DOI] [PubMed] [Google Scholar]
- 27.Hu R., Liu G., Zhang H., Xue H., Wang X. Levels and Sources of PAHs in Air-borne PM2.5 of Hefei City, China. Bull. Environ. Contam. Toxicol. 2017;98:270–276. doi: 10.1007/s00128-016-2019-9. [DOI] [PubMed] [Google Scholar]
- 28.Chavoshnejad P., More S., Razavi M.J. From surface microrelief to big wrinkles in skin: A mechanical in-silico model. Extrem. Mech. Lett. 2020;36 doi: 10.1016/j.eml.2020.100647. [DOI] [Google Scholar]
- 29.Olesen C.M., Fuchs C.S.K., Philipsen P.A., Haedersdal M., Agner T., Clausen M.L. Advancement through epidermis using tape stripping technique and Reflectance Confocal Microscopy. Sci. Rep. 2019;9:12217. doi: 10.1038/s41598-019-48698-w. [DOI] [PMC free article] [PubMed] [Google Scholar]
- 30.Dijkhoff I.M., Drasler B., Karakocak B.B., Petri-Fink A., Valacchi G., Eeman M., Rothen-Rutishauser B. Impact of airborne particulate matter on skin: A systematic review from epidemiology to in vitro studies. Part. Fibre Toxicol. 2020;17:35. doi: 10.1186/s12989-020-00366-y. [DOI] [PMC free article] [PubMed] [Google Scholar]
- 31.Cicchi R., Kapsokalyvas D., Pavone F.S. Clinical Nonlinear Laser Imaging of Human Skin: A Review. BioMed Res. Int. 2014;2014:903589. doi: 10.1155/2014/903589. [DOI] [PMC free article] [PubMed] [Google Scholar]
- 32.Barhoumi R., Mouneimne Y., Ramos E., Morisseau C., Hammock B.D., Safe S., Parrish A.R., Burghardt R.C. Multiphoton spectral analysis of benzo[a]pyrene uptake and metabolism in a rat liver cell line. Toxicol. Appl. Pharmacol. 2011;253:45–56. doi: 10.1016/j.taap.2011.03.009. [DOI] [PMC free article] [PubMed] [Google Scholar]
- 33.Rosso J.D., Zeichner J., Alexis A., Cohen D., Berson D. Understanding the Epidermal Barrier in Healthy and Compromised Skin: Clinically Relevant Information for the Dermatology Practitioner: Proceedings of an Expert Panel Roundtable Meeting. J. Clin. Aesthet Dermatol. 2016;9:S2–S8. [PMC free article] [PubMed] [Google Scholar]
- 34.Loffler H., Dreher F., Maibach H.I. Stratum corneum adhesive tape stripping: Influence of anatomical site, application pressure, duration and removal. Br. J. Dermatol. 2004;151:746–752. doi: 10.1111/j.1365-2133.2004.06084.x. [DOI] [PubMed] [Google Scholar]
Associated Data
This section collects any data citations, data availability statements, or supplementary materials included in this article.
Supplementary Materials
Data Availability Statement
Not applicable.


