

Abstract
Objective:
This study aimed to create an objective predictive model for assessing the functional status of the cochlear nerve (CN) in individual cochlear implant (CI) users.
Design:
Study participants included 23 children with cochlear nerve deficiency (CND), 29 children with normal-sized CNs (NSCNs), and 20 adults with various etiologies of hearing loss. Eight participants were bilateral CI users and were tested in both ears. As a result, a total of 80 ears were tested in this study. All participants used Cochlear® Nucleus™ CIs in their test ears. For each participant, the CN refractory recovery function (RRF) and input/output (I/O) function were measured using electrophysiological measures of the electrically-evoked compound action potential (eCAP) at three electrode sites across the electrode array. Refractory recovery time constants were estimated using statistical modeling with an exponential decay function. Slopes of I/O functions were estimated using linear regression. The eCAP parameters used as input variables in the predictive model were absolute refractory recovery time estimated based on the RRF, eCAP threshold, slope of the eCAP I/O function, and negative-peak (i.e., N1) latency. The output variable of the predictive model was CN index, an indicator for the functional status of the CN. Predictive models were created by performing linear regression, support vector machine regression, and logistic regression with eCAP parameters from children with CND and the children with NSCNs. One-way analysis of variance with post hoc analysis with Tukey’s honest significant difference criterion was used to compare study variables among study groups.
Results:
All except for one child with CND had smaller CN indices than children with NSCNs. CN indices measured in adult CI users were not significantly different from those measured in children with NSCNs. Variations in CN index when calculated using different machine learning techniques were observed for adult CI users. Regardless of these variations, CN indices calculated using all three techniques in adult CI users were significantly correlated with Consonant-Nucleus-Consonant word and AzBio sentence scores measured in quiet.
Conclusions:
The functional status of the CN for individual CI users was estimated by our newly developed analytical models. Model predictions of CN function for individual adult CI users were positively and significantly correlated with speech perception performance. The models presented in this study may be useful for understanding and/or predicting CI outcomes for individual patients.
Keywords: cochlear implant, auditory nerve, electrically evoked auditory compound action potentials, supervised machine learning
INTRODUCTION
A puzzling challenge in providing care for patients with cochlear implants (CIs) arises from unexplained variability and large individual differences in CI patient outcomes (e.g. Firszt et al., 2004; Lazard et al., 2012; Holden et al., 2013; Moberly et al., 2016). Substantial variability in CI outcomes exists even in adults with post-lingual deafness (Blamey et al., 2013; Beyea et al., 2016), a patient population that would be expected to have generally good CI outcomes because of their previous normal language development (Moberly et al., 2016). Many factors contribute to the observed variability in CI patient outcomes and can be described by three broad categories: auditory sensitivity, linguistic skills, and neurocognitive function (Moberly et al., 2016). Deficits in any of these “bottom-up” or “top-down” processes may negatively impact CI patient outcomes.
Theoretically, good auditory sensitivity depends on the presence of a sufficiently large group of cochlear nerve (CN) fibers that are able to encode and transmit electrical representations of auditory information to the central nervous system. Therefore, the number of CN fibers and their responsiveness to electrical stimulation (i.e., functional status of the CN) should be influential in CI outcomes. The results from studies in animal models (e.g., Ramekers et al., 2014; Pfingst et al., 2017) coupled with results from studies with human listeners (Kim et al., 2010; Teagle et al., 2010; Zhou & Pfingst, 2014; Schvartz-Leyzac & Pfingst, 2018; He et al., 2018) support this hypothesis. Indeed, there is a growing body of literature supporting the importance of the underlying neural function for CI outcomes (e.g., Kirby & Middlebrooks, 2010, 2012; Kim et al., 2010; Teagle et al., 2010; Garadat et al., 2012; Long et al., 2014; Zhou & Pfingst, 2014; Schvartz-Leyzac & Pfingst, 2018; He et al., 2018). Therefore, accurately estimating the functional status of the CN for individual patients may be important for understanding inter-patient variations and predicting CI outcomes for individual patients.
While the number of CN fibers and their responsiveness to electrical stimulation cannot be directly measured in human listeners, results of animal studies show that basic neural response properties are determined by the functional status of the CN (Shepherd et. al, 2004; Pfingst et al., 2015b). Specifically, rats with smaller densities of spiral ganglion neurons (SGNs) have higher response thresholds and longer absolute refractory periods than normal control rats (Shepherd et. al, 2004). Pfingst et al. (2015b) showed that detection thresholds decreased as a function of stimulus duration at a slower rate in guinea pigs with worse neural survival. These neural response properties can also be derived from electrophysiological measures of the electrically-evoked compound action potential (eCAP) in human listeners. The eCAP is a near-field neural response that is generated by CN fibers responding synchronously to electrical stimulation (Brown et al., 1990; Miller et al., 2000; Abbas et al., 2004). The eCAP typically consists of a negative peak (N1) followed by a smaller positive peak or plateau (P2) occurring within the time windows of 0.2–0.4 ms and 0.6–0.8 ms after stimulus onset, respectively (Brown et al., 1998; Abbas et al., 1999). The presence of the eCAP response depends on a sufficient number of neurons firing synchronously, and therefore, can provide useful insight into the functional status of CN fibers in human listeners (He et al., 2018, 2019a; Luo et al., 2019).
Results of studies with animal models and human listeners indicate that several eCAP parameters are associated with the functional status of CN fibers (e.g. Ramekers et al., 2004; Pfingst et al., 2017; He et al., 2018). Two parameters that have been studied are the absolute refractory period (ARP) and the relative refractory period (RRP, Morsnowski et al., 2006; Botros & Psarros, 2010; Fulmer et al., 2010; He et al., 2018). ARP refers to the time immediately following a previous stimulation in which a neuron cannot produce an action potential regardless of the magnitude of the stimulus. The RRP follows the ARP and refers to the period in which the probability of the neuron firing gradually increases such that the neuron can be activated by a sufficiently strong stimulus. The ARP and the RRP can be estimated based on the eCAP refractory recovery function (RRF).
The eCAP RRF is typically measured with two biphasic, charge balanced, electrical pulses using a modified template subtraction method (Miller et al., 2000) in which the time between the masker and probe [i.e. masker-probe interval (MPI)] is systematically varied from 300 to 10,000 μs (He et al., 2017). As the MPI increases, the auditory nerve gradually recovers from the refractoriness induced by the masker, which results in larger eCAPs at longer MPIs. The eCAP RRF has frequently been modeled as an exponential decay function (e.g., Morsnowski et al., 2006; Botros & Psarros, 2010; Fulmer et al., 2010; He et al., 2018) where the x-intercept (i.e. t0) and the rate of decay (i.e. ) are estimates of the ARP and RRP, respectively. t0 has been shown to be larger in CI users with poorer auditory function (He et al., 2018). Several studies that estimated the RRP showed no significant changes in due to etiology of hearing loss (Fulmer et al., 2010; He et al., 2018), type of anesthesia (Wiemes et al., 2016), or age (Lee et al., 2012). Therefore, results from these studies suggest that lower values are associated with better neural function while does not appear to be correlated with neural function.
Other parameters associated with neural function of CN fibers include slope of the eCAP input/output (I/O) function, the eCAP threshold (i.e., the lowest stimulation level that evokes an eCAP), and the eCAP amplitude measured at the maximum comfortable level (i.e., C level). These three parameters can be derived from the eCAP I/O function which is created by plotting eCAP amplitudes as a function of stimulation level. The relationship between parameters derived from the eCAP I/O function and the functional status of the CN have been investigated in animal models (Prado-Guitierrez et al., 2006; Ramekers et al., 2014; Pfingst et al., 2015a, 2017) as well as in human listeners (Kim et al., 2010; Van de Heyning et al., 2016; He et al., 2018, 2019a). Steeper slopes of the eCAP I/O function (Kim et al., 2010; Ramekers et al., 2014; Pfingst et al., 2015a, 2017; He et al., 2018, 2019a), lower eCAP thresholds (He et al., 2018, 2019a), and larger eCAP amplitudes at C level (Ramekers et al., 2014; He et al., 2018, 2019a) suggest superior neural function.
The use of machine learning techniques to create predictive models in CI research has grown rapidly in recent years (see Crowson et al., 2020 for recent review). Most pertinent to the present work is the use of machine learning algorithms in the prediction of CI outcomes. Specifically, support vector machines (SVMs) have been used to predict speech perception and language skills from preoperative data in pediatric CI users (Tan et al., 2015; Feng et al., 2018). For adult CI users, the k-nearest neighbors algorithm has been combined with linear regression (Ramos-Miguel et al., 2015) or logistic regression (Guerra-Jimenez et al., 2016) to predict CI outcomes. While several studies have applied machine learning techniques to automating eCAP detection and measurement (e.g. Botros et al., 2007; van Dijk et al., 2007; Gartner et al., 2010), there are still no studies that have integrated machine learning techniques to predict auditory neural function.
In this study, analytical models for predicting the functional status of the CN for individual CI users were created using supervised machine learning techniques based on eCAP results. The specific electrophysiological parameters used in this study are derived from the eCAP RRF and eCAP I/O function and are described in detail in the methods section. The structure of the predictive models is founded on neurophysiological evidence from a recent study showing significantly poorer CN function in children with cochlear nerve deficiency (CND) than in children with normal-sized CNs (NSCNs, He et al., 2018). CND refers to a small or absent CN as revealed by results of high-resolution magnetic resonance imaging (MRI) scans (Glastonbury et al., 2002; Adunka et al., 2006; Buchman et al., 2006; Kutz et al, 2011; Clemmens et al., 2013). The CN is considered to be small when the nerve is evident on the MRI scan but substantially smaller than the contralateral CN (Adunka et al., 2006; Buckman et al., 2006), other nerves in the internal auditory canal (Buchman et al., 2006; Kutz et al., 2011), or expected size in normal ears (Adunka et al., 2006; Clemmens et al., 2013). The CN is considered to be absent when it cannot be visually identified with a MRI scan (Glastonbury et al., 2002; Adunka et al., 2006; Buchman et al., 2006; Kutz et al, 2011; Clemmens et al., 2013). Irrespective of the size of the CN, cochlear implantation is considered as a treatment option for children with CND. Substantial variability in CI outcomes among children with CND have been reported, ranging from no sound awareness to understanding open-set speech (e.g., Young et al., 2012; Vincenti et al., 2014; Birman et al., 2016; Han et al., 2019). Despite individual differences, children with CND as a group have been shown to have significantly worse CI outcomes than age-matched CI patients with NSCNs (Kang et al., 2010; Wei et al., 2017). Therefore, due to the large disparity in neural function and CI outcomes, results measured in children with CND and in children with NSCNs served as a suitable training dataset for the models developed in this study.
Three regression algorithms (linear, SVM, and logistic) were used in this study for several reasons. First, the function that best stratifies patients according to CN function is unknown. Second, these techniques have been used in other CI studies (Ramos-Miguel et al., 2015; Tan et al., 2015; Guerra-Jimenez et al., 2016; Feng et al., 2018). Third, the underlying assumptions of these algorithms were met. Specifically, the eCAP parameters used in the regression algorithms were verified to be linearly independent and residuals were verified to be homoscedastic. Therefore, all of these regression algorithms were appropriate for developing the models of this study.
We hypothesized that the models would stratify individual patients according to the functional status of the CN. Based on this hypothesis, we expected distinct distributions (i.e., clear separation) of the CN index for children with CND and children with NSCNs. We further expected that CN indices for adult study participants would be generally worse than those for children with NSCNs but better than those for children with CND because CN function deteriorates with advanced age (e.g. McFadden et al., 1997; Makary et al., 2011; Viana et al., 2015; Wu et al., 2019). Finally, we expected that the CN index would be positively correlated with speech outcome measures because recent studies have suggested that CI outcomes are related to the underlying CN function (Kim et al., 2010; Zhou & Pfingst, 2014; Schvartz-Leyzac & Pfingst, 2018; He et al., 2018).
MATERIALS AND METHODS
Study Participants
A total of 72 participants from three patient populations were enrolled in this study (see Table, Supplemental Digital Content 1, which provides detailed demographic information of all participants included in this study). The eCAP results from each study group were used for either model creation or model validation. Study participants whose eCAP results were used for training the model included 23 children with CND (CND1-CND23) and 29 children with NSCNs (NSCN1-NSCN29). Results from 20 adults (A1-A20) with various etiologies of hearing loss were used to validate the model and to explore the potential application of the model developed in this study for clinical application. One child with CND (CND23), three children with NSCNs (NSCN22, NSCN25, and NSCN26), and four adults (A4, A5, A7 and A13) were bilateral CI users and were tested in both ears. Results recorded in 14 children with CND (CND7-CND20) and 9 children with NSCNs (NSCN7-NSCN15) have been reported in He et al. (2018).
The anatomical status of the CN and the inner ear was determined based on results of high resolution MRI and Computed Tomography (CT) temporal bone scans following the same protocol and criteria as described in our previous studies (He et al., 2018; Luo et al., 2019).
Participants were recruited and tested in one of three locations: The Ohio State University (OSU; CND23, NSCN25–29, and A1–20), The University of North Carolina (UNC) at Chapel Hill (UNC-CH; CND7–10, NSCN7, NSCN9 and NSCN12), or Shandong ENT Hospital (SENTP; CND1–6, CND11–22, NSCN1–6, NSCN8, NSCN10–11, and NSCN13–24). The biomedical institutional review board (IRB) of each institution approved this study (IRB study #: OSU, 2017H0131 and 2018H0344; UNC-CH, 12–1737; SENTP, 2016–2).
Prior to data collection, written informed consent was obtained from all participants and/or their legal guardians when applicable. All participants received financial compensation for their participation.
Procedures
Testing Electrodes
All participants, except for CND5 and CND6, had a full electrode array insertion, which means that electrodes 1 and 22 of Cochlear® Nucleus™ CIs (Cochlear Ltd., Macquarie, NSW, Australia) were placed near the base and the apex of the cochlea, respectively. The electrode array was partially inserted in CND5 and CND6 due to Incomplete Partition Type II (IP-II). For all participants, three electrodes were tested for eCAP measures. For children with CND, these three testing sites ranged from the most basal to the most apical electrode location where an eCAP could be recorded and had a relatively equal separation between testing electrodes. For children with NSCNs and adult CI users, typically electrodes 3, 12 and 21 were tested (see Table, Supplemental Digital Content 1, which lists electrodes tested in individual patients). These testing electrodes were referred to as the “basal”, the “middle” and the “apical” electrode based on their relative locations among selected electrodes along the electrode array.
eCAP Measures
Electrophysiological measures of the eCAP were acquired using the Advanced Neural Response Telemetry (NRT) function implemented in the Custom Sound EP (v. 4.3 or 5.1) software (Cochlear Ltd, Macquarie, NSW, Australia). The stimulus was a symmetric, cathodic-leading, biphasic pulse which has been used extensively in previous studies (e.g., Prado-Guitierrez et al., 2006; Kim et al., 2010; Ramekers et al., 2014; Pfingst et al., 2015a, 2015b, 2017; He et al., 2018, 2019a). The interphase gap used in all participants was 7 μs. For participants with normal-sized CNs (both adults and children), the pulse phase duration (PPD) was 25 μs/phase. For children with CND, the PPD varied across participants within the range of 37 and 100 μs/phase (see Table, Supplemental Digital Content 1, which reports the PPD for all participants). Longer PPDs were needed for these participants to deliver sufficient stimulation for eCAP recording that stays within the voltage compliance limit of the device. Other parameters used for eCAP measures included a 15 Hz probe rate, sampling delays between 98 and 122 μs, and an effective sampling rate of 20 kHz. An amplifier gain of 50 dB and 50 sweeps per averaged eCAP response were used for all adult participants and children with NSCNs. The amplifier gain was set to 40 dB and 100 sweeps were used for each averaged eCAP response measured in children with CND. These parameters are recommended by He et al. (2019b) to minimize artifact contamination in eCAPs measured in children with CND. The stimulus was presented to individual CI electrodes via a N6 sound processor that was connected to a programming pod.
For the eCAP I/O function measurement, the eCAP was measured using a two-pulse forward-masking-paradigm (Brown et al., 1990), in which the masker pulse was always presented at 10 current levels (CLs) higher than the probe pulse. The masker pulse was initially presented at the maximum comfortable level (i.e., C level), followed by a systematic decrease in steps of 5 CLs until no response could be visually identified. The stimulation level was subsequently increased in steps of 1 CL until at least five eCAPs were measured using this small step size. The MPI was 400 μs.
The eCAP RRF was obtained with two biphasic, charge balanced, electrical pulses using a modified template subtraction method (Miller et al., 2000). The masker pulse was presented at C level and the probe pulse was presented at 10 CLs below C level. eCAPs were recorded as the MPI was systematically increased from 100 μs to 10 ms. The maximum masker stimulation level for the eCAP RRF was the same as the masker stimulation level for the eCAP I/O function for all except three electrodes (A2, electrode 18; A8, electrodes 12 and 21). For these three electrodes, there was a 1 CL difference between the maximum masker stimulation levels used to measure these two functions.
Speech Perception Scores
Participants’ speech perception capabilities were evaluated using Consonant-Nucleus-Consonant (CNC) word lists (Peterson & Lehiste, 1962) and AzBio sentences (Spahr et al., 2015) in quiet. Results of several studies have shown that cognitive function plays an important role for speech perception in noise (e.g., Dryden et al., 2017; Nuesse et al., 2018). Therefore, speech perception scores were only measured in quiet in this study in order to minimize the effects of cognitive function on study results. All speech perception testing took place in sound-proof booths, using the procedure described in the new Minimum Speech Test Battery (MSTB, 2011). The auditory stimuli were presented in the sound booth via a speaker placed one meter in front of the participant at zero degrees azimuth, calibrated to 60 dB(A) sound pressure level using a sound level meter. For the four participants who are bilateral CI users (A4, A5, A7 and A13), speech perception scores were measured for each test ear separately.
Data Analysis
eCAP Refractory Recovery Function
The top panels of Figure 1 show eCAPs recorded at different MPIs for electrical stimulations at electrode 3 in participants CND22, NSCN9, and A12, respectively. The eCAP amplitudes measured at different MPIs were normalized to the eCAP amplitude measured at 10 ms and plotted as a function of MPI to generate the eCAP RRF. Two children with CND (CND5 and CND16) did not have a recorded eCAP with an MPI of 10 ms at the apical electrode, and so the eCAP amplitude recorded at the next longest MPI (i.e., 8.1 ms) was used for normalization. The bottom panels of Figure 1 show the normalized eCAP amplitudes along with the fitted exponential decay functions used to estimate ARP and RRP, at electrode 3 in participants CND22, NSCN9, and A12, respectively.
Figure 1.
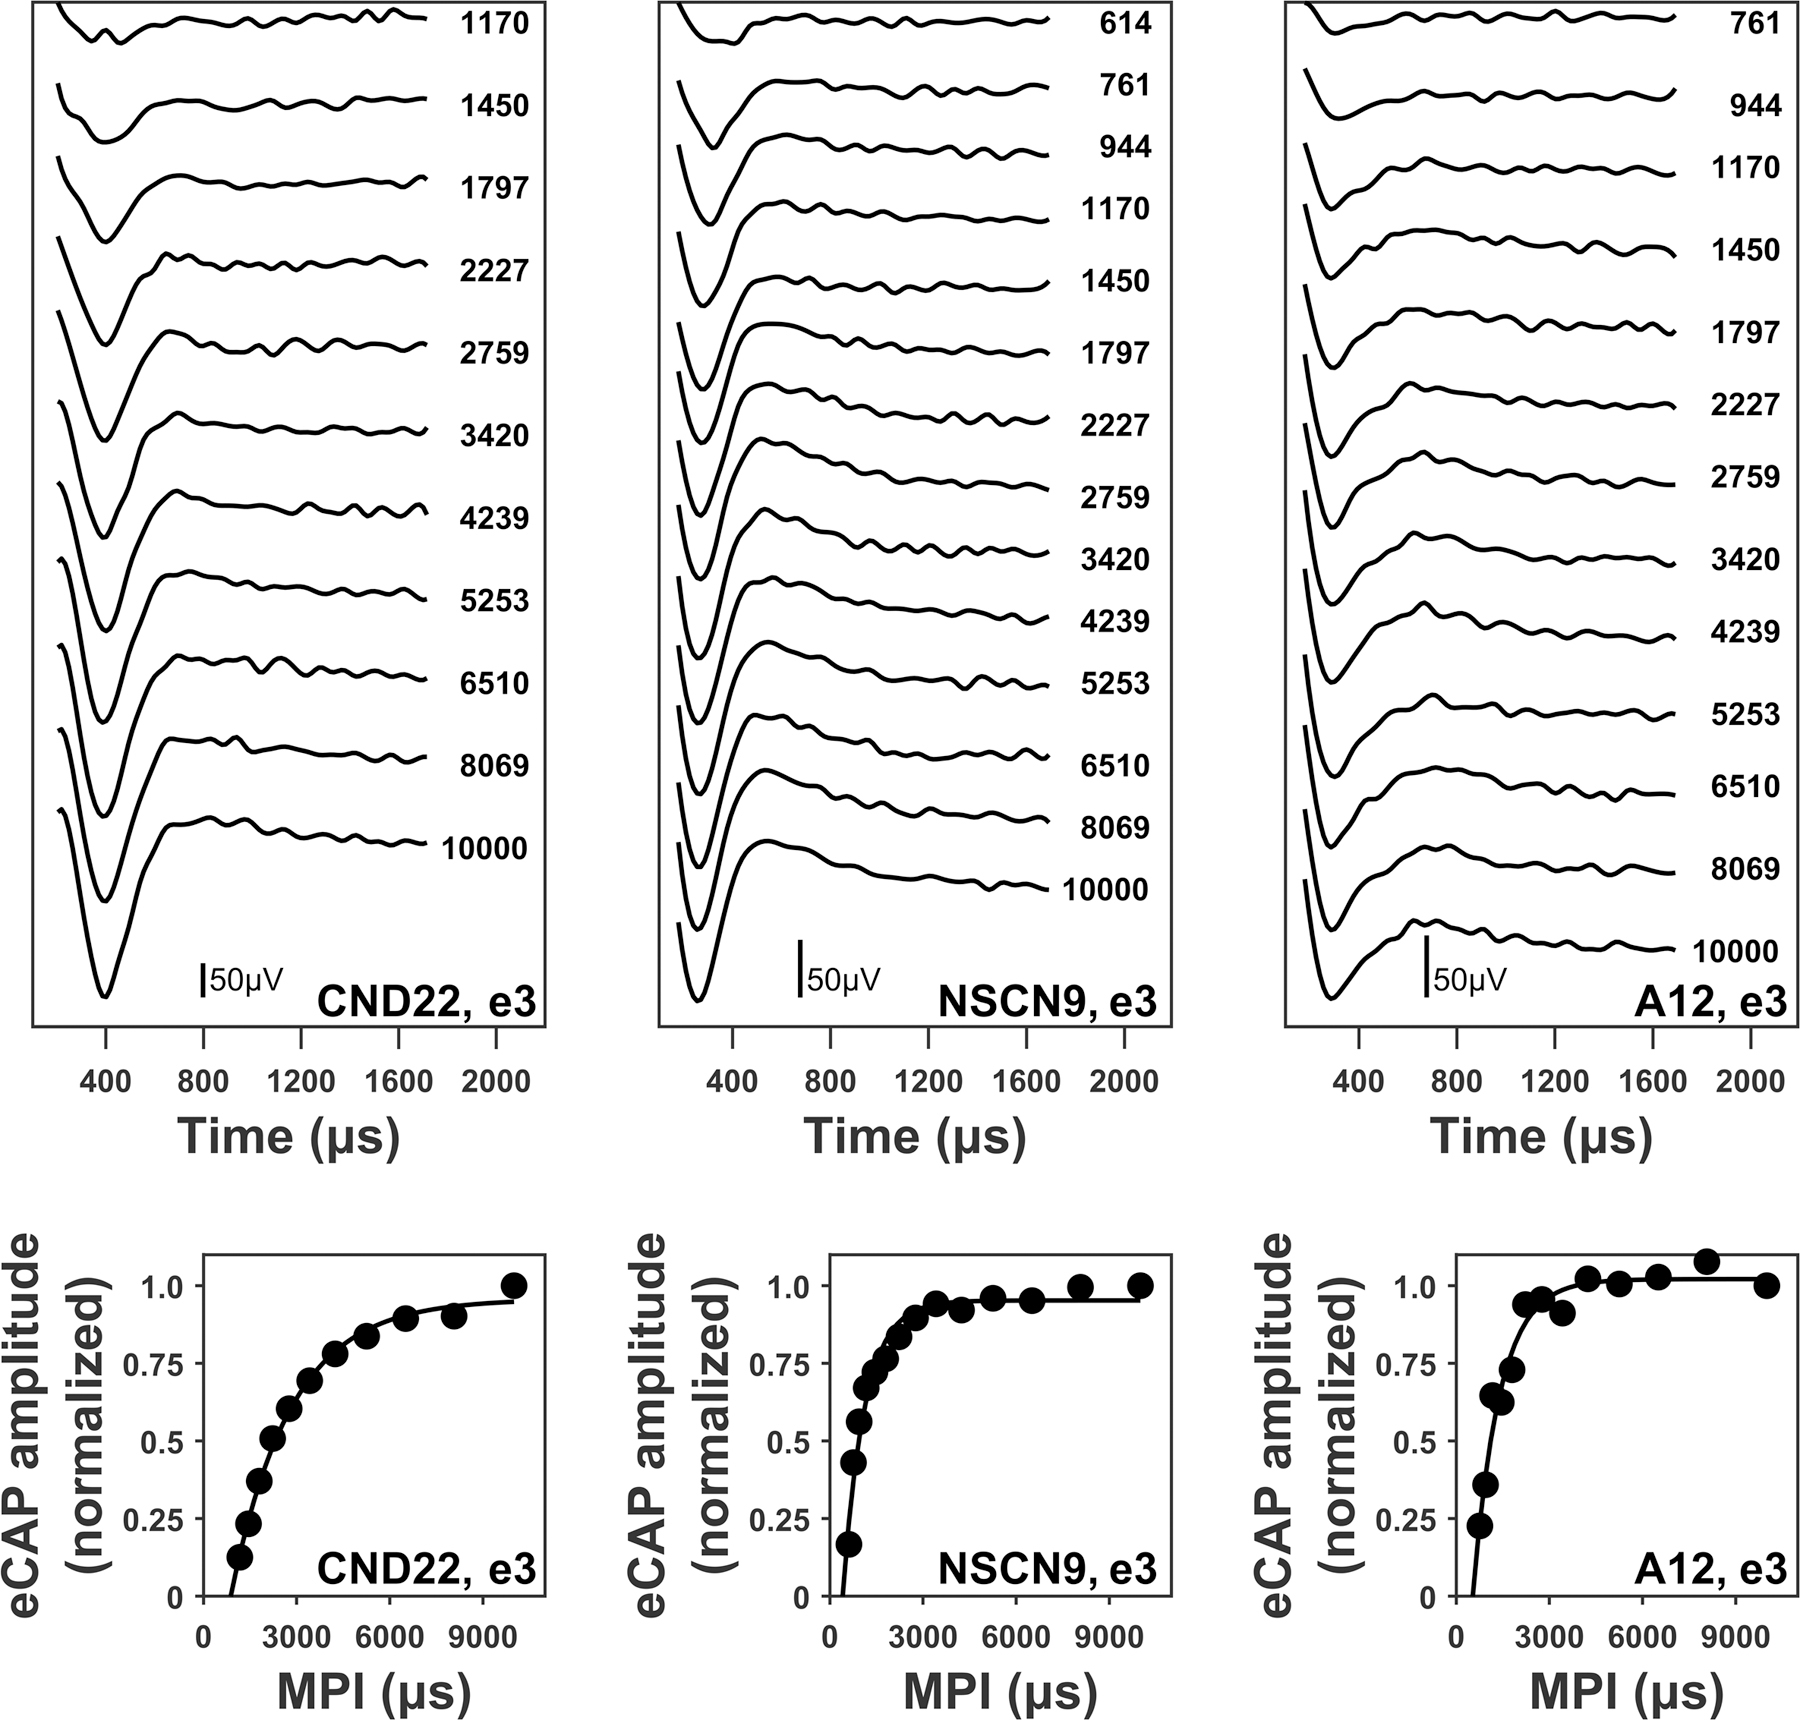
Upper panels: electrically-evoked compound action potential (eCAP) waveforms measured at different masker-probe intervals (MPIs) for stimulating electrode 3 in one child with cochlear nerve deficiency (CND; CND22), one child with normal-sized cochlear nerve (NSCN; NSCN9), and one adult (A12). eCAPs are arranged based on MPI duration, with responses evoked by short MPIs displayed at the top. Each waveform is labeled with the corresponding MPI duration in μs. Lower panels: refractory recovery functions (round symbols) obtained from the waveforms in the upper panels. The fitted exponential decay function for each refractory recovery function (black line) is also provided. The participant and electrode number are included in the lower right corner of each panel. The stimulations were performed at the maximum comfortable level for each participant and electrode.
For all participants, estimates of the ARP (i.e., t0) and RRP (i.e., ) were found using statistical modeling with the exponential decay function
| (1) |
where is the normalized eCAP amplitude, A represents the maximum normalized eCAP amplitude, and MPI is the masker probe interval in ms. This exponential decay function has been used to the eCAP RRF and estimate the ARP and RRP in previously published studies (e.g., Morsnowski et al., 2006; Botros & Psarros, 2010; Wiemes et al., 2016; He et al., 2018). When the ARP estimate was unreasonable (i.e., < 0) due to data recordings that were poorly represented by the exponential decay function, the ARP was estimated as the shortest MPI that was longer than 350 μs at which an eCAP was recorded. The shortest MPI was used instead of in 10% of the electrodes tested. Poor fitting of the exponential function occurred most frequently in children with CND. Substitution of shortest MPI for was only performed on four electrodes for participants who did not have CND (A13L, electrode 3; A14, electrode 3; NSCN27, electrodes 3 and 12).
eCAP I/O function
Stimulation levels were converted to units of electrical charge in nanocoulombs (nC) per phase due to variations in PPD among participants. The top panels of Figure 2 show eCAPs recorded at different stimulation levels at electrode 21 in participants CND22, NSCN2, and A11, respectively. The bottom panels of Figure 2 show eCAP amplitudes as a function of stimulation level. The slope of the eCAP I/O function was estimated using linear regression with the linear function
| (2) |
where is the eCAP amplitude in μV, a represents the slope of the eCAP I/O function, SL is the stimulation level in nC, and b represents the intercept of the function with the vertical axis. Linear regression is the most commonly used function to estimate the slope of the eCAP I/O function (e.g., Brown et al., 1990; Kim et al., 2010; Schvartz-Leyzak and Pfingst, 2016).
Figure 2.
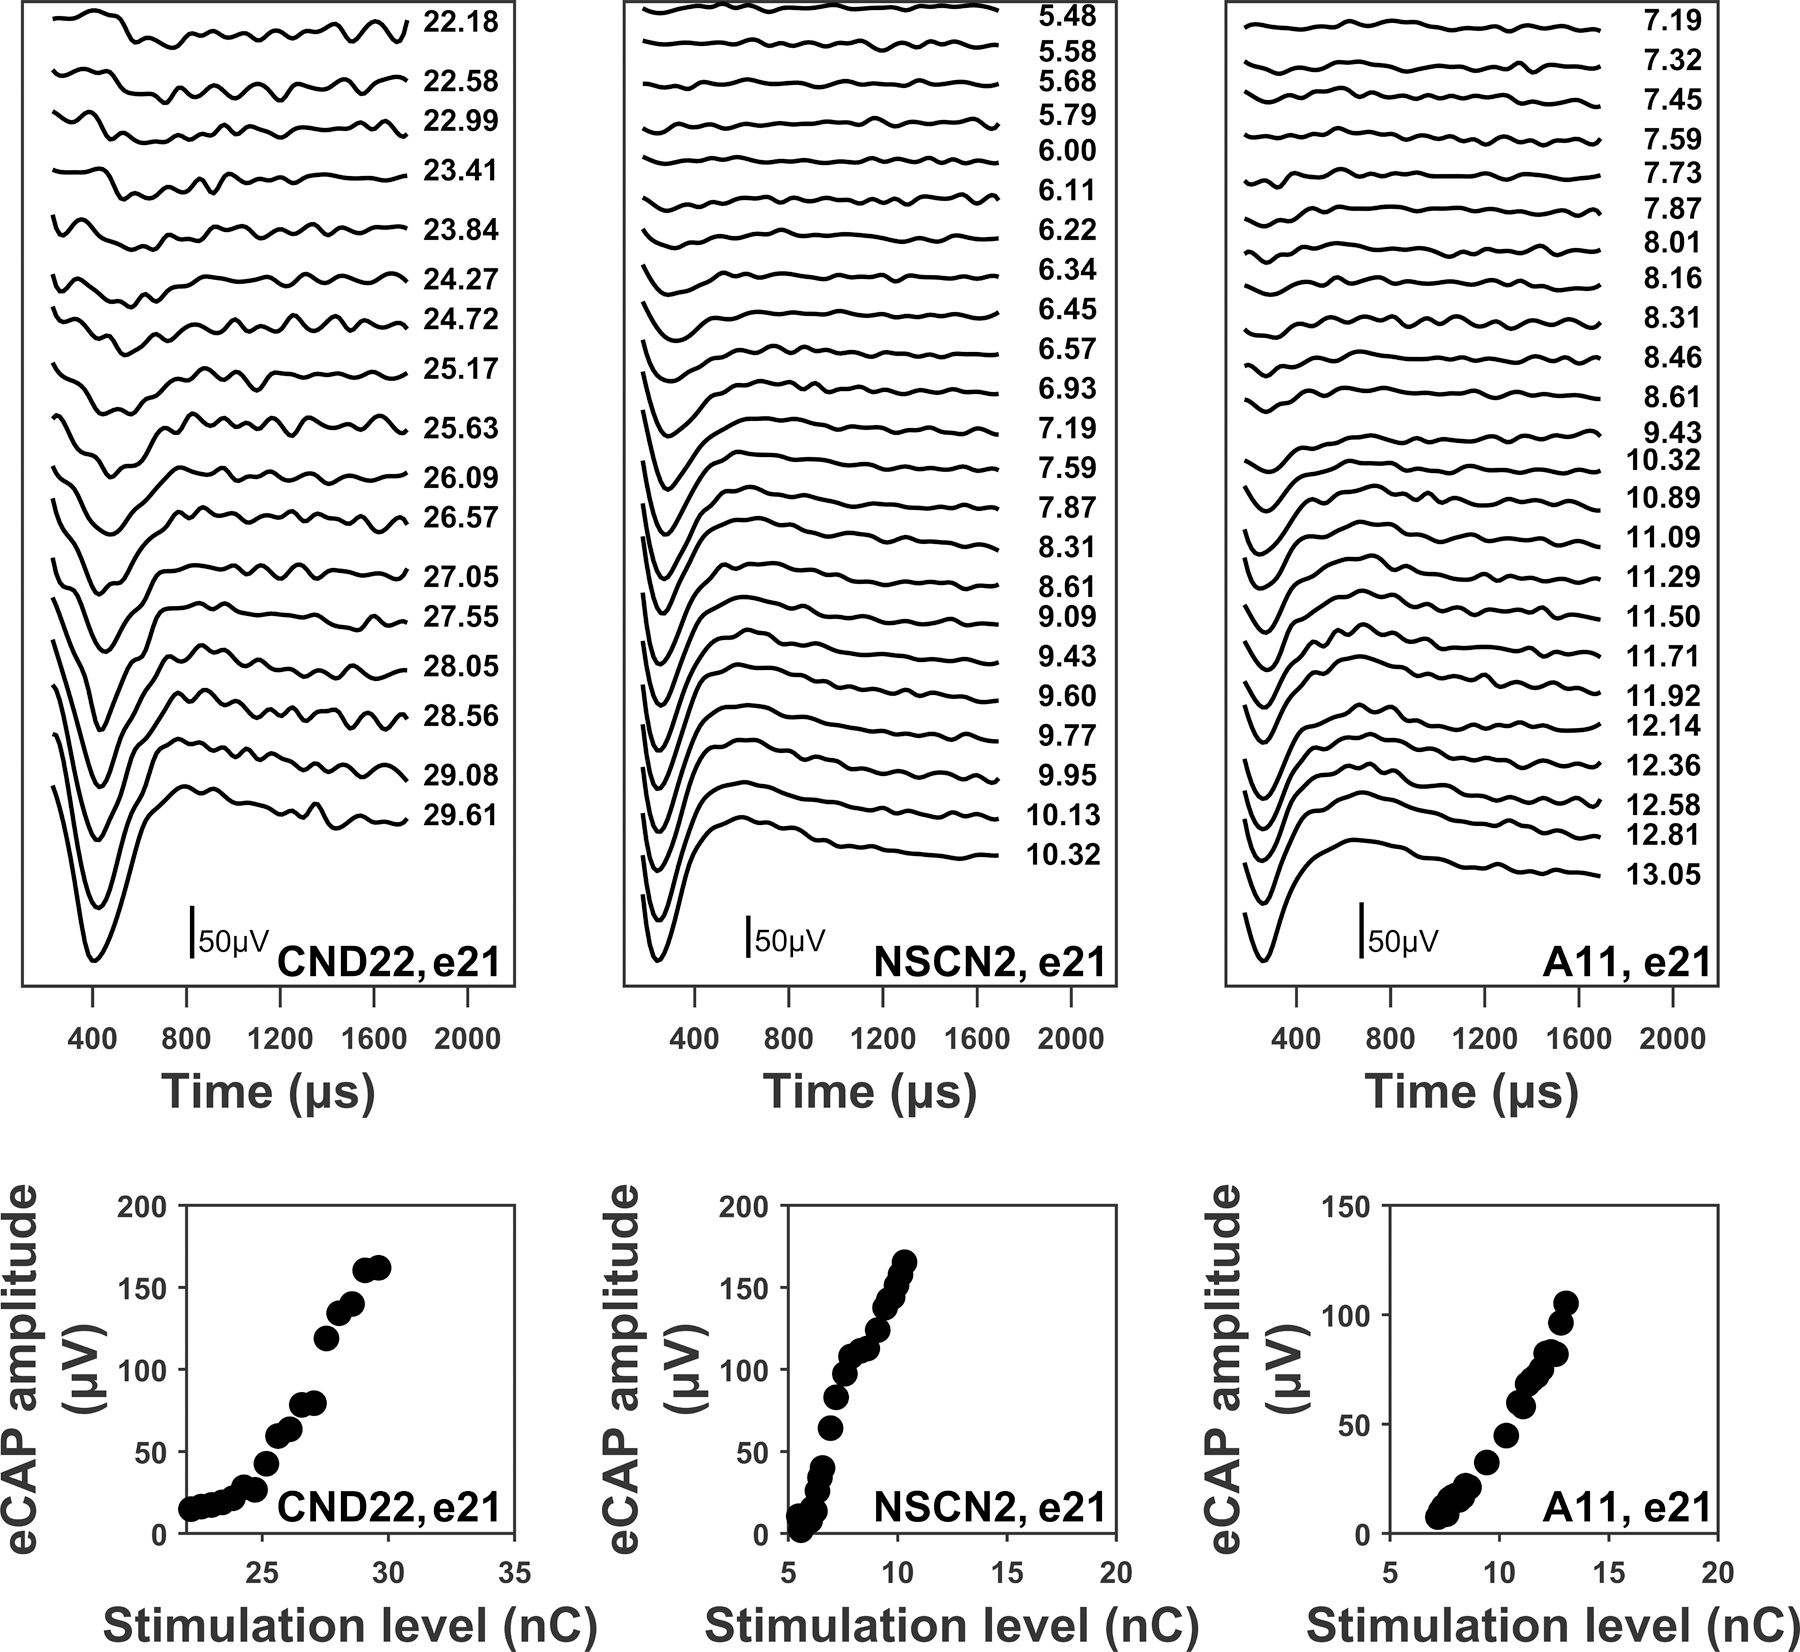
Upper panels: electrically-evoked compound action potential (eCAP) waveforms measured at different stimulation intensities for electrode 21 in one child with cochlear nerve deficiency (CND; CND22), one child with normal-sized cochlear nerve (NSCN; NSCN2), and one adult (A11). eCAPs are arranged based on stimulation level, with responses evoked by the smallest stimulation level (i.e., eCAP threshold) displayed at the top. Each waveform is labeled with the corresponding probe stimulation level in nanocoulombs (nC). The largest stimulation level presented was the maximum comfortable level (i.e., C level). Lower panels: eCAP input/output functions (round symbols) obtained from the waveforms in the upper panels. The participant and electrode number are included in the lower right corner of each panel.
Predictive models
Model variables
eCAP parameters used as input variables in the predictive models were derived from the eCAP RRF and eCAP I/O function. These parameters include , the eCAP threshold, slope of the eCAP I/O function, and N1 latency of the eCAP with the maximum amplitude. The output variable is a number which represents the functional status of the CN. For model training, the value of this variable was 0 for children with CND and 1 for children with NSCNs. For model prediction, the output is a value between 0 and 100, where 0 represents the poorest neural function among study participants and 100 represents the best neural function among participants included in the study. This number between 0 and 100 is defined as the CN index.
While the relationship between CN neural function and N1 latency has not been well studied in the literature, we have observed that eCAPs recorded in children with CND have prolonged N1 latencies compared to those recorded in children with NSCNs (Xu et al., 2019). Additionally, independent two-sample t-tests comparing the CND and NSCN study groups revealed significant differences for all of the included eCAP parameters: (t(166) = 6.15, p<0.001), the eCAP threshold (t(166) = 15.89, p<0.001), slope of the I/O function (t(166) = 9.06, p<0.001), and N1 latency (t(166) = 12.11, p<0.001). Therefore, all of these eCAP parameters were included in the predictive models. The eCAP amplitude measured at C level was not included in the models because it is strongly correlated with the slope of the eCAP I/O function (r=0.86, p<0.001) and provides redundant information. and P2 latency were not included in the models because other studies suggest that is not related to CN function (Fulmer et al., 2010; Lee et al., 2012; Wiemes et al., 2016; He et al., 2018), and P2 latency is statistically dependent on N1 latency.
The eCAP parameters recorded at each electrode site were included together in one combined vector because the aim of this study was to create an objective model that predicts overall CN function for individual patients. The eCAP parameters were concatenated based on known patterns of neural function (i.e., “low”, “medium”, “high”) to provide a consistent comparison across patient populations for estimating overall CN function. Specifically, the eCAP parameters were concatenated from basal to apical electrode site (i.e., “basal”, “middle”, “apical”) for adult and NSCN groups. The eCAP parameters for the CND group were arranged in reverse order (i.e., “apical”, “middle”, “basal”) because children with CND have better neural function in the basal region compared to the apical region (He et al., 2018), which is opposite to the neural-functional pattern of typical CI users (Propst et al., 2006; Gordon et al., 2007; Brill et al., 2009; Hughes et al., 2009).
Model structure
eCAP parameters in children with CND and children with NSCNs were used as the training dataset for regression models that separate CN function between these two patient populations. Specifically, each eCAP parameter was standardized across all pediatric participants to eliminate any bias due to differences in scale between the eCAP parameters. Each eCAP parameter was standardized according to
| (3) |
where x is a vector containing the normalized value for the eCAP parameter for each pediatric participant, is a vector containing the non-normalized value for the eCAP parameter for each pediatric participant, and μ and are the mean and standard deviation of , respectively. The recorded eCAP parameters for each adult participant were also standardized using the means and standard deviations from the pediatric (i.e., training) data according to Equation 3 for model prediction.
The twelve standardized eCAP parameters (4 eCAP parameters x 3 electrode locations) from the pediatric participants were used as the input variables , to train the predictive models. The output variable used for model training was determined by study group, where for children with CND and for children with NSCNs. The model parameters were found by performing regression analyses with three supervised machine learning algorithms: linear regression with elastic net regularization, SVM regression with a linear kernel, and logistic regression with elastic net regularization. The mathematical formulation for each regression model is presented in Table 1.
TABLE 1.
Mathematical formulation for three regression models.
| Model | Regularization | Optimization problem | Hyperparameters |
|---|---|---|---|
| Linear | Elastic net | ||
| SVM | L2 norm |
such that and |
|
| Logistic | Elastic net |
where |
SVM, support vector machine; , vector of model parameters; , model intercept term; N=56, number of observations in training data set; x, vector of electrically-evoked compound action potential (eCAP) parameters; y, output vector; λ, regularization parameter; p=12, number of eCAP parameters; s, vector of slack parameters; C, box constraint; ϵ, error margin; a, kernel scaling factor.
Elastic net regularization was used for linear and logistic regression because it improves the accuracy of model predictions by preventing overfitting of the model to the training data. Moreover, elastic net regularization performs variable selection which produces a sparse model for improved interpretability of the model structure. SVM regression has L2 norm regularization built into its default algorithm. The hyperparameters used to find the model parameters were selected by minimizing the mean square prediction error estimated through five-fold cross validation.
Once the model parameters were found, the standardized eCAP data from each participant were mapped through the model function to obtain a predicted output variable for each participant. For linear and SVM regression, , where , , and represents the vector transpose. For logistic regression, . Finally, the output variable was scaled into the interval [0, 100] to create the CN index.
The CN index was calculated for each participant from the predicted output variable from linear and SVM regression as , where and are the maximum and minimum predicted output variables across all participants, respectively. For logistic regression, .
Statistical Analysis
Statistical modeling and analysis for this study was performed using MATLAB (Mathworks Inc., version 2019b) software. The trust-region-reflective algorithm was used to estimate parameters of the mathematical functions used in statistical modeling. The one-way analysis of variance (ANOVA) with the Tukey’s honest significant difference (HSD) post-hoc test was used to compare each eCAP parameter among study groups and across electrode locations. ANOVA and Tukey’s HSD criterion were also used to compare CN indices across study groups. One-tailed Pearson correlation analysis was used to evaluate the association between CN indices and CNC word scores measured in adult participants. The one-tailed Spearman rank correlation test was used to evaluate the association between CN indices and AzBio sentence scores measured in adult participants because the AzBio sentence scores were not normally distributed (Anderson-Darling test, p<0.001). All statistical analyses were performed at the 95% confidence level.
RESULTS
eCAP Parameters
The mean and standard deviations of eCAP parameters used in the models for all three study groups recorded at three electrode locations are shown in Figure 3. As observed in the figure, the CND group has higher and eCAP threshold values, smaller slopes of the I/O function, and longer N1 latencies at all electrode locations when compared to the other two study groups. There was a significant difference in these eCAP parameters among study groups at all electrode locations (F(2,77) ≥ 5.62, p≤0.005). Statistically significant post-hoc comparisons between study groups are indicated with asterisks in Figure 3.
Figure 3.
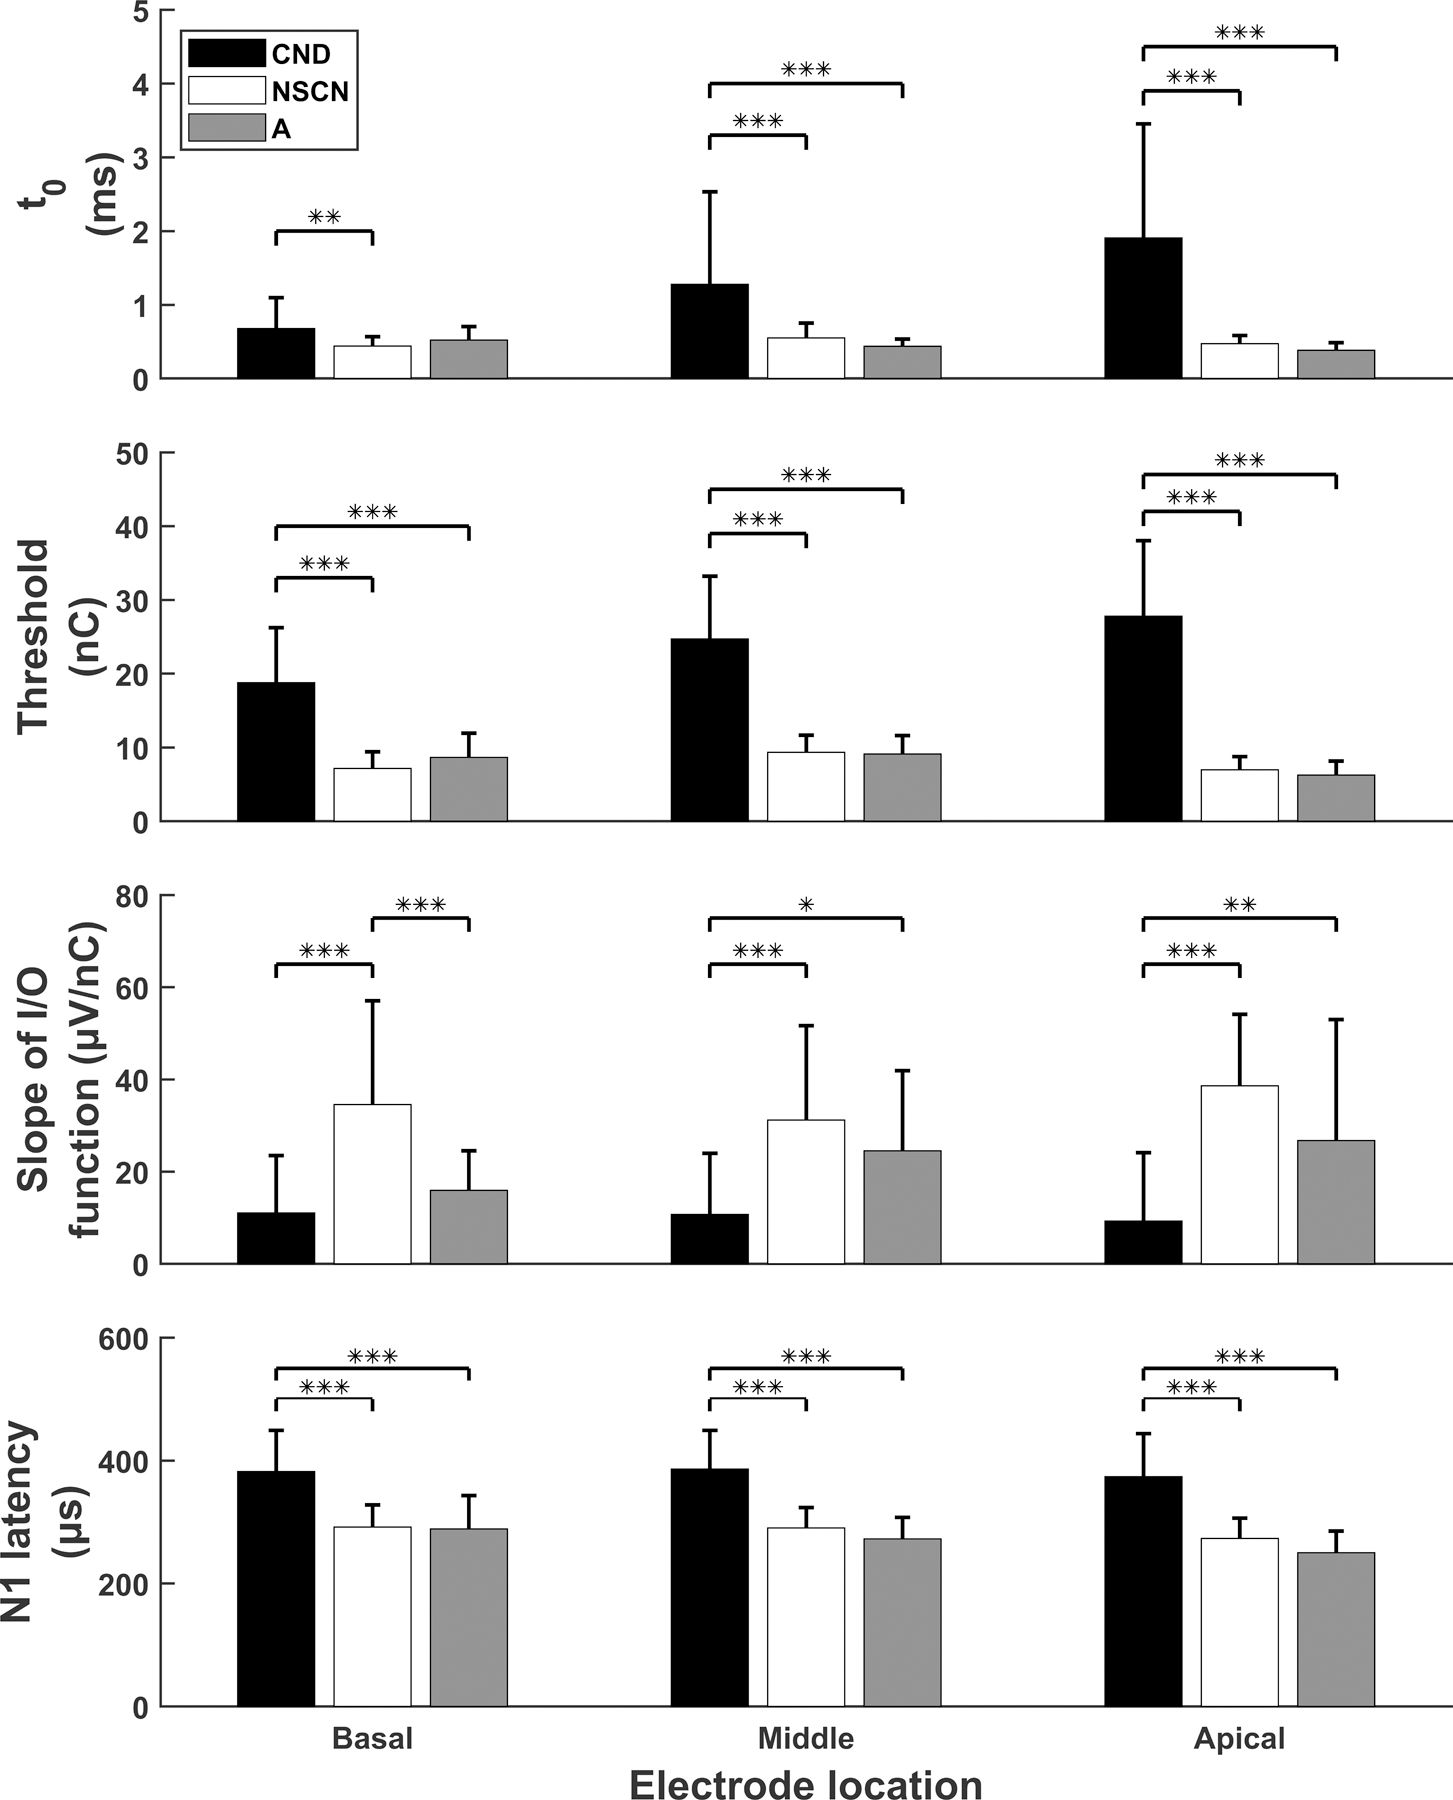
Results of eCAP parameters (mean and standard deviation) measured for three study groups. Ordered in rows from top to bottom are the estimated absolute refractory recovery times (i.e., ), eCAP thresholds, slopes of eCAP I/O functions, and N1 peak latencies. Results measured at the basal, middle and apical electrode location are provided in the left, middle and right columns, respectively. Statistically significant group comparisons are indicated with asterisks. *: p<0.05, **: p<0.01, ***: p<0.001.
Another observed trend for the CND group is that and threshold values tend to increase as the electrode location moves from the basal to more apical regions of the cochlea. Statistical analyses confirmed significantly larger (p=0.002) and higher threshold (p=0.002) values recorded at the apical electrode site than at the basal electrode site for children with CND. Trends that existed for the adult group included decreasing sample means of and N1 latency, as the electrode site moved from the base to the apex. In agreement with these observed trends, values were significantly smaller and N1 latencies were significantly shorter at the apical electrode than at the basal electrode (p=0.002 and p=0.007, respectively) for the adult CI users. No trend in the data was readily observed for the NSCN group. Details of statistical findings of each study group when comparing the eCAP parameters across electrode locations are listed in Table 2.
TABLE 2.
Statistical results when comparing eCAP parameters across electrode locations for three study groups.
| eCAP Variables | Statistical Test | CND | NSCN | Adult |
|---|---|---|---|---|
| t0 | ANOVA | F(2,69)=6.59, p=0.002 | F(2,93)=4.46, p=0.014 | F(2,69)=6.47, p=0.003 |
| HSD | B<A, p=0.002 | M>A, p = 0.012 | B>A, p = 0.002 | |
| eCAP threshold | ANOVA | F(2,69)=6.51, p=0.003 | F(2,93)=12.40, p<0.001 | F(2,69)=6.47, p=0.003 |
| HSD | B<A, p = 0.002 | B<M, p<0.001 | B>A, p=0.007 | |
| M>A, p<0.001 | M>A, p=0.001 | |||
| Slope of I/O function | ANOVA | F(2,69)=0.11, p=0.893 | F(2,93)=1.15, p=0.322 | F(2,69)=2.20, p=0.118 |
| HSD | NS | NS | NS | |
| N1 latency | ANOVA | F(2,69)=0.22, p=0.807 | F(2,93)=2.91, p=0.060 | F(2,69)=5.00, p=0.009 |
| HSD | NS | NS | B>A, p=0.007 |
ANOVA: analysis of variance; HSD: Tukey’s honest significant difference post-hoc test; CND: cochlear nerve deficiency study group; NSCN: normal-sized cochlear nerve study group; Adult, adult study group; B: basal electrode; M: middle electrode; A: apical electrode; NS: not significant; t0: estimate of absolute refractory period derived from the refractory recovery function; eCAP: electrically-evoked Compound Action Potential; I/O: input/output
Model Structure
The model parameters for each of the three predictive models are provided in Table 3. Each regression algorithm found model parameters which were substantially different from one another. However, was the largest in magnitude for all three models, when excluding the model intercept term .
TABLE 3.
Model parameters for three predictive models listed by eCAP parameter and the expected neural function at different electrode locations based on literature.
| Model parameter | eCAP parameter | Expected neural function | Regression model |
||
|---|---|---|---|---|---|
| Linear | SVM | Logistic | |||
| 0.571 | 0.633 | −0.584 | |||
| Low | −0.063 | −0.038 | −0.553 | ||
| Threshold | Low | −0.170 | −0.040 | −2.438 | |
| Slope | Low | 0 | −0.001 | −0.037 | |
| N1 latency | Low | −0.008 | −0.013 | 0 | |
| Medium | 0 | −0.009 | 0 | ||
| Threshold | Medium | −0.023 | −0.019 | −1.918 | |
| Slope | Medium | 0 | 0.008 | 0 | |
| N1 latency | Medium | −0.053 | −0.017 | −0.055 | |
| High | 0 | −0.008 | 0 | ||
| Threshold | High | 0 | −0.014 | 0 | |
| Slope | High | 0.042 | 0.011 | 0 | |
| N1 latency | High | −0.058 | −0.024 | −0.529 | |
SVM: support vector machine
CN Index
The CN index calculated using each predictive model is shown for each participant in Figure 4. A line is drawn to indicate results of each participant across models. First of all, it can be observed that CN indices for all children with CND, with one notable exception (CND12), are smaller than CN indices for children with NSCNs for each model. It is also apparent that the adult participants, as a group, had CN indices that are comparable to the children with NSCNs and greater than for children with CND. There was a significant difference in CN index between study groups for results of all models (Linear: F(2,77) = 136.11, p<0.001; SVM: F(2,77) = 136.12, p<0.001; Logistic: F(2,77) = 534.23, p<0.001). Results from multiple comparisons using Tukey’s HSD criterion showed that CN indices for children with CND were significantly smaller than CN indices for children with NSCNs and adult participants for results of all three models (p<0.001 for all comparisons). There was not a significant difference between the adult group and children with NSCNs for CN indices calculated using any of the models (Linear: p=0.91, SVM: p=0.99, Logistic: p=0.91).
Figure 4.
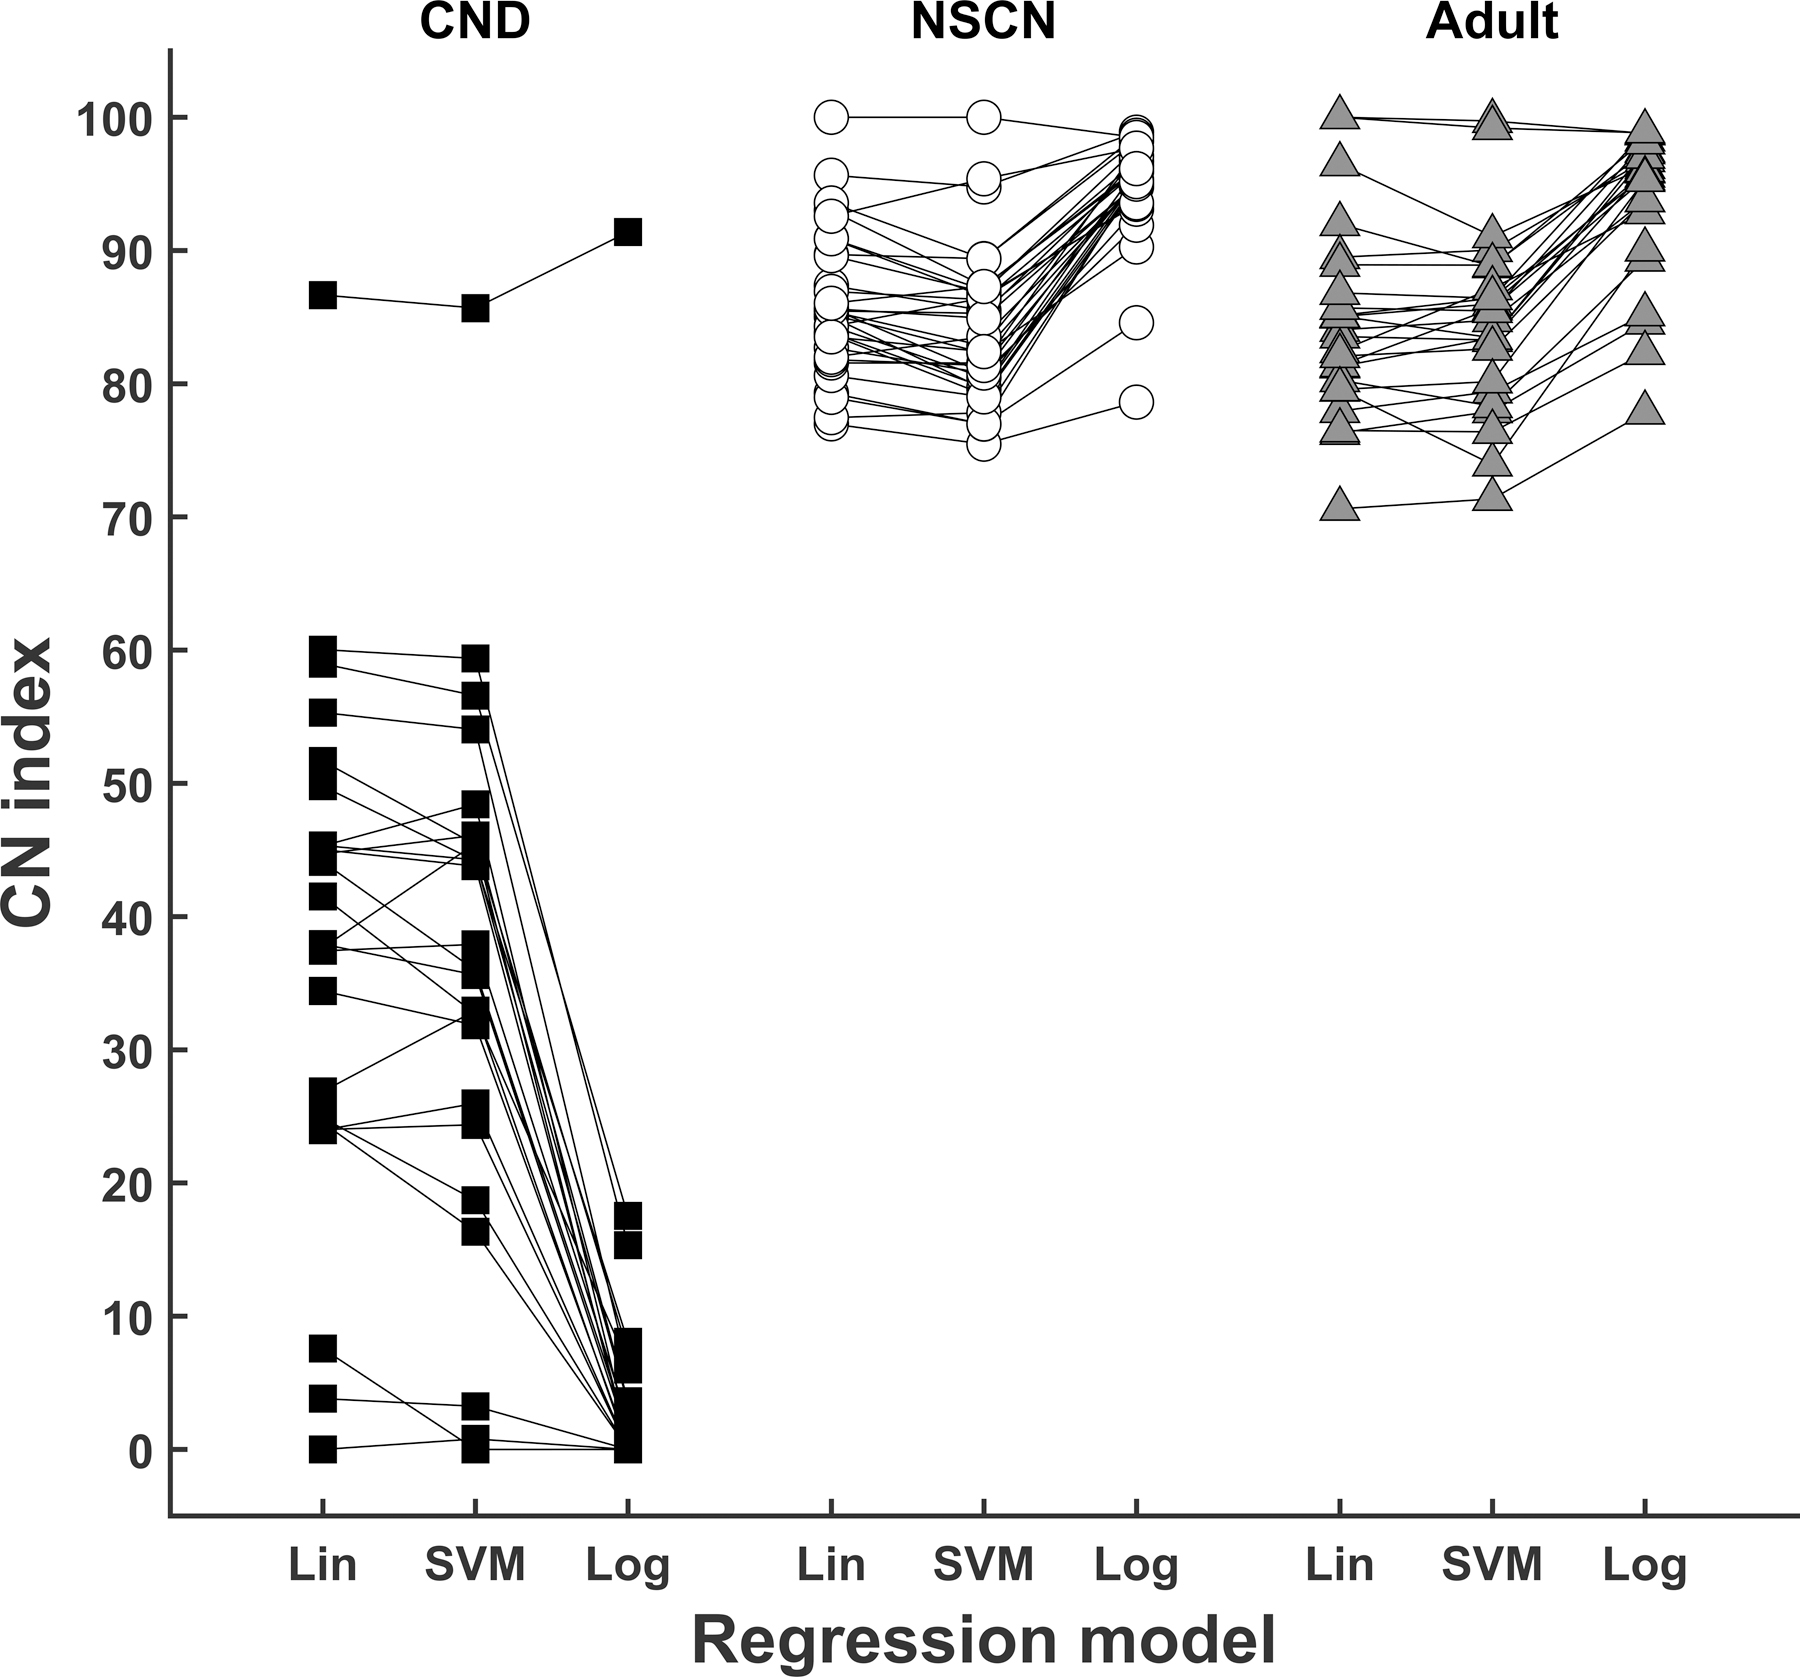
Results of cochlear nerve (CN) indices obtained from linear (Lin) regression, support vector machine (SVM) regression, and logistic (Log) regression for three study groups.
We also observe that the relative order of CN index among individual participants within each study group (i.e., rank) is generally consistent across models. While some lines cross each other, CN indices calculated using different models are generally in the same region. The change in individual rank between models, averaged across each group of study participants, was 2.25 (SD: 1.70) for children with CND, 5.19 (SD: 3.48) for children with NSCNs, and 2.75 (SD: 1.96) for adults.
Speech Perception Scores
Figure 5 shows the results of speech perception tests as a function of CN index calculated using each of the three models for all adults who participated in the study. Results of correlation analyses are included in the lower right-hand corner of each panel. Overall, correlation coefficients ranged from 0.49 to 0.73, showing that higher CN indices were associated with better performance on the speech perception tests. Results of each of the correlation tests were statistically significant and were similar for CN indices calculated using different models.
Figure 5.
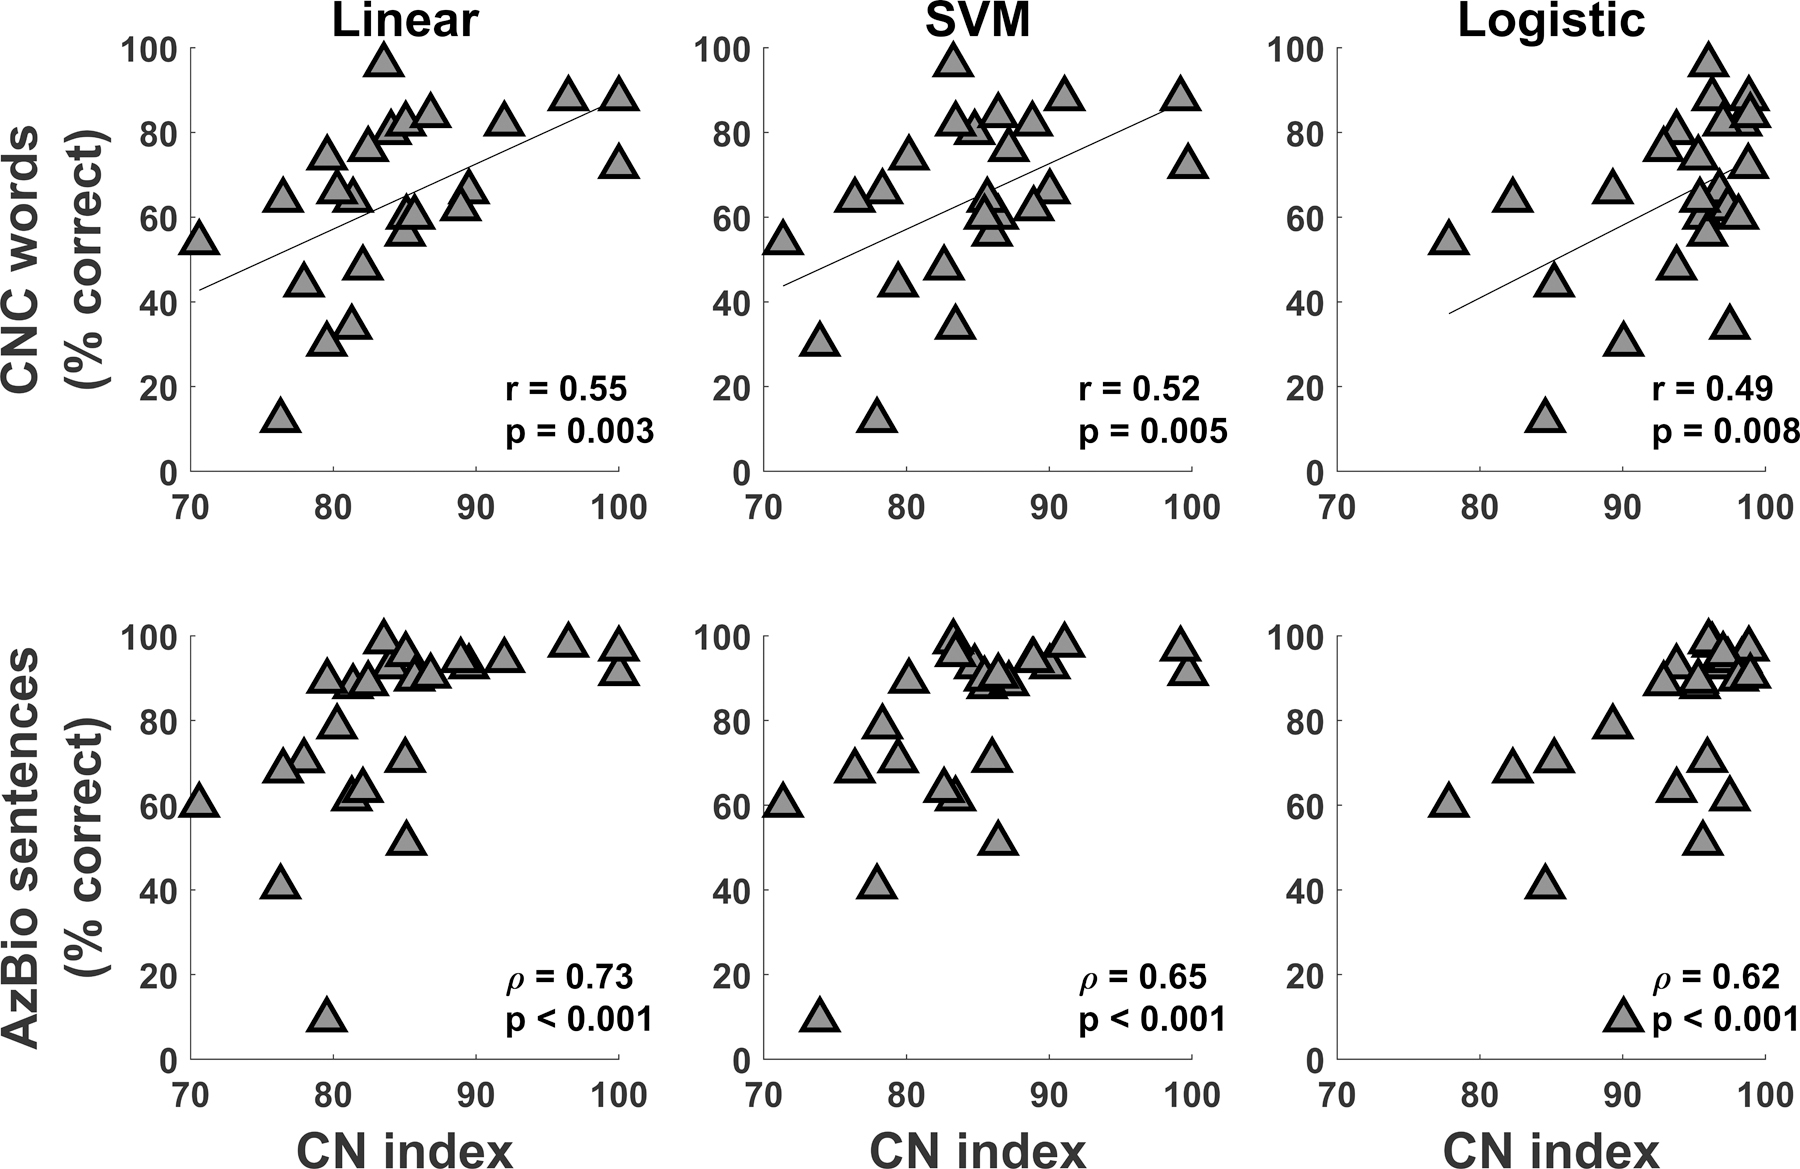
Results of speech perception of Consonant-Nucleus-Consonant (CNC) words (top row) and AzBio sentences (bottom row) as a function of cochlear nerve (CN) index for all adult participants. Results are displayed for CN indices obtained from linear regression, support vector machine (SVM) regression, and logistic regression. Results of Pearson and Spearman correlation tests are also provided in the bottom right corner of all panels.
DISCUSSION
eCAP Parameters
Results of this study showed that children with CND had significantly longer absolute refractory periods, higher eCAP thresholds, flatter slopes of I/O functions, and longer N1 latencies than children with normal-size CNs. These results are consistent with those reported in He et al. (2018, 2019a) and Xu et al. (2019).
Model Structure
Weighting Coefficients
The relative magnitude of standardized regression coefficients can be used as a measure of the importance of each input variable in predicting the output variable (Mehmood et al., 2010). Therefore, the magnitudes of the model parameters that scale the eCAP parameters (i.e., ) represent the relative importance of each eCAP parameter in creating the CN index. As seen in Table 3, the regression coefficient for the eCAP threshold at the electrode location with the lowest level of expected neural function (i.e., ) had the highest magnitude among all other regression coefficients (excluding the offset term ) in all three models. This suggests that the eCAP threshold is an important indicator for CN function, especially in regions of poorer neural function. This expectation is supported by an animal study which showed that rats with smaller densities of SGNs had higher response thresholds than normal control rats (Shepherd et. al, 2004). However, Pfingst et al. (2015b) presented results that eCAP thresholds did not predict neural survival in five guinea pigs with various degrees of SGN densities. Additionally, Ramekers et al. (2014) reported no differences in eCAP thresholds between normal hearing and deafened groups of guinea pigs. Factors accounting for the discrepancy in these study results are unclear but may include small sample sizes tested in Pfingst et al. (2015b) and differences in species tested among studies.
Machine Learning Algorithms
This study utilized the supervised machine learning algorithms of linear regression, logistic regression, and SVM regression. These techniques have been found to be useful in predicting CI outcomes (Tan et al., 2015; Ramos-Miguel et al., 2015; Guerra-Jimenez et al., 2016; Feng et al., 2018). In this study, machine learning techniques were used to create predictive models for estimating the functional status of the CN. Each algorithm produced CN indices for the adult study group that were significantly correlated with speech perception scores (Figure 5). Additionally, the relative ranking of CN index between participants of all study groups was consistent across models (Figure 4). This consistency provides strong support for the validity of the overall concept and the robustness of the approach used in this study.
While not the primary focus of this study, the machine learning algorithms utilized in this study can also be used as classification algorithms, with minor modification (see Text, Supplemental Digital Content 2, which describes the methodology). Each algorithm performs very well with classification accuracies of 91–95% (see Table B1, Supplemental Digital Content 2, which details the performance of each machine learning algorithm in classifying children with CND and children with NSCNs). This accuracy is comparable with the best classification algorithms reported for CI studies which range from 49–94% (Tan et al., 2015; Ramos-Miguel et al., 2015; Guerra-Jimenez et al., 2016; Feng et al., 2018).
CN Index
Pediatric Study Groups
This study tested the hypothesis that the predictive models created in this study would accurately stratify individual patients based on the functional status of the CN. We expected that distributions of CN index for children with CND and children with NSCNs would be distinct. Our results showed a clear separation in CN index between these two participant groups regardless of the machine learning algorithm used. These results were consistent with the study hypothesis and followed the expected data trend.
A much larger range of CN functional statuses were predicted by the linear and SVM regression model for children with CND compared to children with NSCNs, as shown by the CN index values (Figure 4). The predicted status for children with CND ranged from very poor to good functional status. This result agrees with studies that have reported large ranges in CI outcomes for children with CND (e.g., Young et al., 2012; Vincenti et al., 2014; Birman et al., 2016; Han et al., 2019). Specifically, some children with CND had no awareness of environmental sounds with CIs, while a few patients could understand speech without visual cues (Young et al., 2012; Vincenti et al., 2014; Birman et al., 2016; Han et al., 2019). Considering that CND is likely caused by arrested inner ear development during embryogenesis (Jackler et al. 1987), varying degrees of development of the CN would be expected depending on when the inner ear stops developing. This is supported by a recent study which reported large differences in the number of electrodes with recordable eCAPs in children with CND (He et al., 2018). Results of that study showed that some children with CND had recordable eCAPs at all electrode locations while eCAPs could not be measured at any electrode location in several patients tested in that same study. In contrast, eCAPs were recorded at all electrode locations for all children with NSCNs. Therefore, a wider range of CN functional status for children with CND compared to children with NSCNs, as estimated by the CN index in this study, would be expected.
One patient (CND12) had a predicted functional status within the range of children with NSCNs. Therefore, this particular patient would be expected to have outcomes similar to typical CI users. Supporting this expectation, this particular patient has developed open-set speech skills. We are currently following up with other pediatric participants tested in this study for their speech and language skill development.
Adult Study Group
For adult study participants, we expected that CN indices would be generally smaller than those for children with NSCNs but greater than those for children with CND. As we expected, the results showed that the adults had significantly greater CN index values than children with CND. However, the average CN index for the adult study group was not significantly different from the average CN index for children with NSCNs. The lack of statistical significance may be due to high CN indices measured in young adult CI users.
As a preliminary investigation into the relationship between CN function and age, we compared CN indices between the youngest and oldest adults. Specifically, CN indices were compared for the five youngest adults (Participants: A3, A7, A9, A10, and A15; Mean age at testing: 44.16, SD 11.48 years), the five oldest adults (Participants: A5, A14, A16, A17, and A19; Mean age at testing: 78.52, SD 2.61 years) and all of the children with NSCNs. Participants A5 and A7 are bilateral CI users, so a total of six ears were included in both the youngest and oldest adult groups for these comparisons. The means and standard deviations of CN indices calculated from each of the predictive models are shown in Figure 6 for children with NSCNs, the youngest adult participants, and the oldest adult participants.
Figure 6.
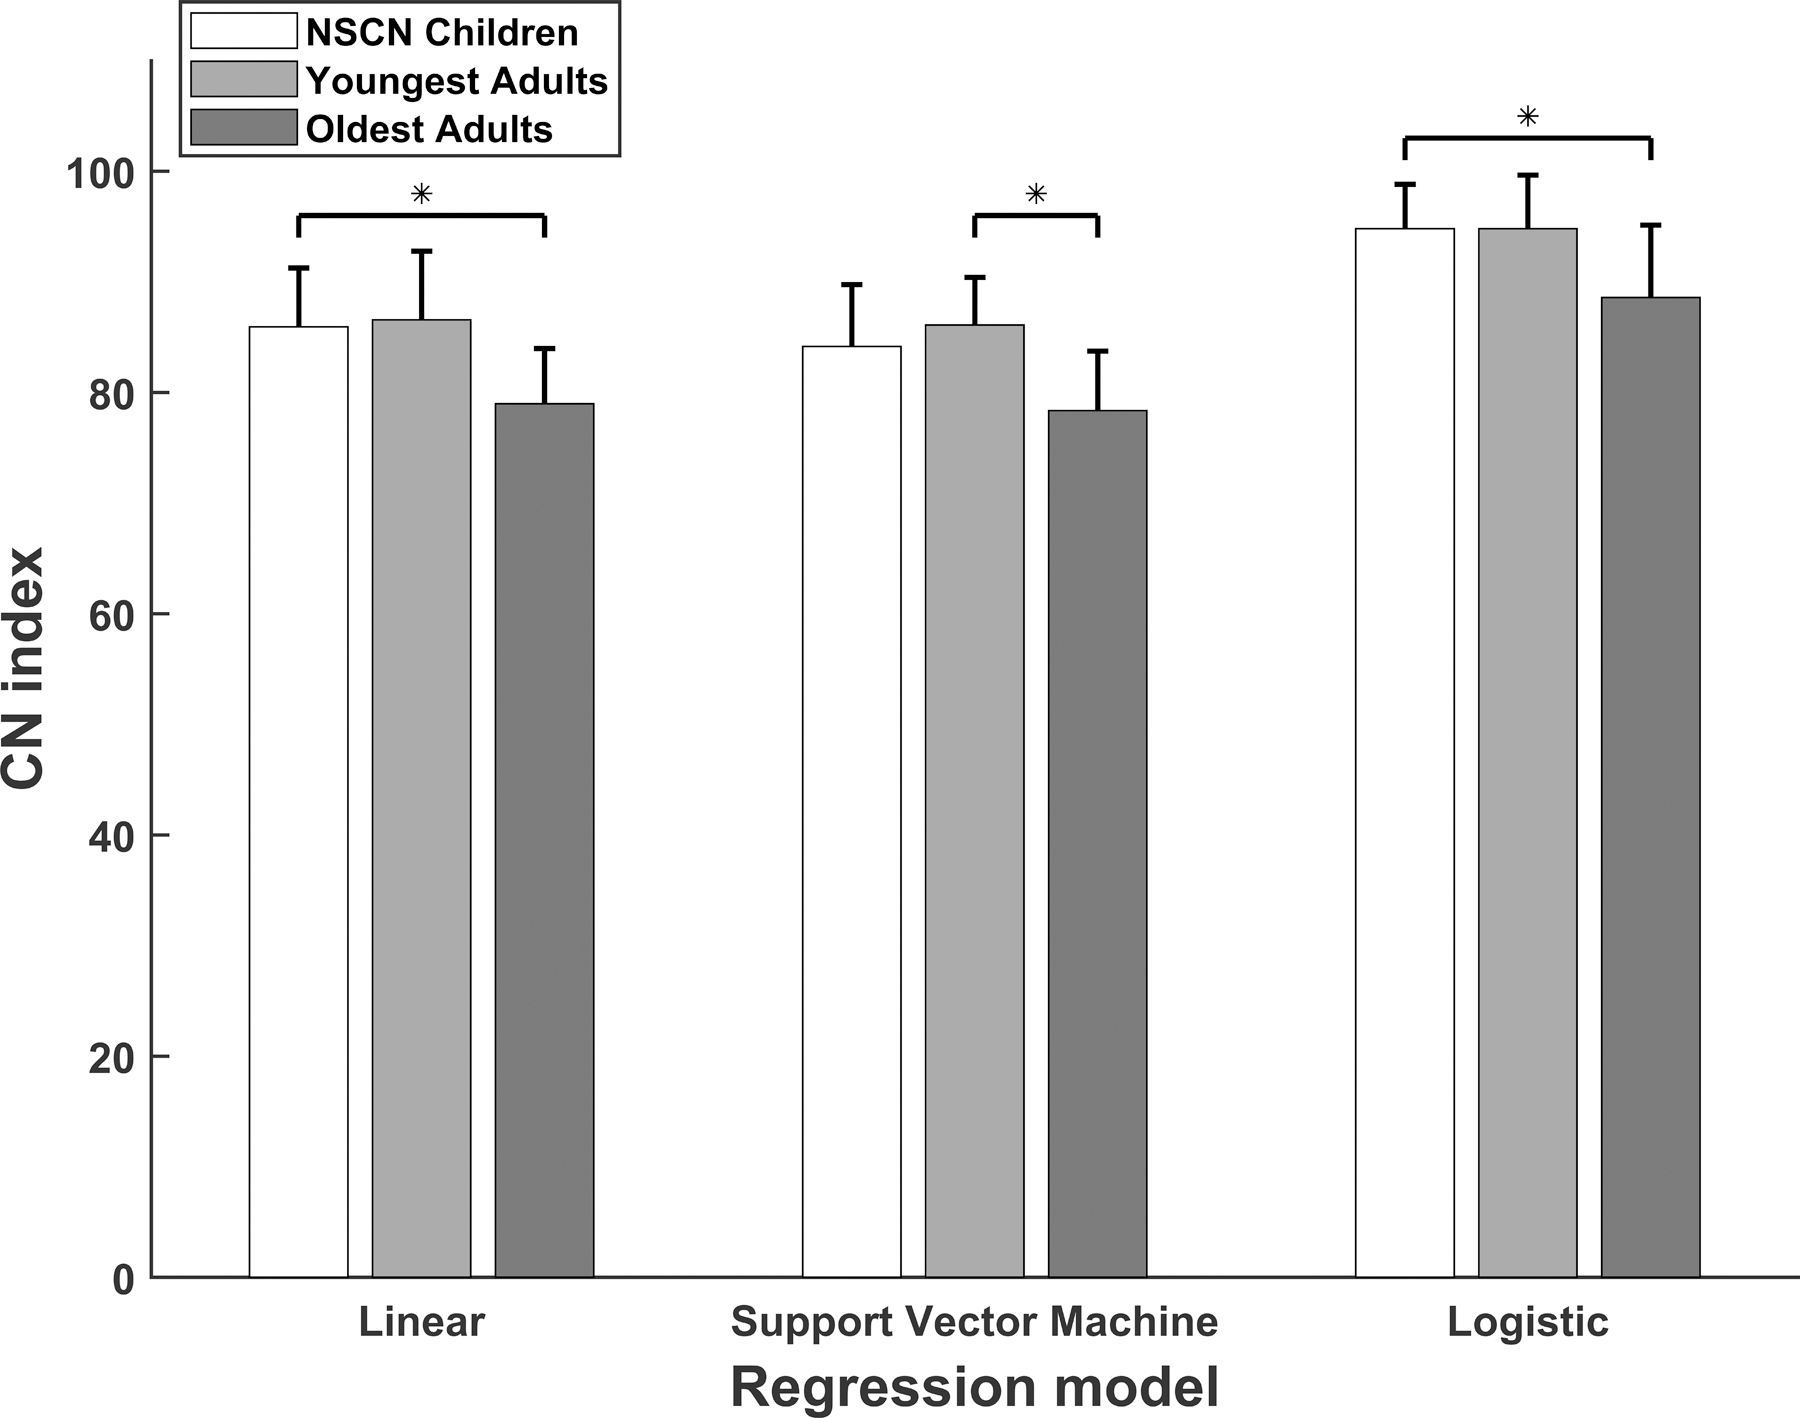
The means and standard deviations of cochlear nerve (CN) indices calculated from three predictive models for children with normal-sized CNs, the youngest adult participants, and the oldest adult participants. Statistically significant differences (p<0.05) are indicated by an asterisk.
As observed in the figure, the mean CN index value was similar for the youngest adults and the children with NSCNs, both of which were larger than that of the oldest adults for results of all three models. There was a significant difference in CN index among these groups for results of all three models (Linear: F(2,41) = 4.44, p=0.018, SVM: F(2,41) = 3.61, p=0.036, logistic F(2,41) = 4.93, p=0.012). Multiple comparisons with Tukey’s HSD criterion indicated that the oldest adult group had statistically smaller CN indices than children with NSCNs for the linear (p=0.017) and logistic (p=0.001) models, but not for the SVM model (p=0.053). The youngest adults had statistically greater CN indices than the oldest adults for the SVM model (p=0.046), but not for the linear or logistic model (p=0.050 and p=0.055, respectively). Finally, there was no statistical difference in CN index between the youngest adult group and children with NSCNs for results of any of the predictive models (Linear: p=0.962, SVM: p=0.702, Logistic: p=1.000).
The results of this exploratory investigation supports the idea that the wide range of age at testing (28.73 – 88.80 years) of adult participants may partially account for the non-significant difference in CN indices between the NSCN and the adult study group. Moreover, these data suggest that older patients have worse CN function (as indicated by smaller CN indices), which agrees with other studies showing deteriorating CN function with advanced age (e.g., McFadden et al., 1997; Makary et al., 2011; Viana et al., 2015; Wu et al., 2019). A comprehensive analysis of the effect of aging on CN function is currently under investigation as a separate study. Nevertheless, the present investigation provides additional support for the idea that the CN index developed in this study reflects CN functional status.
We also expected that CN index would be positively correlated with speech outcome measures. Confirming this expectation, CN index was positively and significantly correlated with speech perception of CNC words and AzBio sentences in quiet (Figure 5). Significant correlations were observed for CN indices calculated using each predictive model. This result supports the idea that the CN index represents overall CN function because CI outcomes are related to CN function (Kim et al., 2010; Zhou & Pfingst, 2014; Schvartz-Leyzac & Pfingst, 2018; He et al., 2018). Furthermore, this result shows the utility and benefit of employing machine learning approaches to predict CI outcomes, which may have implications for patient treatment and counseling.
Study Limitations
One potential study limitation is the assumption that patterns of neural function for an individual patient follow the trend of their patient population. Specifically, the CN index is derived with the assumption that children with CND have better CN function in basal regions compared to apical regions, and vice versa for children with NSCNs and adult patients. While the literature confirms these overall trends (e.g., Propst et al., 2006; Gordon et al., 2007; Brill et al., 2009; Hughes et al., 2009; He et al., 2018), individual variations exist. Any deviations from the expected pattern will affect the CN index calculation. This limitation could be eliminated with a future optimized model that predicts CN function at individual electrode sites.
Another potential limitation is that the eCAP is a neurophysiological response that depends on a sufficient number of CN fibers responding synchronously to electrical stimulations. Therefore, it is a composite measure of overall CN neural survival and the integrity of individual CN fibers. As such, it is not known if poorer eCAP responses are due to a decreased number of CN fibers or due to degeneration of existing CN fibers. Moreover, this may be different across patient populations. For example, eCAP responses might primarily be affected by the few number of intact CN fibers for children with CND, whereas, children with NSCNs and adult patients may have a large number of degenerated CN fibers. Currently, the effect of various pathologies on eCAP responses is not well understood. Nevertheless, the eCAP is a useful response for characterizing the functional status of the CN.
Finally, the models created in this study are not able to predict CN function at individual electrode sites. Rather, the models presented in this study predict overall CN function across multiple electrodes. We are currently investigating methods for predicting neural function at individual electrode sites, which may be useful in programming individual patient CI settings.
CONCLUSIONS
This study presented models created using three supervised machine learning techniques that generate an index for the functional status of the CN based on eCAP recordings for individual patients. All three models successfully stratified CI patients based on their CN functional statuses. Specifically, children with NSCNs had significantly better predicted CN functions than children with CND. Adult CI users had a range of predicted CN functions that were positively and significantly correlated with scores on speech perception tests. Results of this study suggested that these models may be useful for developing objective clinical tools for optimizing CI programming settings and predicting CI outcomes for individual CI patients.
Supplementary Material
ACKNOWLEDGMENTS
We gratefully thank all participants and their families for engaging in this study. We also thank the three anonymous reviewers for their insightful comments and suggestions.
Source of Funding:
This work was supported by the R01 grant from NIDCD (R01DC017846) and the R01 grant from NIDCD and NIGMS (R01DC016038).
Footnotes
Conflict of Interest: None.
REFERENCES
- Abbas PJ, Brown CJ, Shallop JK, et al. (1999). Summary of results using the nucleus CI24M implant to record the electrically evoked compound action potential. Ear Hear, 20, 45–59. [DOI] [PubMed] [Google Scholar]
- Abbas PJ, Hughes M, Brown CJ, et al. (2004). Channel Interaction in Cochlear Implant Users Evaluated Using the Electrically Evoked Compound Action Potential. Audiol Neurootol 9. 203–13. [DOI] [PubMed] [Google Scholar]
- Adunka OF, Roush PA, Teagle HF, et al. (2006). Internal auditory canal morphology in children with cochlear nerve deficiency. Otol Neurotol, 27, 793–801. [DOI] [PubMed] [Google Scholar]
- Beyea JA, Mcmullen KP, Harris MS, et al. (2016). Cochlear Implants in Adults. Otol Neurotol, 37, 1238–1245. [DOI] [PubMed] [Google Scholar]
- Birman CS, Powell HR, Gibson WP, et al. (2016). Cochlear implant outcomes in cochlea nerve aplasia and hypoplasia. Otol Neurotol, 37, 438–445. [DOI] [PubMed] [Google Scholar]
- Blamey P, Artieres F, Başkent D, et al. (2013). Factors affecting auditory performance of postlinguistically deaf adults using cochlear implants: an update with 2251 patients. Audiol Neurootol, 18(1), 36–47. [DOI] [PubMed] [Google Scholar]
- Botros A, Psarros C (2010). Neural Response Telemetry Reconsidered: II. The Influence of Neural Population on the ECAP Recovery Function and Refractoriness. Ear Hear, 31, 380–391. [DOI] [PubMed] [Google Scholar]
- Botros A, van Dijk B, Killian M (2007). AutoNR: An automated system that measures ECAP thresholds with the Nucleus Freedom cochlear implant via machine intelligence. Artif Intell Med 40:15–28. [DOI] [PubMed] [Google Scholar]
- Brill S, Müller J, Hagen R, et al. (2009). Site of cochlear stimulation and its effect on electrically evoked compound action potentials using the MED-EL standard electrode array. BioMed Eng OnLine 8, 40. [DOI] [PMC free article] [PubMed] [Google Scholar]
- Brown CJ, Abbas PJ, Gantz B (1990). Electrically evoked whole-nerve action potentials: data from human cochlear implant users. J Acoust Soc Am, 88, 1385–1391. [DOI] [PubMed] [Google Scholar]
- Brown CJ, Abbas PJ, Gantz B (1998). Preliminary experience with Neural Response Telemetry in the Nucleus CI24M cochlear implant. Am. J. Otol 19, 320–327. [PubMed] [Google Scholar]
- Buchman CA, Roush PA, Teagle HF, et al. (2006). Auditory neuropathy characteristics in children with cochlear nerve deficiency. Ear Hear, 27, 399–408. [DOI] [PubMed] [Google Scholar]
- Clemmens CS, Guidi J, Caroff A, et al. (2013). Unilateral cochlear nerve deficiency in children. Otolaryngol Head Neck Surg, 149, 318–325. [DOI] [PubMed] [Google Scholar]
- Crowson MG, Lin V, Chen JM, & Chan TC (2020). Machine Learning and Cochlear Implantation-A Structured Review of Opportunities and Challenges. Otol Neurotol. 41(1), e36–e45. [DOI] [PubMed] [Google Scholar]
- Dryden A, Allen HA, Henshaw H, et al. (2017). The association between cognitive performance and speech-in-noise perception for adult listeners: a systematic literature review and meta-analysis. Trend Hear, 21, 1–21. [DOI] [PMC free article] [PubMed] [Google Scholar]
- Feng G, Ingvalson EM, Grieco-Calub TM, et al. (2018). Neural preservation underlies speech improvement from auditory deprivation in young cochlear implant recipients. Proc Natl Acad Sci USA 115:E1022–31. [DOI] [PMC free article] [PubMed] [Google Scholar]
- Firszt JB, Holden LK, Skinner MW, et al. (2004). Recognition of speech presented at soft to loud levels by adult cochlear implant recipients of three cochlear implant systems. Ear Hear, 25, 375–87. [DOI] [PubMed] [Google Scholar]
- Fulmer SL, Runge CL, Jensen JW, et al. (2010). Rate of Neural Recovery in Implanted Children with Auditory Neuropathy Spectrum Disorder. JAMA Otolaryngol Head Neck Surg, 144, 274–279. [DOI] [PubMed] [Google Scholar]
- Garadat SN, Zwolan TA, & Pfingst BE (2012). Across-site patterns of modulation detection: relation to speech recognition. J Acoust Soc Am, 131(5), 4030–4041. [DOI] [PMC free article] [PubMed] [Google Scholar]
- Gartner L, Lenarz T, Joseph G, Buchner A (2010). Clinical use of a system for the automated recording and analysis of electrically evoked compound action potentials (ECAPs) in cochlear implant patients. Acta Otolaryngol 130:724–32. [DOI] [PubMed] [Google Scholar]
- Glastonbury CM, Davidson HC, Harnsberger HR, Butler J, Kertesz TR and Shelton C (2002). Imaging findings of cochlear nerve deficiency. AJNR Am J Neuroradiol, 23(4), pp.635–643. [PMC free article] [PubMed] [Google Scholar]
- Gordon K, Papsin B, Harrison R (2007). Auditory brainstem activity and development evoked by apical versus basal cochlear implant electrode stimulation in children. Clin Neurophysiol, 118, 1671–1684. [DOI] [PubMed] [Google Scholar]
- Guerra-Jimenez G, Ramos De Miguel A, Falcon Gonzalez JC et al. (2016). Cochlear implant evaluation: Prognosis estimation by data mining system. J Int Adv Otol 12:1–7. [DOI] [PubMed] [Google Scholar]
- Han JJ, Suh MW, Park MK, et al. (2019). A Predictive Model for Cochlear Implant Outcome in Children with Cochlear Nerve Deficiency. Sci Rep, 9(1), 1154. [DOI] [PMC free article] [PubMed] [Google Scholar]
- He S, Shahsavarani BS, McFayden TC, et al. (2018). Responsiveness of the electrically stimulated cochlear nerve in children with cochlear nerve deficiency. Ear Hear, 39, 238–250. [DOI] [PMC free article] [PubMed] [Google Scholar]
- He S, Xu L, Skidmore J, et al. (2019a). The effect of interphase gap on neural response of the electrically-stimulated cochlear nerve in children with cochlear nerve deficiency and children with normal-sized cochlear nerves. Ear Hear, October. 31 (Epub ahead of print). [DOI] [PMC free article] [PubMed] [Google Scholar]
- He S, Chao XH, Wang RJ, et al. (2019b). Recommendations for measuring the electrically evoked compound action potential in children with cochlear nerve deficiency. Ear Hear, Sep 13 (Epub ahead of print). [DOI] [PMC free article] [PubMed] [Google Scholar]
- He S, Teagle HFB, Buchman C (2017). The electrically evoked compound action potential: from laboratory to clinic. Front Neurosci, 11:339. [DOI] [PMC free article] [PubMed] [Google Scholar]
- Holden LK, Finley CC, Firszt JB, et al. (2013). Factors affecting open-set word recognition in adults with cochlear implants. Ear Hear, 34, 342–360. [DOI] [PMC free article] [PubMed] [Google Scholar]
- Hughes ML, & Stille LJ (2009). Psychophysical and physiological measures of electrical-field interaction in cochlear implants. J. Acoust. Soc. Am, 125(1), 247–260. [DOI] [PMC free article] [PubMed] [Google Scholar]
- Jackler RK, Luxford WM, House WF (1987). Congenital malformations of the inner ear: a classification based on embryogenesis. Laryngoscope, 97(3 Pt 2; Suppl 40), 2–14. [DOI] [PubMed] [Google Scholar]
- Kang WS, Lee JH, Lee HN, & Lee KS (2010). Cochlear implantations in young children with cochlear nerve deficiency diagnosed by MRI. Otolaryngology—Head and Neck Surgery, 143(1), 101–108. [DOI] [PubMed] [Google Scholar]
- Kim JR, Abbas PJ, Brown CJ, et al. (2010). The relationship between electrically evoked compound action potential and speech perception: a study in cochlear implant users with short electrode array. Otol Neurotol, 31, 1041–1048. [DOI] [PMC free article] [PubMed] [Google Scholar]
- Kirby AE, & Middlebrooks JC (2010). Auditory temporal acuity probed with cochlear implant stimulation and cortical recording. J Neurophysiol, 103(1), 531–542. [DOI] [PMC free article] [PubMed] [Google Scholar]
- Kirby AE, & Middlebrooks JC (2012). Unanesthetized auditory cortex exhibits multiple codes for gaps in cochlear implant pulse trains. J Assoc Res Otolaryngol, 13(1), 67–80. [DOI] [PMC free article] [PubMed] [Google Scholar]
- Kutz JW Jr, Lee KH, Isaacson B, et al. (2011). Cochlear implantation in children with cochlear nerve absence or deficiency. Otol Neurotol, 32, 956–961. [DOI] [PubMed] [Google Scholar]
- Lazard DS, Vincent C, Venail F, et al. (2012). Pre-, per- and postoperative factors affecting performance of postlinguistically deaf adults using cochlear implants: a new conceptual model over time. PLoS One, 7, e48739. [DOI] [PMC free article] [PubMed] [Google Scholar]
- Lee ER, Friedland DR, Runge CL (2012). Recovery From Forward Masking in Elderly Cochlear Implant Users. Otol Neurotol, 33, 355–363. [DOI] [PubMed] [Google Scholar]
- Long CJ, Holden TA, McClelland GH, et al. (2014). Examining the electro-neural interface of cochlear implant users using psychophysics, CT scans, and speech understanding. J Assoc Res Otolaryngol, 15(2), 293–304. [DOI] [PMC free article] [PubMed] [Google Scholar]
- Luo JF, Xu L, Chao XH, et al. (2019). The effects of GJB2 and SLC26A4 gene mutations on neural response of the electrically-stimulated auditory nerve in children. Ear Hear, (in press). [DOI] [PubMed]
- Makary CA, Shin J, Kujawa SG, et al. (2011) Age-Related Primary Cochlear Neuronal Degeneration in Human Temporal Bones. JARO 12, 711–717. [DOI] [PMC free article] [PubMed] [Google Scholar]
- McFadden SL, Campo P, Quaranta N, et al. (1997). Age-related decline of auditory function in the chinchilla (Chinchilla laniger). Hear. Res, 111, 114–126. [DOI] [PubMed] [Google Scholar]
- Mehmood T, Liland KH, Snipen L, et al. (2012). A review of variable selection methods in Partial Least Squares Regression. Chemometrics and Intelligent Laboratory Systems, 118, 62–69. [Google Scholar]
- Miller CA, Abbas PJ, Brown CJ (2000). An Improved Method of Reducing Stimulus Artifact in the Electrically Evoked Whole-Nerve Potential. Ear Hear, 21, 280–290. [DOI] [PubMed] [Google Scholar]
- Moberly AC, Bates C, Harris MS, et al. (2016). The Enigma of Poor Performance by Adults with Cochlear Implants. Otol Neurotol, 37, 1522–1528. [DOI] [PMC free article] [PubMed] [Google Scholar]
- Morsnowski A, Charasse B, Collet L, et al. (2006). Measuring the Refractoriness of the Electrically Stimulated Auditory Nerve. Audiol Neurootol, 11, 389–402. [DOI] [PubMed] [Google Scholar]
- MSTB (2011). Minimum speech test battery for adult cochlear implant users http://auditorypotential.com/MSTBfiles/MSTBManual2011-06-20.pdf. Accessed Nov 12, 2019.
- Nuesse T, Steenken R, Neher T, et al. (2018). Exploring the link between cognitive abilities and speech recognition in the elderly under different listening conditions. Front Psychol, 9, 678. [DOI] [PMC free article] [PubMed] [Google Scholar]
- Peterson GE, & Lehiste I (1962). Revised CNC lists for auditory tests. J Speech Hear Disord, 27(1), 62–70. [DOI] [PubMed] [Google Scholar]
- Pfingst BE, Colesa DJ, Watts MM, et al. (2017). Neurotrophin gene therapy in deafened ears with cochlear implants: long-term effects on nerve survival and functional measures. J Assoc Res Otolaryngol, 18, 731–750. [DOI] [PMC free article] [PubMed] [Google Scholar]
- Pfingst BE, Hughes AP, Colesa DJ, et al. (2015a). Insertion trauma and recovery of function after cochlear implantation: evidence from objective functional measures. Hear Res, 330, 98–105. [DOI] [PMC free article] [PubMed] [Google Scholar]
- Pfingst BE, Zhou N, Colesa DJ, et al. (2015b). Importance of cochlear health for implant function. Hear Res, 322, 77–88. [DOI] [PMC free article] [PubMed] [Google Scholar]
- Prado-Guitierrez P, Fewster LM, Heasman JM, et al. (2006). Effect of interphase gap and pulse duration on electrically evoked potentials is correlated with auditory nerve survival. Hear Res, 215, 47–55. [DOI] [PMC free article] [PubMed] [Google Scholar]
- Propst EJ, Papsin BC, Stockley TL, et al. (2006). Auditory responses in cochlear implant users with and without GJB2 deafness. Laryngoscope, 116, 317–327. [DOI] [PubMed] [Google Scholar]
- Ramekers D, Versnel H, Strahl SB, et al. (2014). Auditory-nerve response to varied inter-phase gap and phase duration of the electric pulse stimulus as predicators for neuronal degeneration. J Assoc Res Otolaryngol, 15, 187–202. [DOI] [PMC free article] [PubMed] [Google Scholar]
- Ramos-Miguel A, Perez-Zaballos T, Perez D, et al. (2015). Use of data mining to predict significant factors and benefits of bilateral cochlear implantation. Eur Arch Otorhinolaryngol 272:3157–62. [DOI] [PubMed] [Google Scholar]
- Schvartz-Leyzac KC, Pfingst BE (2018). Assessing the relationship between the electrically evoked compound action potential and speech recognition abilities in bilateral cochlear implant recipients. Ear Hear, 39, 344–358. [DOI] [PMC free article] [PubMed] [Google Scholar]
- Shepherd RK, Roberts LA, Paolini AG (2004). Long-term sensorineural hearing loss induces functional changes in the rat auditory nerve. Eur J Neurosci, 20, 3131–3140. [DOI] [PubMed] [Google Scholar]
- Spahr AJ, Dorman MF, Litvak LM, et al. (2012). Development and validation of the AzBio sentence lists. Ear Hear, 33(1), 112. [DOI] [PMC free article] [PubMed] [Google Scholar]
- Tan L, Holland SK, Deshpande AK, et al. (2015). A semi-supervised Support Vector Machine model for predicting the language outcomes following cochlear implantation based on preimplant brain fMRI imaging. Brain Behav 5:1–25. [DOI] [PMC free article] [PubMed] [Google Scholar]
- Teagle HF, Roush PA, Woodard JS, et al. (2010). Cochlear implantation in children with auditory neuropathy spectrum disorder. Ear Hear, 31, 325–335. [DOI] [PubMed] [Google Scholar]
- Van de Heyning P, Arauz SL, Atlas M, et al. (2016). Electrically evoked compound action potentials are different depending on the site of cochlear stimulation. Cochlear Implants Int, 17, 251–262. [DOI] [PubMed] [Google Scholar]
- van Dijk B, Botros AM, Battmer RD, et al. (2007). Clinical results of AutoNRT™, a completely automatic ECAP recording system for cochlear implants. Ear Hear 28:558–70. [DOI] [PubMed] [Google Scholar]
- Viana LM, O’Malley JT, Burgess BJ, et al. (2015). Cochlear neuropathy in human presbycusis: Confocal analysis of hidden hearing loss in post-mortem tissue. Hear Res, 327, 78–88. [DOI] [PMC free article] [PubMed] [Google Scholar]
- Vincenti V, Ormitti F, Ventura E, et al. (2014). Cochlear implantation in children with cochlear nerve deficiency. Int J Pediatr Otorhinolaryngol, 78, 912–917. [DOI] [PubMed] [Google Scholar]
- Wei X, Li Y, Chen B, et al. (2017). Predicting auditory outcomes from radiological imaging in cochlear implant patients with cochlear nerve deficiency. Otol Neurotol, 38(5), 685–693. [DOI] [PubMed] [Google Scholar]
- Wiemes GRM, Hamerschmidt R, Moreira ATR, et al. (2016). Auditory Nerve Recovery Function in Cochlear Implant Surgery with Local Anesthesia and Sedation versus General Anesthesia. Audiol Neurootol, 21, 150–157. [DOI] [PubMed] [Google Scholar]
- Wu PZ, Liberman LD, Bennett K, et al. (2019). Primary Neural Degeneration in the Human Cochlea: Evidence for Hidden Hearing Loss in the Aging Ear. Neuroscience, 407, 8–20. [DOI] [PMC free article] [PubMed] [Google Scholar]
- Xu L, Skidmore J, Luo J, et al. (2019). The effect of pulse polarity on neural response of the electrically-stimulated cochlear nerve in children with cochlear nerve deficiency and children with normal-sized cochlear nerves. Ear Hear (Accepted) [DOI] [PMC free article] [PubMed]
- Young NM, Kim FM, Ryan ME, et al. (2012). Pediatric cochlear implantation of children with eighth nerve deficiency. Int J Pediatr Otorhinolaryngol, 76, 1442–1448. [DOI] [PubMed] [Google Scholar]
- Zekveld A, Kramer SE, & Festen J (2011). Cognitive load during speech perception in noise: the influence of age, hearing loss, and cognition on pupil response. Ear Hear, 32, 498–510. [DOI] [PubMed] [Google Scholar]
- Zhou N, Pfingst BE (2014). Relationship between multipulse integration and speech recognition with cochlear implants. J Acoust Soc Am, 136, 1257–1268. [DOI] [PMC free article] [PubMed] [Google Scholar]
Associated Data
This section collects any data citations, data availability statements, or supplementary materials included in this article.