

Abstract
Osteogenesis imperfecta (OI) is a heterogeneous heritable connective tissue disorder associated with reduced bone mineral density and skeletal fragility. Bone is inherently mechanosensitive, with bone strength being proportional to muscle mass and strength. Physically active healthy children accrue more bone than inactive children. Children with type I OI exhibit decreased exercise capacity and muscle strength compared with healthy peers. It is unknown whether this muscle weakness reflects decreased physical activity or a muscle pathology. In this study, we used heterozygous G610C OI model mice (+/G610C), which model both the genotype and phenotype of a large Amish OI kindred, to evaluate hindlimb muscle function and physical activity levels before evaluating the ability of +/G610C mice to undergo a treadmill exercise regimen. We found +/G610C mice hindlimb muscles do not exhibit compromised muscle function, and their activity levels were not reduced relative to wild-type mice. The +/G610C mice were also able to complete an 8-week treadmill regimen. Biomechanical integrity of control and exercised wild-type and +/G610C femora were analyzed by torsional loading to failure. The greatest skeletal gains in response to exercise were observed in stiffness and the shear modulus of elasticity with alterations in collagen content. Analysis of tibial cortical bone by Raman spectroscopy demonstrated similar crystallinity and mineral/matrix ratios regardless of sex, exercise, and genotype. Together, these findings demonstrate +/G610C OI mice have equivalent muscle function, activity levels, and ability to complete a weight-bearing exercise regimen as wild-type mice. The +/G610C mice exhibited increased femoral stiffness and decreased hydroxyproline with exercise, whereas other biomechanical parameters remain unaffected, suggesting a more rigorous exercise regimen or another exercise modality may be required to improve bone quality of OI mice.
Keywords: OSTEOGENESIS IMPERFECTA, EXERCISE, BONE, MUSCLE, COLLAGEN CROSS-LINKS
Introduction
A primary predictor of bone fragility is peak bone mass, and its accrual is the result of a combination of genetic and environmental factors, with up to 70% attributed to heritable factors(1) and the remaining to a combination of environmental factors such as physical activity, diet, and hormones.(1,2) Skeletal muscles impose some of the greatest forces on bone, suggesting muscle size and strength are primary determinants of bone strength.(3,4) Increasing skeletal muscle mass and strength via exercise increases the mechanical load on bone and induces direct osteogenic effects.(2-5)
Osteogenesis imperfecta (OI) is a heritable connective tissue disorder characterized by small stature, reduced bone mineral density, and frequent fractures.(6-9) Although it is well established that the autosomal dominant forms of OI are predominantly owing to type I collagen gene defects (COL1A1 and COL1A2 genes), the rarer autosomal recessive forms (2% to 5% of individuals with OI reported in North America and Europe) have been shown to be attributable to defects in collagen processing proteins leading to incorrect folding and posttranslational modification and to defects in osteoblast commitment, differentiation, and function.(7-9) The autosomal dominant forms of OI include five subtypes of OI (I–V), ranging from mild skeletal fragility to perinatal lethality.(7,9) The recent classification proposed by Van Dijk and Sillence(9) includes the four classical autosomal dominant subtypes of OI (I–IV)(10) and the newly classified autosomal dominant OI type V owing to mutations in the IFITM5 gene coding for Interferon-induced transmembrane protein 5.(11,12)
Although the primary clinical presentation of OI is frequent fracture, muscle weakness and fatigue have also been reported in both children(13-16) and in the oim OI mouse model.(17) Children with type I OI have significantly reduced exercise capacity and muscle force compared with healthy, active children.(14,15) However, it is unknown whether the muscle weakness in individuals with OI is mutation specific,(15) the result of a muscle pathology, or caused by avoidance of physical activity potentially because of associated pain,(18) casting and surgical procedures,(14,18) or a behavioral choice.(18,19) Bailey and colleagues demonstrated that healthy children who were physically active accrued 10% to 40% more bone (region specific) than inactive children.(20) Detter and colleagues recently demonstrated that a 6-year moderately intense daily exercise program in prepubertal healthy children improved bone mass, as well as skeletal architecture.(21) The reduced exercise capacity and/or lack of physical activity of children with OI especially during the critical pubertal growth spurt may result in even poorer bone health as adults.
The heterozygous G610C (+/G610C) OI model mouse carries the equivalent gene defect and has reduced bone mineral density and similar skeletal weakness as individuals of a large Amish kindred with type I/IV OI.(22) In light of the reported muscle weakness and reduced exercise capacity in human individuals with type I OI(14,15) and the inherent muscle pathology in oim mice,(17) we sought to investigate if +/G610C mice have a muscle pathology or altered activity levels before evaluating their ability to undergo a weight-bearing exercise regimen. We demonstrate that, in contrast to the oim mouse model, the +/G610C mice did not exhibit a muscle pathology or altered locomotor activity levels and that they were able to complete an 8-week weight-bearing treadmill exercise regimen. Femora from exercised +/G610C mice demonstrated gains in whole bone stiffness and material shear elastic modulus, whereas other skeletal parameters were unchanged.
Materials and Methods
Experimental model
The G610C mouse has a knock-in mutation in its Col1a2 gene, specifically a G-to-T transversion at nucleotide 2098, resulting in a glycine to cysteine substitution at position 610 of the triple helical domain of the α2(I) chain of type I collagen.(22) Heterozygote G610C (+/G610C; Col1a2tm1.1Mcbr) mice on the C57BL/6J congenic background were a gift from Dr Daniel McBride.(22) Col1a2tm1.1Mcbr mice (stock number 007248) are publicly available from Jackson Laboratory (Bar Harbor, ME, USA). Before the beginning of this study, the +/G610C mice were repeatedly backcrossed into wild-type C57BL/6J mice (stock number 000664, Jackson Laboratory) for greater than 10 generations. Subsequently, the colony was maintained by repeated backcrossing into C57BL/6J mice approximately every second generation. The mice were genotyped as previously described(22) and had ad libitum access to water and food (Purina 5008 Formulab Diet; Purina Mills Inc., St Louis, MO, USA). The animals were housed and the protocols used for this study performed in an AAALAC-accredited facility at the University of Missouri and comply with the guidelines of the American Physiological Society. All experimental manipulations were performed under an approved University of Missouri Animal Care and Use Protocol. For the following analyses, hindlimb skeletal muscles, tibias, and femora were harvested and evaluated from 4-month-old male and female wild-type (Wt) and +/G610C mice that were randomly distributed into two groups of 9 to 10 mice each: control (normal cage activity) and treadmill (weight-bearing) exercise.
Locomotor activity
Locomotor activity was monitored using Med Associates Open Field Test Environment monitors (Georgia, VT, USA). Each monitor surrounded an acrylic cage (43.2 × 43.2 × 30.5 cm) and was individually housed in sound-resistant cubicles. Data were collected using Med Associates’ Open Field Activity Software that recorded the number of monitor sensor breaks. The software converted the sensor break data to distance traveled (cm). A single mouse was placed into the chamber for 60 minutes per day for 5 consecutive days. Days 1 and 2 of the experiment were considered acclimation and were not used in the statistical analyses.
Weight-bearing treadmill exercise
Seven-week-old male and female Wt and +/G610C mice were randomly divided into either treadmill exercise or control (nonexercise in-cage activity) groups. Exercise was carried out during the pubertal growth phase into adulthood (2 to 4 months of age) to maximize the osteogenic potential of exercise.(23) Mice in the exercise group were acclimated to the treadmill during week 1: on day 1, 5-minute run; day 2, 10-minute run; day 3, 15-minute run followed by full-intensity exercise (7° incline, 10 m/min, 30 min/d, 5 d/wk) until age 4 months, at which time hindlimb muscles, tibias, and femora were evaluated. Treadmill exercise was carried out on a motorized Exer-6M Shocker for Mice treadmill (Columbus Instruments, Columbus, OH, USA). Mice in the control group were allowed normal cage activity.
Contractile properties
Contractile properties of the soleus, plantaris, gastrocnemius, and tibialis anterior muscles in male and female control Wt and +/G610C mice were determined as previously described.(17) These muscles were chosen based on their differing fiber-type compositions, architecture, and contribution to movement. Briefly, mice were anesthetized and the left soleus, plantaris, gastrocnemius, and tibialis anterior muscles surgically exposed at their distal insertions. The distal tendon of each muscle was attached to the Grass force transducer and sequentially tested, soleus → plantaris → gastrocnemius → tibialis anterior. The distal tendon was adjusted in length so that passive tension was zero grams. The sciatic nerve was isolated and placed on a stimulating electrode, and a twitch was obtained as previously described.(17) At optimal length, a peak tetanic contraction (Po) was elicited by pulses delivered at 150 Hz, 300-ms duration, and an intensity of 6V for each type muscle.(24) All data were collected using Power Lab (ADInstruments, Colorado Springs, CO, USA).
Tissue harvest
After contractile properties were obtained, left (stimulated) soleus, plantaris, gastrocnemius, tibialis anterior, and quadriceps muscles were removed, cleaned of extraneous tissue, blotted, and weighed. They were then placed in 4% paraformaldehyde for 24 hours and then transferred to 70% ethanol for future staining with hematoxylin and eosin for morphologic evaluation. Femora and tibias were cleaned of remaining soft tissue, wrapped in sterile 1X PBS-soaked gauze, and stored at −20°C.
Histochemistry and cross-sectional myofiber measurements
Left-sided paraformaldehyde- and ethanol-prepared muscles were transversely sectioned at the middle of the muscle belly and then sectioned at 5 μm and stained with hematoxylin and eosin.(17) An average of 300 myofibers were evaluated for morphology and evidence of damage or inflammation and myofiber cross-sectional areas determined using Image J software (NIH).(17)
Tibial geometry
Geometrical parameters were defined from the left tibias by vivaCT 40 μCT scan analysis (Scanco Medical AG, Bassersdorf, Switzerland) as previously described(25) before Raman spectroscopy analysis. The detector of vivaCT 40 rotates around the sample with the setting of 55 kVp X-ray tube potential, 145 μA current, 10-μm voxel resolution, and 200-ms integration time to assess cortical bone and trabecular bone properties. Each voxel of μCT values was converted to a mineral-equivalent value, milligrams per cubic centimeter (mg/cm3), by a hydroxyapatite calibration. The tibias were aligned with the vertical axis of the scanner, and three-dimensional images were reconstructed with a series of 10-μm-thick slices oriented along the long axis of the tibia. Cortical bone was analyzed at mid-shaft starting 1 mm above fibula-tibia junction. Proximal metaphysic trabecular bone was analyzed 1 mm below the growth plate. A global threshold 253 (μCT gray value) was used for all samples.
Femoral geometry and torsional loading to failure
Right femora were evaluated by μCT scan analysis (Siemens Inveon μCT equipped with Siemens Inveon Acquisition Workplace Software Version 1.5 [Siemens Preclinical Solutions, Knoxville, TN, USA] with an X-ray peakof 80 kVp and an exposure time of 140 ms) before ex vivo torsional loading to failure analyses as previously described.(26) μCT image slices were analyzed using the Amira 5.3.3 software package (Mercury Computer Systems/TGS, Chelmsford, MA, USA) to give a cubic voxel dimension of 0.083 mm3. The femora were potted into individualized cylindrical holders and the torsional loading to failure evaluated using the TA-HDi testing machine (Stable Micro Systems, Surrey, UK).(26) Applied torque T (Nmm) was calculated and plotted as a function of relative angular displacement θ (degrees). The whole-bone parameters of strength (torsional ultimate strength [Tmax, Nmm] and strain energy to failure [U, Nmm]) and stiffness (torsional stiffness [Nmm/rad]), which take into account bone geometry and material properties, were determined as previously described.(26) The bone material properties, tensile strength (Su, N/mm2), and stiffness (shear modulus of elasticity [N/mm2]) were also determined according to Roarck.(27)
Raman spectroscopy
Raman spectroscopy uses molecular vibrational techniques to evaluate the chemical properties (structure and composition) of the mineral and organic matrix components of bone.(28) Raman spectra were acquired from the left tibial cortical bone crosssection for each group using a LabRam HR 800 Raman spectrometer (Horiba Jobin Yvon, Edison, NJ, USA) as previously described.(25) Briefly, Raman spectra were excited by a heliumneon laser (633 nm) with a 20× water immersion objective, and recorded from 700 to 1800 cm−1 range with 60-second exposure time and two accumulations, allowing acquisition of the peaks attributed to the mineral and the organic matrix. Spectra analyses were performed to measure the area of the hydroxyapatite υ1 PO4−3 peak (960 cm−1), type B υ1 CO3−2 peak (1070 cm−1), and CH2 peak (1452 cm−1) for each tibia, at four sites (anterior, posterior, medial, and lateral) per cross-section, and the data were averaged per tibia.(25) The mineral crystallinity (mineral crystallite c-axis length) is inversely proportional to the full width at half maximal of the v1 PO4−3 peaks (960cm−1).(28,29)
Hydroxyproline and collagen cross-links content
Hydroxyproline content was quantified as a relative measure of collagen content from the left femora as described by Stegemann and Stalder.(30) The collagen cross-links, hydroxylysylpyridinoline (HP) and lysylpyridinoline (LP), were quantified from demarrowed 1-cm segments of the diaphyses of the right tibias as previously described.(31)
Statistical analysis
Statistical analyses were performed using SAS (SAS Institute Inc., Cary, NC, USA). Data were analyzed as a 2 × 2 × 2 factorial (2 genotypes, 2 sexes, and 2 treatments [control and exercise]) using Fisher’s protected least significant difference.(32,33) Even though the analysis of variance model by the F test was 0.07, Fisher’s protected least significant difference permitted most comparisons to be orthogonal (independent) using a contrast statement. We specifically used eight preplanned pairwise comparisons out of the possible 28 pairwise comparisons, thereby keeping the number of preplanned comparisons close to the degrees of freedom to greatly reduce false positives resulting from multiple hypothesis testing error. Saville demonstrated that Fisher’s protected least significant difference is the most powerful test for detecting a difference if one truly exists.(32,33) When heterogeneous variations made it necessary, a log transformation was used to stabilize the variation. If the log transformation failed to stabilize the variation, a nonparametric ranked analysis was performed according to Conover and colleagues.(34) Results are presented as mean ± standard deviation (SD). Differences were considered to be statistically significant at p ≤ 0.05.
Results
Locomotor activity
To investigate whether the G610C Colla2 gene mutation is associated with decreased physical activity, the locomotor activity of male and female Wt and +/G610C mice was evaluated at 1 month and 4 months of age. Male mice exhibited greater locomotor activity at 1 month of age than at 4 months of age; Wt and +/G610C mice were 19% and 25% more active at 1 month of age than at 4 months of age, respectively (Fig. 1). Female mice also exhibited a decrease in locomotor activity between 1 and 4 months of age, although this difference did not reach significance. Genotype differences in locomotor activity were not observed between sex-matched Wt and +/G610C mice (Fig. 1).
Fig. 1.
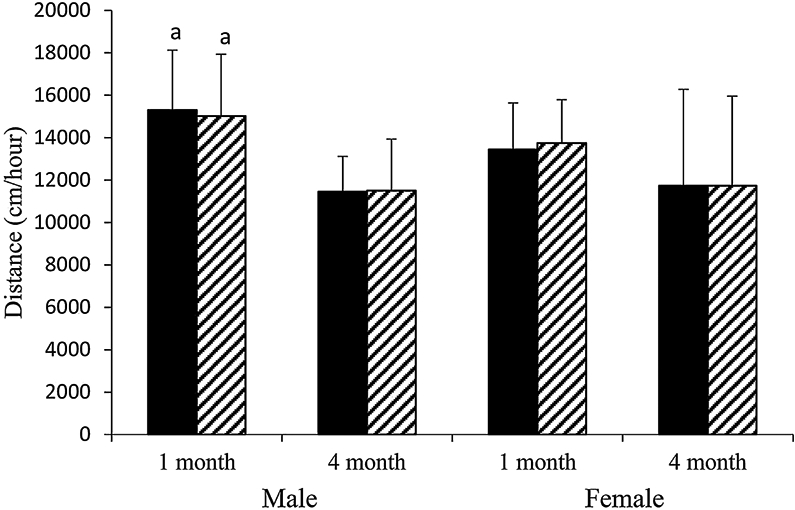
Male and female +/G610C mice do not exhibit altered levels of locomoter activity relative to age-matched Wt mice. Mean ± SD of distance traveled (cm)/60 min for 3 consecutive days by Wt (solid black) and +/G610C (white diagonal) mice at 1 and 4 months of age (n = 8–13 per group). ap ≤ 0.05 versus 4-month-old mice.
Body weight and relative muscle weight
Body weight differences owing to genotype were evident; control male +/G610C mice were 9% smaller than male Wt mice (Table 1). The muscle wet weights of the plantaris and gastrocnemius muscles were reduced in male control +/G610C mice compared with male Wt controls, whereas female control +/G610C mice had reduced wet weight of only the gastrocnemius muscle compared with female Wt control mice (Tables 1 and 2). When evaluating the impact of genotype on the relative muscle weights (muscle wet weight/body weight), only the relative muscle weights of female control +/G610C gastrocnemius muscles were decreased compared with their Wt counterparts (Table 2). Treadmill exercise in +/G610C mice increased the relative weights of the plantaris and tibialis anterior muscles in both sexes and in female gastrocnemius muscle (Tables 1 and 2).
Table 1.
Body Weight and Muscle Wet and Relative Weights of the Soleus (S), Plantaris (P), Gastrocnemius (G), Tibialis Anterior (TA), and Quadriceps (Q) Muscles of 4-Month-Old Male Wt and +/G610C Control and Treadmill-Exercised Mice
| Wt | +/G610C | |||
|---|---|---|---|---|
| Control* n = 10 | Treadmill n = 9 | Control* n = 7–8 | Treadmill n = 12 | |
| Body weight (g) | ||||
| 30.11 ± 1.55 | 28.63 ± 3.91 | 27.54 ± 1.69a | 27.34 ± 1.95 | |
| Muscle wet weight (mg) | ||||
| S | 9.68 ± 1.43 | 8.56 ± 1.48 | 8.75 ± 1.16 | 9.28 ± 2.39 |
| P | 19.88 ± 1.29 | 19.54 ± 3.01 | 17.74 ± 2.03a | 22.78 ± 5.91b |
| G | 153.6 ± 12.4 | 141.8 ± 24.2 | 138.6 ± 15.5a | 134.0 ± 15.4 |
| TA | 55.55 ± 2.49 | 56.88 ± 11.26 | 51.70 ± 5.18 | 60.78 ± 12.01b |
| Q | 240.6 ± 19.3 | 215.1 ± 38.8b | 225.6 ± 11.0 | 233.6 ± 28.3a |
| Relative wet muscle weight (wet weight [mg]/body weight [g]) | ||||
| S | 0.32 ± 0.04 | 0.30 ± 0.05 | 0.32 ± 0.04 | 0.34 ± 0.08 |
| P | 0.66 ± 0.04 | 0.69 ± 0.07 | 0.65 ± 0.09 | 0.83 ± 0.19a,b |
| G | 5.10 ± 0.34 | 4.94 ± 0.29 | 5.02 ± 0.28 | 4.91 ± 0.52 |
| TA | 1.85 ± 0.09 | 1.98 ± 0.19 | 1.88 ± 0.12 | 2.21 ± 0.36a,b |
| Q | 8.16 ± 0.29 | 7.54 ± 0.97b | 8.14 ± 0.28 | 8.53 ± 0.62a |
Values are means ± SD.
Non-exercise in-cage activity control
p ≤ 0.05 versus Wt
p ≤ 0.05 versus control.
Table 2.
Body Weight and Muscle Wet and Relative Weights of the Soleus (S), Plantaris (P), Gastrocnemius (G), Tibialis Anterior (TA),and Quadriceps (Q) Muscles of 4-Month-Old Female Wt and +/G610C Control and Treadmill-Exercised Mice
| Wt | +/G610C | |||
|---|---|---|---|---|
| Control* n = 10 | Treadmill n = 10 | Control* n = 9–12 | Treadmill n = 9 | |
| Body weight (g) | ||||
| 21.85 ± 1.84 | 21.09 ± 0.92 | 21.41 ± 0.85 | 20.39 ± 0.93 | |
| Muscle wet weight (mg) | ||||
| S | 6.92 ± 1.42 | 7.75 ± 1.55 | 7.32 ± 0.98 | 7.79 ± 0.70 |
| P | 13.75 ± 1.74 | 14.72 ± 2.31 | 13.26 ± 1.00 | 14.67 ± 3.44 |
| G | 109.50 ± 8.0 | 101.0 ± 5.5 | 96.26 ± 8.08a | 98.73 ± 9.08 |
| TA | 37.30 ± 2.97 | 45.38 ± 6.57b | 38.33 ± 3.58 | 40.43 ± 4.60 |
| Q | 169.15 ± 16.0 | 166.3 ± 11.7 | 159.9 ± 11.1 | 155.5 ± 9.3 |
| Relative wet muscle weight (wet weight [mg]/body weight [g]) | ||||
| S | 0.32 ± 0.06 | 0.34 ± 0.04 | 0.34 ± 0.04 | 0.38 ± 0.04 |
| P | 0.63 ± 0.06 | 0.67 ± 0.12 | 0.62 ± 0.04 | 0.72 ± 0.18b |
| G | 5.02 ± 0.21 | 4.70 ± 0.22b | 4.51 ± 0.27a | 4.84 ± 0.40b |
| TA | 1.72 ± 0.17 | 2.15 ± 0.33b | 1.76 ± 0.10 | 1.98 ± 0.20b |
| Q | 7.74 ± 0.30 | 7.63 ± 0.65 | 7.48 ± 0.37 | 7.64 ± 0.49 |
Values are means ± SD.
Non-exercise in-cage activity control
p ≤ 0.05 versus Wt
p ≤ 0.05 versus control.
Contractile force generating capacity
Before initiation of exercise studies, male and female Wt and +/G610C mice were evaluated for muscle function by determining the absolute whole muscle contractile generating capacity (peak tetanic force [Po; g]), the relative contractile generating capacity (relative Po; peak tetanic force/muscle weight [mg]), and the specific contractile generating capacity (specific Po; peak tetanic force/muscle fiber cross-sectional area [μm2]) of their soleus, plantaris, gastrocnemius, and tibialis anterior muscles at 4 months of age (Table 3). The absolute whole muscle Po was not different between sex-matched Wt and +/G610C mouse muscles except for the tibialis anterior muscle of male +/G610C mice (Table 3). When the Po was normalized to the muscle wet weight (the relative contractile generating capacity) and to the myofiber cross-sectional area (the specific contractile generating capacity), no genotype differences were noted (Table 3).
Table 3.
Absolute, Relative, and Specific Tetanic Contractile Generating Capacity of Soleus (S), Plantaris (P), Gastrocnemius (G), and Tibialis Anterior (TA) Muscles of Male and Female Wt and +/G610C Control Mice
| Wt | +/G610C | |||
|---|---|---|---|---|
| Males n = 9 | Females n = 9 | Males n = 8–9 | Females n = 9–10 | |
| Absolute tetanic contractile generating capacity (Po[g]) | ||||
| S | 13.94 ± 3.92 | 8.47 ± 2.65 | 11.91 ± 4.18 | 9.87 ± 2.74 |
| P | 47.96 ± 14.21 | 33.17 ± 6.56 | 39.63 ± 9.95 | 26.81 ± 8.09 |
| G | 113.5 ± 17.8 | 102.3 ± 16.5 | 107.8 ± 29.4 | 80.2 ± 16.0 |
| TA | 98.16 ± 12.86 | 79.00 ± 12.92 | 78.63 ± 20.78a | 73.49 ± 9.84 |
| Relative tetanic contractile generating capacity (Po/muscle wet weight [mg]) | ||||
| S | 1.44 ± 0.43 | 1.25 ± 0.41 | 1.14 ± 0.60 | 1.36 ± 0.49 |
| P | 2.44 ± 0.77 | 2.37 ± 0.44 | 2.28 ± 0.79 | 2.03 ± 0.60 |
| G | 0.73 ± 0.09 | 0.94 ± 0.12 | 0.76 ± 0.23 | 0.83 ± 0.18 |
| TA | 1.77 ± 0.24 | 2.08 ± 0.33 | 1.56 ± 0.43 | 1.97 ± 0.33 |
| Specific tetanic contractile generating capacity (Po/muscle cross-sectional area [μm]) | ||||
| S | 0.012 ± 0.004 | 0.008 ± 0.003 | 0.012 ± 0.005 | 0.011 ± 0.004 |
| P | 0.034 ± 0.012 | 0.030 ± 0.007 | 0.033 ± 0.012 | 0.028 ± 0.012 |
| G | 0.066 ± 0.016 | 0.057 ± 0.007 | 0.070 ± 0.028 | 0.058 ± 0.013 |
| TA | 0.068 ± 0.019 | 0.063 ± 0.013 | 0.056 ± 0.011 | 0.062 ± 0.012 |
Values are means ± SD.
p ≤ 0.050 versus Wt.
Histological morphology and myofiber cross-sectional area
The soleus, plantaris, gastrocnemius, tibialis anterior, and quadriceps muscles of Wt and +/G610C mice were evaluated histologically by hematoxylin and eosin staining and showed no evidence of necrosis, regeneration, degeneration, fibrosis, or infiltration by inflammatory cells (Fig. 2). In addition, the majority of the hindlimb muscles did not exhibit genotype-specific differences in myofiber cross-sectional area (Fig. 2). The only genotype difference noted was that female +/G610C gastrocnemius myofiber cross-sectional area was reduced by 22% compared with female Wt gastrocnemius myofiber cross-sectional area.
Fig. 2.

(A) Hematoxylin and eosin-stained cross sections of 4-month-old male Wt (left) and +/G610C (right) tibialis anterior muscles do not show evidence of necrosis, regeneration, or inflammatory cell infiltration. Male (B) and female (C) Wt (solid black) and +/G610C mice (white diagonal) exhibit similar myofiber cross-sectional areas of their soleus (S),plantaris (P), gastrocnemius (G), or tibialis anterior (TA) muscles (n = 8–10 per group). Mean ± SD, ap ≤ 0.05 versus Wt mice.
Exercise tolerance
Through daily monitoring of the health status (grooming, weight, and gait) of the Wt and +/G610C mice during the exercise regimen, we did not observe any behavioral clues for injury (lameness, abnormal gait, favoring of a leg or reluctance to run on the treadmill). Upon euthanization, we did not find any fractures or healed calluses in the tibias or femora of the control or treadmill-exercised Wt and +/G610C mice, suggesting that the treadmill-exercise regimen was well tolerated and did not result in hindlimb long-bone fractures.
Tibial μCT analysis
To evaluate the impact of the G610C Col1a2 gene defect and weight-bearing exercise on bone quality at the microstructural scale, we examined the bone geometry of 4-month-old male and female Wt and +/G610C tibias from control and exercised mice (Fig. 3). Control male and female +/G610C tibias exhibited decreases in trabecular bone volume/total volume (BV/TV), connectivity density, and trabecular number, and increases in trabecular separation relative to Wt control tibias. The response of the tibial trabecular bone to the 8-week treadmill exercise regimen was greatest in female Wt mice, specifically demonstrating increased trabecular number and connectivity density with a corresponding decrease in trabecular separation compared with control Wt female tibias. Exercised +/G610C tibias showed limited response, with only a decrease in trabecular density in females and an increase in trabecular bone number in males reaching significance.
Fig. 3.
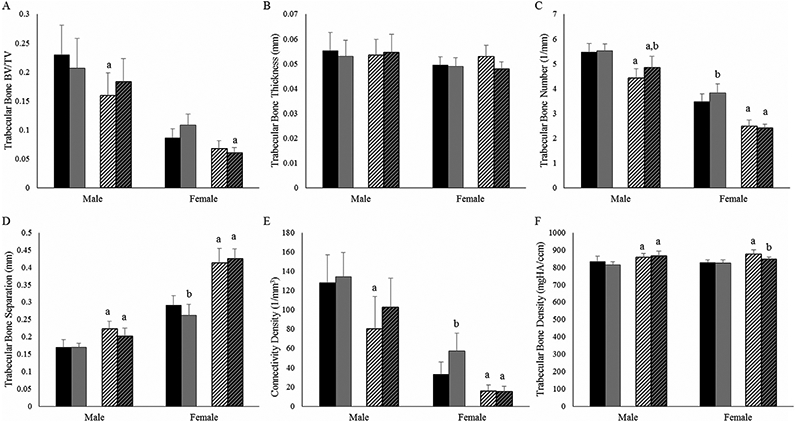
Four-month-old +/G610C mice tibias have reduced trabecular bone geometry relative to Wt mice tibias. (A) Trabecular bone volume per total bone volume (BV/TV); (B) trabecular bone thickness; (C) trabecular bone number; (D) trabecular bone separation; (E) connectivity density; (F) trabecular bone density of male and female Wt control (solid black), Wt treadmill-exercised (solid gray), +/G610C control (white diagonal), and +/G610C treadmill-exercised (gray diagonal) mice (n = 7–9 per group). Mean ± SD, ap ≤ 0.05 versus Wt mice; bp ≤ 0.05 versus control mice.
Femoral geometric and biomechanical properties
Before torsional loading to failure analyses, femoral geometry was evaluated in control and treadmill-exercised Wt and +/G610C mice (Table 4). +/G610C femora exhibited reduced marrow cavity diameter and polar moment of inertia compared with their Wt counterparts. Male +/G610C mice had increased cortical bone width compared with Wt mice. The greatest response to exercise was found in males; male Wt treadmill-exercised mice exhibited decreased femur length and polar moment of inertia, and male +/G610C exercised mice had decreased femur length compared with their controls (Table 4).
Table 4.
Femur Length (FL), Marrow Cavity Diameter (MCD), Cortical Bone Width (CBW), and Polar Moment of Inertia (J) of Male and Female Wt and +/G610C Control and Treadmill-Exercised Mice
| Wt |
+/G610C |
|||||||
|---|---|---|---|---|---|---|---|---|
| Males |
Females |
Males |
Females |
|||||
| Parameter | Control* n = 9 |
Treadmill n = 7-9 |
Control* n = 10 |
Treadmill n = 9-10 |
Control* n = 9-10 |
Treadmill n = 9 |
Control* n = 9 |
Treadmill n = 10 |
| FL (mm) | 16.25 ± 0.35 | 15.86 ± 0.45b | 15.84 ± 0.31 | 15.61 ± 0.32 | 16.27 ± 0.42 | 15.94 ± 0.37b | 15.67 ± 0.35 | 15.50 ± 0.38 |
| MCD (mm) | 1.05 ± 0.08 | 0.97 ± 0.09 | 0.87 ± 0.06 | 0.90 ± 0.06 | 0.81 ± 0.07a | 0.77 ± 0.10a | 0.70 ± 0.10a | 0.71 ± 0.07a |
| CBW (mm) | 0.39 ± 0.02 | 0.39 ± 0.05 | 0.36 ± 0.03 | 0.36 ± 0.05 | 0.43 ± 0.02a | 0.46 ± 0.06a | 0.38 ± 0.03 | 0.37 ± 0.02 |
| J (mm4) | 0.87 ± 0.12 | 0.73 ± 0.19b | 0.52 ± 0.05 | 0.54 ± 0.11 | 0.65 ± 0.12a | 0.70 ± 0.13 | 0.37 ± 0.04a | 0.37 ± 0.03a |
Values are means ± SD.
Non-exercise in-cage activity control
p ≤ 0.050 versus Wt
p ≤ 0.050 versus control.
After μCT analyses, femoral torsional loading to failure analyses (Fig. 4) demonstrated that +/G610C femora had decreased whole-bone biomechanical strength (torsional ultimate strength [Tmax] and energy to failure [U]) relative to Wt femora for both sexes, though they did not always reach significance in females. Male +/G610C control femora exhibited only 64% and 46% of Tmax and U of male Wt control femora, respectively (Fig. 4), and female +/G610C control femora exhibited 79% and 71% of Tmax and U of female Wt control femora, respectively. When adjusted for femoral geometry, the tensile strength (Su) of the male control +/G610C bone material was also weaker, only 76% of male control Wt femoral Su, which was in contrast with female control +/G610C femoral Su, which appeared to have equivalent Su as female Wt control femora. Although whole-bone torsional stiffness of control Wt and +/G610C were equivalent, when adjusted for geometry, the shear modulus of elasticity of the bone material of the male and female +/G610C femora were 62% and 41% greater than the shear modulus of elasticity of the bone material of the male and female Wt femora, respectively.
Fig. 4.
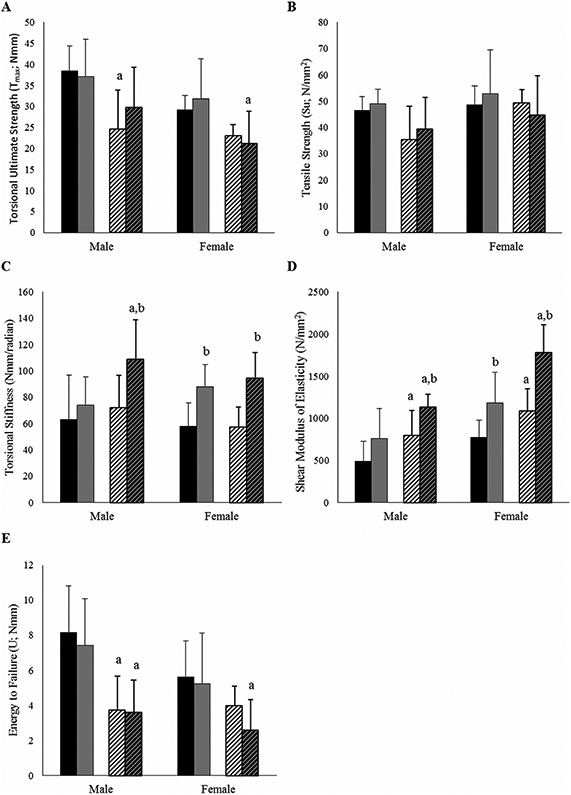
Four-month-old +/G610C femora exhibit compromised bone biomechanical properties compared with Wt femora. Treadmill exercise increased stiffness in both whole-bone and material properties. (A) Torsional ultimate strength (Tmax), (B) tensile strength (Su), (C) torsional stiffness, (D) shear modulus of elasticity, (E) energy to failure (U) in femora of male and female Wt control (solid black), Wt treadmill-exercised (solid gray), +/G610C control (white diagonal), and +/G610C treadmill-exercised (gray diagonal) mice (n = 8–10 per group). Mean ± SD, ap ≤ 0.05 versus Wt mice; bp ≤ 0.05 versus control mice.
The treadmill-exercise regimen had the greatest effect on stiffness with +/G610C male and female exercised femora exhibiting 50% and 65% greater stiffness than their controls, respectively. Wt male and female exercised femora also exhibited increased stiffness relative to control femora, although it only reached significance in females. At the tissue level, the shear modulus of elasticity of male and female treadmill exercised +/G610C was increased 43% and 64% relative to control femora, and for male and female Wt treadmill-exercised femora the shear modulus of elasticity increased by 55% and 54% compared with control femora. Although the treadmill-exercise regimen resulted in some geometric and tissue level changes, the overall energy to failure was not altered by the 8-week exercise regimen in either Wt or +/G610C femora.
Bone chemical properties
To examine the bone material properties at the tissue level, we used Raman spectroscopy to assess tibial cortical bone crystallinity, carbonate/phosphate (CO3/PO4), phosphate/matrix (PO4/CH2), and carbonate/matrix (CO3/CH2) ratios (Fig. 5)(25,29) and a hydroxyproline assay to quantify femoral collagen content (Fig. 6) in control and treadmill-exercised Wt and +/G610C bone. Crystallinity is the inverse of the band width at half maximal of the phosphate peak, is indicative of mineral size and perfection, and is associated positively with bone age.(35,36) PO4/CH2 and CO3/CH2 ratios are representative of the mineral to matrix composition, and the CO3/PO4 ratio increases as the bone tissue ages.(29,35-37) No sex, genotype, or exercise status differences were observed in the crystallinity and CO3/PO4 ratios. Male +/G610C control tibias had 16% and 12% (p = 0.13) greater PO4/CH2 and CO3/CH2 ratios than male Wt control tibias, respectively. Female +/G610C treadmill-exercised tibias had 17% and 16% (p = 0.06) increase in PO4/CH2 and CO3/CH2 ratio compared with female Wt treadmill-exercised tibias, respectively.
Fig. 5.
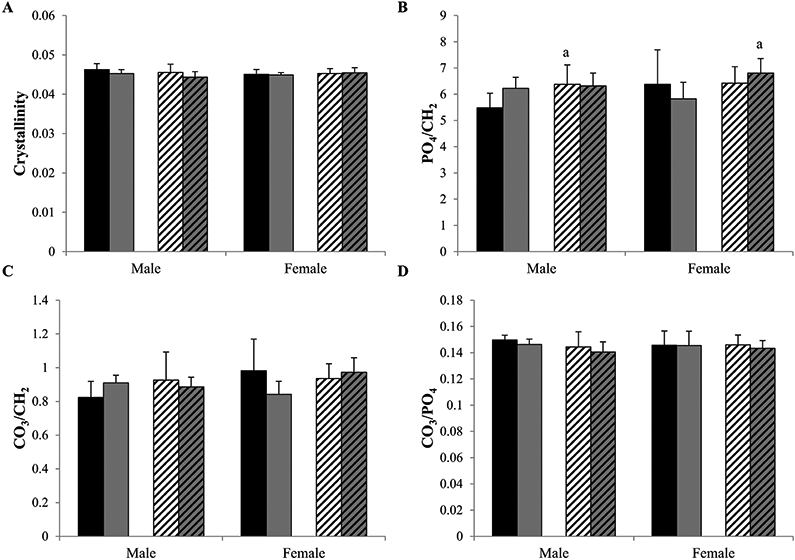
By Raman spectroscopy the crystallinity (A), mineral/matrix ratios, PO4/CH2 (B) and CO3/CH2 (C), and CO3/PO4 (D) were evaluated in tibias of 4-month-old male and female Wt control (solid black), Wt treadmill-exercised (solid gray), +/G610C control (white diagonal), and +/G610C treadmill-exercised (gray diagonal) mice (n = 5–6 per group). Mean ± SD, ap ≤ 0.05 versus Wt mice.
Fig. 6.
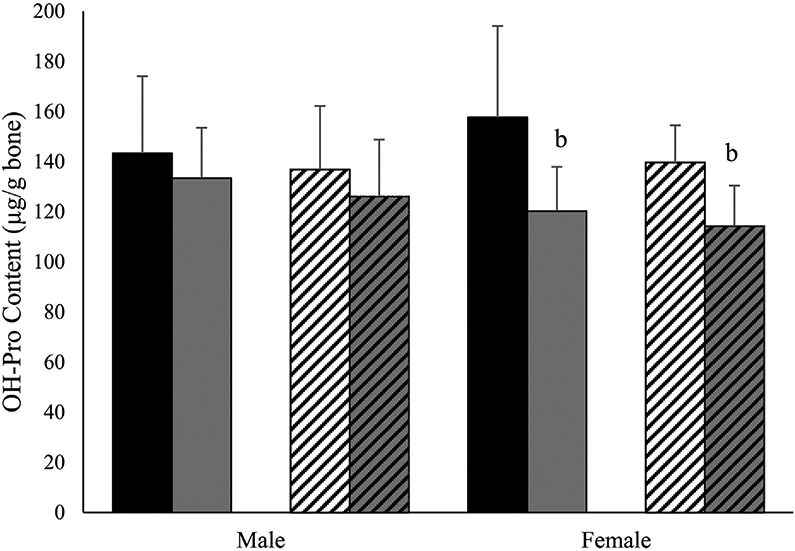
Treadmill exercise reduces hydroxyproline content in female mouse femora. Hydroxyproline (mg/g of bone) in male and female 4-month-old Wt control (solid black), Wt treadmill-exercised (solid gray), +/G610C control (white diagonal), and +/G610C treadmill-exercised (gray diagonal) mice (n = 710 per group). Mean ± SD, bp ≤ 0.05 versus control mice.
Hydroxyproline analyses demonstrated that femora from male and female +/G610C mice have equivalent levels of hydroxyproline/g of bone relative to their Wt counterparts (Fig. 6). Female Wt and +/G610C treadmill exercise mice had 24% and 18% less hydroxyproline/g of bone relative to control female Wt and +/G610C mice. Similar trends were found for male Wt and +/G610C treadmill-exercised mice.
Collagen cross-linking
To further evaluate the contribution of collagen ultrastructure to bone biomechanics, we examined the trivalent collagen cross-links, hydroxylysylpyridinoline (HP) and lysylpyridinoline (LP), by HPLC for the HP + LP content and HP/LP ratio in the cortical bone of the tibial diaphysis of non-exercise control and treadmill-exercised Wt and +/G610C mice(31,38) (Fig. 7). We demonstrate that +/G610C control and treadmill-exercised tibial collagen had higher HP and HP + LP contents and HP/LP ratios (the latter by 42%, 32%, and 98%, respectively, for non-treadmill controls) relative to their Wt counterparts.
Fig. 7.
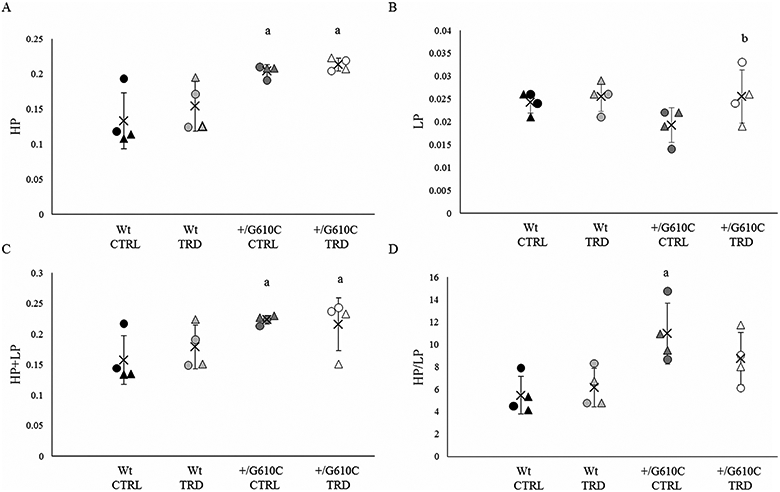
+/G610C mouse tibias have increased hydroxylysylpyridinoline (HP), HP + lysylpyridinoline (LP), and HP/LP ratio relative to control Wt mouse tibias. (A) HP, (B) LP, (C) HP + LP, and (D) HP/LP content in tibias of 4-month-old male (circle) and female (triangle) Wt control (Wt CTRL; black), Wt treadmill-exercised (WtTRD; light gray), +/G610Ccontrol (+/G610C CTRL; dark gray), and +/G610C treadmill-exercised (+/G610C TRD; white) mice (n = 4 per group). Mean ± SD, ap ≤ 0.05 versus Wt mice; bp ≤ 0.05 versus control mice.
Discussion
In this study, we demonstrate that the autosomal dominant G610C OI mouse model exhibits similar skeletal muscle function and locomotor activity as its wild-type littermates, even though its bone quality and strength are compromised. We also demonstrate that the +/G610C mice were able to complete the weight-bearing treadmill-exercise regimen without developing fractures in their hindlimb long bones. Similar to oim/oim mice, histological evaluation of Wt and +/G610C hindlimb muscles demonstrated no gross morphological differences.(17) Wt and +/G610C hindlimb muscles demonstrated no differences in relative muscle weights, in contrast, oim/oim mice had significantly reduced relative muscle weights compared with their Wt littermates.(17) In situ analyses of Wt and +/G610C hindlimb muscle function showed no functional differences in relative or specific Po for the majority of the +/G610C hindlimb skeletal muscles, which was also in contrast to oim/oim mice. Homozygous oim mice exhibit an inherent muscle pathology, whereas heterozygous +/oim mice were minimally affected.(17) Veilleux and colleagues recently demonstrated in children and adolescents with OI type I/IV that the majority of the individuals tested had decreased muscle force, but a portion also exhibited completely normal muscle function,(15) further suggesting that the impact of OI on muscle function may be mutation specific.
It is difficult to discern if the differences in muscle function and bone strength between the oim/oim and the +/G610C mice are a reflection of the differences in their specific molecular defects (loss of function mutation versus a gain of mutant molecules) or attributable to dosage of the mutant molecules. The complete absence of α2(I) collagen chains and/or presence of only homotrimeric type I collagen [α1(I)3] as found in oim/oim result in greater fragility and impaired muscle function than heterozygosity for homotrimeric and heterotrimeric type I collagen, as +/oim mice exhibit milder muscle and bone involvement. In the +/G610C mice, the heterozygous mix of normal and mutant α2(I) chains in the collagen molecules also results in a mild to moderate bone phenotype in the absence of a muscle pathology. Genotype analyses of newborn pups from +/G610C X +/G610C matings result in 1:2 ratios of Wt:+/G610C offspring (data not shown), which suggest homozygosity for the G610C Col1a2 allele is embryonic lethal and more deleterious than functional null of the Col1a2 allele and/or the presence of homotrimeric collagen.
Evaluation of locomotor activity suggests that the glycine to cysteine substitution in the proα2(I) collagen chain of type I collagen responsible for OI in the G610C mouse model does not impact physical activity levels. Even though Van Brussel and colleagues demonstrated that children with OI type I and IV can successfully undergo a 3-month supervised exercise protocol without increasing fracture risk,(19) the lack of defined parameters of musculoskeletal impairment in OI appear to contribute to the hesitancy in incorporation of exercise protocols into treatment strategies.(16,18,39)
μCT analyses of control +/G610C tibias and femora confirm previous studies demonstrating decreased bone volume relative to Wt tibia.(22,40) +/G610C bone also exhibited reduced connectivity density, which likely contributes to bone brittleness. Decreases in BV/TV are a common finding in OI mouse models(22,40-44) whether owing to autosomal dominant or recessive mechanisms. The femora of +/G610C mice were smaller overall and had reduced polar moment of inertia, suggesting that +/G610C bone will fracture with less force, which was observed by their decreased Tmax and U. The decreased bone volume and increased shear modulus of elasticity of +/G610C femora suggests that the whole-bone biomechanical integrity of +/G610C bone reflects both compromised material and altered geometry, consistent with previous 3- and 4-point bending studies.(22,40)
Increased shear modulus of elasticity is indicative of increased material stiffness, implicating an increase in mineralization. The hydroxyproline content of control +/G610C and Wt bone did not differ, suggesting that the increase in mineral to matrix ratio observed by Raman spectroscopy is largely the result of a change in the mineral content in +/G610C tibias. However, because the hydroxyproline content was quantified in mineralized bone, we cannot differentiate the contribution of the mineral versus the organic components to the total bone weight, which is a limitation of this study. Examination of bone tissue from children with OI by nanoindentation and Raman spectroscopy demonstrated increases in the elastic moduli of the bone, which correlated with increased mineral content.(45) Despite the fact that the HP/LP ratio often positively correlates with stiffness and strength of normal bone,(46) in OI an altered content or arrangement of cross-links is commonly associated with abnormally small, more densely packed mineral crystals(45,47) The increased HP, HP + LP, and HP/LP ratios found in +/G610C mice did not correlate to improved energy to failure, which has also been observed in other mouse models of OI(38,44)
The treadmill exercise was well tolerated by the +/G610C mice; however, the mild treadmill regimen elicited minimal improvement in relative muscle mass of +/G610C mice and limited increases in bone volume and biomechanical parameters. In response to the 8-week exercise regimen, both female Wt and +/G610C mice had less hydroxyproline (collagen)/g of bone, which corresponded to increased stiffness of the bone material (shear elastic modulus). This suggests that rather than an increase in mineralization, the increase in shear elastic moduli reflects a decrease in collagen matrix. The μCT analyses also suggested this exercise regimen was not sufficiently rigorous to induce significant bone formation, with only Wt female and +/G610C male mice exhibiting alterations in trabecular bone in response to the treadmill-exercise regimen. However, it is important to note that the treadmill exercise regimen did not result in fractures in the +/G610C mice, and though there was a reduction in hydroxyproline content/g of the bone, the energy to failure was not reduced. These findings suggest that the structural architecture of the organic matrix may be altered to preserve bone integrity and are consistent with the study by Detter and colleagues, which found that regular moderate physical activity in children and adolescents can improve not only bone mass but also bone structure.(21)
In summary, we found that +/G610C mice do not exhibit a muscle pathology or altered activity levels and that they were able to tolerate and complete an 8-week treadmill exercise regimen without fracturing their hindlimb long bones. The Wt and +/G610C mice that underwent the treadmill exercise regimen demonstrated gains in whole bone and material stiffness. The 8-week treadmill exercise regimen was associated with reduced collagen content, but the altered collagen crosslink content in +/G610C femora was maintained. Our findings suggest that individuals with G610C mutation may respond the same as healthy individuals to weight-bearing exercise with an increase in relative muscle weights and gain in bone material stiffness. Further studies are still required to evaluate the safety and long-term efficacy of tailored exercise interventions for individuals with OI as a therapeutic strategy to enhance muscle function and bone strength, as the response may be mutation specific.
Acknowledgments
We thank Dr Mark R Ellersieck (Department of Statistics, University of Missouri) for his assistance in the statistical analyses of this study. We also like to thank the following funding sources: National Institutes of Health ARO55907 (YJ, SMC, BAG, YY, DJS, AMW, AKO, MGM, YW, and CLP), T32 RR007004 (BAG), HD058834 (MB), AR037318 (DRE), HD070394 (DRE); National Space and Biomedical Research Institute NCC 958 (SMC); Leda J. Sears Trust Foundation (SMC, BAG, DJS, AMW, AKO, MGM, and CLP); Phi Zeta (BAG); University of Missouri Research Board (MB, CLP, and JAF); Kansas City Area Life Sciences Institute (CLP, XY, and YW); University of Missouri Institute for Clinical and Translational Science (CLP and MB); University of Missouri Interdisciplinary Intercampus Research Program (CLP, YW, and AKO).
Footnotes
Disclosures
All authors state that they have no conflicts of interest.
References
- 1.McKay HA, Bailey DA, Wilkinson AA, Houston CS. Familial comparison of bone mineral density at the proximal femur and lumbar spine. Bone Miner. 1994;24(2):95–107. [DOI] [PubMed] [Google Scholar]
- 2.DiGirolamo DJ, Kiel DP, Esser KA. Bone and skeletal muscle: neighbors with close ties. J Bone Miner Res. 2013;28(7):1509–18. [DOI] [PMC free article] [PubMed] [Google Scholar]
- 3.Turner CH. Bone strength: current concepts. Ann NY Acad Sci. 2006;1068:429–46. [DOI] [PubMed] [Google Scholar]
- 4.Edwards MH, Gregson CL, Patel HP, et al. Muscle size, strength, and physical performance and their associations with bone structure in the Hertfordshire Cohort Study. J Bone Miner Res. 2013;28(11):2295–304. [DOI] [PMC free article] [PubMed] [Google Scholar]
- 5.Skerry TM. One mechanostat or many? Modifications of the site-specific response of bone to mechanical loading by nature and nurture. J Musculoskelet Neuronal Interact. 2006;6(2):122–7. [PubMed] [Google Scholar]
- 6.Cundy T Recent advances in osteogenesis imperfecta. Calcif Tissue Int. 2012;90(6):439–49. [DOI] [PubMed] [Google Scholar]
- 7.Forlino A, Cabral WA, Barnes AM, Marini JC. New perspectives on osteogenesis imperfecta. Nat Rev Endocrinol. 2011;7(9):540–57. [DOI] [PMC free article] [PubMed] [Google Scholar]
- 8.Harrington J, Sochett E, Howard A. Update on the evaluation and treatment of osteogenesis imperfecta. Pediatr Clin North Am. 2014;61(6):1243–57. [DOI] [PubMed] [Google Scholar]
- 9.Van Dijk FS, Sillence DO. Osteogenesis imperfecta: clinical diagnosis, nomenclature and severity assessment. Am J Med Genet Part A. 2014;164(6):1470–81. [DOI] [PMC free article] [PubMed] [Google Scholar]
- 10.Sillence DO, Senn A, Danks DM. Genetic heterogeneity in osteogenesis imperfecta. J Med Genet. 1979;16(2):101–16. [DOI] [PMC free article] [PubMed] [Google Scholar]
- 11.Cho TJ, Lee KE, Lee SK, et al. A single recurrent mutation in the 5′-UTR of IFITM5 causes osteogenesis imperfecta type V. Am J Hum Genet. 2012;91(2):343–8. [DOI] [PMC free article] [PubMed] [Google Scholar]
- 12.Semler O, Garbes L, Keupp K, et al. A mutation in the 5′-UTR of IFITM5 creates an in-frame start codon and causes autosomal-dominant osteogenesis imperfecta type V with hyperplastic callus. Am J Hum Genet. 2012;91(2):349–57. [DOI] [PMC free article] [PubMed] [Google Scholar]
- 13.Engelbert RH, van der Graaf Y, van Empelen R, Beemer FA, Helders PJ. Osteogenesis imperfecta in childhood: impairment and disability. Pediatrics. 1997;99(2):E3. [DOI] [PubMed] [Google Scholar]
- 14.Takken T, Terlingen HC, Helders PJ, Pruijs H, Van der Ent CK, Engelbert RH. Cardiopulmonary fitness and muscle strength in patients with osteogenesis imperfecta type I. J Pediatr. 2004;145-(6):813–8. [DOI] [PubMed] [Google Scholar]
- 15.Veilleux LN, Lemay M, Pouliot-Laforte A, Cheung MS, Glorieux FH, Rauch F. Muscle anatomy and dynamic muscle function in osteogenesis imperfecta type I. J Clin Endocrinol Metab. 2014;99(2):E356–62. [DOI] [PubMed] [Google Scholar]
- 16.Caudill A, Flanagan A, Hassani S, et al. Ankle strength and functional limitations in children and adolescents with type I osteogenesis imperfecta. Pediatr Phys Ther. 2010;22(3):288–95. [DOI] [PubMed] [Google Scholar]
- 17.Gentry BA, Ferreira JA, McCambridge AJ, Brown M, Phillips CL. Skeletal muscle weakness in osteogenesis imperfecta mice. Matrix Biol. 2010;29(7):638–44. [DOI] [PMC free article] [PubMed] [Google Scholar]
- 18.Suskauer SJ, Cintas HL, Marini JC, Gerber LH. Temperament and physical performance in children with osteogenesis imperfecta. Pediatrics. 2003;111(2): e153–e161. [DOI] [PubMed] [Google Scholar]
- 19.Van Brussel M, Takken T, Uiterwaal CS, et al. Physical training in children with osteogenesis imperfecta. J Pediatr. 2008;152(1):111–6, 116e1. [DOI] [PubMed] [Google Scholar]
- 20.Bailey DA, McKay HA, Mirwald RL, Crocker PR, Faulkner RA. A six-year longitudinal study of the relationship of physical activity to bone mineral accrual in growing children: the University of Saskatchewan bone mineral accrual study. J Bone Miner Res. 1999;14(10):1672–9. [DOI] [PubMed] [Google Scholar]
- 21.Detter F, Rosengren BE, Dencker M, Lorentzon M, Nilsson J-A, Karlsson MK. A 6-year exercise program improves skeletal traits without affecting fracture risk: a prospective controlled study in 2621 children. J Bone Miner Res. 2014;29(6):1325–36. [DOI] [PubMed] [Google Scholar]
- 22.Daley E, Streeten EA, Sorkin JD, et al. Variable bone fragility associated with an Amish COL1A2 variant and a knock-in mouse model. J Bone Miner Res. 2010;25(2):247–61. [DOI] [PMC free article] [PubMed] [Google Scholar]
- 23.Isaksson H, Tolvanen V, Finnila MA, et al. Physical exercise improves properties of bone and its collagen network in growing and maturing mice. Calcif Tissue Int. 2009;85(3):247–56. [DOI] [PubMed] [Google Scholar]
- 24.Brown M, Ning J, Ferreira JA, Bogener JL, Lubahn DB. Estrogen receptor-alpha and -beta and aromatase knockout effects on lower limb muscle mass and contractile function in female mice. Am J Physiol Endocrinol Metab. 2009;296(4):E854–61. [DOI] [PMC free article] [PubMed] [Google Scholar]
- 25.Yao X, Carleton SM, Kettle AD, Melander J, Phillips CL, Wang Y. Gender-dependence of bone structure and properties in adult osteogenesis imperfecta murine model. Ann Biomed Eng. 2013;41-(6):1139–49. [DOI] [PMC free article] [PubMed] [Google Scholar]
- 26.Carleton SM, McBride DJ, Carson WL, et al. Role of genetic background in determining phenotypic severity throughout postnatal development and at peak bone mass in Col1a2 deficient mice (oim). Bone. 2008;42(4):681–94. [DOI] [PMC free article] [PubMed] [Google Scholar]
- 27.Roark RJ, Young WC. Formulas for stress and strain formulas for stress and strain. 5th ed. New York: McGraw-Hill; 1975. [Google Scholar]
- 28.Mandair GS, Morris MD. Contributions of Raman spectroscopy to the understanding of bone strength. BoneKEy. 2015; Rep 4. [DOI] [PMC free article] [PubMed] [Google Scholar]
- 29.Morris MD, Mandair GS. Raman assessment of bone quality. Clin Orthop Relat Res. 2011;469(8):2160–9. [DOI] [PMC free article] [PubMed] [Google Scholar]
- 30.Stegemann H,Stalder K. Determination of hydroxyproline. Clin Chim Acta. 1967;18(2):267–73. [DOI] [PubMed] [Google Scholar]
- 31.Eyre D Collagen cross-linking amino acids. Methods Enzymol. 1987;144:115–39. [DOI] [PubMed] [Google Scholar]
- 32.Saville DJ. Multiple comparison procedures: the practical solution. Am Stat. 1990;44(2):174–80. [Google Scholar]
- 33.Carmer SG, Swanson MR. An evaluation of ten pairwise multiple comparison procedures by Monte Carlo methods. J Am Stat Assoc. 1973;68(341):66–74. [Google Scholar]
- 34.Conover WJ, Iman RL. Analysis of covariance using the rank transformation. Biometrics. 1982;38(3):715–24. [PubMed] [Google Scholar]
- 35.Raghavan M, Sahar ND, Kohn DH, Morris MD. Age-specific profiles of tissue-level composition and mechanical properties in murine cortical bone. Bone. 2012;50(4):942–53. [DOI] [PMC free article] [PubMed] [Google Scholar]
- 36.Yerramshetty JS, Lind C, Akkus O. The compositional and physicochemical homogeneity of male femoral cortex increases after the sixth decade. Bone. 2006;39(6):1236–43. [DOI] [PubMed] [Google Scholar]
- 37.Akkus O, Adar F, Schaffler MB. Age-related changes in physicochemical properties of mineral crystals are related to impaired mechanical function of cortical bone. Bone. 2004;34(3):443–53. [DOI] [PubMed] [Google Scholar]
- 38.Eyre DR, Weis MA. Bone collagen: new clues to its mineralization mechanism from recessive osteogenesis imperfecta. Calcif Tissue Int. 2013;93(4):338–47. [DOI] [PMC free article] [PubMed] [Google Scholar]
- 39.Binder H, Conway A, Gerber LH. Rehabilitation approaches to children with osteogenesis imperfecta: a ten-year experience. Arch Phys Med Rehabil. 1993;74(4):386–90. [PubMed] [Google Scholar]
- 40.Jacobsen CM, Barber LA, Ayturk UM, et al. Targeting the LRP5 pathway improves bone properties in a mouse model of osteogenesis imperfecta. J Bone Miner Res. 2014;29(10):2297–306. [DOI] [PMC free article] [PubMed] [Google Scholar]
- 41.Cabral WA, Perdivara I, Weis M, et al. Abnormal type I collagen posttranslational modification and crosslinking in a cyclophilin B KO mouse model of recessive osteogenesis imperfecta. PLoS Genet. 2014;10(6):e1004465. [DOI] [PMC free article] [PubMed] [Google Scholar]
- 42.Morello R, Bertin TK, Chen Y, et al. CRTAP is required for prolyl 3-hydroxylation and mutations cause recessive osteogenesis imperfecta. Cell. 2006;127(2):291–304. [DOI] [PubMed] [Google Scholar]
- 43.Choi JW, Sutor SL, Lindquist L, et al. Severe osteogenesis imperfecta in cyclophilin B-deficient mice. PLoS Genet. 2009;5(12):e1000750. [DOI] [PMC free article] [PubMed] [Google Scholar]
- 44.Grafe I, Yang T, Alexander S, et al. Excessive transforming growth factor-beta signaling is a common mechanism in osteogenesis imperfecta. Nat Med. 2014;20(6):670–5. [DOI] [PMC free article] [PubMed] [Google Scholar]
- 45.Imbert L, Auregan JC, Pernelle K, Hoc T. Mechanical and mineral properties of osteogenesis imperfecta human bones at the tissue level. Bone. 2014;65:18–24. [DOI] [PubMed] [Google Scholar]
- 46.Banse X, Sims TJ, Bailey AJ. Mechanical properties of adult vertebral cancellous bone: correlation with collagen intermolecular cross-links. J Bone Miner Res. 2002;17(9):1621–8. [DOI] [PubMed] [Google Scholar]
- 47.Fratzl-Zelman N, Schmidt I, R oschger P, et al. Mineral particle size in children with osteogenesis imperfecta type I is not increased independently of specific collagen mutations. Bone. 2014;60:122–8. [DOI] [PubMed] [Google Scholar]