Abstract
This perspective article describes the use of energy dispersive X-ray diffraction (EDXRD) to study the evolution of electrochemical energy storage materials. Using a synchrotron light source, EDXRD allows crystallographic changes in materials to be tracked from deep within large specimens, due to the use of highly penetrating X-rays and the ability to define a well-controlled diffraction gauge volume in space. Herein we provide an overview of battery work performed using the EDXRD technique, as developed at beamline X17B1 at the National Synchrotron Light Source (NSLS),6, and continued at beamline 6BM-A at the Advanced Photon Source (APS), beamline I12 at the Diamond Light Source, and beamline 7T-MPW-EDDI at the Berlin Electron Storage Ring Society for Synchrotron Radiation (BESSY II). The High Energy Engineering (HEX) beamline currently under construction at the National Synchrotron Light Source II (NSLS-II) by Brookhaven National Lab and the state of New York will further expand capability for and access to this technique. The article begins with a general introduction to the technique of EDXRD, including a description of the photon energy and d-spacing relationship and a discussion of the gauge volume. The primary topic of the review, battery characterization by EDXRD, includes discussion of batteries of differing materials chemistries (lithium-based batteries and aqueous batteries) which store energy by different mechanisms (insertion and conversion materials). A discussion of high temperature batteries is also included.
TOC Image and Caption
This review highlights the efficacy of EDXRD as a non-destructive characterization tool in elucidating system-level phenomena for batteries.
1. Introduction
Energy dispersive X-ray diffraction (EDXRD) from a high energy source allows the evolution of materials to be tracked from deep within large specimens, due to (1) the use of highly penetrating X-rays and (2) the ability to define a well-controlled diffraction gauge volume in space.1–4 It has been used for deep strain profiling in engineering problems, such as fatigue crack tip static and dynamic strain mapping and turbine blade lifetime enhancement hardening.5 The study of phase changes and equations of state at extreme pressures, measured within diamond anvil cells (DACs) has also had a long history.6–8 In these cases the gauge volume can be positioned within a sample which would otherwise be inaccessible to lower-energy photons.
This non-destructive characterization tool lends itself to the study of batteries, which are electrochemical systems generally with two electrodes (anode and cathode) separated by an electrolyte gap or separator.9, 10 To maximize surface area, compressed particles of active material often make up the electrodes, with liquid electrolyte filling the pore space. The fundamental electrochemistry of the active material can be known from laboratory experiments, but system-level phenomena not necessarily inherent to the active materials can have an equally profound impact on battery performance. These may include reaction distributions across the electrodes, pore plugging, physical isolation of active material, and many others. These may occur inhomogeneously at critical locations in the cell, and one phenomenon may trigger others.11 Such material evolution is best observed in an in situ fashion without disassembling or altering the battery, or in an operando fashion within the battery as it cycles. This is because battery dissection can result in oxidation or modification of the materials, or because there are materials that are short lived and change identity or structure when the load is removed.12, 13 A specific benefit of EDXRD is the ability to measure batteries within their native housings, including bulk engineering materials, with no need to adjust the cell construct which can alter the resultant electrochemistry.
This review presents an overview of battery work performed using the EDXRD technique, as developed at beamline X17B1 at the National Synchrotron Light Source (NSLS),14 and continued at beamline 6BM-A at the Advanced Photon Source (APS), beamline I12 at the Diamond Light Source, and beamline 7T-MPW-EDDI at the Berlin Electron Storage Ring Society for Synchrotron Radiation (BESSY II).
The HEX beamline under construction at NSLS-II by Brookhaven National Lab and the state of New York will further expand capability for this technique.15
The experimental examples chosen herein exemplify various situations under which diffraction from within the bulk of an intact battery presents clear advantages and delivers information not achievable using alternative methods, such as testing after disassembly of the cell or the use of an ad hoc model system designed to allow observation by low-energy photons from a conventional X-ray source.
2. The EDXRD technique from a high energy source
The x1–x2 scattering plane for battery EDXRD is shown in Figure 1.2 The incident white beam of X-ray radiation has an energy range up to approximately 200 keV. The beam path to the detector is determined by the collimation slit settings di and ds. The diffraction angle 2θ is fixed by placement of the detector, and the intersection of the incident and diffracted beams defines a parallelepiped-shaped diffraction gauge volume from which data is collected. By moving the battery, the gauge volume is repositioned within. In this example, a sequence of measurements conducted while moving the battery in the x1 direction would give spatially-resolved data with di resolution in the direction of current flow. Current distributions in porous electrodes are found in this direction in most situations, and thus this is usually the most interesting dimension in which to resolve diffraction data.
Figure 1.
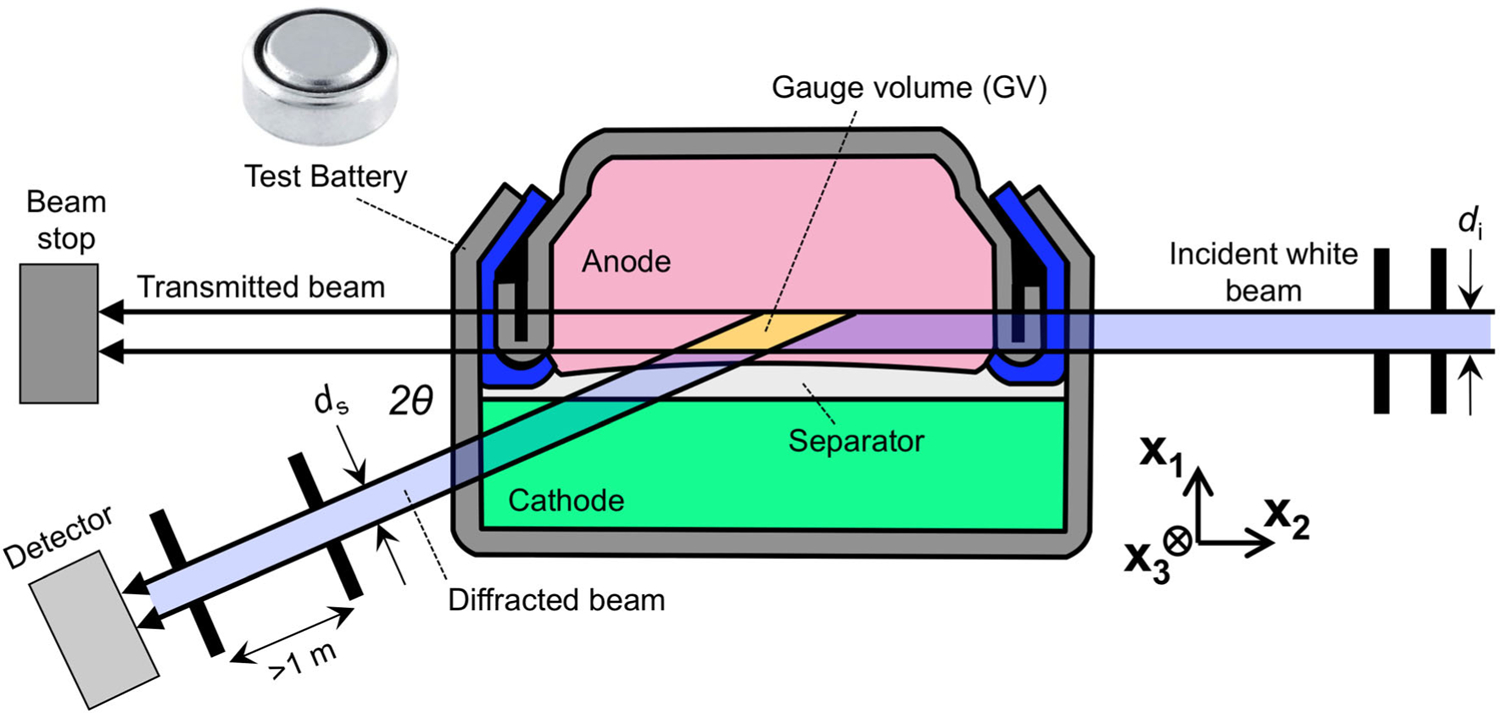
Schematic showing white beam EDXRD from a gauge volume placed within a battery. The beam path to the detector, shown in blue, is determined by the collimation slit settings di and ds. By moving the battery the gauge volume may be placed at many locations.
2.1. Photon energy and d-spacing
EDXRD data are collected as diffraction counts vs. photon energy in keV. Photon energy can be converted to d-spacing via Bragg’s law:
| [1] |
where hc is 1.2398 eV μm, E is photon energy, and θ is half the constant diffraction angle as defined in Figure 1. EDXRD data may be presented in several ways, with detector counts as a function of inverse d-spacing 1/d (cf. Figure 4), a function of photon energy in keV (cf. Figure 5), or as a function of a common 2θ standard used for lab-scale angle dispersive X-ray diffraction (ADXRD). For comparison to standard ADXRD results using CuKα radiation, the conversion to 2θequiv is:
| [2] |
where λCuKα = 0.15418 nm. EDXRD data plotted as photon energy in keV, inverse d-spacing, or as 2θequiv for CuKα radiation all result in similar plots, in which Bragg reflections for large d-spacings appear on the left of the figure, proceeding to smaller d-spacings on the right. Some EDXRD data are also plotted with d as the independent variable, moving large d-spacings to the right on the figure.
Figure 4.
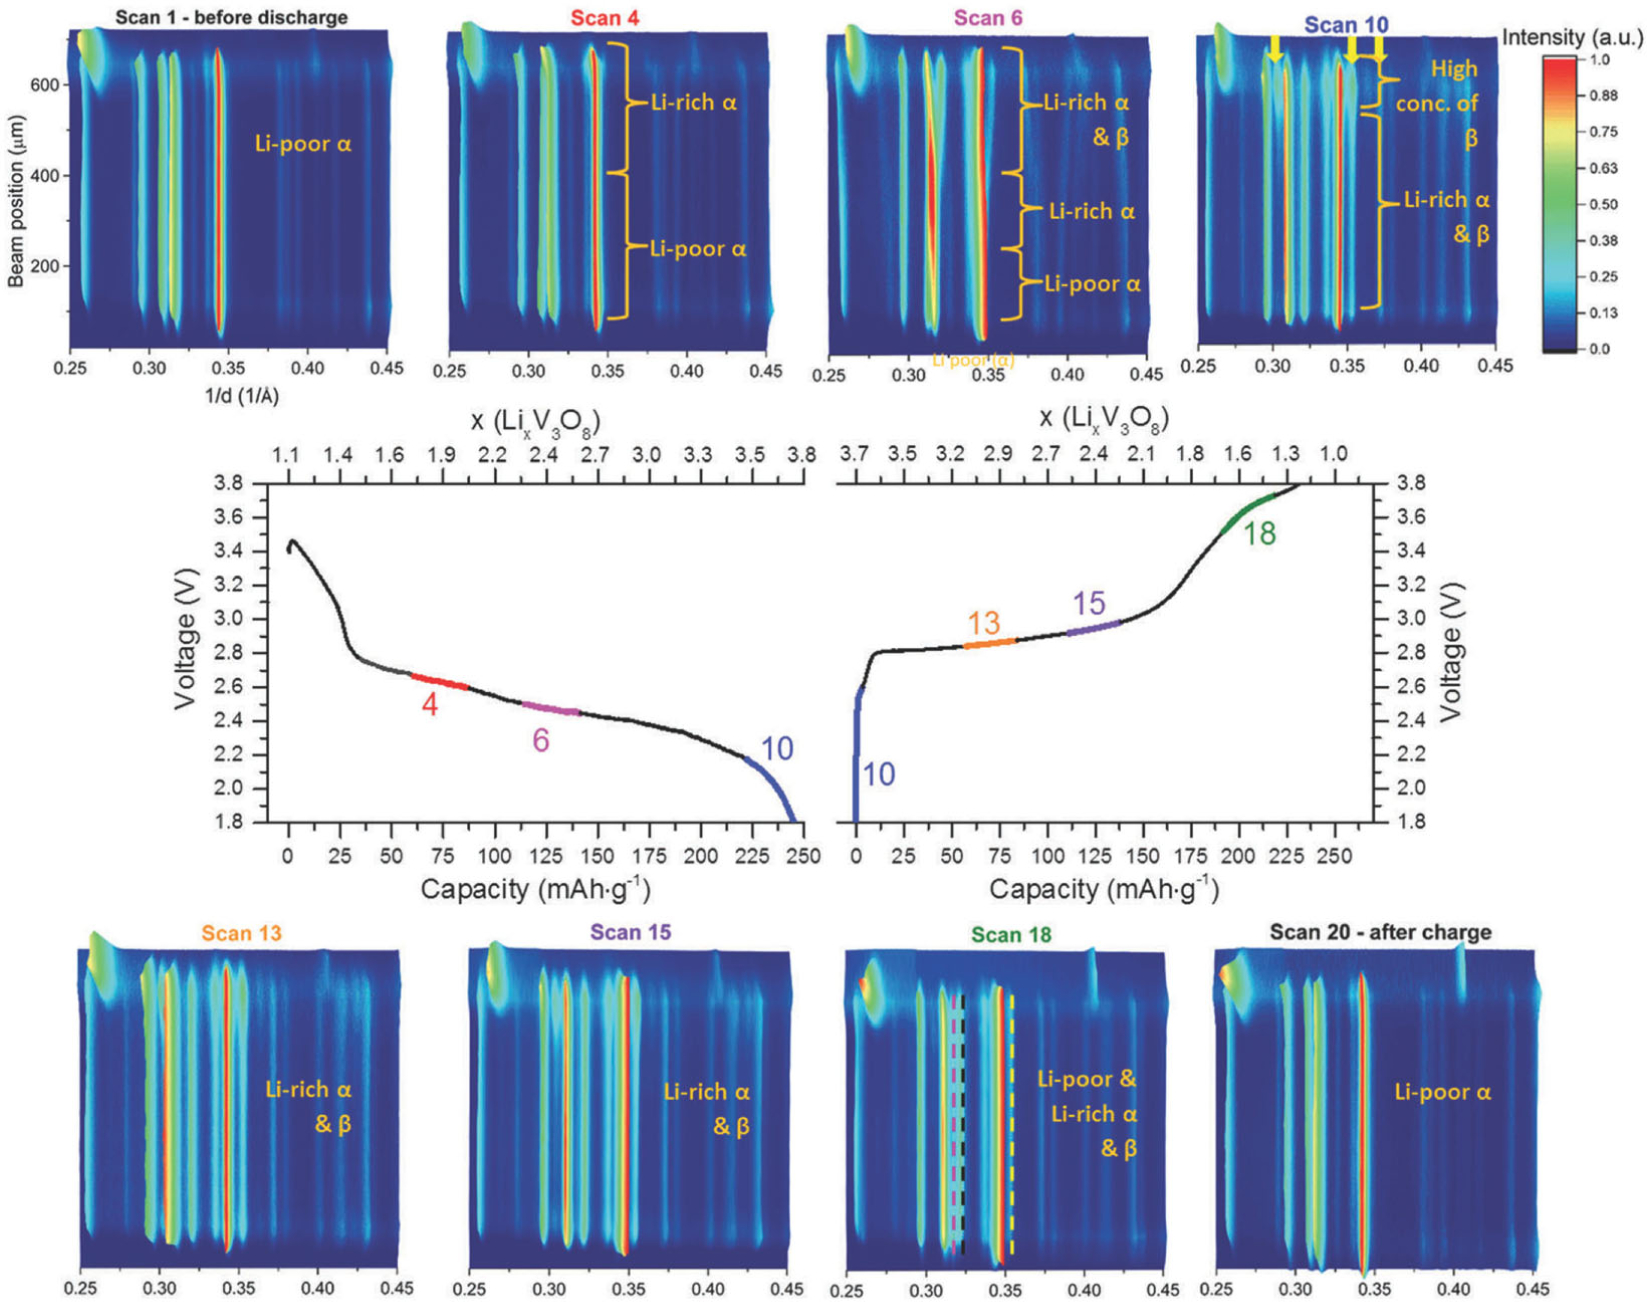
Potential profile of an LVO500 cell cycled at C/18, correlated with operando EDXRD measurements. (Reproduced from Ref. 25 with permission from the PCCP Owner Societies.)
Figure 5.
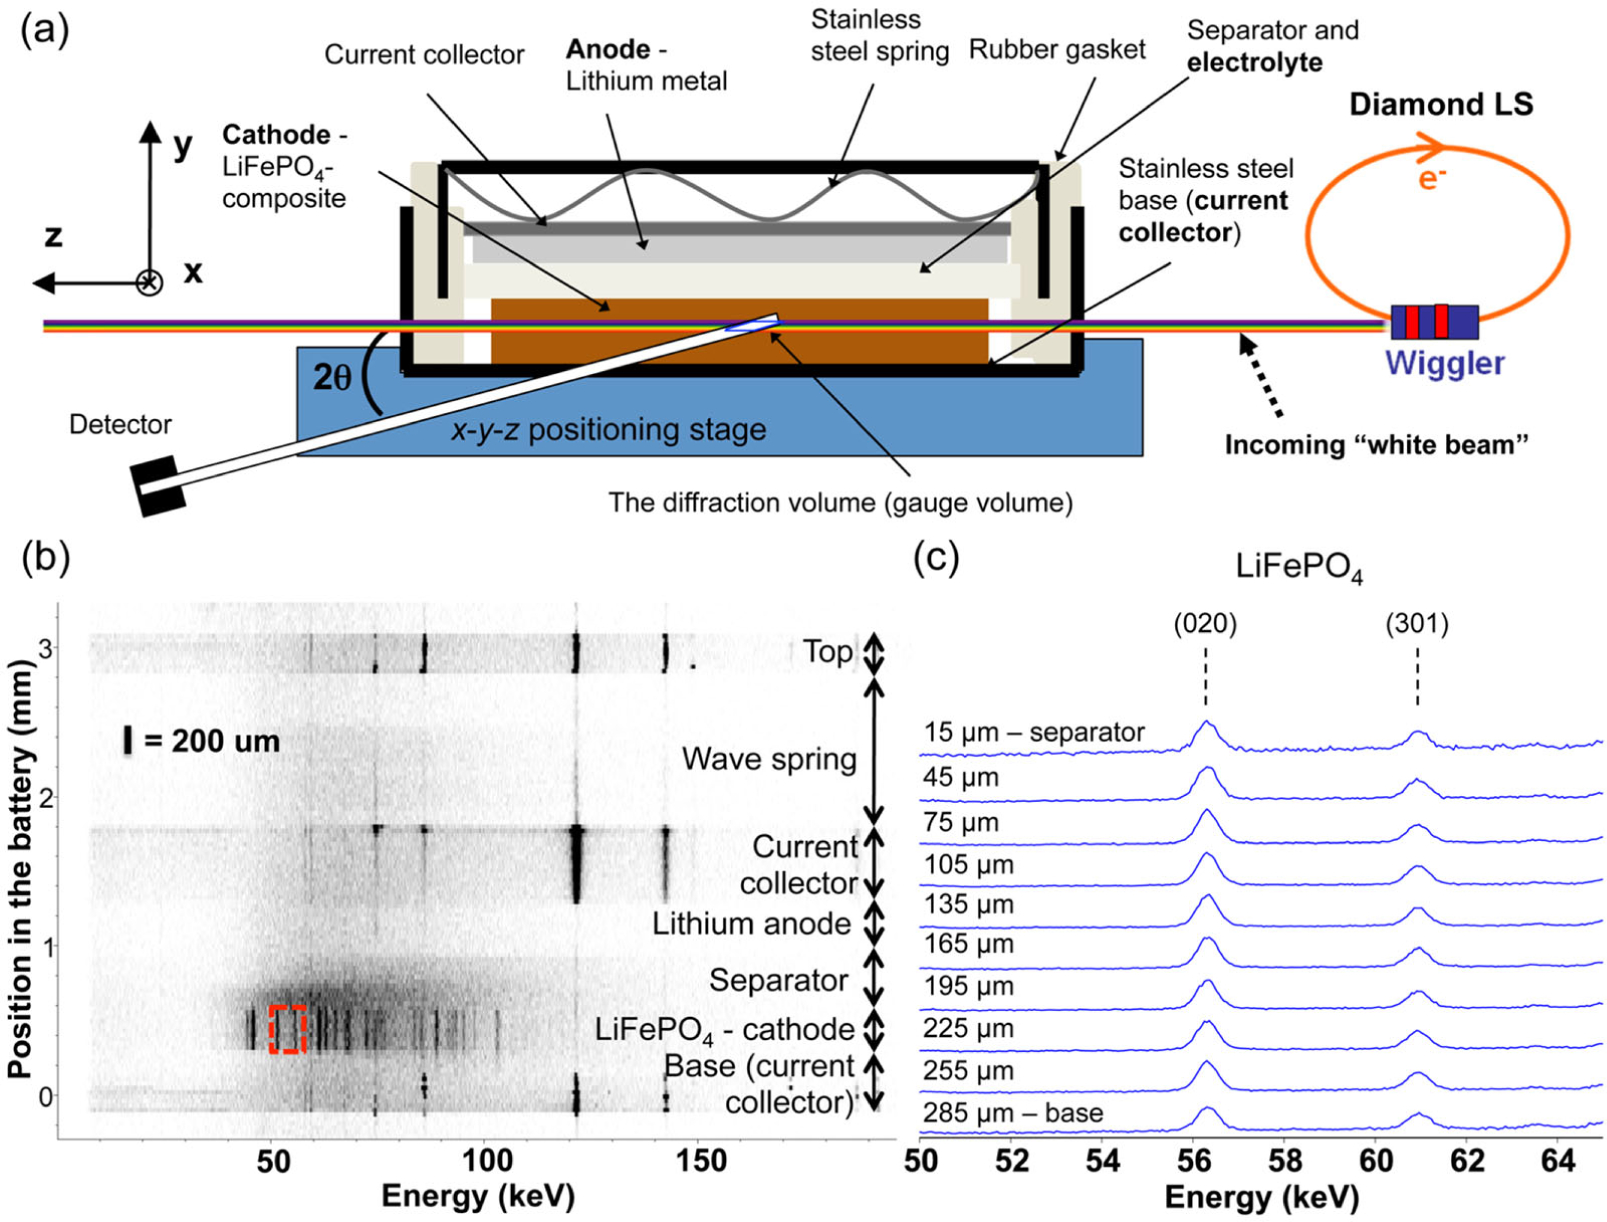
(a) EDXRD setup used to profile an LFP coin cell battery. (b) Material profile through the battery in the y-direction shown as a diffraction contour with the various regions marked. (c) Detail of the data shown in a red box in panel b shown as slices in which the LFP (020) and (301) reflections were clearly visible. (Reproduced with permission from Ref. 29. Copyright 2015, American Chemical Society.)
2.2. The EDXRD gauge volume
Due to the long diffracted beam path (>1 m) the spread of diffraction angles across the gauge volume is < 2 × 10⁻⁵ rad, and thus a diffraction pattern can be considered to sample material at a single constant 2θ. This has been confirmed by mapping the gauge volume cross-section by scanning across elemental foils.6 Length calculations for the gauge volume are given in Figure 2a, with the intensity profile shown in Figure 2b. The full width at half max (FWHM) intensity of the gauge volume in the direction of the beam is given by
| [3] |
Figure 2.
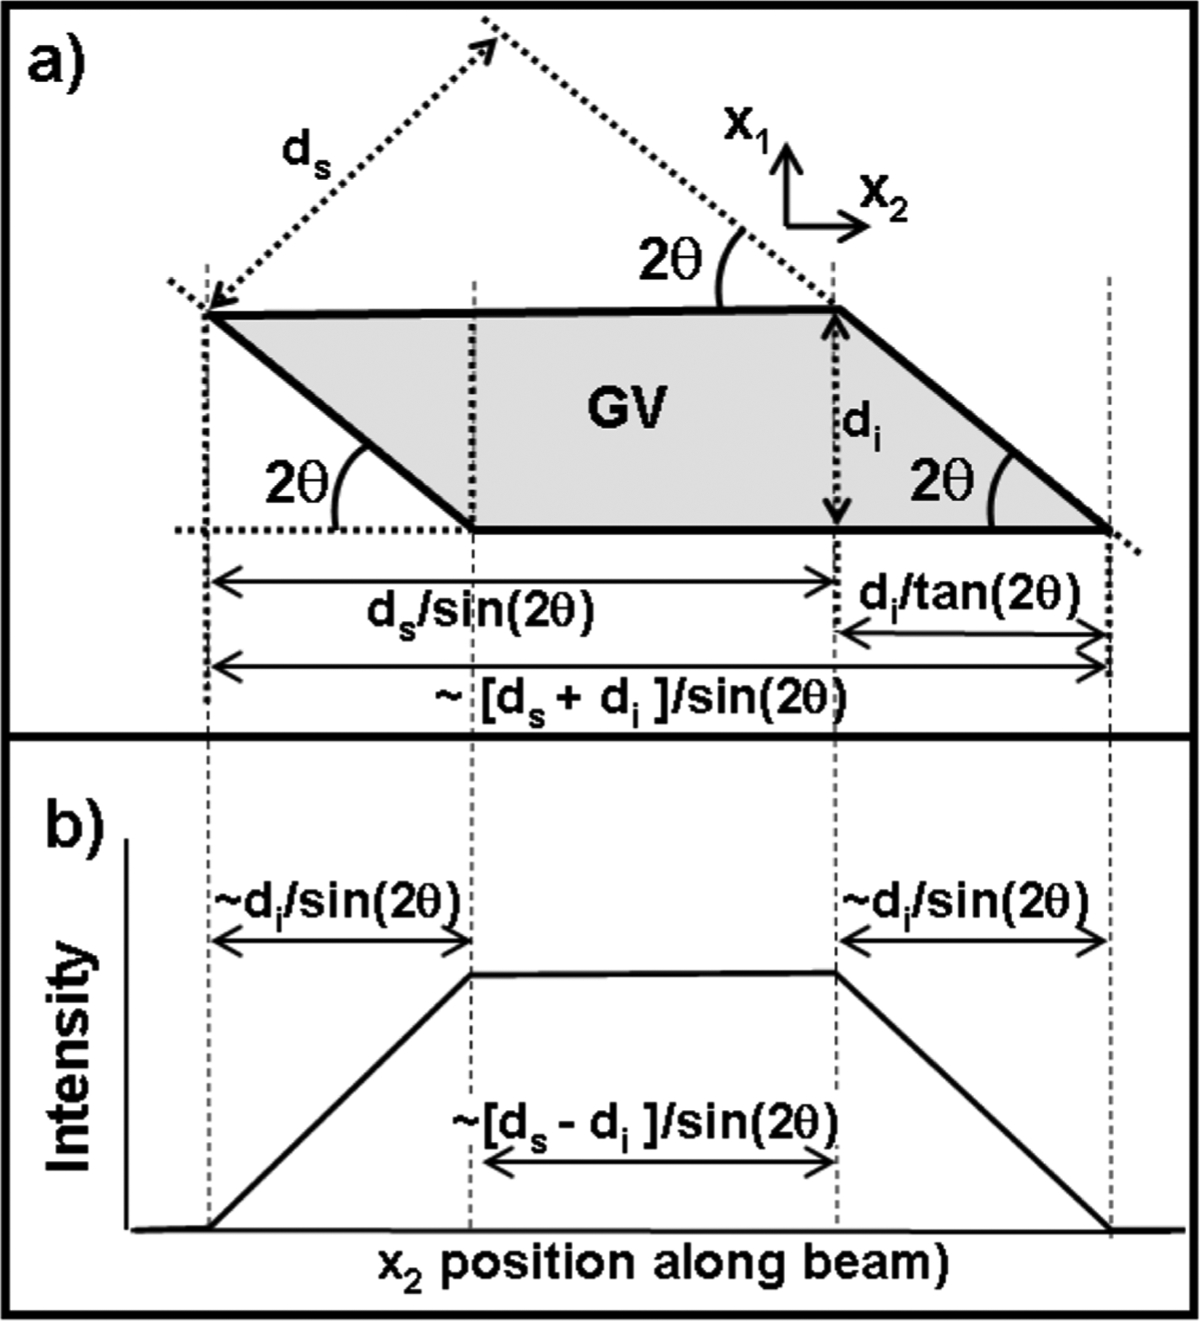
(a) A schematic of the x1–x2 gauge volume cross section with length calculations included. (b) A schematic of the scattered intensity for a thin foil scanned along the depth of the gauge volume. This curve is equivalent to the gauge volume spatial average weight function.
2.3. EDXRD resolution
Diffraction peak resolution is dictated by the properites of the detector and the geometrical resolution of the beamline.4 Each of these parameters depends upon the size of the incident beam and the slit width of the collection slits. Differentiation of the Bragg equation (Eq. [1] with the assumption that δE and δθ represent the errors within the measurements of the photon energy and Bragg angle, respectively, and are statistical, produces the following expression,
| [4] |
Wherein, δd describes the absolute precision of the interplanar spacing measurement, and δθ has a magnitude of ~10−4 radians or less. δE is reliant upon two parameters; firstly, the energy resolution of the detector, δED, and the energy broadening of the reflection due to the beam divergence, δE. As beam divergence is in the order of microradians, δE is comparable to the energy resolution of the detector, δED.
| [5] |
3. Battery characterization by EDXRD
3.1. Battery design considerations
The porous structures fabricated for most batteries are hierarchical in nature, meaning the transport of either ions or electrons in nano- or meso-scale materials impacts the behavior observed at longer length scales. Figure 3 demonstrates the scales involved in a porous cathode in which the active materials are approximately spherical particles, which in turn are agglomerates of spherical crystallites. The most fundamental level is the atomic scale, which for crystalline materials means an ordered pattern of atoms characterized by a unit cell. EDXRD allows detailed information about the unit cell to be measured as a function of both the electrode scale location and time (rb, t). The electrodes are often under significant compression, to maintain physical contact of all materials during volume changes associated with discharge or charge. The electrolyte is often relatively limited in volume. These design approaches are not universal to all batteries, but are common across a wide range of commercially relevant chemistries and form factors. Additionally, understanding the factors that contribute to the difference between theoretical energy and usable energy in a battery is critical towards developing understanding to enable future electrode designs.16
Figure 3.
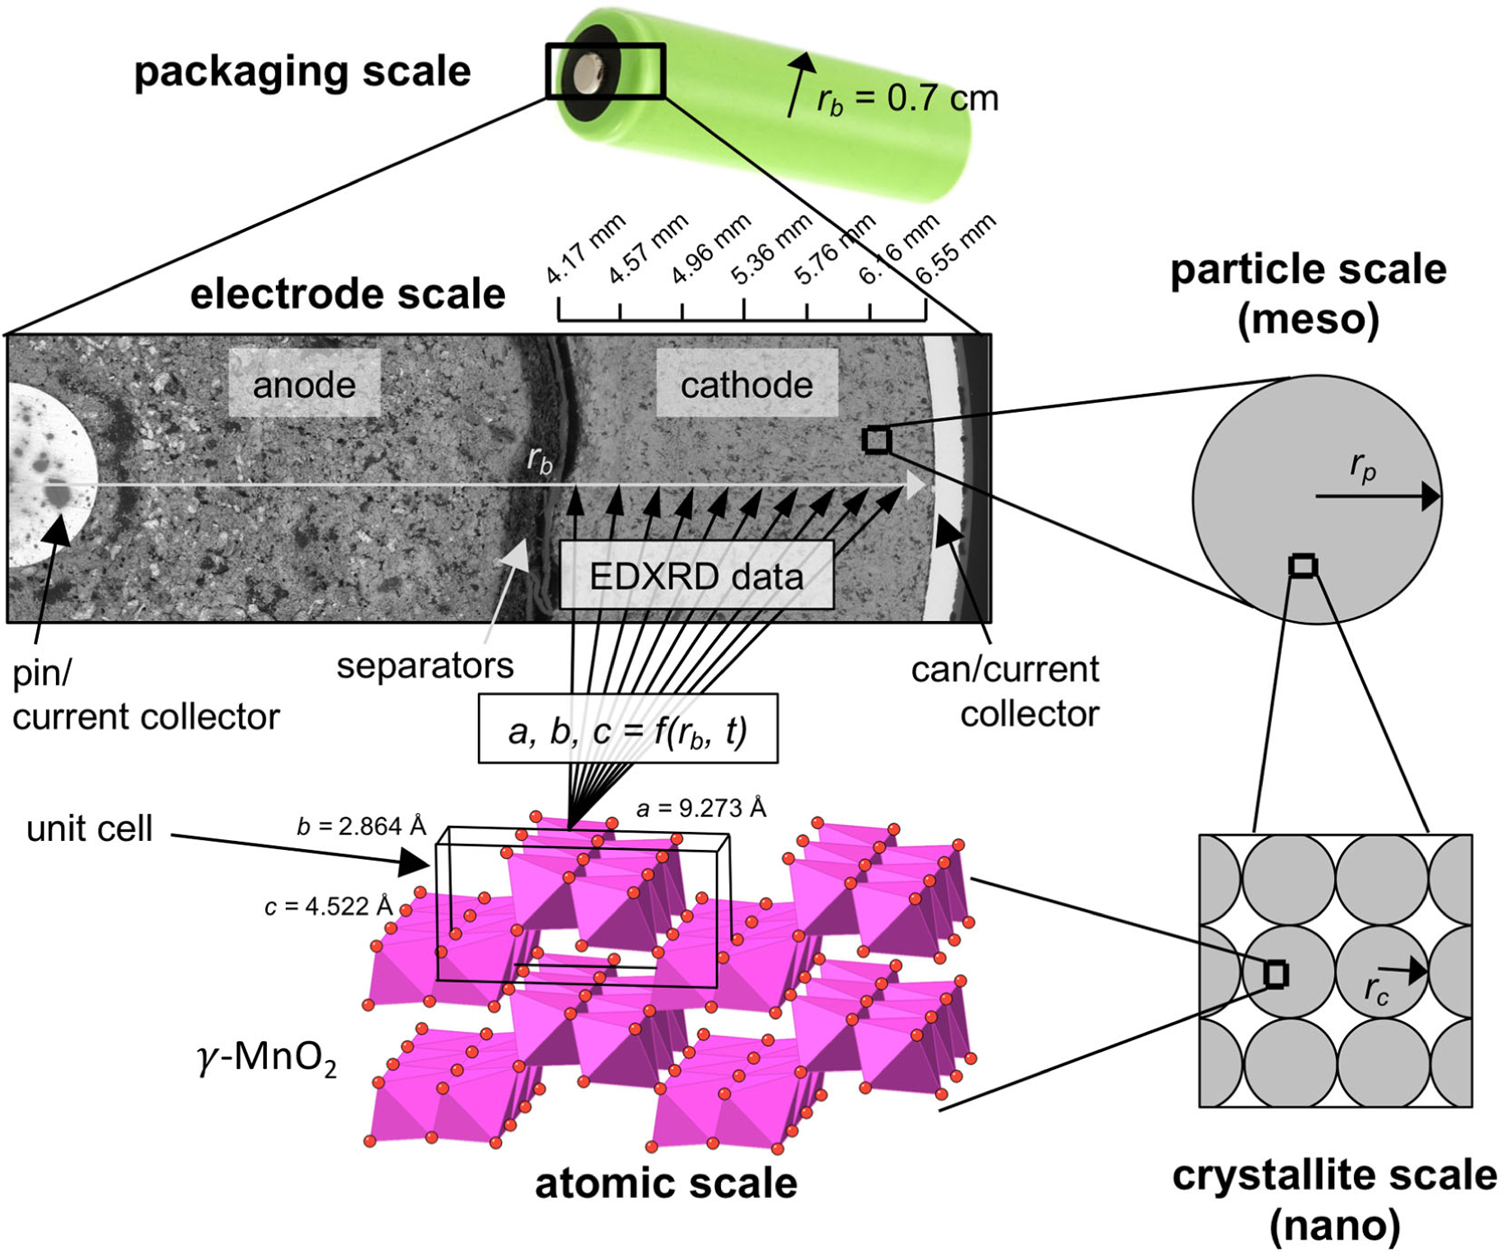
The scales involved in a porous cathode in which the active material is generally spherical particles, which in turn are agglomerates of spherical crystallites. EDXRD allows the atomic scale unit cell to be known as a function of location across the electrode scale.
The most straightforward and common approach to monitor X-ray diffraction (XRD) of battery materials is to cycle the cell to a desired state, open the cell, collect the material of interest, and perform the analysis in an ex situ fashion. However, since batteries operate under kinetic limitations, this allows the strong possibility that the equilibrated material is different than that found in the operating cell, either due to relaxation or alteration/oxidation during disassembly. If operando data is desired, an X-ray transparent windowed cell design can be used, allowing access of photons to the material within. In reflection mode, collected data will relate to the material nearest the window, which will be located in a surface region of the electrode, rather than the electrode bulk. However, this requires development of specialty cells which may not reflect the function of the battery of interest. In contrast, with high energy EDXRD the researcher can observe crystalline materials during electrochemical reactions from within the battery bulk, allowing a tomographic-like data analysis.
This includes critical locations such as buried interfaces, e.g. the electrode-separator interface. Data collection time for a full diffraction pattern is rapid, from a few seconds to tens of seconds, allowing intermediate states to be observed. This depth profiling is non-destructive and can therefore be carried out continuously as a battery is cycled. This allows the observation of progressive effects that occur over many cycles.
There are several situations in which EDXRD data provides information that is prohibitively difficult to gather another way. These may include cases with a distribution of current through the bulk electrodes, those involving materials that are sensitive to changes when removed from the cell, batteries under high temperature or pressure, or situations when two- or three-dimensional spatial mapping inside the battery is desired.
3.2. Lithium based batteries
3.2.1. Detection of simultaneous phase transformations in LVO cathodes
Vanadium-based cathode hosts hold the possibility of multiple electron transfers per vanadium atom, while still maintaining high voltage.17–20 One such material, monoclinic layered Li1+nV3O8 (n = 0–0.2) (LVO), exhibits both a high theoretical capacity of 362 mAh/g and good rate capability.21, 22 Lithiation proceeds first via transition of the layered phase α from a Li-poor to a Li-rich form, approximately Li2.5V3O8. The Li-rich α phase further lithiates until transition to a defected rock-salt phase β, in the composition range of Li3.5V3O8–Li4V3O8. Further lithiation progresses to the theoretical end member Li5V3O8
| [6] |
| [7] |
| [8] |
The evolution of these phases as a function of both cycling rate and thickness of the electrode were however in question. As the push to higher gravimetric energy density necessitates thicker electrodes, of particular interest was the progression of phase transitions given in Eq. [6]–[8] within thick electrodes at realistic cycling rate. Initial EDXRD experiments mapping LVO cathodes in situ following C/150 discharge and >1 week relaxation time revealed no spatial variations across the cathode.23, 24 Operando EDXRD diffraction collected at a C/18 rate within sealed batteries containing LVO cathode pellets 500–600 um in thickness revealed a more complex phase behavior, Figure 4.25 Specifically, the transformation from Li-poor to Li-rich α phase Eq. [6] and initiation of β phase formation Eq. [7] progress sequentially through the thickness of the electrode, where phase localization is identified through the use of EDXRD. Notably, phase evolution during charge was not the reverse of that during discharge. During charge, the transformation from β to Li-rich α and from Li-rich α to Li-poor α phases took place simultaneously, within the same gauge volume. The formation of a Li-poor α phase occurred before the total disappearance of β, with all three phases coexisting at some points.
The EDXRD study provided additional insight beyond a previous ADXRD study in which LVO electrodes 20 μm thick were cycled at C/20. As only average structure information could be obtained from ADXRD, the average discharge transformations were assigned as a successive progression from Li-poor to Li-rich α to β phase.26, 27 EDXRD allowed determination of local phase information in LVO cathodes 20 times thicker and 25 times higher in mass loading. Visualization of the local phase evolution within the hierarchical electrode structure enabled development of a coupled electrode/crystal-scale mathematical model which accurately predicted function of the electrochemical system.28
3.2.2. Evolution of electronic conductivity in LFP cathodes
Strobridge and co-workers correlated EDXRD experiments with electrochemical simulations to examine reaction inhomogeneity in Li-ion batteries with lithium iron phosphate (LixFePO4, LFP) cathodes in a standard coin cell form factor.29 The porous nature of the cathode results in uneven amounts of Li insertion at any given point and time, and this extent can be calculated from diffraction data using the relative amounts of FP (charged phase) and LFP (discharged phase) observed in the diffraction pattern.
Figure 5a shows the setup and construction of the batteries with LFP cathodes. As the primary direction of current flow was the y-direction, it was expected this would be the direction with the highest gradient of Li concentration during discharge. By stepping the battery in the y-direction, EDXRD data was collected, shown in the spatially-resolved diffraction contour in Figure 5b. The battery shell, current collectors, and spring resulted in the diffraction pattern of steel. Li, a low-scattering material, showed essentially no pattern along with the separator. The strong Bragg lines of LFP were clear in the cathode region, with the (020) and (301) reflections shown in detail as slices in Figure 5c. During the first charge of the battery, the peaks of FP appeared at the expense of the LFP peaks as the reaction progressed and higher amounts of Li were inserted into the material. During discharge, the reverse reaction occurred.
Modified-Rietveld refinements were carried out to quantify the phase fractions of FP/LFP, which are equivalent to local values of DOD or x. Non-uniformity of the first discharge is illustrated in Figure 6a, where it was clear that the onset of reaction was faster at a depth of 15 μm (next to the separator), compared with 285 μm (next to the current collector). There was a maximum gradient of 1.8 Li fraction/mm across the cathode during first discharge. Analogous results during the second discharge differed substantially as seen in Figure 6b, with the profile of Li content resembling two distinct linear regions. In this case the largest gradient was 3.7 Li fraction/mm over 15–135 μm and approximately zero over 135–285 μm. This suggested two reaction limitations during the second cycle. Thus EDXRD revealed a difference in the reaction distribution inside the cell despite the fact that the discharge voltage profiles of the first and second cycles were nearly identical. A simulation of the porous electrode during discharge was performed to examine the hypothesis that the effective electronic conductivity was reduced in the second cycle. A drop in electrical conductivity by a factor of 8 during the second discharge resulted in agreement with the EDXRD data. This indicated that two limiting factors play a role in the second-cycle discharge: electronic conductivity and the Li diffusion in the electrolyte.
Figure 6.
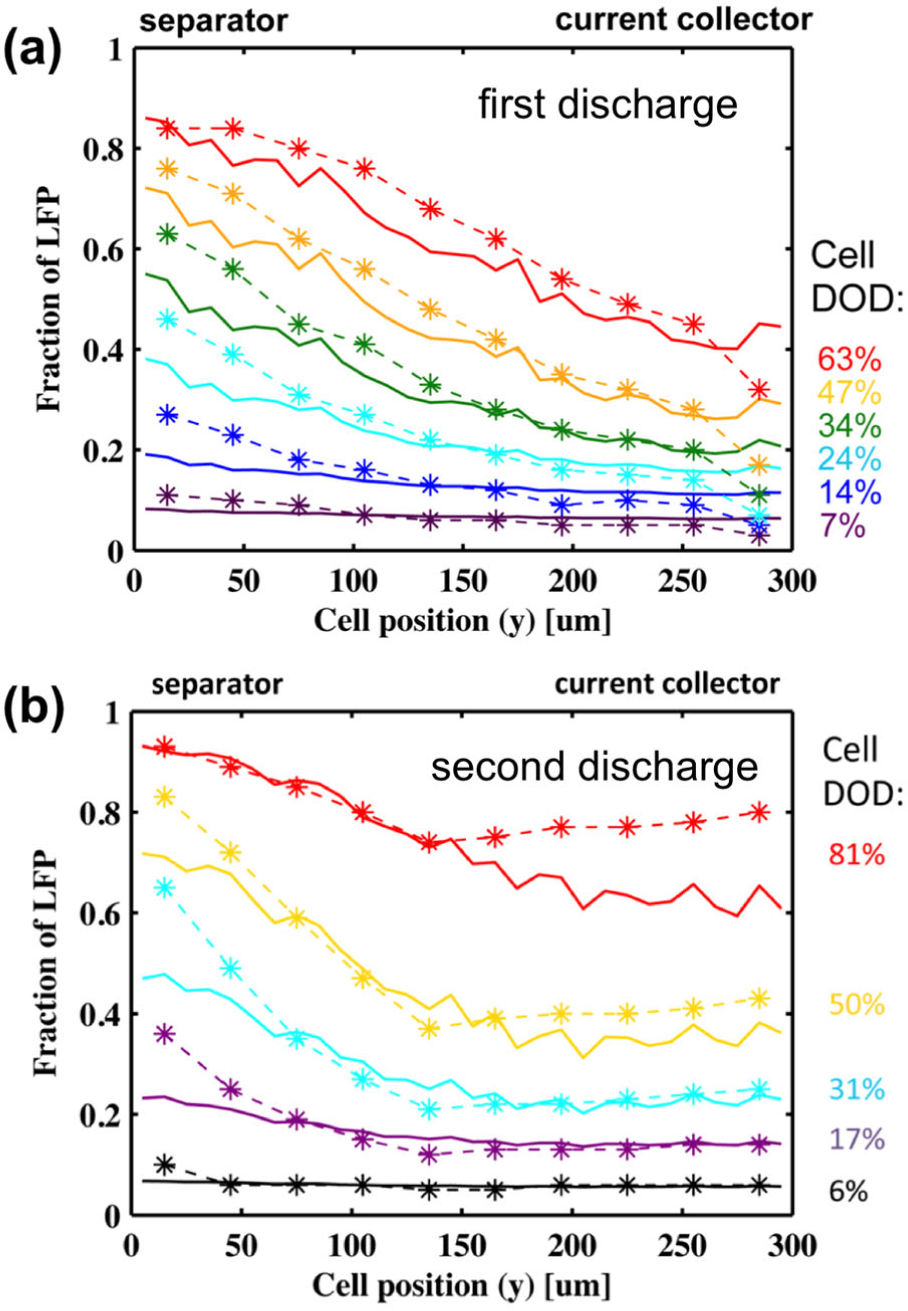
Comparison of LFP/FP phase fractions measured through the cathode y-direction by EDXRD (dashed lines) with battery simulation results (solid lines). (a) Fraction of LFP during the first discharge. (b) Fraction of LFP during the second discharge. (Reproduced with permission from Ref. 29. Copyright 2015, American Chemical Society.)
Similarly, Paxton, Zhong, and Tsakalakos used EDXRD to study LFP/FP distributions in 8 Ah lithium iron phosphate polymer cells.30, 31 Through both depth and in-plane profiling, they demonstrated that the inhomogeneity of material evolution in batteries can be elusive. This is because locally measured areas can be highly nonlinear, but the ensemble of all materials in the cell shows the expected linear behavior. As an example, of nine in-plane locations followed by operando EDXRD during discharge, two locations significantly lagged the rest of the cell. Material in these locations, located in a corner of the pouch-type cell, discharged at a locally higher rate in the later stages of discharge. They attributed this to conductivity, invoking the Thomas-Alyea resistive-reactant model.32
3.2.3. Phase distribution across a 5 V spinel cathode measured in situ
Liang and co-workers profiled prototype Li-ion cells with cation-substituted spinel Li1−xMn1.42Ni0.42Co0.16O4 cathodes.33 The general class of LiMn2-xMxO4 (where M = Cr, Co, Fe, Ni, and Cu) cathode materials were of interest as they deliver capacity around a high operating voltage of ~5 V.34, 35 However, the formation of three cubic phases during cycling results in capacity fade, as these cubic phases have a large lattice parameter difference. This effect is mitigated in the substituted material Li1−xMn1.42Ni0.42Co0.16O4 due to a smaller lattice parameter difference among the three cubic phases.36
Using a CR2032 form factor, it was found that discharged cathodes (~3.5 V) were essentially uniform, but a phase distribution was found in charged cathodes (~5 V). Figure 7 shows a 1D cross section of a charged cell from 70 EDXRD patterns collected at equal spatial intervals from top to bottom. Depth in the cell z is on the ordinate, with each pattern taken with step Δz = 46 μm, and z = 0 set as the cathode-separator interface. Bragg lines for the spinel Li1−xMn1.42Ni0.42Co0.16O4 structure are seen in the cathode, with spinel Miller indices indicated in red.
Figure 7.
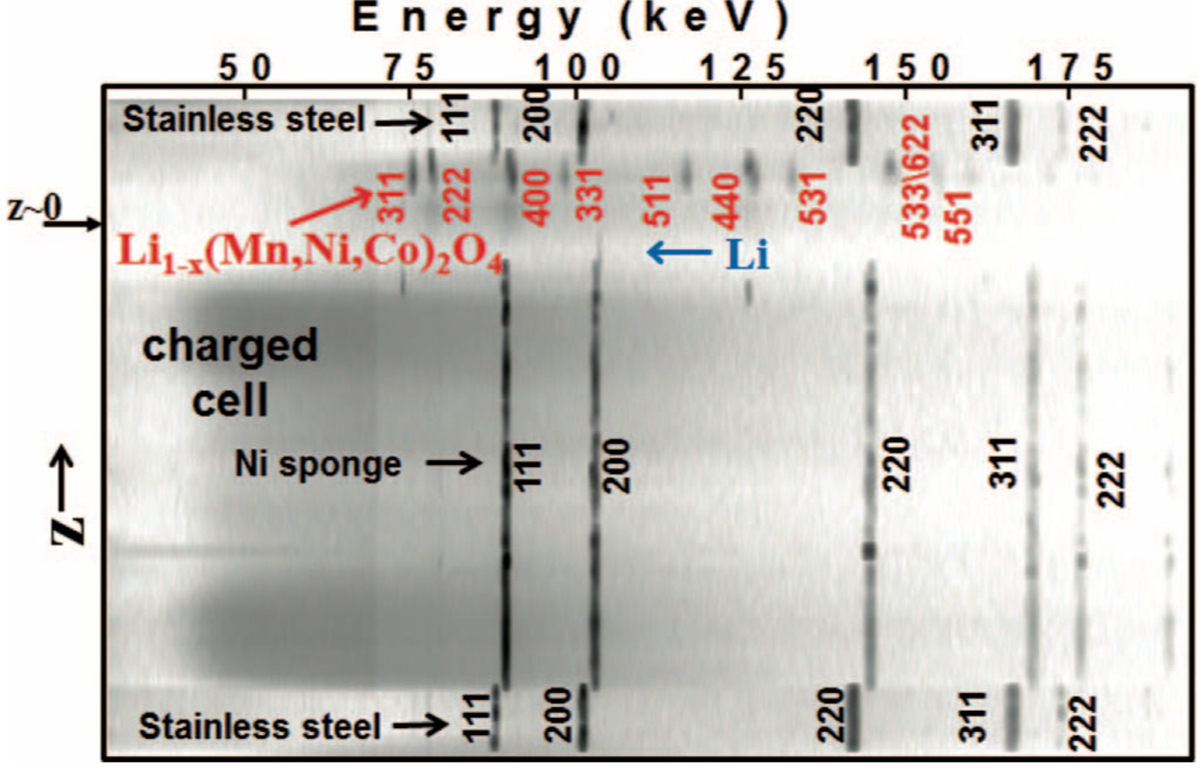
Diffraction contour plot through a charged cell containing a Li1−xMn1.42Ni0.42Co0.16O4 cathode, labeled as Li1−x(Mn,Ni,Co)2O4. Spinel phase Bragg lines shift in energy across the cathode indicating a distribution of crystalline phase. (Reproduced with permission from Ref. 33. Copyright 2013, The Electrochemical Society.)
The spinel Bragg lines in Figure 7 shifted in energy across the 0.12 mm thick cathode, indicating a distribution in crystal structure. Analysis showed the presence of the second and third cubic phases, A2 and A3 respectively. The A3 phase was dominant adjacent to the separator, but near the current collector only the A2 phase was found. Phase profiles from the EDXRD are shown in Figure 8a. These were calculated from the fitted spinel (400) reflections profiled across the cathode, some of which are shown in Figure 8b. It was assumed the cubic phases scattered equally, and fraction was determined by the fitted area corresponding to one phase, divided by the total area of both phases. The Li content at any z location could be surmised from data published by Annamalai.37 Thus the state of charge in each separate phase could be calculated: the A3 phase had a Li content of ~0.2, the A2 phase had ~0.6, and the A1 phase found in the discharged cathode also had ~0.6.
Figure 8.
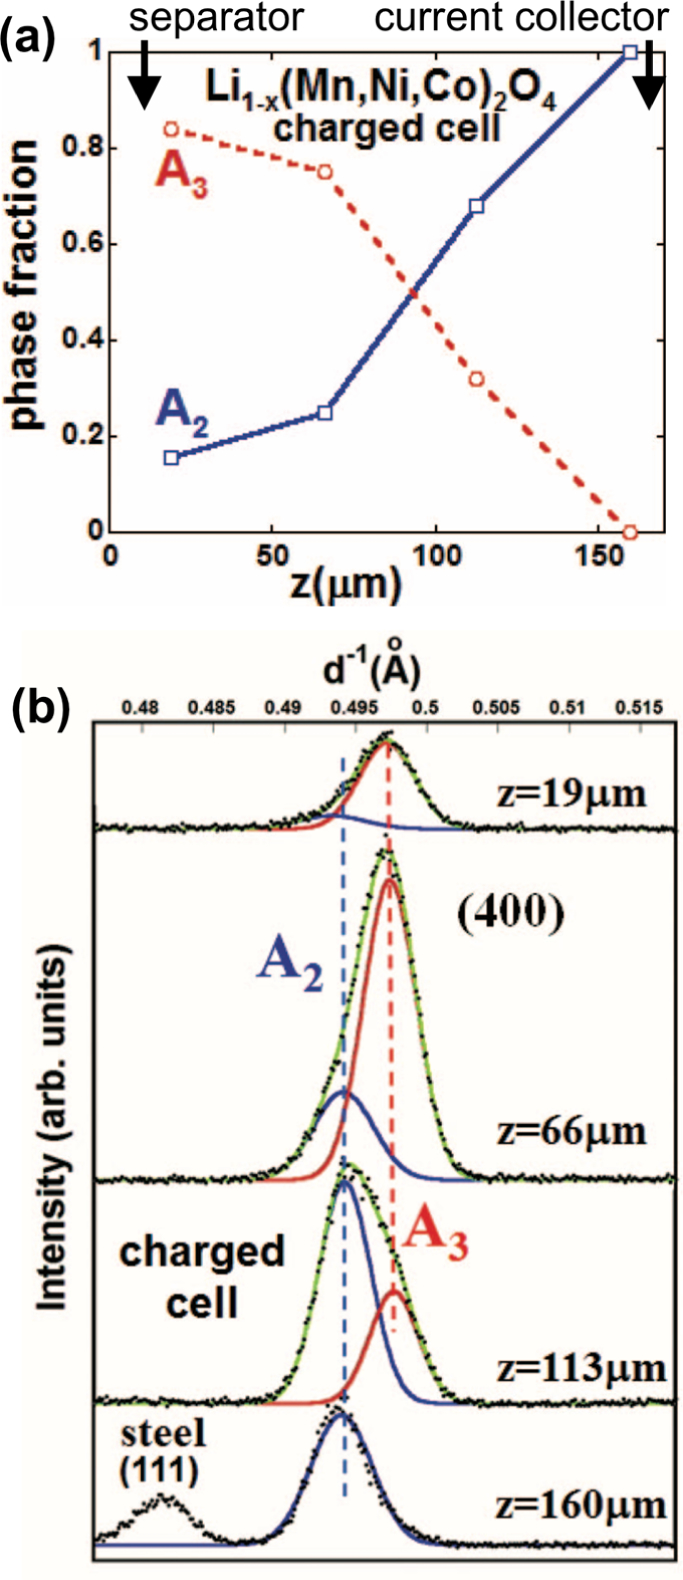
(a) Profile of the fractional A2 and A3 phase components across the charged cathode. (b) Details of the (400) reflections used to calculate the fractions in panel a. Bragg lines were fitted with a superposition of two Gaussian peaks. (Reproduced with permission from Ref. 33. Copyright 2013, The Electrochemical Society.)
3.2.4. Reduction-displacement reactions in Li/AgwVyPxOz materials
Phosphate based materials have inherently low electrical conductivity, which must be overcome for use as cathode materials in lithium based batteries. One strategy for designing cathodes with these materials is a discharge reaction that results in the in situ formation of a conductive network throughout the bulk of the electrode.38 EDXRD has been employed to investigate a family of AgwVyPxOz materials including Ag2VO2PO4, Ag2VP2O8, and Ag0.5VOPO4•H2O.27, 39–41 This class of materials has provided an opportunity to separate the roles of electrical conduction and ion transport, where electrical conduction has been shown to be the limiting factor.
Upon discharge of the silver vanadium phosphate materials, AgwVyPxOz, one of the metal ions (Ag+) is reduced to its metallic form (Ag0) through a reduction-displacement reaction, Eq. [9], where the silver metal nanoparticles form on surface of the vanadium phosphorous oxide crystal. The second metal center, (i.e. V5+ in Ag2VO2PO4 or V4+ in Ag2VP2O8) can also be electrochemically reduced, contributing additional capacity from the layered V-P-O host framework.42, 40
| [9] |
The Ag0 nanoparticles formed via reduction displacement provide electrical contact through formation of a percolation network penetrating through bulk of the electrode, and creation of conducting layers around partially-reduced particles of the parent vanadium phosphorous oxide material. For Ag2VO2PO4, the silver does not re-enter the initial structure during charge,43 and contributes to ~10,000 fold increase in conductivity upon initial electrochemical reduction.44 The increase in electrical conductivity has been directly correlated to silver metal formation.45 Therefore, elucidation of the location of the silver networks and their change as a function of depth of discharge via EDXRD provides a direct means to link electrical conductivity and electrochemical function.
The first report of an in situ EDXRD analysis of a cathode inside an intact Li-anode cell provided spatial resolution of Ag0 deposition for Li/Ag2VO2PO4. In partially discharged cells, it was found that silver metal preferentially formed on the cathode interface closest to the Li anode, with only a small amount of silver noted in the opposite cathode interface close to the current collector.40
Ag2VP2O8 cathode material reduces with silver cation reduction favored initially, followed by reduction of the vanadium centers.39 The desired profile direction was in the vertical z-direction between the separator and battery can, with a gauge volume 20 μm high along z. Spatial mapping of Ag0, the parent Ag2VP2O8, Li metal, and steel are shown in Figure 9. This was done by deconvolution of the Ag (111) and Ag2VP2O8 (132) and (151) peaks. Initially a small amount of Ag0 was present near the separator, whereas at 0.1 electron equivalents Ag0 formed in regions at both the separator and current collector and at 0.5 electron equivalents DOD Ag0 was evident throughout the thickness of the electrode, Figures 9a, b, and c, respectively. Notably, the amount of silver formed was not uniform throughout the thickness of the electrode, Figures 9b and c.
Figure 9.
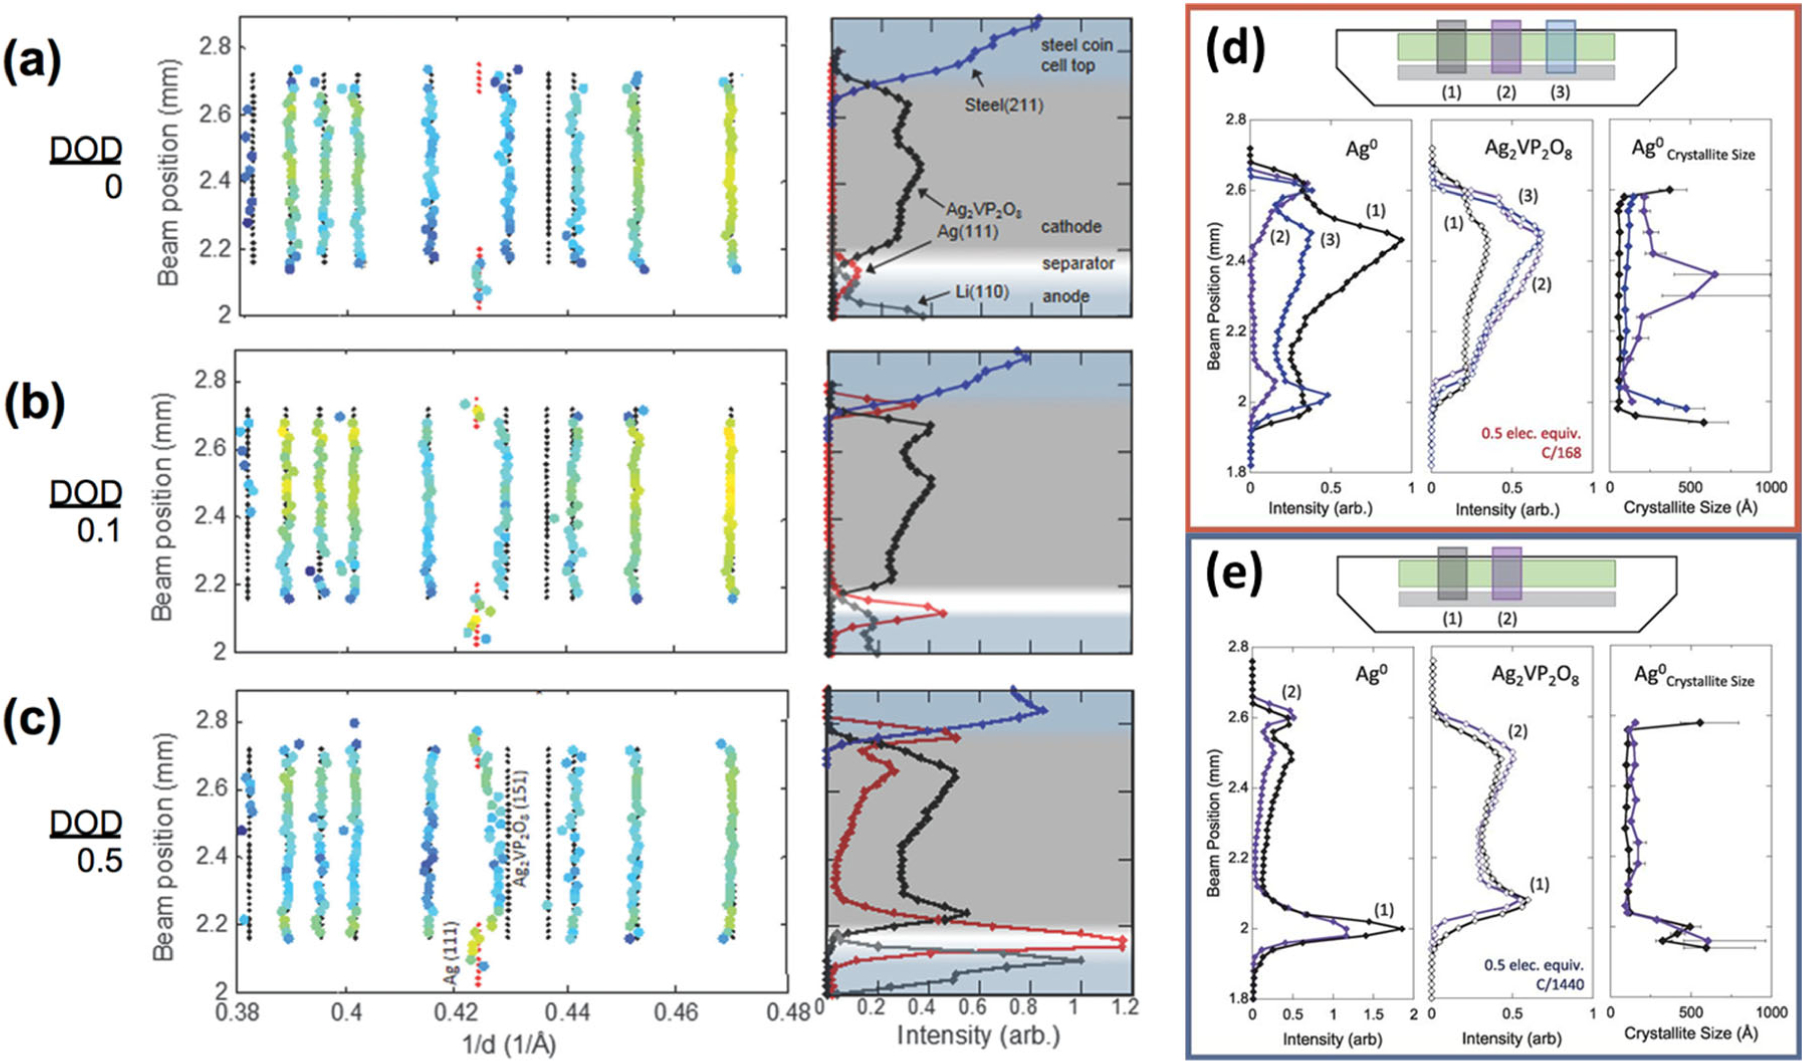
Fitted diffraction peak maxima and material profiles for Li/Ag2VP2O8 cells (a) in the initial state; (b) discharged to 0.1 electron equivalent; (c) discharged to 0.5 electron equivalents. Intensities of Ag0 and Ag2VP2O8 and crystallite size of Ag0 as a function of beam position along the z direction. (d) Cathode discharged to 0.5 elec. equiv. at the faster rate (C/168). Three x-direction locations were measured (see schematic inset). (e) Cathode discharged to 0.5 elec. equiv. at the slower rate (C/1440). Two locations along the x direction were measured in this cell (see schematic inset). ((a–c) Reproduced from Ref. 45 with permission from the PCCP Owner Societies. (d–e) Reproduced with permission from Ref. 48. Copyright 2015, American Association for the Advancement of Science.)
The effect of discharge rate on the seemingly inverse voltage profile of the Li/Ag0.5VOPO4•H2O system where high rate discharge showed higher voltage than low rate discharge, was also elucidated by EDXRD.41 The slower discharge rate (C/400) showed higher intensity of the Ag0 peak, compared to the C/170 rate, where reduction of V+5 was the preferred initial process.41
This class of bimetallic cathode has been also used as a model system to study the impact of crystallographic structure and mesoscale electrode composite on electrochemistry.25, 46 The presence of conductive (i.e. carbon) and insulative (i.e. polymeric binder) moieties in the as-prepared electrode can also have a profound effect on the distribution of Ag0 particles which forms during the reduction process, which can be readily quantified by EDXRD.41, 46, 47
3.2.5. Phase resolution of conversion materials
Conversion materials, where the electrode material can provide multiple electron transfers per transition metal center, are attractive candidates to increase battery energy density. However, a challenge in the characterization of conversion materials is a tendency for amorphitization during their redox process, as a single phase forms multiple phases as a result of conversion. For example, magnetite (Fe3O4) can deliver a maximum of eight electron equivalents per formula unit when fully lithiated (Fe3O4 + 8Li+ → 3Fe0 + 4Li2O). Magnetite is an inverse spinel, with an O2− lattice, with Fe3+ ions occupying tetrahedral (8a) sites, and mixed Fe3+ and Fe2+ ions occupying octahedral (16d) sites.49 Upon lithiation, Li ions initially insert into the octahedral sites (up to 2 electron equivalents), followed by a structural reordering to a rock-salt like phase (2–4 electron equivalents), and finally a conversion reaction forms Fe0 and Li2O (4–8 electron equivalents).50
The first report of EDXRD in a conversion type material was recently reported using magnetite, Fe3O4, where the Li/Fe3O4 cells were measured in situ after lithiation followed by 14 days of voltage recovery.51 Similar to the LiV3O8 insertion material results discussed above, homogeneity throughout the electrode thickness was observed, where the spinel phase was the major component upon discharge to one electron equivalent, and rocksalt was the major component upon discharge to two electron equivalents. Operando EDXRD of Li/Fe3O4 electrochemical cells during discharge showed heterogeneity of the phase distribution and a clear reaction front within the ~500 μm thick electrodes prepared from 30 nm Fe3O4, carbon, polytetrafluoroethylene (PTFE) binder in a mass ratio of 90:7:3.51 Even upon 7.5 electron equivalents of reduction (at 94% of theoretical capacity), conversion was evident in only ~30% of the total electrode volume, Figure 10a. In contrast, three-dimensional porous electrode (3DPE) designs were demonstrated through the inclusion of carbon nanotubes (Fe3O4-CNT) with removal of the polymeric component.52 Operando EDXRD measurements for the 3DPE Fe3O4 cell showed propagation of the conversion reaction throughout the entirety of the 500 μm thick electrode at a faster C/10 discharge rate, Figure 10b. Thus operando EDXRD has the spatial resolution necessary to visualize transport within thick (μm – mm) scale electrodes, enabling rational future electrode design.
Figure 10.
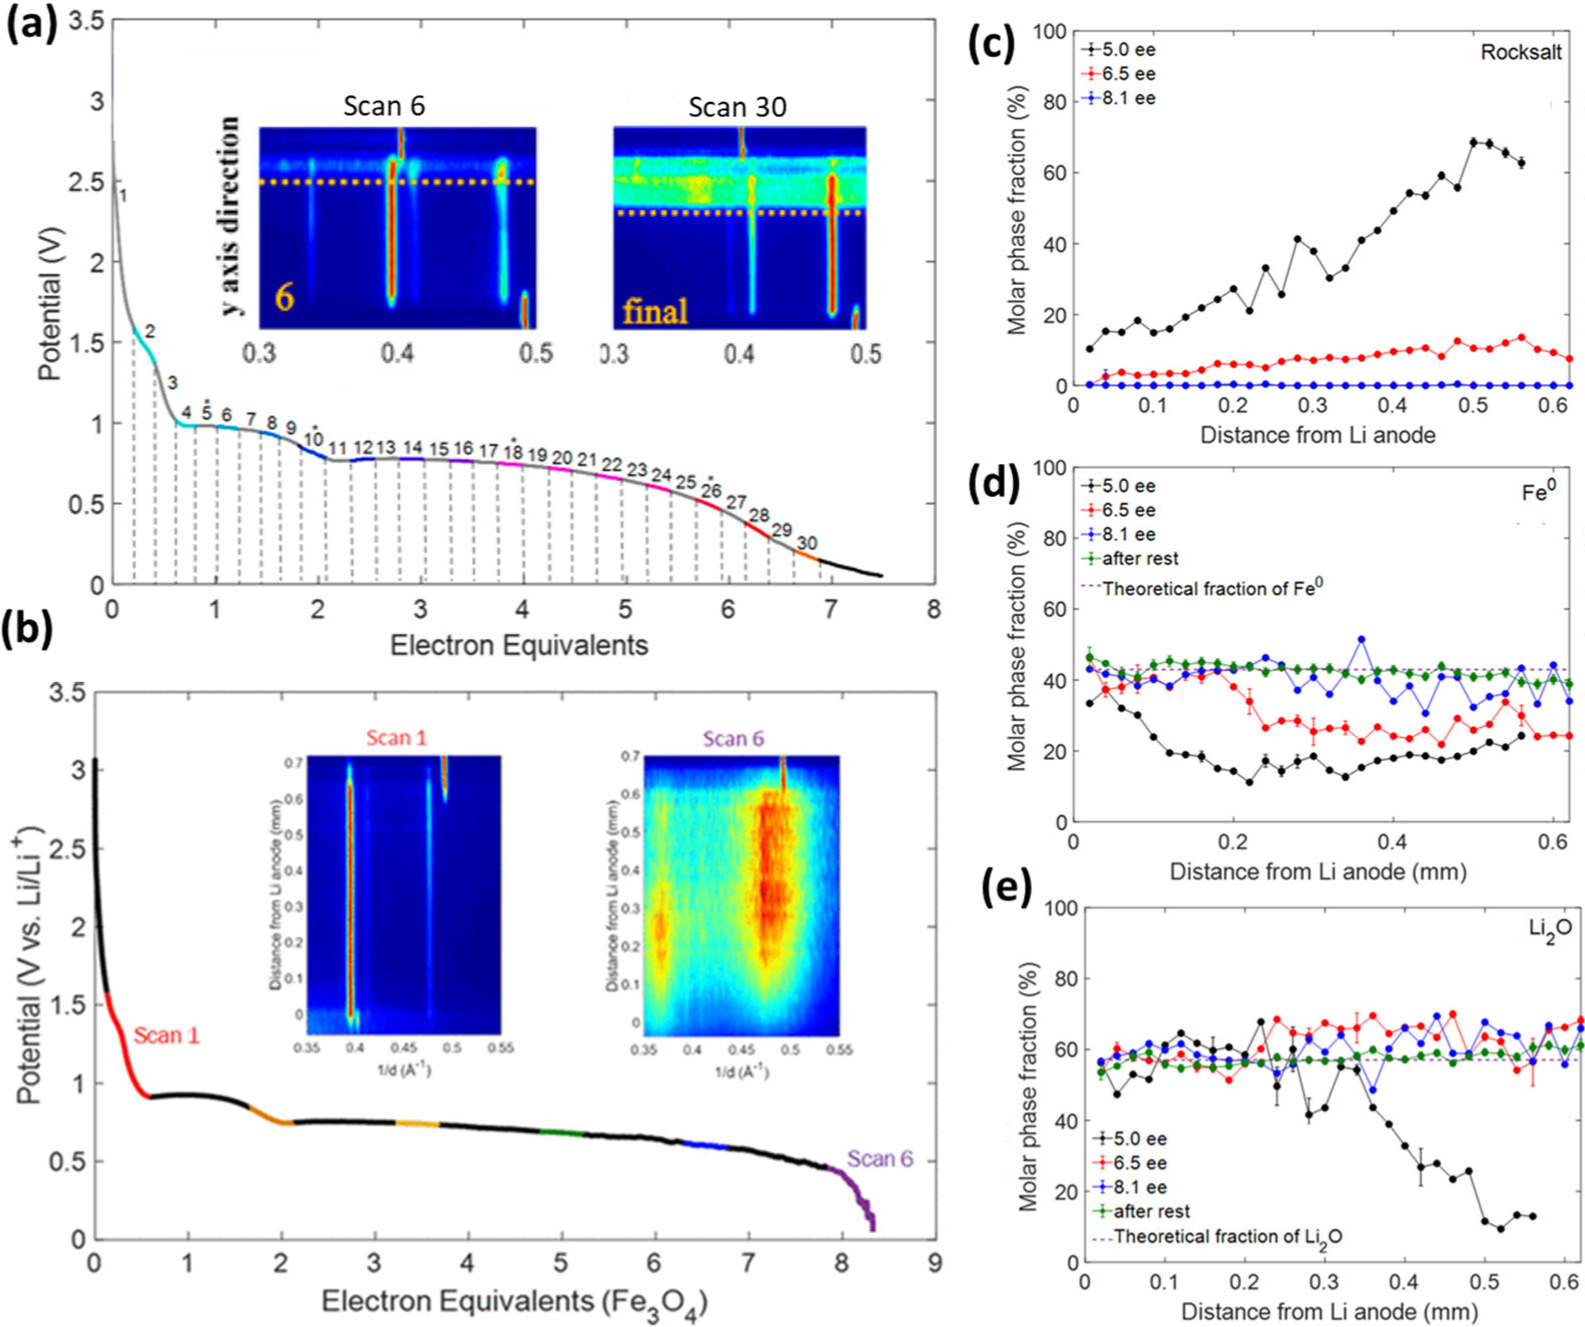
Operando EDXRD contour plots and voltage curves from galvanostatic discharge of Li/Fe3O4 cells (a) with a 450 μm Fe3O4-C-PTFE electrode discharged at a C/25 rate, and (b) with a 500 μm 3DPE Fe3O4 electrode discharged at a C/10 rate. Inset labels correspond to the numbers identified on the discharge curve. The contour plot top and bottom correspond to the Li/electrode and electrode/current collector interfaces, respectively. Molar fractions of (c) rocksalt, (d) Fe metal, and (e) Li2O phases as a function of distance from the lithium anode monitored during the conversion reaction in the Fe3O4–CNT electrode at 5, 6.5, and 8.1 electron equivalents and after rest. The theoretical fractions for the full conversion are denoted by the dashed lines in (d) and (e). ((a) Adapted with permission from Ref. 51. Copyright 2019, American Chemical Society. (b–e) Adapted with permission from Ref. 52. Copyright 2019, American Chemical Society.)
The EDXRD data from the 3DPE Fe3O4 cell were further analyzed using a Pawley refinement where the where the reflection intensities were used to describe the phase fractions in the operando scans.52 At 5.0 electron equivalents, there is a notable gradient of the FeO rocksalt like phase distribution with lower (~10%) molar phase fraction near the Li anode interface and higher (63 ± 2%) molar phase fraction adjacent to the current collector. The Fe metal phase distribution shows a different trend, with higher concentration (33 ± 0.5%) near the lithium anode and lower concentration (11 ± 1%) near the current collector. The Li2O gradient further demonstrates the difference in Li+ ion concentration throughout the electrode and indicates the limited conversion of rocksalt to Fe metal at greater distances from the Li source. Thus, while greatly enhanced in the 3DPE, the conversion reaction still appears limited by Li+ diffusion across the electrode.
3.3. Aqueous batteries
3.3.1. Spatially resolved γ-MnO2 unit cell dilation in thick electrodes
Cycling alkaline Zn-MnO2 batteries to limited depth of discharge (DOD) is an attractive solution to the problem of low-cost battery storage for the power grid. Current collector and separator material are limiting costs, and thus thick electrodes are desired. To observe the effect of 20% DOD cycling on a Zn-MnO2 battery, a cylindrical LR20 cell was observed by operando EDXRD.11 The cathode active material γ-MnO2 cycles by the reaction given in Eq. [10], but becomes irreversible after a limiting extent of reaction.
| [10] |
The zinc anode cycles as a dissolution-precipitation reaction given by
| [11] |
| [12] |
Operando EDXRD data for one cycle of the battery are shown in Figure 11, with each diffraction scan being 360 μm of radius. Initially the cathode showed the expected Bragg lines of γ-MnO2 and Zn metal in the anode. Upon discharge, lattice dilation of the γ-MnO2 occurred, apparent as shifting of the Bragg lines to lower energy as d-spacing increased. The effect was strongest next to the separator and increased until charging began at 4 hours. This was due to a strong current distribution across the relatively thick electrode. A similar effect was seen in the anode as ZnO formed preferentially at the separator at 1.5 h, then propagated through the entire anode thickness at 3.6 h. During constant voltage charge, the two electrodes evolved in different ways. Relaxation of the γ-MnO2 unit cell proceed in an essentially opposite fashion as during discharge. However, ZnO was consumed from both the front and back of the anode, leaving an annular zone of remaining ZnO in the anode’s interior at the end of charge.
Figure 11.
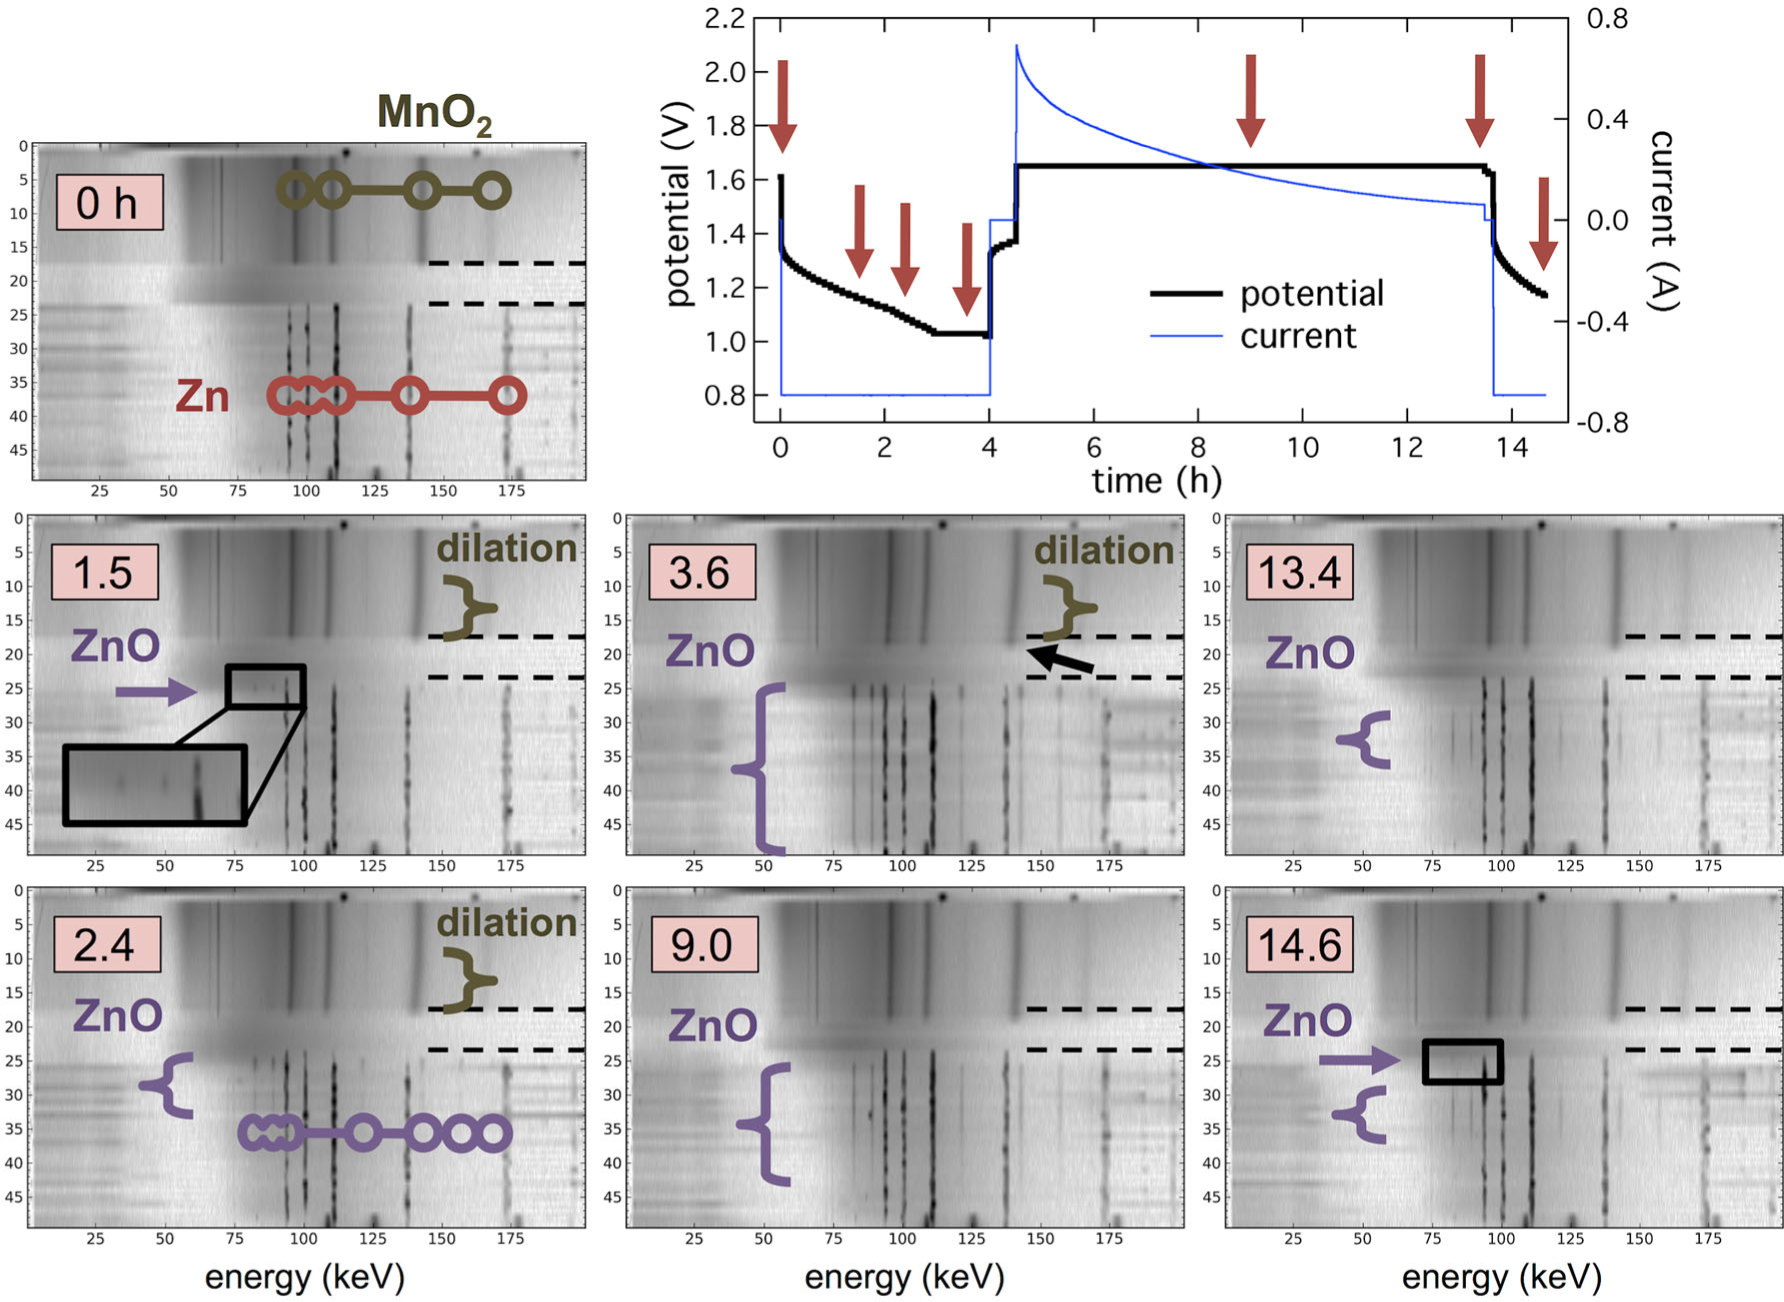
Operando EDXRD of a Zn-MnO2 alkaline cell discharged to 20% DOD at 0.69 A and recharged at 1.65 V. Arrows on cell potential/current data indicate diffraction contour timestamps. (Reproduced from Ref. 11 with permission from The Royal Society of Chemistry.)
The profile of γ-MnO2 lattice dilation is plotted in Figure 12 through the cathode bulk. It was previously reported by Mondoloni et al. that expansion of the a and c parameters beyond 1.8% and 2.7% resulted in irreversible conversion of material to an unrecoverable state.53 At this DOD, a single cycle resulted in over-dilation of the γ-MnO2 unit in a band ~720 μm from the separator. At the point the material reached the state reported to be irreversible, the cathode experienced a sudden expansion, moving its location from r = 11.1 mm to r = 10.4 mm radius. This expansion is marked in Figure 11 by a black arrow. This work indicated that 20% DOD shallow-cycling of γ-MnO2 electrodes of this thickness would result in a progressive loss of active material due to location-specific over-discharge. Development of shallow-cycled γ-MnO2 would require re-engineering the design.54 Additionally, Li intercalation into MnO2 has also been studied by EDXRD.55
Figure 12.
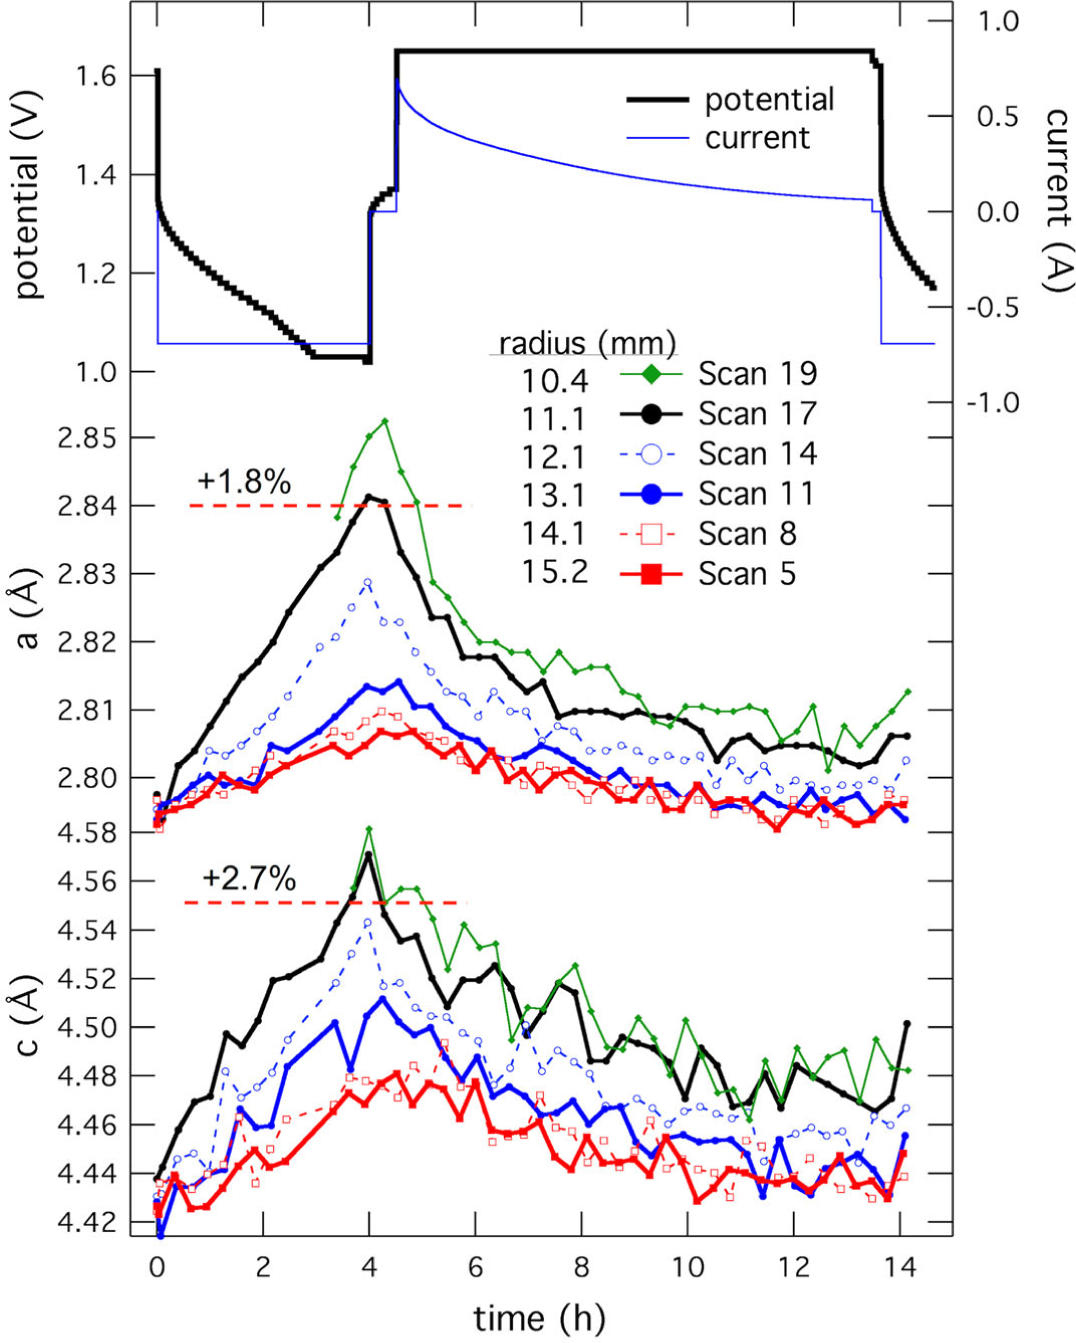
γ-MnO2 lattice parameters as a function of cell state for the battery shown in Fig. 11. Scans were different radii in the cathode, with scan 17 being the initial position closest to the separators. Scan 5 was near the cathode current collector. (Reproduced from Ref 11 with permission from The Royal Society of Chemistry.)
3.3.2. Zn-ZnO percolation network formation in alkaline batteries
Bhadra and co-workers used an EDXRD analysis to establish the point at which ZnO formed a percolation pathway throughout the anodes of cylindrical alkaline batteries.56 Zn/ZnO samples removed from cells are known to oxidize and evolve significantly under these conditions. An extensive extraction and washing procedure reported by Horn and Shao-Horn, based on internal research at Eveready, is evidence of the difficulty of ex situ analysis of Zn/ZnO composites.13
Figure 13 shows the crystalline progression in two locations during 100 mA discharge: at the anode–separator interface and at the anode–current collector interface. At the separator interface ZnO emerges at 200–300 mAh total discharge, and the ZnO formation at the current collector interface lags this slightly, occurring at 300–400 mAh. The goal of this work was explaining the sharp change in coefficient of restitution (COR) of alkaline batteries at a point during discharge, i.e. at some point they begin to bounce if dropped. Similar experiments at 200 and 300 mA discharge confirmed that this transition corresponded to ZnO reaching the current collector interface. The anode is made up of Zn particles infiltrated by gelled electrolyte, and as the exteriors of Zn particles oxidize a percolation network of ZnO forms from separator to current collector, increasing the COR.
Figure 13.
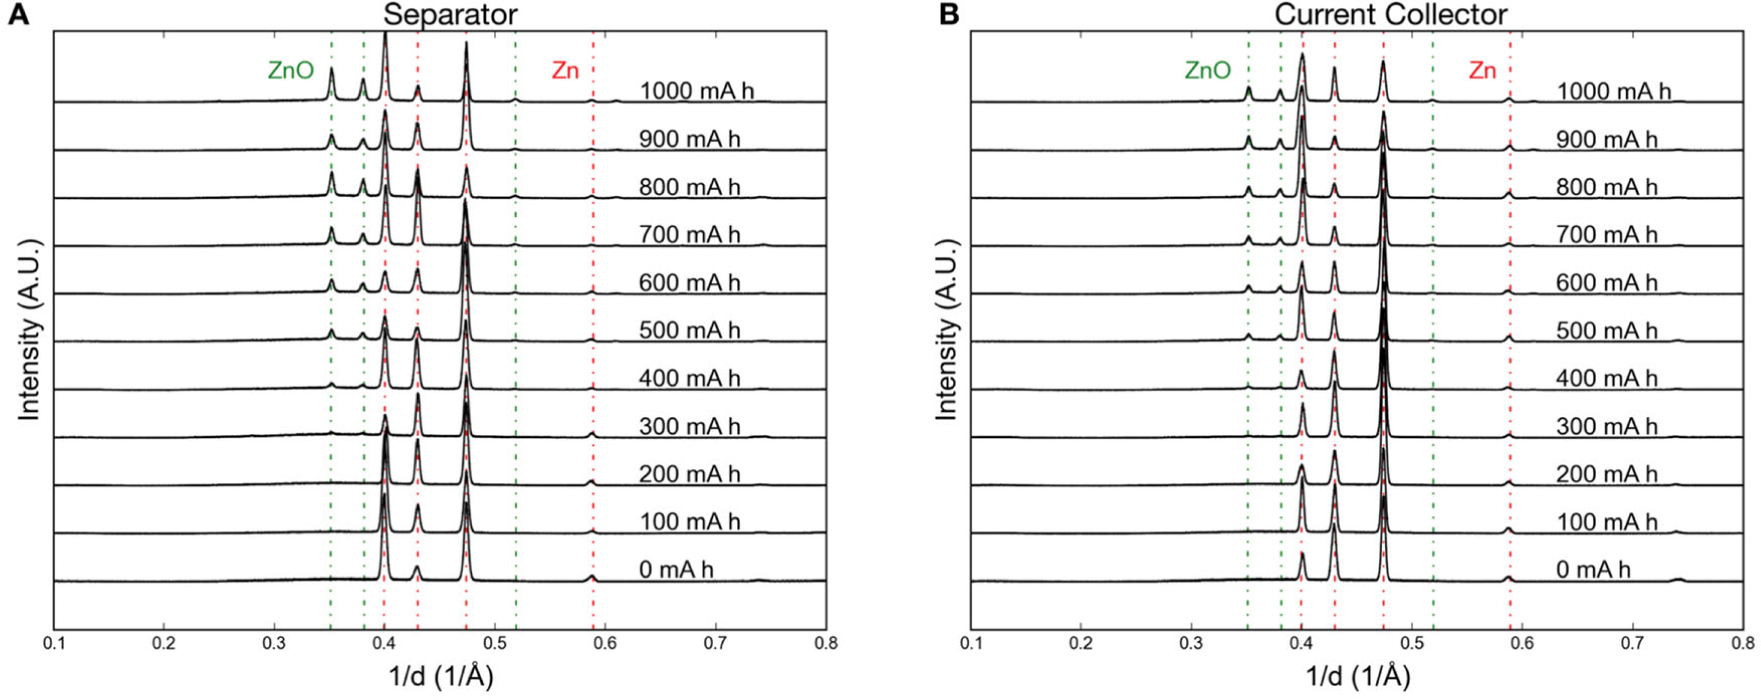
Discharge of a Zn anode at 100 mA measure by operando EDXRD. (a) At the anode–separator interface. (b) At the anode–current collector interface. ZnO forms at the separator before forming at the current collector. (Reproduced from Ref 56 with permission from The Royal Society of Chemistry.)
3.3.3. Spinel phase formation in γ-MnO2 cathodes
Gallaway and co-workers used operando EDXRD to study the γ-MnO2 discharge reaction beyond the single phase proton insertion shown in Eq. [10], to resolve the phase transformations that occur in later stages of discharge. It was known from in situ experiments that α-MnOOH, Mn3O4, and ZnMn2O4 could be found together in some discharged alkaline cells.57 However, only operando EDXRD could conclusively show that the spinel materials Mn3O4 and ZnMn2O4 formed at the expense of the discharge intermediate α-MnOOH.58 Figure 14 shows operando EDXRD data at a single point near the battery separator as the local extent of reaction xr proceeded to high values. The details to the right show the (100) reflection of MnO2 at xr = 0.73, 0.76, 0.79, and 0.81.59, 60 The (400) primary reflection of α-MnOOH first appeared at 0.79, with strong spinel reflections appearing directly after. This progression occurred at all spatial locations, and in several batteries tested at different rates, suggesting the intermediate α-MnOOH is the direct precursor to the spinel structure. The two spinels Mn3O4 and ZnMn2O4 formed at the same reaction extent, with the Zn spinel occurring preferentially in locations of high Zn(OH)42− concentration, i.e. near the separator.
Figure 14.
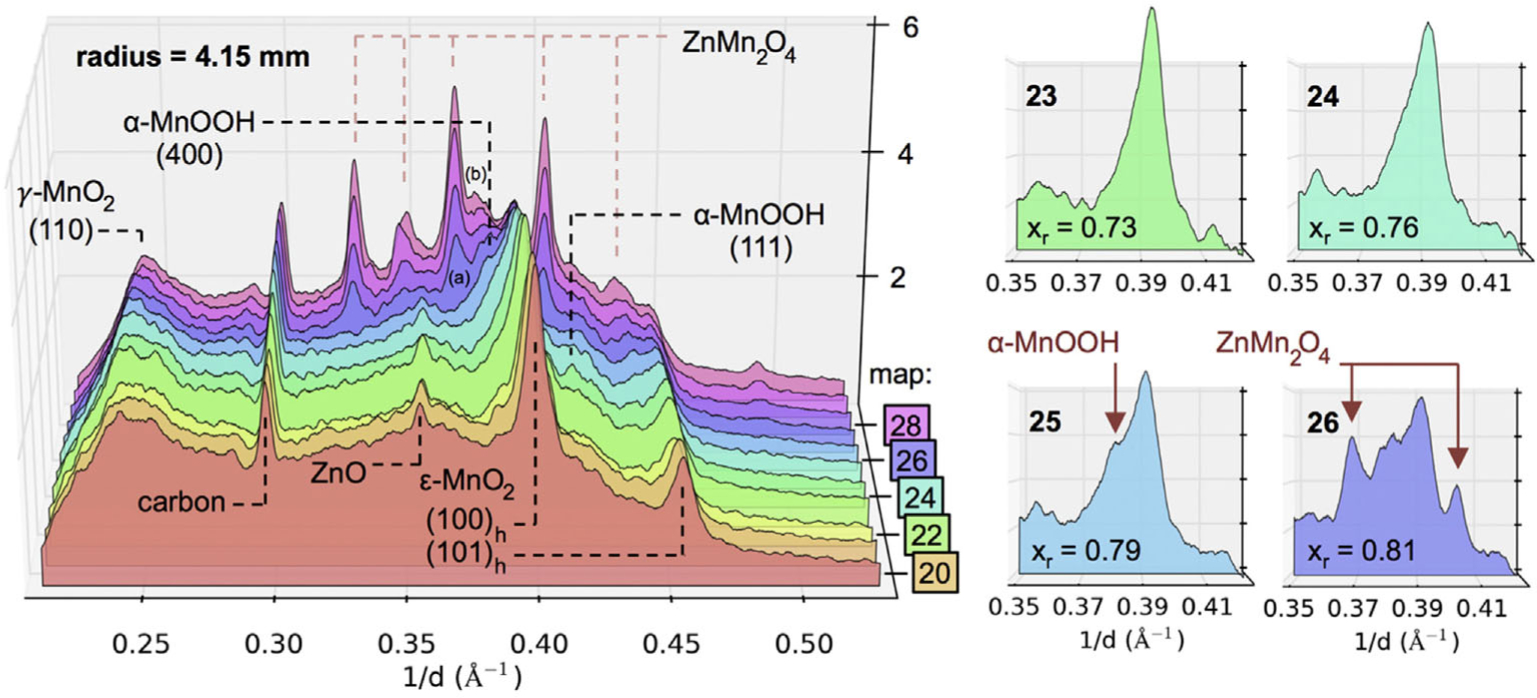
EDXRD reflections during discharge of an alkaline MnO2 cathode at 100 mA (~C/28). Details from near note (a) are shown to the right, where the progression to ZnMn2O4 formation follows α-MnOOH formation. (Reproduced with permission from Ref. 58. Copyright Elsevier, 2016.)
Subsequent EDXRD experiments on γ-MnO2 cathodes modified with Bi and Cu revealed the character of the phase change to α-MnOOH was not greatly altered by the modifying atoms, although spinel formation was suppressed in favor of Mn(OH)2.61 Modification by Bi has been reported to impart rechargeability to MnO2 at its full capacity, and co-inclusion of Cu extends this effect to electrodes of high areal capacity.62–66 In the absence of Bi, crystalline Mn(OH)2 only formed at a limited time in the final moments of discharge, and the promotion of the layered Mn(OH)2 by Bi is essential to the mechanism of rechargeability.
3.4. High temperature batteries
3.4.1. Reaction front movement in high temperature sodium metal halide batteries
The general class of sodium-nickel chloride or ZEBRA batteries operates at high temperature, with a β”-alumina solid electrolyte (BASE) or separator.67–70 The negative electrode is liquid sodium. The positive electrode is a porous structure of Ni and NaCl, which is infiltrated by molten sodium tetrachloroaluminate or NaAlCl4. Sodium ions can transport through the solid BASE separator and the liquid NaAlCl4 found throughout the positive electrode. There the discharge/charge involves interconversion of Ni metal and NiCl2, both of which are solids. A version of this battery developed by General Electric was referred to as a sodium metal halide (NaMx) battery, and the metals Ni and Fe were both used in the positive electrode, making the reaction that in [13] and [14], where M is Ni or Fe.9, 10
| [13] |
| [14] |
A schematic of a GE sodium metal halide battery is shown in Figure 15a. Cells were 23 cm in height with a 3.5 × 3.5 cm2 cross section. The BASE tube is corrugated to increase surface area and reduce ohmic resistance, resulting in a butterfly shape in the cross sectional CT image in Fig 15b.66 The positive electrode or cathode is within the tube, with the negative electrode or anode in the space between the tube and the square cell containment. To maintain the cell at 300 °C it was positioned inside a rectangular aluminum sleeve with heating elements attached.
Figure 15.
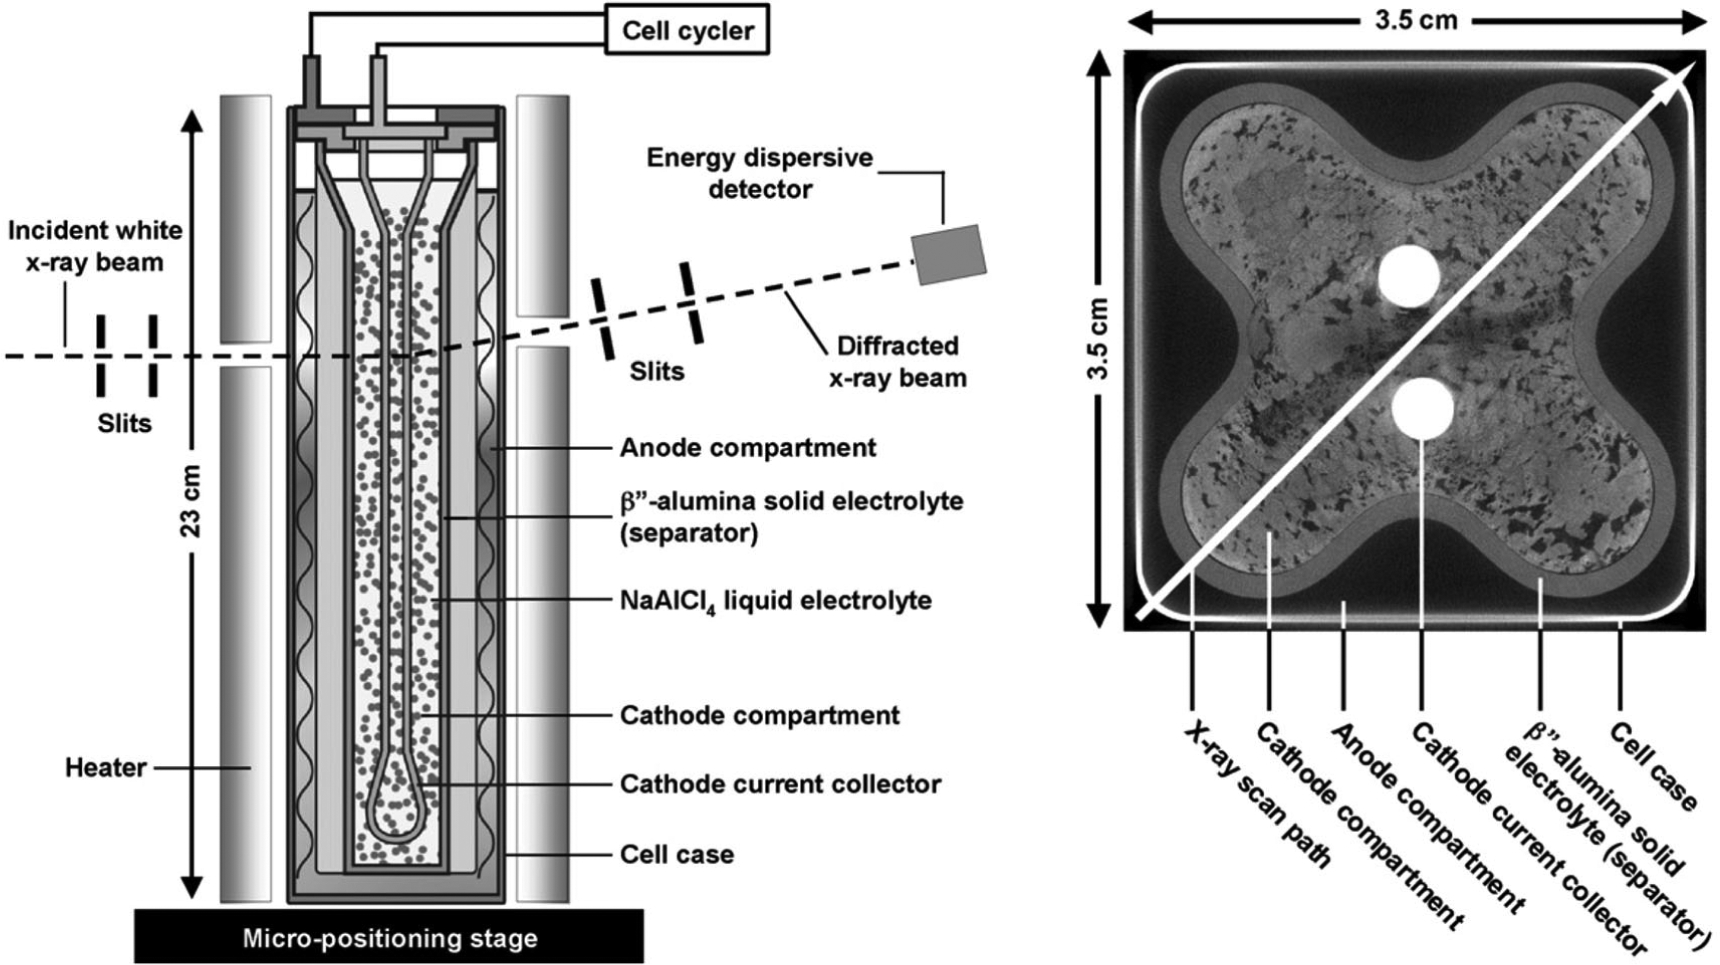
Sodium metal halide cells. (a) Schematic of the tubular cell in the EDXRD experimental setup. (b) Cross-sectional computed tomography (CT) image of a cell showing arrangement of the electrodes. The arrow along the cell diagonal denotes the path of EDXRD spatial profiling, requiring an X-ray penetration depth of up to 50 mm. (Reproduced with permission from Ref. 9. Copyright Elsevier, 2011.)
During battery operation, a reaction front in the cathode travels from the surface of the BASE separator toward the current collector at the center of the cell.71 Using EDXRD, Rijssenbeek and co-workers characterized these reaction fronts in sodium metal halide batteries. Figure 16a shows a spatial profile of a cell discharged to 50% at 32 A, a 1C rate. The profile is along the diagonal as shown in Fig 15, with NaCl peaks (discharged state) near the BASE and MCl2 peaks (charged state) closer to the central current collector. Window integrated intensities for the NaCl (220) and MCl2 (107) Bragg reflections illustrate the relative distribution of phases. The gray regions reveal the locations of active discharge reaction, thus quantifying both the location and width of the reaction front. The reaction front was narrow, 3–4 mm in width, with relative inactivity in the balance of the cathode at this point in discharge. Temporal snapshots across the cell diagonal for the corresponding charging reaction are shown in Fig 16b. Only the NaCl phase is seen in the fully discharged contour (0%). At a 29% state of charge, the NaCl Bragg lines have receded, while MCl2 lines have formed inward from the BASE interface. NaCl continues to recede, replaced by MCl2 as charge continues, with only a small trace of NaCl remaining at the current collector once the cell is near fully charged (99%). Recent developments in intermediate and low temperature Na-NiCl2 batteries have sparked interest in use of the chemistry as a low cost energy storage system for stationary electrical storage.72–75
Figure 16.
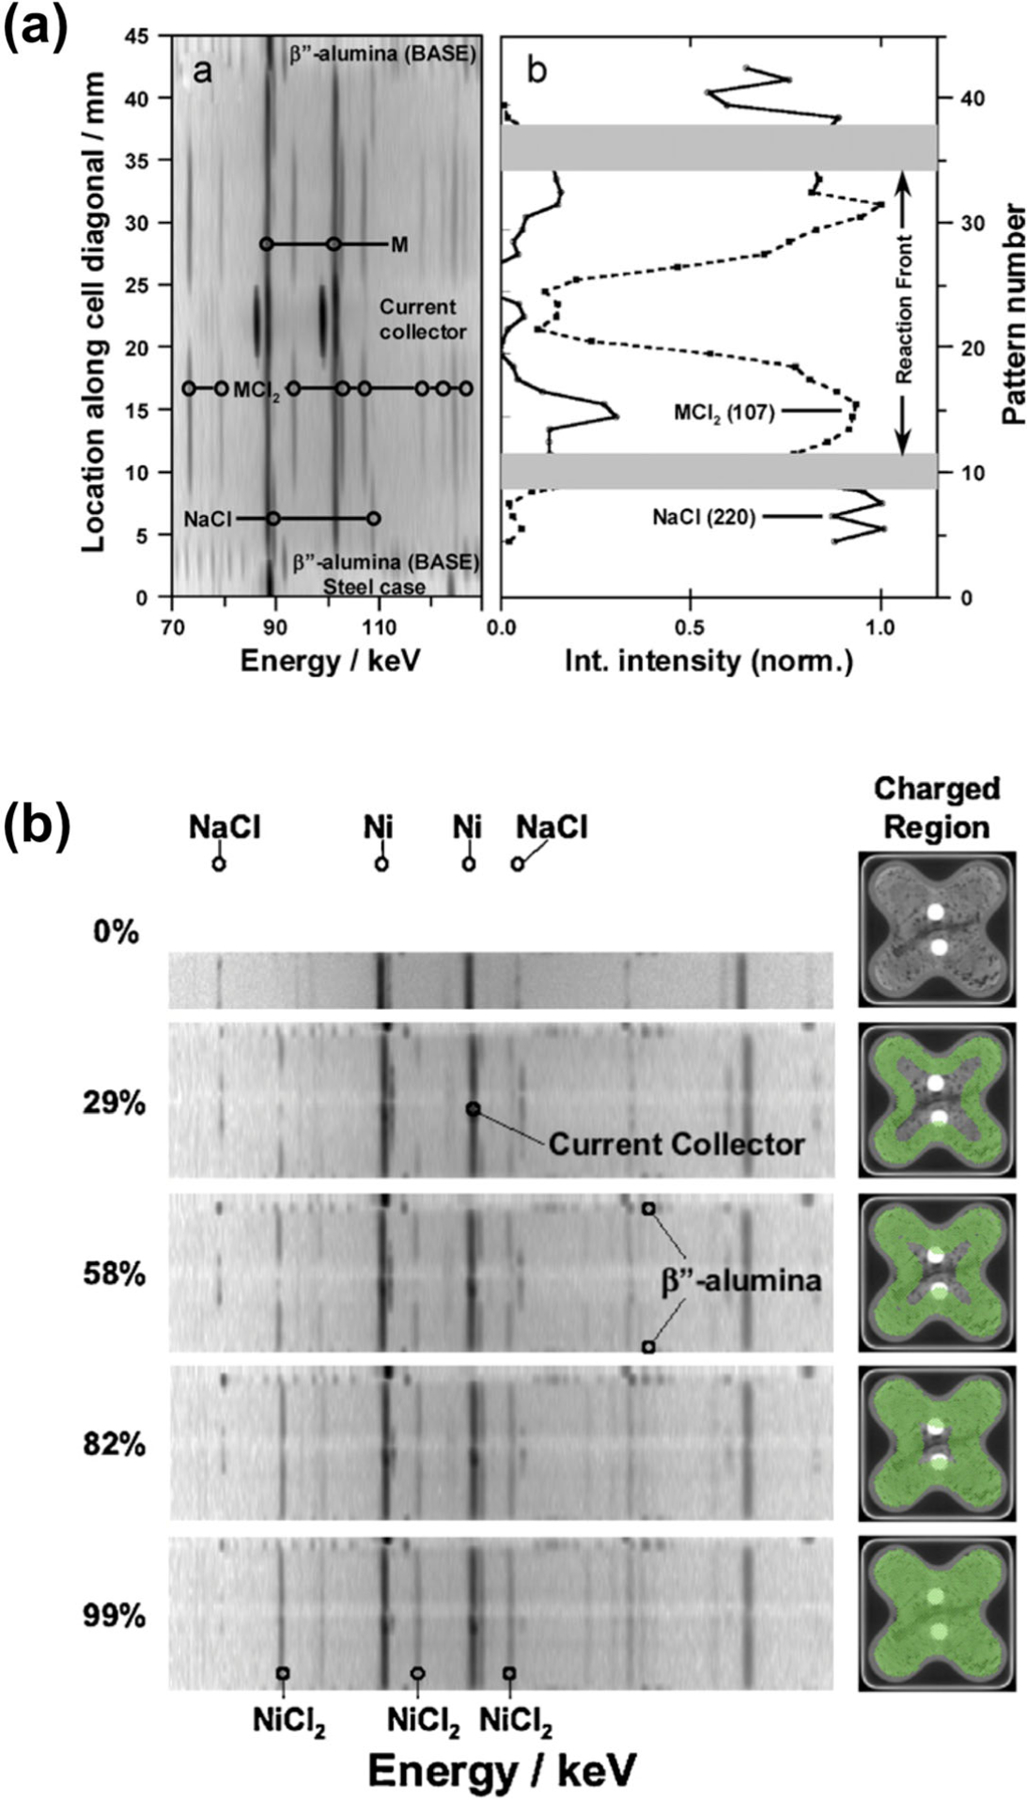
Measurements of the cathode reaction front in a sodium metal halide battery by EDXRD. (a) Left: diffraction contour along the diagonal of a half-discharged cell. Right: phase map showing the locations of NaCl and MCl2. Gray areas show the reaction front. (b) Sequence of diffraction contours across the center diagonal of a cell at varying states of charge from 0% to 99%. (Reproduced with permission from Ref. 9. Copyright Elsevier, 2011.)
3.4.2. Detection of transient Suzuki phases in sodium metal halide batteries at high current
Testing of sodium metal halide as detailed in section 3.4.1 also involved experiments where a static gauge volume was positioned just inside the BASE separator within the bulk of the cathode.9 The cell was charged at 10 A, approximately a C/3 rate, while EDXRD patterns were collected, each lasting 70 s. This allowed the sequence of events to be observed as the reaction front passed through the gauge volume, providing operando knowledge of the electrochemical mechanism from within the cathode bulk at realistic operating current.
The time-resolved diffraction contour obtained is shown in Figure 17, in which 99 EDXRD patterns covered the crystalline evolution at this location as the reaction front passed. The Bragg lines reveal that in addition to the principle M, MCl2, and NaCl phases involved in reactions [13]–[14], a transient Na6MCl8 phase formed with its strongest reflections just to the high energy side of the NaCl phase lines. Suzuki phases of composition Na6MCl8 had previously been known in some systems including NaCl-FeCl2, but their dynamics in the reaction front were unknown.76–78 The data in Fig 17 revealed four mechanistic stages during charging, each of which was experienced in turn as the reaction front swept through a region of the cathode. First was conversion of NaCl to Na6MCl8, and second was formation of MCl2 coupled with consumption of Na6MCl8. As they formed, the MCl2 peaks underwent a subtle shift to higher energy indicating increasing Ni content in the MCl2 phase, due to the smaller ionic radius of Ni2+ compared to Fe2+. Correlation with a downturn in Na6MCl8 intensity indicated MCl2 was generated at the expense of the Suzuki phase and not NaCl in this stage. The third stage was formation of MCl2 at the expense of NaCl. In the final charging stage, MCl2 formation continued and leveled off even while no NaCl or Na6MCl8 reflections remained. This indicated that dissolved NaCl from other parts of the cell were transported to the reaction site, continuing to supply the reaction.
Figure 17.
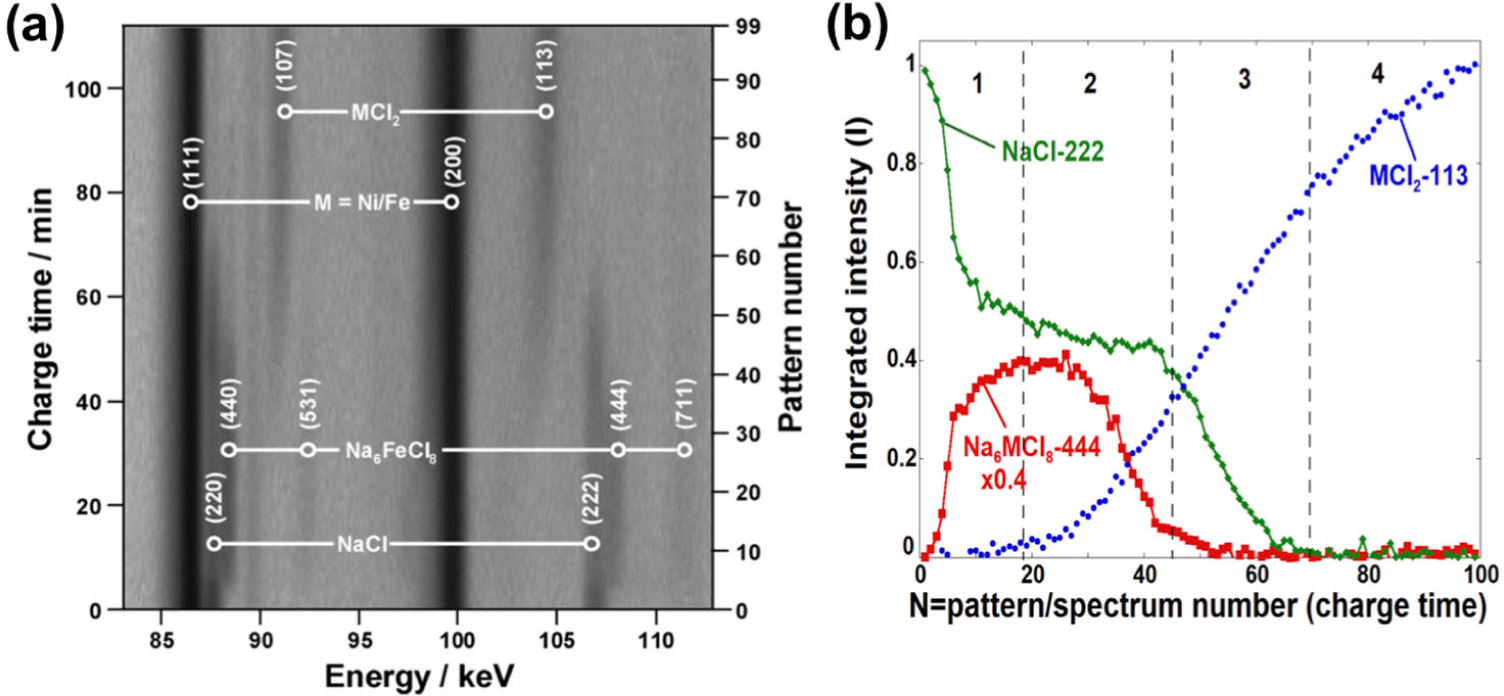
(a) Time-resolved diffraction contour with the beam positioned at a fixed location inside a sodium metal halide cell during a 10 A charge. Note the transformation, bottom to top, of the NaCl, first to the short-lived intermediate Na6FeCl8, and then to MCl2. (b) Time/charge variation of integrated spectral intensities versus pattern number (charge time) for Bragg reflections chosen as proxies for the relative phase abundances of NaCl, MCl2, and Na6MCl8. The integrated areas have been normalized to the maximum value for a given phase; the Na6MCl8 curves are reduced in magnitude as indicated for clarity. The charge process has been divided into four segments for the purposes of discussion in the text and are numbered accordingly in the figure. (Reproduced with permission from Ref. 9. Copyright Elsevier, 2011.)
4. Outlook
4.1. Future Perspectives
Utilization of alternative investigative techniques alongside EDXRD may further aid the pursuit to understand the subtle processes of electrode materials. Diffraction anomalous fine structure (DAFS) offers the opportunity to assess local atomic structure information similar to x-ray absorption fine structure (XAFS). Using DAFS, short-range local atomic order information is obtained through energy-dependent x-ray diffraction intensity measurements with fixed momentum transfer by leveraging the causality relationship between real and imaginary components of the anomalous scattering amplitude, which remains nearly independent of the momentum transfer.79 By combining aspects of diffraction and XAFS, DAFS is afforded advantages unique unto itself that lend to the study of polyatomic and/or spatially structured systems, e.g. mixed phase powders, surface and buried monolayers or reconstructed layers, and strained or compositionally modulated single layers or multilayers. Firstly, DAFS can elucidate short-range order information about long-range ordered atom specified by the diffraction conditions. DAFS also offers valence and chemical specificity alongside sensitivity to neighbor atom positions. DAFS provides spatial selectivity in instances wherein different spatial regions or disparate components of a sample generate diffraction peaks at distinct, diverse locations within reciprocal space, and from these characteristic diffraction peaks the local atomic structure of each region or component may be determined. Finally, by measuring Bragg Peak intensities arising from site inequivalent, yet chemically identical, atoms with different diffraction structure factor contributions, relative DAFS contributions and associated local atomic structure of site inequivalent atoms may be isolated through combination of the DAFS signals for different Bragg peaks.
Kawaguchi and coworkers80 employed a powder DAFS technique with a mathematical approach81 to analysis and X-ray optics to address cation mixing within Li1−xNi1+xO2 (0 < x < 1, LNO), a layered rock-salt-type transition-metal oxide and typical lithium ion battery electrode material. Cation mixing describes a phenomenon frequently observed in cathode materials wherein interchange occurs between transition metals and Li atoms.
Fourier transforms of EXAFS oscillations acquired from the DAFS measurements allowed for a comparison between host-layer (NiNi) and interlayer (NiLi) atoms. EXAFS associated with NiNi evinced a shorter interaction (at ~1.4 Å), attributed to NiNi-O, and a longer interaction (at ~2.4 Å), which is dominated by the NiNi—NiNi bond due to negligible contributions from Li and NiLi due to the low scattering power of Li and low occupancy of Li and NiLi. These bonds were observed to reversibly shrink and expand dependent upon SOC as a result of ionic radius changes upon oxidation and reduction of NiNi. NiLi evinced much longer bond lengths, NiLi—O (2.05(4) Å) and NiLi—Ni (3.01(3) Å). After the initial charge, the NiLi-Ni peak increased significantly and became comparable to that of NiO, which suggested the formation of NiO-like domains about NiLi stemming from Ni atom occupation at the Li sites. The aggregation of interlayer Ni atoms to form these domain results from the isomorphic relationship between LNO and NiO and produce the irreversible electrochemical reaction in the initial cycle with resultant capacity loss.
Confocal or spectroscopic x-ray diffraction modifies EDXRD by variance of the incident beam energy, rather the detector angle, to gain better resolution at the expense of increased measurement time.82 This method, similar to EDXRD, produces Bragg reflections from a confocal point defined by collimating slits and permits tomographic profile analyses of internal features of bulky, dense materials such as battery cells encased in steel under working conditions. In lieu of white X-rays, as employed in EDXRD, continuous irradiation with monochromatic X-rays in an energy region were available in the setup to permit the diffraction peaks to emerge in the spectrum as a function of the X-ray energy. Supplanting the white X-rays leads to an improvement in the signal-to-background ratio and reduction in irradiation exposure to the cell during analysis.
Murayama and co-workers82 utilized this technique to study a cell containing a LixNi1/3Co1/3Mn1/3O2 (NCM) type electrode. Prior to the measurement the NCM had been charged from a fully discharged state at a constant current of 27.8 mA/g for 5h to fix the value of x to 0.5. During the in-situ energy scanning XRD measurement, the cell was discharged to 2.0 V at a constant current of 139 mA/g, and measurements were taken every 2 min at three positions at distances of 20, 70, and 120 μm from the surface of the composite electrode arranged by vertical movement of the stage. Prior to electrochemical discharge, the spectroscopic XRD produced 113 peaks from the three positions with same interplanar spacing, d = 1.354 Å. Increasing the value of x via discharge caused a gradual shift to larger d values until the terminus of the discharge. In comparison, EDXRD analyses of a similar material reported the detection limit with respect to neighboring peaks83 owing to the detector performance. Improved peak separation allowed for precision in determining lattice constants and tracking changes in Li+ concentration. Li+ insertion rates were estimated at each position as 0.83, 0.71. and 0.33 h−1 for the counter electrode side, the center of the electrode, and the current collector side, respectively. Li+ insertion occurred more rapidly at the surface of the composite electrode, in comparison to the rate of discharge for the overall cell, and Li+ depletion at the surface functioned as resistance ensuant to an increase the overall cell potential and resultant capacity loss. Depending upon the location, the impetus of the Li+ transport varied greatly. After discharging without an external bias, the Li+ concentration homogenized within less than an hour. The Li+ gradient produced in the composite electrode as a result of a delay in Li+ supply on the current collector supply at a discharging rate of 0.5C reportedly depends upon penetration of the electrolyte into the composite electrode, which has a porosity of 30%. Subsequent studies by Kitada and co-workers84–85 on a denser NCM electrode (with 18% porosity) showed an enhancement in the retardation of the Li+ supply to the current collector side of the electrode due poor penetration to the electrode interior. In a comparison of the usage of the disparate liquid electrolyte concentrations, e.g. 2 M, 1 M, and 0.3 M, the most and least concentrated electrolyte investigated promoted lithiation and delithiation reactions over the entire area of the electrode, whereas the middling concentration showed higher conductivity, which highlights the importance in the initial Li+ concentration impregnated in the electrode pores. Furthermore, it was demonstrated that, while the lithiation reaction occurs inhomogeneously, the delithiation reaction proceeds homogenously. Each of these methods, i.e. DAFS and Confocal or spectroscopic x-ray diffraction, may offer an aid to future analyses of battery materials. Similarly, synchrotron X-ray phase contrast tomography offers the opportunity to image the morphological evolution of Li electrodes to allow the study of developing microstructures and degradation mechanisms.86–87
4.2. Summary
This discussion endeavored to illustrate the efficacy of EDXRD as a non-destructive characterization tool in elucidating system-level phenomena in battery electrode active materials that may influence measured performance, e.g. potentially inhomogeneous reaction distributions across the electrodes, pore plugging, physical isolation of active materials. EDXRD allows the investigation of batteries within their native housings, including bulk engineering materials, without requiring modification in cell construction, which can alter the resultant electrochemistry, or disassembly of the cell, which may oxidize or modify the material of interest. Ongoing construction of the HEX beamline at NSLS-II by Brookhaven National Lab and the state of New York offers the potential to further expand capability for and access to this technique.
Figure 18.
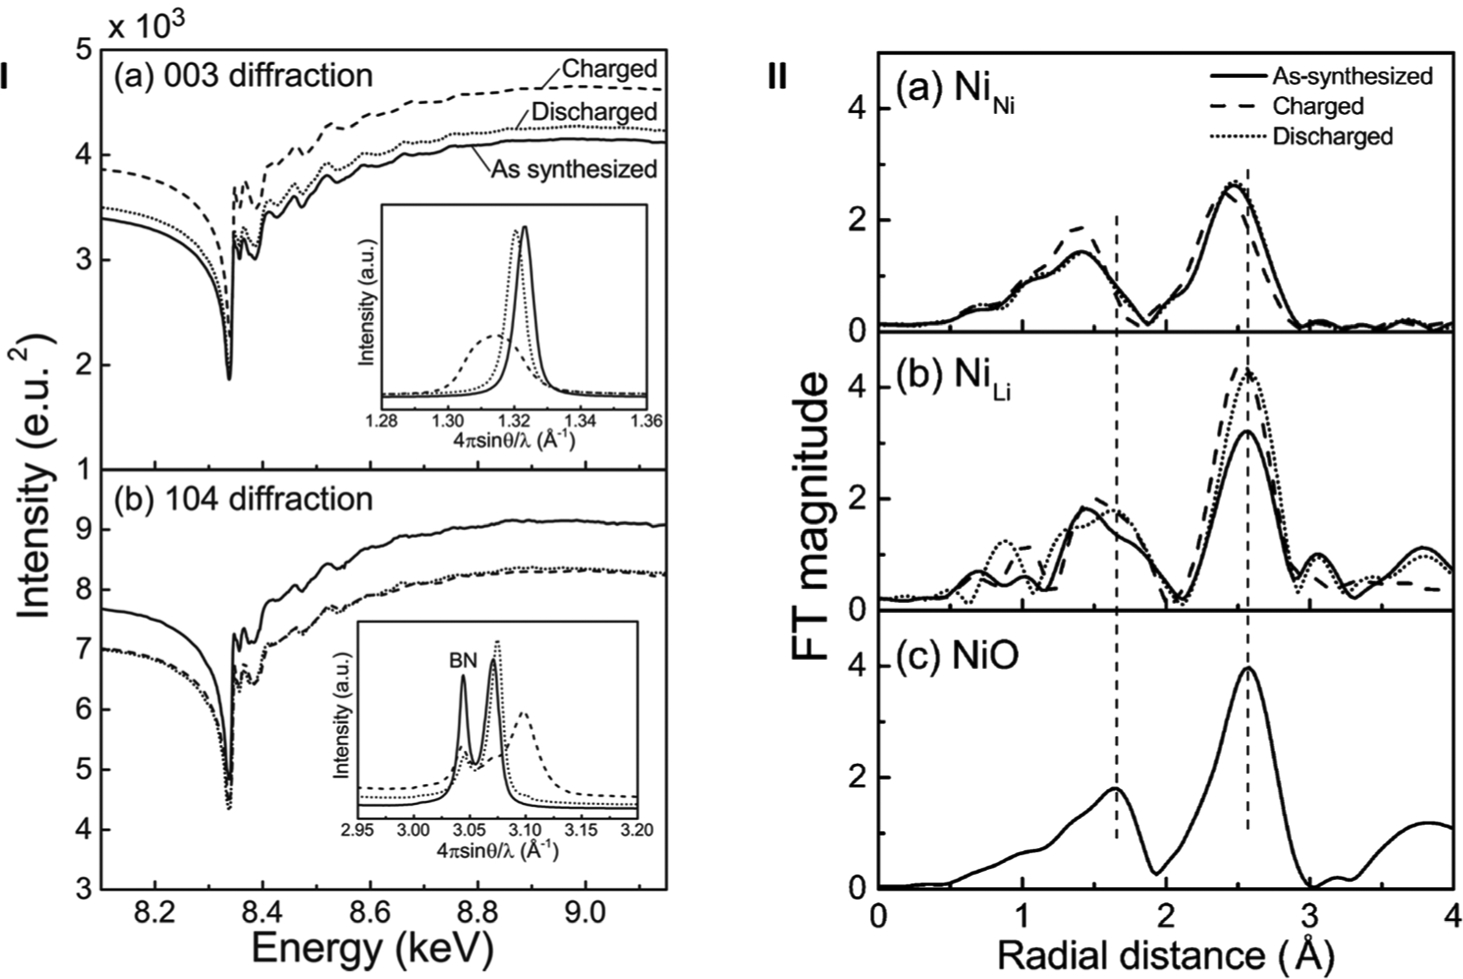
I. DAFS spectra of the (a) 003 diffraction and the (b) 104 diffraction. Solid, broken and dotted lines correspond to the as-synthesized, charged and discharged states, respectively. Insets show the peak profiles of each diffraction obtained at 8.007 keV. II. FT magnitude obtained from the EXAFS regions of Ni in LNO (a) at the host-layer Ni site (NiNi) and (b) at the interlayer site (NiLi), both of which were obtained from DAFS; (c) FT magnitude of NiO obtained from the XAFS measurement for comparison. Solid, broken and dotted lines correspond to the as-synthesized, charged and discharged states, respectively. (Reproduced from Ref. 80 with permission from the PCCP Owner societies).
Figure 19.
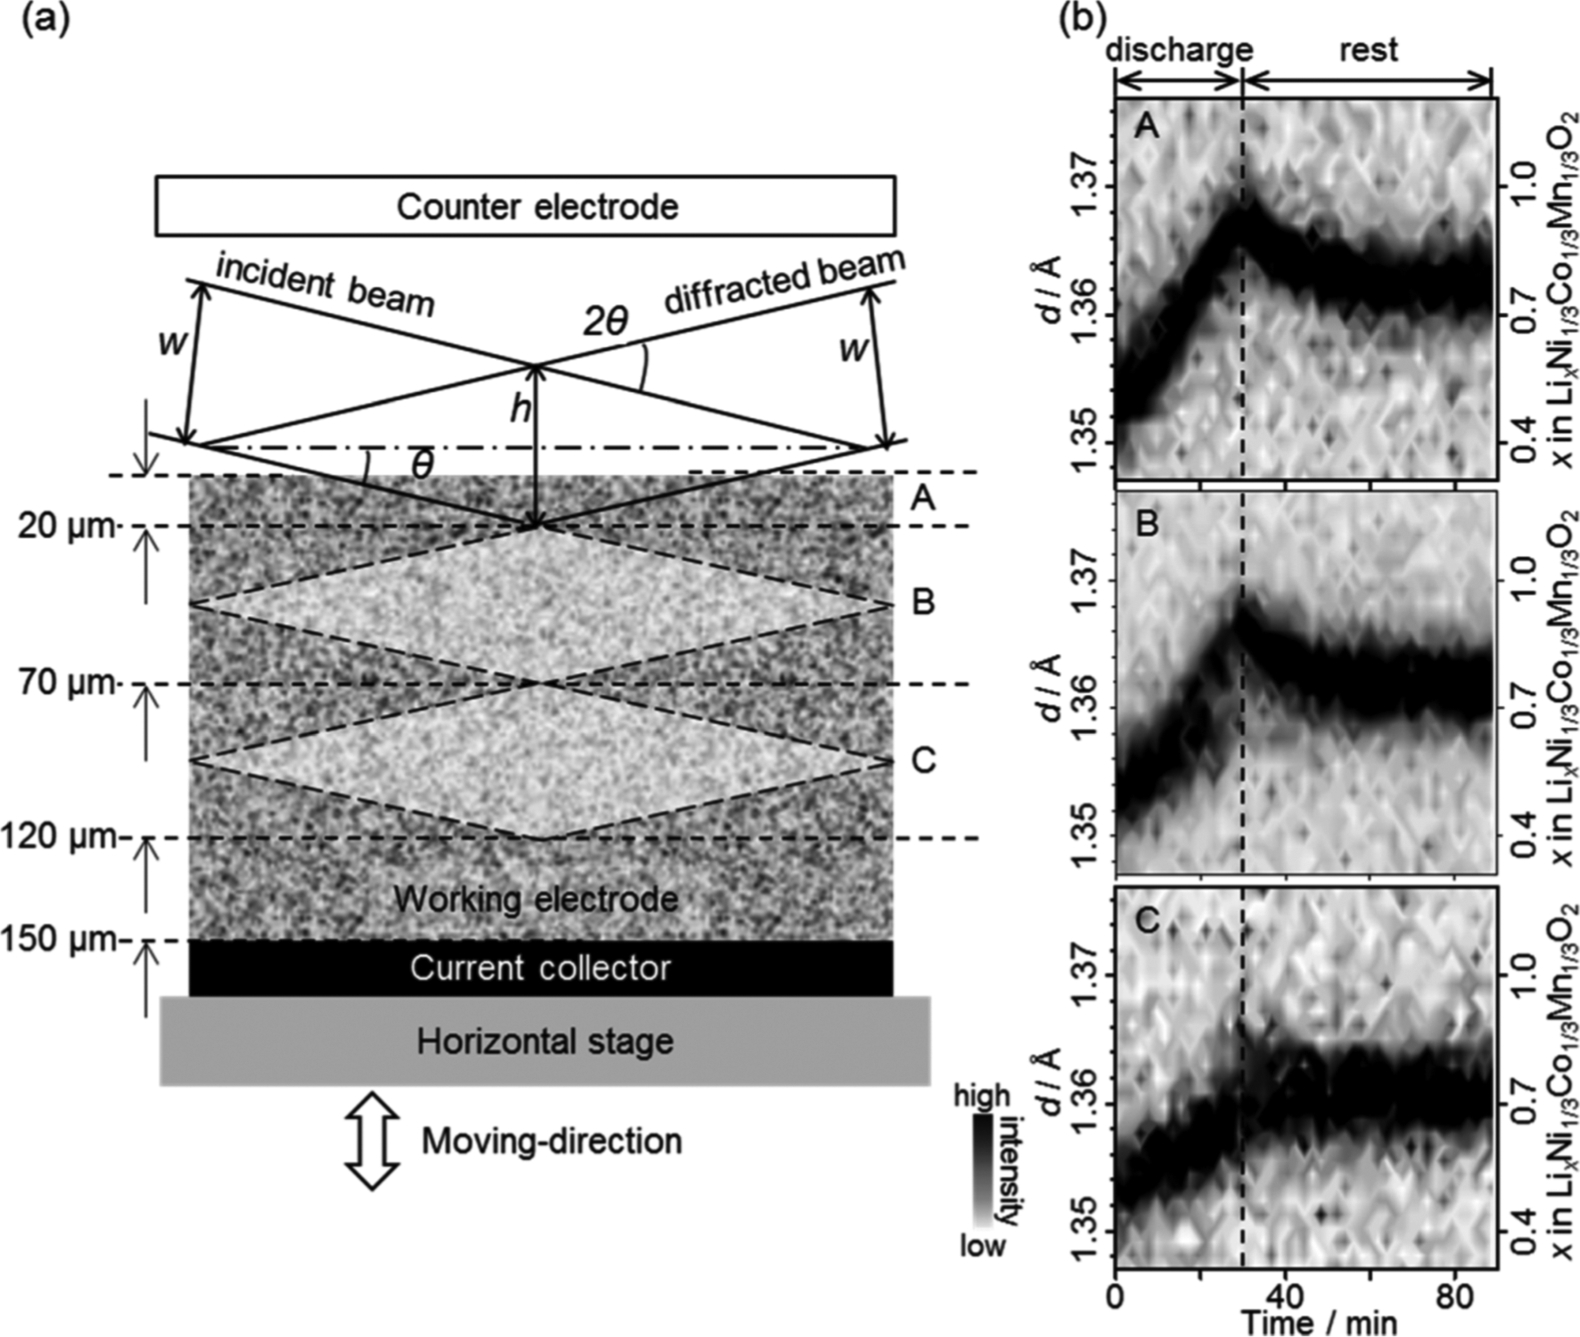
In situ XRD observation for a LixNi1/3Co1/3Mn1/3O2 electrode. (a) Schematic view of the lozenge-shape probe gauge in the cross section of the electrode and (b) time evolution of the intensity and position of the 113 peak of LixNi1/3Co1/3Mn1/3O2during the discharge reaction and rest processes. The incident beam and detector angles were set at θ and 2θ, respectively. The vertical slits widths are w, and the spatial resolution, which is given as the shorter diagonal of the lozenge-shaped gauge in the case of the low angle measurement, is h. The observed positions are referred to as the counter electrode side (A), the center of the composite electrode (B), and the current collector side (C), respectively. (Reproduced with permission from Ref. 82. Copyright American Chemical Society, 2014.)
Acknowledgements
JWG gratefully acknowledges support from the U.S. Department of Energy (DOE) Office of Electricity Delivery and Energy Reliability, Dr. Imre Gyuk, Energy Storage Program Manager. EST, ACM and KJT acknowledge the support of the Center for Mesoscale Transport Properties, an Energy Frontier Research Center supported by the Department of Energy - Basic Energy Sciences, under award #DE-SC0012673. AMB acknowledges the support of the National Science Foundation Graduate Research Fellowship under grant No. 1109408. Any opinions, findings, and conclusions or recommendations expressed in this material are those of the authors and do not necessarily reflect the views of the National Science Foundation. AA acknowledges support from the Graduate Assistance in Areas of National Need (GAANN) fellowship. EST acknowledges support as the William and Jane Knapp Chair in Energy and the Environment. CAS acknowledges support from the NIH Institutional Research and Academic Career Development Award and New York Consortium for the Advancement of Postdoctoral Scholars (IRACDA-NYCAPS), award K12-GM102778.
Footnotes
Conflicts of Interest
There are no conflicts of interest to declare.
References
- 1.Croft M, Jisrawi N, Zhong Z, Horvath K, Holtz RL, Shepard M, Lahshmipathy M, Sadananda K, Skaritka J, Shukla V, Sadangi RK and Tsakalakos T, J Eng Mater-T Asme, 2008, 130. [Google Scholar]
- 2.Croft M, Shukla V, Akdogan EK, Jisrawi N, Zhong Z, Sadangi R, Ignatov A, Balarinni L, Horvath K and Tsakalakos T, J Appl Phys, 2009, 105. [Google Scholar]
- 3.Croft M, Shukla V, Jisrawi NM, Zhong Z, Sadangi RK, Holtz RL, Pao PS, Horvath K, Sadananda K, Ignatov A, Skaritka J and Tsakalakos T, Int J Fatigue, 2009, 31, 1669–1677. [Google Scholar]
- 4.Pandey KK, Poswal HK, Mishra AK, Dwivedi A, Vasanthi R, Garg N and Sharma SM, Pramana, 2013, 80, 607–619 [Google Scholar]
- 5.Croft M, Jisrawi N, Ignatov A, Holtz RL and Zhong Z, The Journal of Strain Analysis for Engineering Design, 2012, 47, 83–94. [Google Scholar]
- 6.Croft M, Zakharchenko I, Zhong Z, Gurlak Y, Hastings J, Hu J, Holtz R, DaSilva M and Tsakalakos T, J Appl Phys, 2002, 92, 578–586. [Google Scholar]
- 7.Croft M, Zhong Z, Jisrawi N, Zakharchenko I, Holtz RL, Skaritka J, Fast T, Sadananda K, Lakshmipathy M and Tsakalakos T, Int J Fatigue, 2005, 27, 1408–1419. [Google Scholar]
- 8.Croft MC, Jisrawi NM, Zhong Z, Holtz RL, Sadananda K, Skaritka JR and Tsakalakos T, Int J Fatigue, 2007, 29, 1726–1736. [Google Scholar]
- 9.Rijssenbeek J, Gao Y, Zhong Z, Croft M, Jisrawi N, Ignatov A and Tsakalakos T, J Power Sources, 2011, 196, 2332–2339. [Google Scholar]
- 10.Rijssenbeek J, Gao Y, Zhong Z, Jisrawi N, Ignatov I and Croft M, Microsc Microanal, 2009, 15, 1394–1395. [Google Scholar]
- 11.Gallaway JW, Erdonmez CK, Zhong Z, Croft M, Sviridov LA, Sholklapper TZ, Turney DE, Banerjee S and Steingart DA, Journal of Materials Chemistry A, 2014, 2, 2757–2764. [Google Scholar]
- 12.Aurbach D, Markovsky B, Rodkin A, Cojocaru M, Levi E and Kim HJ, Electrochim Acta, 2002, 47, 1899–1911. [Google Scholar]
- 13.Horn QC and Shao-Horn Y, J Electrochem Soc, 2003, 150, A652–A658. [Google Scholar]
- 14.Thomlinson W, Chapman D, Gmur, Lazarz N, Nucl. Instrum. Methods Phys. Res, 1988, A266, 226–233. [Google Scholar]
- 15.High Energy Engineering X-ray Scattering (HEX) Facility: Preliminary Deisgn Report for the NSLS-II Project, Brookhaven National Laboratory, 2018. [Google Scholar]
- 16.Dudney NJ, Li J, Science, 347, 131–132. [DOI] [PubMed] [Google Scholar]
- 17.Tracey AS, Willsky GR and Takeuchi ES, Vanadium: chemistry, biochemistry, pharmacology and practical applications, CRC press, 2007. [Google Scholar]
- 18.Braithwaite J, Catlow C, Gale J and Harding J, Chemistry of materials, 1999, 11, 1990–1998. [Google Scholar]
- 19.Dai J, Li SF, Gao Z and Siow KS, Chemistry of materials, 1999, 11, 3086–3090. [Google Scholar]
- 20.Dobley A, Ngala K, Yang S, Zavalij PY and Whittingham MS, Chemistry of materials, 2001, 13, 4382–4386. [Google Scholar]
- 21.Wang Z-K, Shu J, Zhu Q-C, Cao B-Y, Chen H, Wu X-Y, Bartlett BM, Wang K-X and Chen J-S, J Power Sources, 2016, 307, 426–434. [Google Scholar]
- 22.Pistoia G, Pasquali M, Tocci M, Moshtev R and Maner V, J Electrochem Soc, 1985, 132, 281–284. [Google Scholar]
- 23.Yin J, Li W, Dunkin M, Takeuchi ES, Takeuchi KJ and Marschilok AC, MRS Advances, 2018, 3, 1255–1260. [Google Scholar]
- 24.Zhang Q, Bruck AM, Bock DC, Li J, Stach EA, Takeuchi ES, Takeuchi KJ and Marschilok AC, MRS Advances, 2017, 2, 401–406. [Google Scholar]
- 25.Zhang Q, Bruck AM, Bock DC, Li J, Sarbada V, Hull R, Stach EA, Takeuchi KJ, Takeuchi ES and Marschilok AC, Physical Chemistry Chemical Physics, 2017, 19, 14160–14169. [DOI] [PubMed] [Google Scholar]
- 26.Jouanneau S, Verbaere A and Guyomard D, Journal of Solid State Chemistry, 2005, 178, 22–27. [Google Scholar]
- 27.Zhang Q, Brady AB, Pelliccione CJ, Bock DC, Bruck AM, Li J, Sarbada V, Hull R, Stach EA and Takeuchi KJ, Chemistry of Materials, 2017, 29, 2364–2373. [Google Scholar]
- 28.Brady NW, Zhang Q, Bruck A, Bock DC, Gould CA, Marschilok AC, Takeuchi K, Takeuchi E and West AC, J Electrochem Soc, 2018, 165, A371–A379. [Google Scholar]
- 29.Strobridge FC, Orvananos B, Croft M, Yu HC, Robert R, Liu H, Zhong Z, Connolley T, Drakopoulos M, Thornton K and Grey CP, Chemistry of Materials, 2015, 27, 2374–2386. [Google Scholar]
- 30.Paxton WA, Zhong Z and Tsakalakos T, J Power Sources, 2015, 275, 429–434. [Google Scholar]
- 31.Paxton WA, Akdoğan EK, Şavkliyildiz I, Choksi AU, Silver SX, Tsakalakos T and Zhong Z, Journal of Materials Research, 2015, 30, 417–423. [Google Scholar]
- 32.Thomas-Alyea KE, ECS Transactions, 2008, 16, 155–165. [Google Scholar]
- 33.Liang G, Croft MC and Zhong Z, J Electrochem Soc, 2013, 160, A1299–A1303. [Google Scholar]
- 34.Liu J and Manthiram A, Chemistry of Materials, 2009, 21, 1695–1707. [Google Scholar]
- 35.Mukerjee S, Yang XQ, Sun X, Lee SJ, McBreen J and Ein-Eli Y, Electrochim Acta, 2004, 49, 3373–3382. [Google Scholar]
- 36.Arunkumar T and Manthiram A, Electrochemical and Solid-State Letters, 2005, 8, A403–A405. [Google Scholar]
- 37.Annamalai T and Kumar A, Chemical, structural, and electrochemical characterization of 5 V spinel and complex layered oxide cathodes of lithium ion batteries, 2007. http://hdl.handle.net/2152/3228
- 38.Marschilok AC, Takeuchi KJ and Takeuchi ES, Electrochemical and Solid-State Letters, 2009, 12, A5–A9. [Google Scholar]
- 39.Kirshenbaum KC, Bock DC, Zhong Z, Marschilok AC, Takeuchi KJ and Takeuchi ES, Physical Chemistry Chemical Physics, 2014, 16, 9138–9147. [DOI] [PubMed] [Google Scholar]
- 40.Takeuchi ES, Marschilok AC, Takeuchi KJ, Ignatov A, Zhong Z and Croft M, Energ Environ Sci, 2013, 6, 1465–1470. [Google Scholar]
- 41.Huie MM, Bock DC, Zhong Z, Bruck AM, Yin J, Takeuchi ES, Takeuchi KJ and Marschilok AC, J Electrochem Soc, 2017, 164, A6007–A6016. [Google Scholar]
- 42.Durham JL, Poyraz AS, Takeuchi ES, Marschilok AC and Takeuchi KJ, Acc Chem Res, 2016, 49, 1864–1872. [DOI] [PubMed] [Google Scholar]
- 43.Marschilok AC, Kim YJ, Takeuchi KJ and Takeuchi ES, J Electrochem Soc, 2012, 159, A1690–A1695. [Google Scholar]
- 44.Takeuchi ES, Marschilok AC, Tanzil K, Kozarsky ES, Zhu S and Takeuchi KJ, Chem Mater, 2009, 21, 4934–4939. [DOI] [PMC free article] [PubMed] [Google Scholar]
- 45.Kirshenbaum KC, Bock DC, Brady AB, Marschilok AC, Takeuchi KJ and Takeuchi ES, Physical Chemistry Chemical Physics, 2015, 17, 11204–11210. [DOI] [PubMed] [Google Scholar]
- 46.Bock DC, Bruck AM, Pelliccione CJ, Zhang Y, Takeuchi KJ, Marschilok AC and Takeuchi ES, Rsc Advances, 2016, 6, 106887–106898. [Google Scholar]
- 47.Li YR, Bruck AM, Brady AB, Bock D, Takeuchi KJ, Takeuchi ES and Marschilok AC, J Electrochem Soc, 2017, 164, A2457–A2467. [Google Scholar]
- 48.Kirshenbaum K, Bock DC, Lee CY, Zhong Z, Takeuchi KJ, Marschilok AC and Takeuchi ES, Science, 2015, 347, 149–154. [DOI] [PubMed] [Google Scholar]
- 49.Fleet ME, J. Solid State Chem, 1986, 62, 75–82. [Google Scholar]
- 50.Zhang W, Bock DC, Pelliccione CJ, Li Y, Wu L, Zhu Y, Marschilok AC, Takeuchi ES, Takeuchi KJ, Wang F, 2016, 1502471.
- 51.Bruck AM, Brady NW, Lininger CN, Bock DC, Brady AB, Tallman KR, Quilty CD, Takeuchi KJ, Takeuchi ES, West AC and Marschilok AC, ACS Applied Energy Materials, 2019, 2, 2561–2569. [Google Scholar]
- 52.Bruck AM, Wang L, Brady AB, Lutz DM, Hoff BL, Li K, Stavinski N, Bock DC, Takeuchi KJ, Takeuchi ES and Marschilok AC, The Journal of Physical Chemistry C, 2019, 123, 18834–18843. [Google Scholar]
- 53.Mondoloni C, Laborde M, Rioux J, Andoni E and Levyclement C, J Electrochem Soc, 1992, 139, 954–959. [Google Scholar]
- 54.Ingale ND, Gallaway JW, Nyce M, Couzis A and Banerjee S, J Power Sources, 2015, 276, 7–18. [Google Scholar]
- 55.Paxton WA, Rutgers University-Graduate School-New Brunswick, 2015.
- 56.Bhadra S, Hertzberg BJ, Hsieh AG, Croft M, Gallaway JW, Van Tassell BJ, Chamoun M, Erdonmez C, Zhong Z, Sholklapper T and Steingart DA, Journal of Materials Chemistry A, 2015, 3, 9395–9400. [Google Scholar]
- 57.Gallaway JW, Menard M, Hertzberg B, Zhong Z, Croft M, Sviridov LA, Turney DE, Banerjee S, Steingart DA and Erdonmez CK, J Electrochem Soc, 2015, 162, A162–A168. [Google Scholar]
- 58.Gallaway JW, Hertzberg BJ, Zhong Z, Croft M, Turney DE, Yadav GG, Steingart DA, Erdonmez CK and Banerjee S, J Power Sources, 2016, 321, 135–142. [Google Scholar]
- 59.Podlaha EJ and Cheh HY, J Electrochem Soc, 1994, 141, 15–27. [Google Scholar]
- 60.Chen JS and Cheh HY, J Electrochem Soc, 1993, 140, 1205–1213. [Google Scholar]
- 61.Gallaway JW, Yadav GG, Turney DE, Nyce M, Huang J, Chen-Wiegart Y.-c. K., Williams G, Thieme J, Okasinski JS and Wei X, J Electrochem Soc, 2018, 165, A2935–A2947. [Google Scholar]
- 62.Dzieciuch MA, Gupta N and Wroblowa HS, J Electrochem Soc, 1988, 135, 2415–2418. [Google Scholar]
- 63.Wroblowa HS and Gupta N, J Electroanal Chem, 1987, 238, 93–102. [Google Scholar]
- 64.Yao YF, Gupta N and Wroblowa HS, J Electroanal Chem, 1987, 223, 107–117. [Google Scholar]
- 65.Yadav GG, Gallaway JW, Turney DE, Nyce M, Huang JC, Wei X and Banerjee S, Nature Communications, 2017, 8. [DOI] [PMC free article] [PubMed] [Google Scholar]
- 66.Yadav GG, Wei X, Huang J, Gallaway JW, Turney DE, Nyce M, Secor J and Banerjee S, Journal of Materials Chemistry A, 2017, 5, 15845–15854. [Google Scholar]
- 67.Dustmann CH, J Power Sources, 2004, 127, 85–92. [Google Scholar]
- 68.Lu XC, Xia GG, Lemmon JP and Yang ZG, J Power Sources, 2010, 195, 2431–2442. [Google Scholar]
- 69.Hosseinifar M and Petric A, J Power Sources, 2012, 206, 402–408. [Google Scholar]
- 70.O’Sullivan TM, Bingham CM and Clark RE, Int Power Elect Elec, 2006, DOI: Doi 10.1109/Speedam.2006.1649778, 243–+. [DOI] [Google Scholar]
- 71.Nicholson ND, Demott DS and Hutchings R, 1989.
- 72.Chang HJ, Lu XC, Bonnett JF, Canfield NL, Son S, Park YC, Jung K, Sprenkle VL and Li GS, J Power Sources, 2017, 348, 150–157. [Google Scholar]
- 73.Wu T, Zhang SP, Ao X, Wu XW, Yang JH and Wen ZY, J Power Sources, 2017, 360, 345–352. [Google Scholar]
- 74.Benato R, Cosciani N, Crugnola G, Sessa SD, Lodi G, Parmeggiani C and Todeschini M, J Power Sources, 2015, 293, 127–136. [Google Scholar]
- 75.Kim J, Jo SH, Bhavaraju S, Eccleston A and Kang SO, J Electroanal Chem, 2015, 759, 201–206. [Google Scholar]
- 76.Adendorff KT and Thackeray MM, J Electrochem Soc, 1988, 135, 2121–2123. [Google Scholar]
- 77.Loon C and Ijdo D, Acta Crystallographica Section B, 1975, 31, 770–773. [Google Scholar]
- 78.Chall M, Winkler B, Blaha P and Schwarz K, The Journal of Physical Chemistry B, 2000, 104, 1191–1197. [Google Scholar]
- 79.Stragier H, Cross JO, Rehr JJ, Sorensen LB, Bouldin CE and Woicik JC, Phys Rev Lett, 1992, 69, 3064–3067. [DOI] [PubMed] [Google Scholar]
- 80.Kawaguchi T, Fukuda K, Tokuda K, Sakaida M, Ichitsubo T, Oishi M, Mizuki J and Matsubara E, Phys Chem Chem Phys, 2015, 17, 14064–14070. [DOI] [PubMed] [Google Scholar]
- 81.Kawaguchi T, Fukuda K, Tokuda K, Shimada K, Ichitsubo T, Oishi M, Mizuki J and Matsubara E, J Synchrotron Radiat, 2014, 21, 1247–1251. [DOI] [PMC free article] [PubMed] [Google Scholar]
- 82.Murayama H, Kitada K, Fukuda K, Mitsui A, Ohara K, Arai H, Uchimoto Y, Ogumi Z and Matsubara E, The Journal of Physical Chemistry C, 2014, 118, 20750–20755. [Google Scholar]
- 83.Ronci F, Electrochemical and Solid-State Letters, 1999, 3, 174–177. [Google Scholar]
- 84.Kitada K, Murayama H, Fukuda K, Arai H, Uchimoto Y and Ogumi Z, The Journal of Physical Chemistry C, 2017, 121, 6018–6023. [Google Scholar]
- 85.Kitada K, Murayama H, Fukuda K, Arai H, Uchimoto Y, Ogumi Z and Matsubara E, Journal of Power Sources, 2016, 301, 11–17. [Google Scholar]
- 86.Sun F, Osenberg M, Dong K, Zhou D, Hilger A, Jafta CJ, Risse S, Lu Y, Markötter H and Manke I, ACS Energy Letters, 2018, 3, 356–365. [Google Scholar]
- 87.Sun F, Zielke L, Markotter H, Hilger A, Zhou D, Moroni R, Zengerle R, Thiele S, Banhart J and Manke I, ACS Nano, 2016, 10, 7990–7997. [DOI] [PubMed] [Google Scholar]


