Abstract
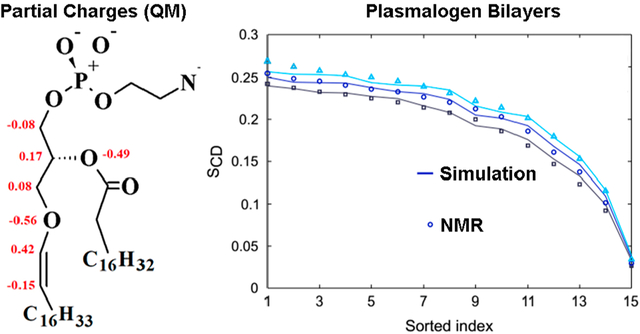
Ethanolamine plasmalogen (EtnPLA) is a conical-shaped ether lipid and an essential component of neurological membranes. Low stability against oxidation limits its study in experiments. The concentration of EtnPLA in the bilayer varies depending on cell type and disease progression. Here we report on mixed bilayers of 1-palmitoyl-2-oleoyl-sn-glycero-3-phosphocholine (POPC) and 1-(1Z-octadecenyl)-2-oleoyl-sn-glycero-3-phosphoethanolamine (C18(Plasm)-18:1PE, PLAPE), an EtnPLA lipid subtype, at mole ratios of 2:1, 1:1, and 1:2. We present X-ray diffuse scattering (XDS) form factors F(qz) from oriented stacks of bilayers, related electron-density profiles, and hydrocarbon chain NMR order parameters. To aid future research on EtnPLA lipids and associated proteins, we have also extended the CHARMM36 all-atom force field to include the PLAPE lipid. The ability of the new force-field parameters to reproduce both X-ray and NMR structural properties of the mixed bilayer is remarkable. Our results indicate a thickening of the bilayer upon incorporation of increasing amounts of PLAPE into mixed bilayers, a reduction of lateral area per molecule, and an increase in lipid tail-ordering. The lateral compressibility modulus (KA) calculated from simulations yielded values for PLAPE similar to POPC.
Graphical Abstract
1. INTRODUCTION
Ether lipids such as ethanolamine plasmalogens (EtnPLAs) are essential constituents of mammalian bilayers accounting for ~20% of all human phospholipids.1–5 Particularly high concentrations are found in brain, retina, and other neural tissues, such as gray matter and white matter, where it amounts to ~60 and 80% of the total ethanolamine phospholipids, respectively.6,7 Synaptic vesicles involved in neurotransmitter release also have highly heterogeneous bilayers enriched in EtnPLA.8 Plasmalogens have been hypothesized to protect the bilayer against oxidation and the action of free radical scavengers.5,9,10 Plasmalogens are present in lipid rafts11,12 and also affect cholesterol biosynthesis13 and transport14 which neuronal cells require for proper functioning. Furthermore, plasmalogens play an important role in signaling pathways related to neuronal survival. For example, the antiapoptotic protective plasmalogen function manifests itself as inhibiting the caspase-9 cell death pathway and preventing hippocampal neuronal death.15
Considering the pervasive presence of ether lipids in neurological membranes, it is not surprising to discover that aberrant plasmalogen content correlates with neurological diseases. Plasmalogens are believed to play a particularly important role in Zellweger syndrome (ZS),16 Alzheimer’s Disease (AD),3,17–22 glaucoma,6 and Parkinson’s Disease (PD).23–25 In AD pathogenesis, a monotonically decreasing concentration of gray and white matter plasmalogen with disease progression was reported,18,20,22 reaching 30–50% lower levels of ethanolamine plasmalogen in the frontal cortex and hippocampus.17 Lipids rafts of early PD also presented diminished plasmalogen levels.24 Lower levels of EtnPLAs are hypothesized to compromise bilayer integrity or to change the lipid bilayer elasticity and correlate with impaired synaptic transmission and neurotransmitter release.19,26–28 Modified bilayer properties due to depletion in plasmalogen content likely affect other key cellular endo- and exocytosis processes such as organelle trafficking that typically involve highly curved bilayers.14,21,29–31
Despite the ubiquitous presence of ethanolamine plasmalogens in neurological lipid membranes, a biophysical characterization of the bilayer rigidity, chain order, and local bilayer structure is for the most part lacking. A description for its preference to partition within curved mixed bilayers as to generate/release local curvatures is also missing. The few studies that are available have been summarized recently.32 EtnPLAs are believed to thicken the bilayer marginally,33 to reduce lateral area per lipid molecule,34 to increase lipid-tail ordering,35 and to adopt different conformational states for the lipid’s glycerol backbone-acyl chain interface as revealed by fluorescence spectroscopy,36 deuterium magnetic resonance (2H NMR),37,38 electron spin resonance (ESR),37 and molecular dynamics simulations.34 Plasmalogens have lower phase transition temperatures maintaining the fluid phase below that of non-plasmalogen lipids. Specifically, EtnPLAs have a slightly lower Tm temperature for the gel to fluid phase-transition and a distinctly lower Th temperature for the lamellar to the inverse-hexagonal phase transition, compared to nonether, closely related phosphatidylethanolamines that instead contain the sn-1 ester bond.35,39 Membranes that contain EtnPLAs also show a markedly increased propensity for bilayer fusion relative to phosphatidylethanolamine lipids.21 EtnPLAs commonly contain sn-2 chains that are polyunsaturated fatty acids (PUFAs),6,40,41 that in turn may regulate the SNARE fusion machinery used during neurotransmitter release and organelle trafficking,8,26,42 as well as endocytosis.43 It remains unknown if these effects are due to the local changes in the bilayer structure, due to an association of PUFAs to proteins of the type reported previously,44 or if plasmalogen-induced lateral stresses favor changes of protein conformation.
Molecular dynamics (MD) simulations that utilize a robust parameter set to describe the forces between atoms can provide insight into the molecular interaction of ether lipids with other bilayer-forming lipids and proteins. Recent advances in computational and experimental methods provide a means to calculate the bilayer mechanical properties in multi-component lipid bilayers.45 Accurate atomistic parameters of plasmalogen lipids can also function as the starting point to derive coarse-grained (CG) MARTINI46 or SDK force-field parameters47 that in turn will allow for more extensive simulations and prolonged time scales for plasmalogen-containing bilayers. Such future studies will provide an understanding of how the EtnPLAs behave in bilayers of complex composition, including partitioning into highly curved membrane regions.
Phosphatidylethanolamine plasmalogen (PLAPE) investigated here, a type of EtnPLA, corresponds to an ether phospholipid that has one of its fatty acyl side chains linked with a cis-vinyl-ether bond at the sn-1 glycerol backbone position and the ethanolamine polar headgroup at the sn-3 of the glycerol backbone. The preference of the PLAPE type lipid for the inverse hexagonal self-assembly39 makes it challenging to single out its contribution to the elastic properties of mixed bilayers.
In the present study, we report the X-ray diffuse scattering (XDS) derived bilayer structure and hydrocarbon chain NMR order-parameters of POPC/PLAPE mixed at 2:1, 1:1, and 1:2 ratios. Although the sn-2 alkyl chain of ethanolamine plasmalogens is often enriched in polyunsaturated fatty acids (PUFA) residues,48 we restrict the investigation to modeling the behavior of [C18(Plasm),18:1] terminated PLAPE lipids, as to report on the most abundant sn-2 lipid tail found in neuronal plasmalogen.40 The 18:1 type of acyl chain plasmalogen experiences the most dramatic depletion from the white matter of AD patients.17,20 In addition to presenting the experimental mixed bilayer structure, we also introduce a set of CHARMM36 atomistic force-field parameters derived from quantum mechanics and describe the simulation outcome when tested against our X-ray and NMR experimental data. The experimental measurements and the simulation outcomes are in good agreement.
Noting the overall lipid bilayer composition heterogeneity and the critical relevance of PLAPE to the function of neurological membranes, it is instructive to decipher the unique contributions of PLAPE to bilayer properties. This study finds that introducing PLAPE into a POPC membrane thickens the bilayer. The magnitude of the effect is slightly more pronounced compared to adding the non-ether POPE lipid. PLAPE increases order of lipid tails and reduces area per lipid with increasing concentration. Furthermore, simulation compressibility modulus (KA) indicates that the ability of PLAPE to elastically deform is roughly comparable to POPC.
2. MATERIALS AND METHODS
2.1. X-ray Diffuse Scattering (XDS).
The synthetic, lyophilized lipids 1-palmitoyl-2-oleoyl-sn-glycero-3-phosphocholine (POPC, Lot #16:0–18:1PC-205), 1-palmitoyl-2-oleoyl-sn-glycero-3-phosphoethanolamine (POPE, Lot #16:0–18:1–140), and 1-(1Z-octadecenyl)-2-oleoyl-sn-glycero-3-phosphoethanolamine (C18(Plasm)-18:1PE, PLAPE, Lot #C18-(Plasm)18:1PE-21) were purchased from Avanti Polar Lipids (Alabaster, AL) as a lyophilized powder and used as received. Thin layer chromatography (TLC) using a solvent system of chloroform/methanol/H2O (65:25:4, v:v:v) revealed 0% lysolecithin in POPC and POPE and ~0.1% lysolecithin in PLAPE before the X-ray experiment. HPLC grade organic solvents were purchased from Sigma-Aldrich (St. Louis, MO). Chloroform was stabilized with ethanol.
Lipid mixtures were prepared by first dissolving lyophilized lipids in organic solvent as stock solutions. POPC was dissolved in chloroform, POPE was dissolved in trifluoroethanol (TFE), and PLAPE was dissolved in 1:1 (v:v) chloroform:TFE. The pH of the organic solvents was checked before use and found to be close to neutral; a low pH can degrade lipids. Mixtures of POPC/POPE and POPC/PLAPE with mole ratios of 2:1, 1:1, and 1:2 were prepared by adding together appropriate amounts of the stock solutions in glass test tubes to a final weight of 4 mg. Organic solvents in the mixtures were quickly removed under vacuum. For plating these lipid mixtures out onto silicon wafers, 200 μL of fresh organic solvent was added to each test tube and vortexed. The solvent used for plating was chloroform:methanol:TFE (2:1:1 v:v:v). The glass test tubes were then placed into a gastight glovebox which had been flushed with ultrapure nitrogen gas for 15 min in an effort to reduce exposure to air and oxidation. The mixtures were plated onto silicon wafers (1 × 15 × 30 mm) under nitrogen via the rock-and-roll method,49 where the silicon wafer is rocked continuously during solvent evaporation to produce stacks of ~1800 well-aligned bilayers. Once immobile, the thin film was evacuated for ~1 h. The sample was then trimmed to a central 5.0 mm wide strip parallel to the long-edge of the wafer49 and placed into an evacuated desiccator for transport to the nearby X-ray lab. Each sample was placed into the hydration chamber,50 which was rapidly purged with helium. The remainder of the samples was stored under vacuum at 4.0 °C until further experimentation.
XDS data from oriented, fully hydrated samples were obtained using a laboratory X-ray source RUH3R rotating anode X-ray generator (Rigaku, Tokyo, Japan) with a FOX 2D focusing collimator (Xenocs, Sassenage, France) and a Mercury CCD detector (Rigaku); the X-ray wavelength was 1.5418 Å, and the sample-to-detector distance (S-distance) was 294 mm. Hydration occurred via water vapor in ~60–90 min under a low flow of helium gas. Full hydration was judged by no further increase in lamellar D-spacing of bilayers after equilibration, at which time from 2 to 4, 40 min scans were collected. Measurements were carried out in the fluid phase at 37.0 °C. The flat silicon wafer was rotated from −1.6 to 7 degrees during the data collection to equally sample all scattered X-rays. The background was collected by setting the X-ray angle of incidence to −4 degrees, where sample scattering does not contribute to the image. For data analysis, backgrounds from extraneous air and mylar scattering were removed, and images were symmetrized laterally to increase the signal-to-noise ratio. As the sample nears full hydration, membrane fluctuations occur which produce “lobes” of X-ray diffuse scattering data.51,52 The fluctuations are quantitated by measuring the falloff in lobe intensity in the lateral qr direction as described previously.51,52
In a second step of data analysis, a fit is carried out to obtain the form factor, |F(qz)|. The method is explained in detail in the Supporting Information of ref 53. We fit the obtained |F(qz)| via the Fourier transform to a model of an electron density profile that uses Gaussians and error functions to represent various membrane components, and we also compare these X-ray experimental form factors to those produced from molecular dynamics simulation. This comparison validates the simulation and provides atomistic detail not available from XDS data alone.
2.3. NMR.
To prevent oxidation of the plasmalogen vinyl ether bond, sample preparation was conducted in a glovebox filled with pure nitrogen gas generated from a liquid nitrogen tank. A quantity of 2–4 mg of lipids was mixed in chloroform stabilized with ethanol. The PLAPE in chloroform had the antioxidant butylated hydroxyl toluene (BHT) added at a BHT/PLAPE molar ratio of 1/100. The solvents were removed in a stream of nitrogen gas in a rapidly rotating glass tube to form a thin lipid layer on the wall of the tube. Complete removal of organic solvents as well as absence of oxidation were confirmed by 1H NMR on test samples. Deuterium depleted water was added in excess to the dried lipids to yield a final sample volume of 11 μL; the sample was pelleted by centrifugation and transferred to a glass container sealed with a ground glass stopper.
2H NMR experiments were conducted at 30 °C on a Bruker DMX500 spectrometer operating at a 2H resonance frequency of 76.7 MHz, equipped with a high-power probe with a 5 mm solenoid coil. Spectra were acquired using a phase-cycled quadrupolar echo pulse sequence d1-90°x-τ−90°y to acquire spectra of perdeuterated palmitoyl chains54 with a repetition time d1= 0.25 s, a 2.75 μs 90° pulse, a 50-μs delay between pulses, and a spectral width of 200 kHz. A total of 10,240 scans were recorded. 2H NMR powder spectra were dePaked,55 and order parameter profiles of the palmitoyl chain were calculated with an application written for Mathcad (PTC). The well resolved quadrupolar splittings of sn-1 chain methyl and methylene groups C16−C11 (POPC-d31) and C16−C13 (POPC-d31/PLAPE) were directly assigned from the dePaked spectra. 2H NMR order parameters are reported as smoothed orientational order profile of lipid bilayers as originally suggested by Lafleur et al.56 Order of chain segments is assumed to be decreasing from the carbonyl group to the terminal methyl group. The state of oxidation of the plasmalogen vinyl bond of PLAPE at 30 °C was monitored by following spectral changes of vinyl bond resonances on test samples using 1H MAS NMR. Oxidation was low (less than 3%) during the first hour of NMR experiments and increased steadily with time.
2.4. Quantum Mechanics.
The NWChem program57 was used for all ab initio calculations. The electrostatic potential (ESP) best-fit partial charges were found for two linear vinyl ether molecules using the optimized geometry of the all-trans state: 1-ethoxypropene and diethylene glycol divinyl ether (Figure 1). Charges were computed from the MP2 densities using the CHELPG method58 in which atomic charges are fit to reproduce the molecular ESP at several points around the molecule.
Figure 1.
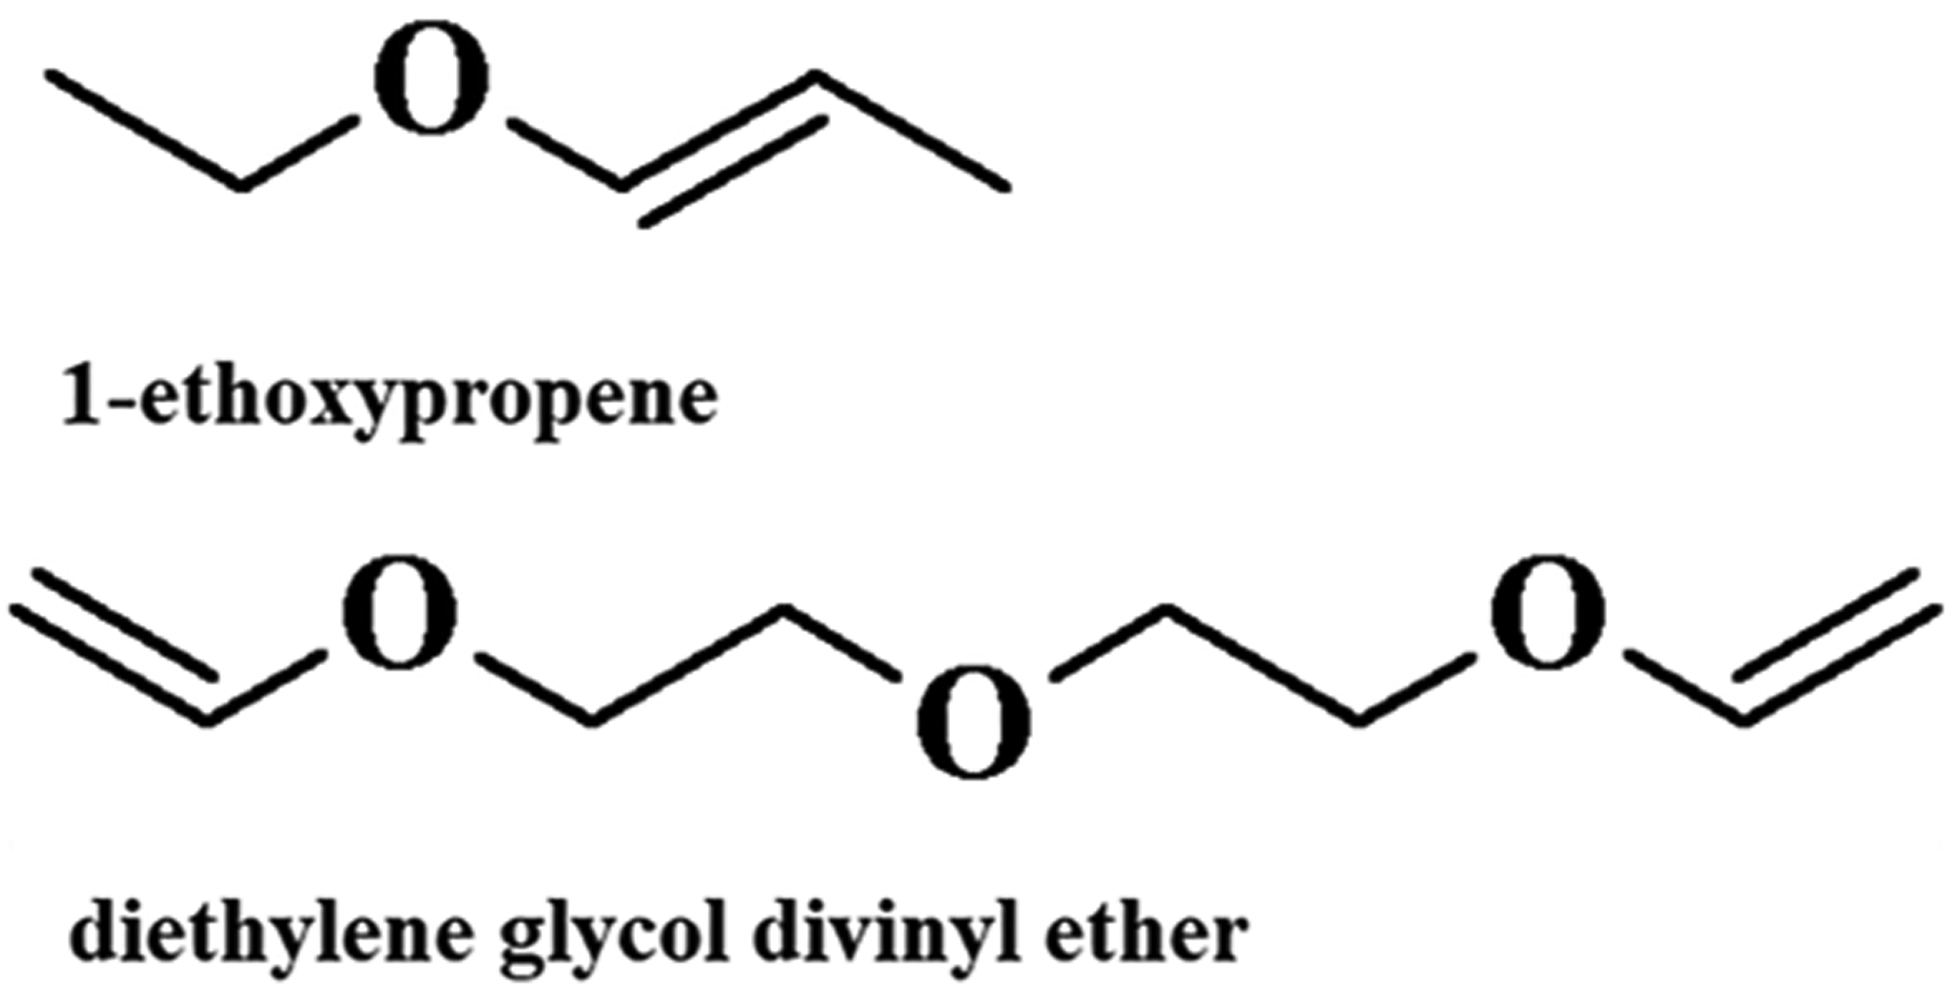
Structure of model vinyl ether molecules.
To develop dihedral parameters, potential energy scans were computed about the C–O–C=C and C–C–O–C(=C) dihedrals of 1-ethoxypropene from [−180:10:180] degrees with other geometries relaxed. Optimization and ESP fitting were completed at the MP2/cc-pVDZ level using the DRIVER module with a starting structure near the corresponding geometry. Conformational energies at the CCSD(T)/aug-cc-pVTZ level were estimated for the optimized configurations using Hybrid Methods for Interaction Energies (HM-IE) developed by Klauda et al.59 The HM-IE assume the effects of electron correlation and basis set size are additive. Energies at the CCSD(T) level of theory with a large basis set (LBS = aug-cc-pVTZ) are estimated by calculating CCSD(T) energies with a smaller basis set (SBS = aug-cc-pVDZ), and a correction is added for the difference between the MP2 energies with a LBS and a SBS as follows:
| (1) |
Because the MP2 energies are needed to compute the CCSD(T) energies, two sets of calculations were necessary to find Econf[MP2:CC].
2.5. Molecular Dynamics Simulations.
In order to test plasmalogen lipid parameters, MD simulations of bilayers containing POPE, PLAPE, and POPC were run. Different POPC/PLAPE and POPE/POPC ratios were tested (1:1, 1:2, 2:1). Triplicate replicas of each composition were built using the CHARMM GUI Membrane Builder60–63 with appropriate modification of 1-stearoyl-2-oleoyl-sn-glycero-3-phosphoethanolamine (SOPE) to produce PLAPE. All the systems are composed of 60 lipids per leaflet and 40 water molecules per lipid. The systems were equilibrated while slowly removing constraints (over a 650 ps time frame) using the Membrane Builder six-step process, and productions were run for 200 ns.
Simulations were run using the CHARMM36 force field64 and the software NAMD65 in the NPT ensemble. The Nosé Hoover Langevin piston algorithm66,67 and Langevin dynamics were used to keep constant pressure and temperature. For all the simulations, pressure was set at 1 bar, while two different temperatures were tested, 303 and 310 K, in order to match experimental conditions. Long-range electrostatics were computed by the particle-mesh Ewald (PME)68 and force-based cutoffs using a switching function from 10 to 12 Å.69 The time step was 2 fs, and the trajectories were saved every 1 ps.
Analysis was performed using the software CHARMM70,71 and Python scripts. Results were obtained by averaging over three replicas, and the standard error among replicas is reported as error estimate. Most analysis was performed using the last 100 ns of the trajectory, but for the area per lipid and compressibility modulus a rigorous test of statistical convergence was based on the reverse cumulative averaging approach72 implemented with the pymbar code.73
The area per lipid (SA/lip) was obtained by dividing the simulation box area by the number of lipids per leaflet.
The area compressibility modulus (KA) was calculated by the formula
| (2) |
where kB is Boltzmann’s constant, T is the absolute temperature, 〈A〉 is the average SA/lip, t, and σ 〈A〉2 is the variance of the area. This has been shown to be system size independent for bilayers from 72 to 648 lipids.74
Deuterium order parameters (SCD) were calculated using the formula
| (3) |
where θ is the average angle between the C–H vector and the bilayer normal. For comparison with simulation, experimental quadrupolar splitting values were converted to order parameters using the formula
| (4) |
where ΔvQ is the quadrupolar splitting, χQ is the quadrupolar coupling constant (167 kHz for aliphatic C–2H bonds), P2 is the second-order Legendre polynomial , and θ is the angle of applied magnetic field with respect to the bilayer normal.
Electron density profiles (EDPs) were calculated after recentering the bilayer to place the interface at Z = 0 Å by calculating the densities for all atoms with a slab thickness of 0.2 Å and combining atom densities into total densities. The total densities were used to calculate X-ray form factors by Fourier transformation using the software SIMtoEXP.75 The goodness of fit between the form factors obtained from simulations and experiments was calculated using MATLAB and as cost function the formula
| (5) |
where x is the experimental data point, xref is the data from simulation, Ns is the number of samples, and ∥ indicates the 2-norm of a vector.
The overall bilayer thickness (DB), headgroup-to-headgroup distance (DHH), and hydrophobic distance (2DC) were calculated from EDPs. DB is defined as the distance between the half-maximums of the water EDP, DHH is the distance between the peaks of the total EDP, and 2DC is the distance between half-maximums of the hydrophobic groups that form EDP.
Two-dimensional radial distribution functions (RDFs) were calculated considering the phosphorus atom (P) of PLAPE and POPC, with a distance separation, Δr value of 0.1 Å.
3. RESULTS
3.1. X-ray.
Figure 2A shows the form factors for the POPC/POPE mixtures obtained from XDS. In these data, there is no contribution from the lamellar peaks because when the lipid films in a stack reach a D-spacing close to full hydration, the fluctuations in this swollen sample dominate over lamellar scattering, except for orders h = 1 and h = 2, which are at qz values lower than 0.2 Å−1 in Figure 2. As shown, there is a general shift of patterns toward lower qz when POPE is incrementally added to POPC, indicating that the bilayer is thickening. Figure S1 shows the EDPs corresponding to the X-ray form factors in Figure 2A, calculated using Fourier transform and model fitting with the SDP program.76 As more POPE is added to POPC, the DHH thickness increases. In addition, the distribution of the carbonyl-glycerol (CG) group becomes narrower and increases in amplitude, thus contributing to an apparent broadening of the headgroup envelope.
Figure 2.
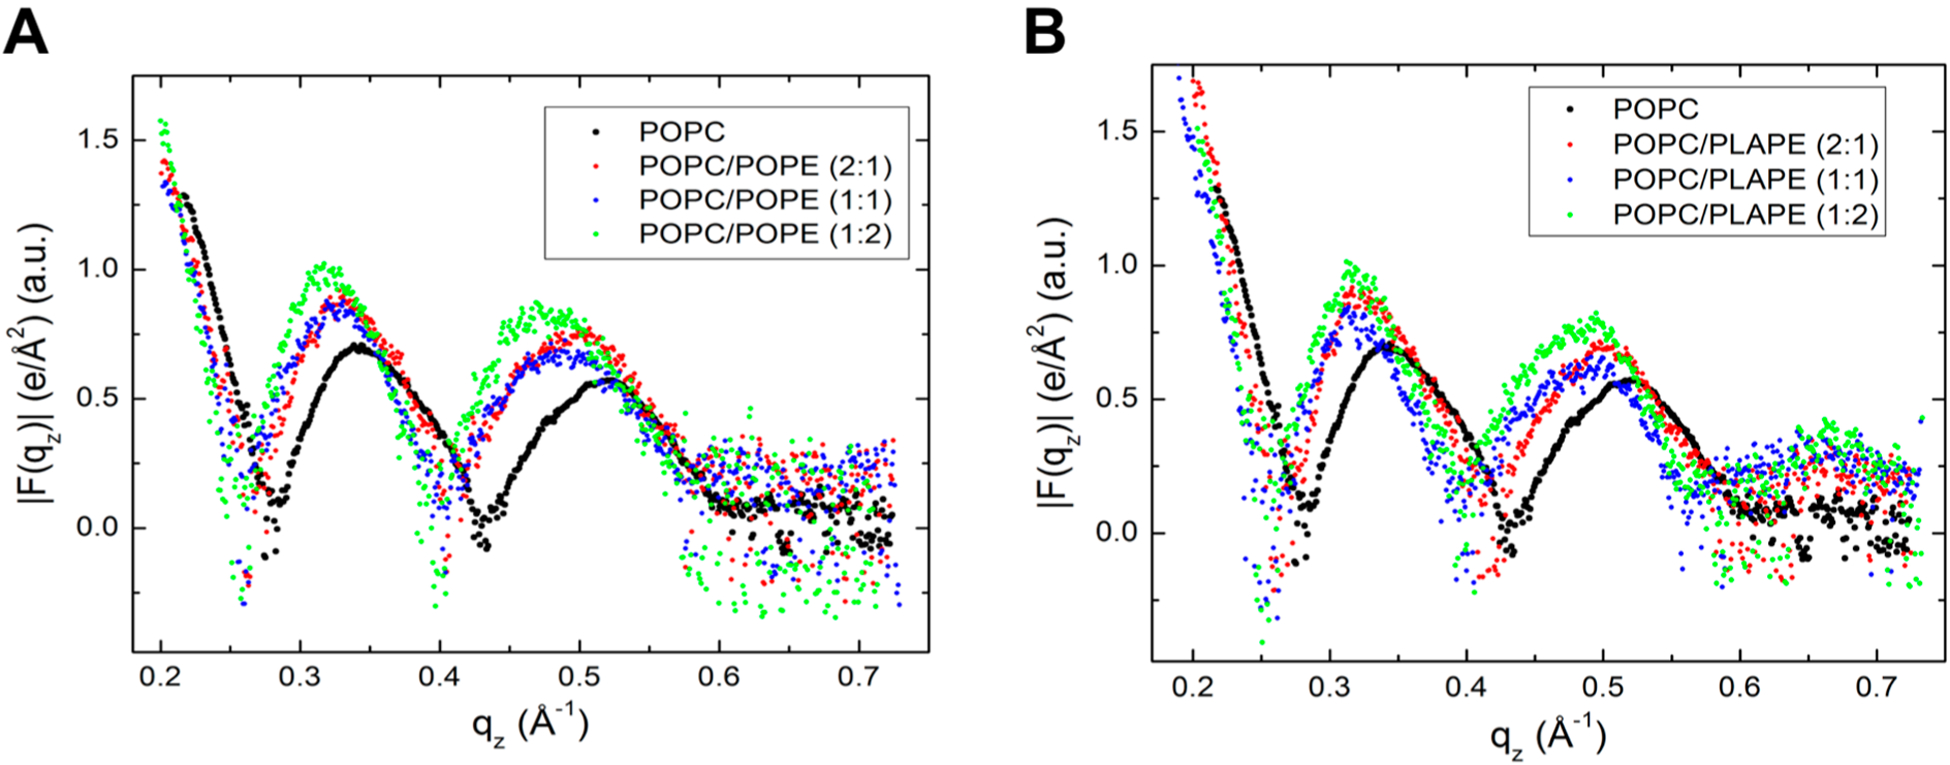
Form factors |F(qz)| as the average of 2–4 symmetrized scans: (A) POPC, POPC/POPE (2:1), POPC/POPE (1:1), POPC/POPE (1:2) and (B) POPC, POPC/PLAPE (2:1), POPC/PLAPE (1:1), and POPC/PLAPE (1:2).
The trend is similar when PLAPE is added to POPC, although the form factors show a more consistent shift to lower qz with gradual addition of PLAPE to the POPC membrane (Figure 2B). The total thickening is slightly higher compared to the addition of POPE to POPC.
3.2. NMR.
Figure 3 shows NMR spectra of POPC-d31 and POPC-d31/PLAPE mixtures at molar ratios of 2:1, 1:1, and 1:2. Addition of PLAPE to POPC-d31 results in a concentration-dependent increase of quadrupolar splittings of the palmitoyl chain of POPC-d31. All spectra show a single set of quadrupolar splittings suggesting that POPC-d31 and PLAPE mix homogeneously in the bilayers at the tested concentrations.
Figure 3.
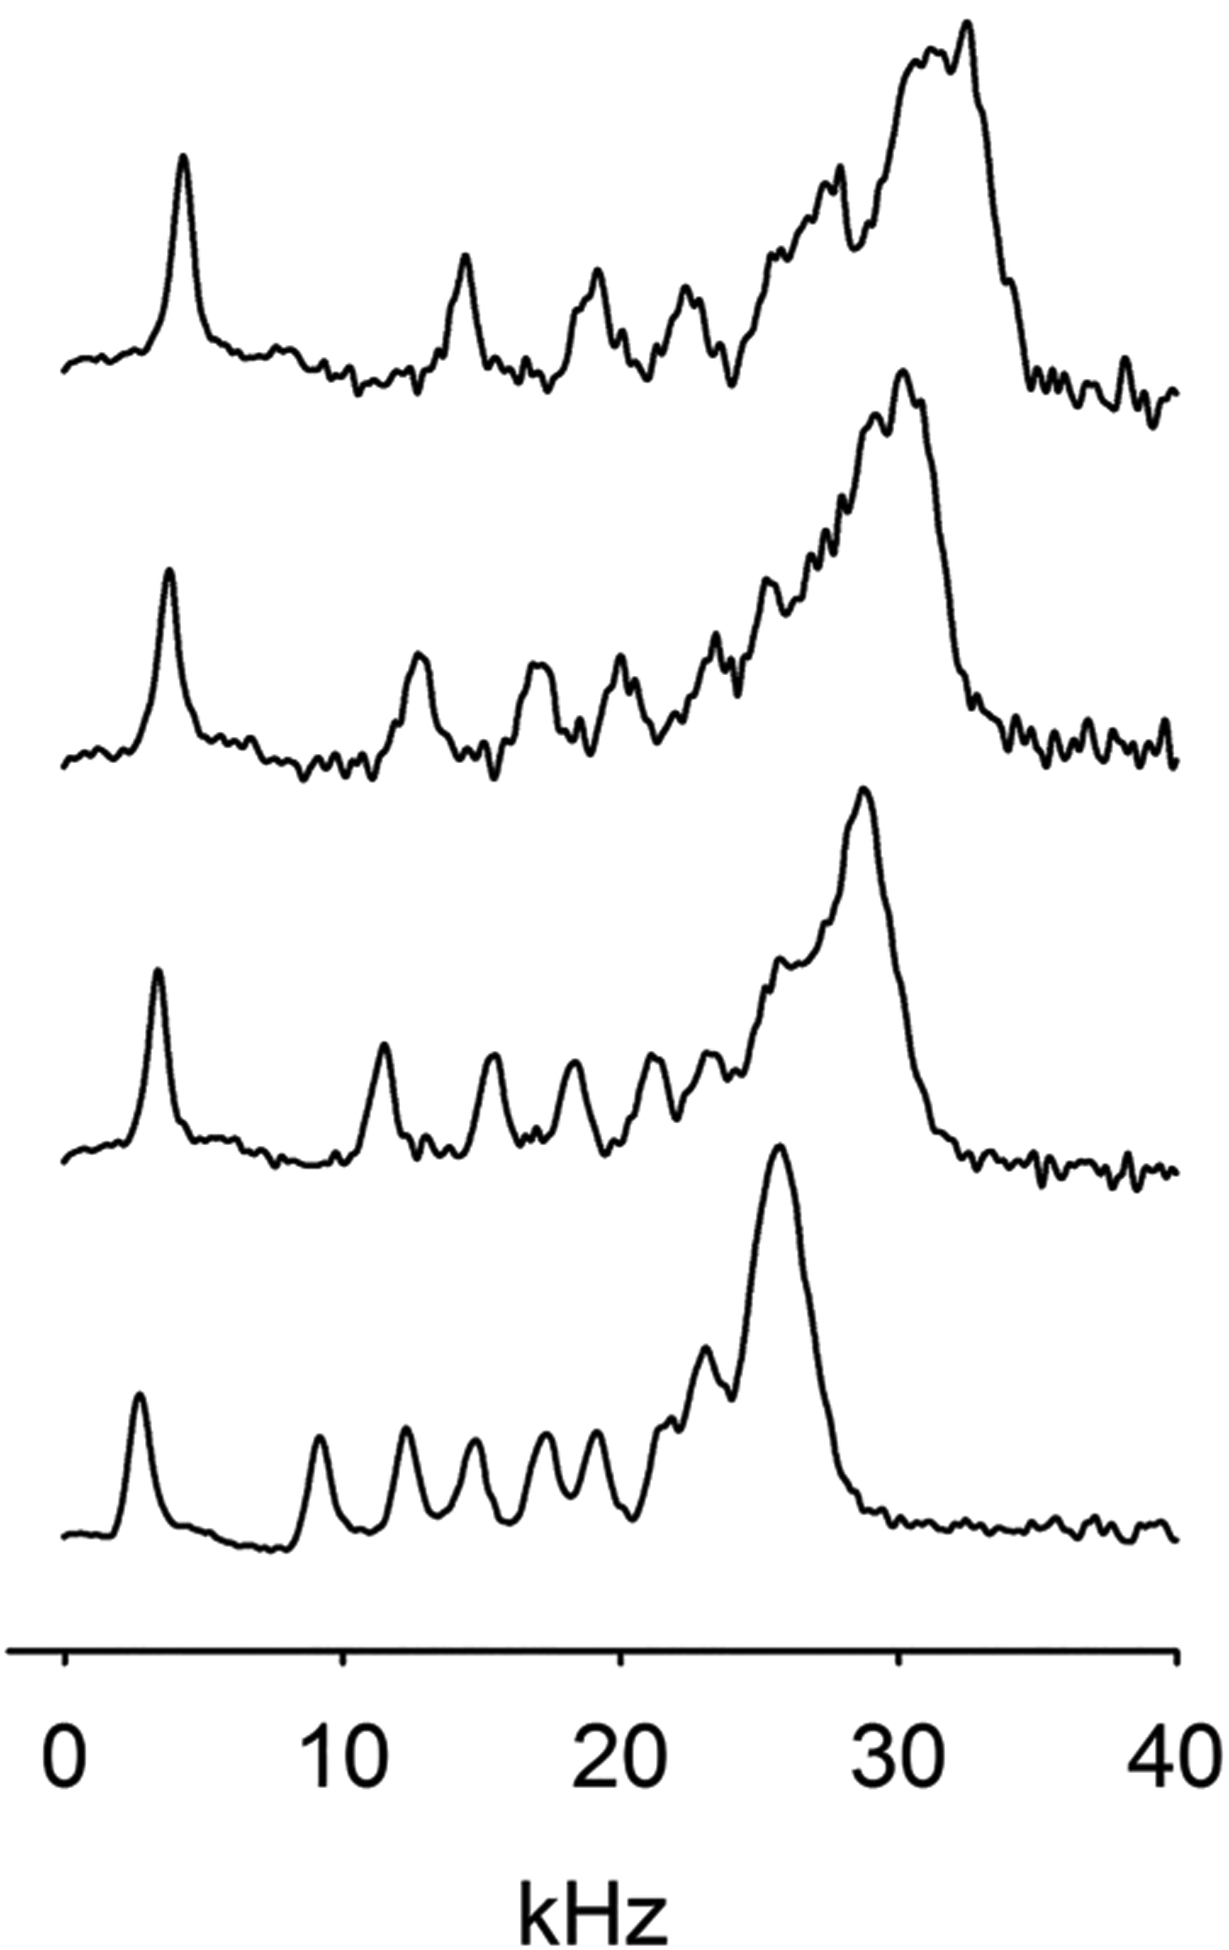
DePaked 2H NMR spectra of POPC-d31 and POPC-d31/PLAPE mixtures at molar ratios of 2:1, 1:1, and 1:2 (from bottom to top) recorded at 30.0 °C. Spectra were recorded within 1 h of sample preparation when oxidation of the plasmalogen double bond of PLAPE was negligible.
A plot of the average palmitoyl chain order parameters vs mole fraction of PLAPE in POPC-d31/PLAPE mixtures yields a linear dependence, suggesting that both lipids mix ideally on the NMR time scale of 10−5 s over the investigated concentration range (see Figure S2).
Data shown are from the first hour of measurements on freshly prepared samples at 30.0 °C when plasmalogen double bond oxidation was deemed to be insignificant. At later times, with increasing oxidation of the plasmalogen double bond, a steady decline of POPC-d31 order was observed. When the double bond had completely disappeared, order of POPC-d31 in POPC-d31/PLAPE mixtures was reduced to order of pure POPC-d31 bilayers (Figure S3).
3.3. Force Field Development and Validation.
Partial charge assignments for the vinyl ether moiety of PLAPE and model compound 1-ethoxypropene are shown in Figure 4. The partial charge on the C3 carbon of PLAPE is borrowed from C36 lipid assignment for the glycerol linkage.77 The ether oxygen and bonded carbon of the tail received charges consistent with the recently published linear ether FF, C36e.78 In this study, it was found that reducing the C3 glycerol charge relative to QM results for linear ethers allows more water to penetrate the bilayer, improving agreement with the overall experimental surface area per lipid (based on F(q) crossing points). Because the glycerol linkage is branched rather than linear, borrowing partial charge from C36 results tuned specifically to the glycerol region of lipids is chemically consistent.
Figure 4.
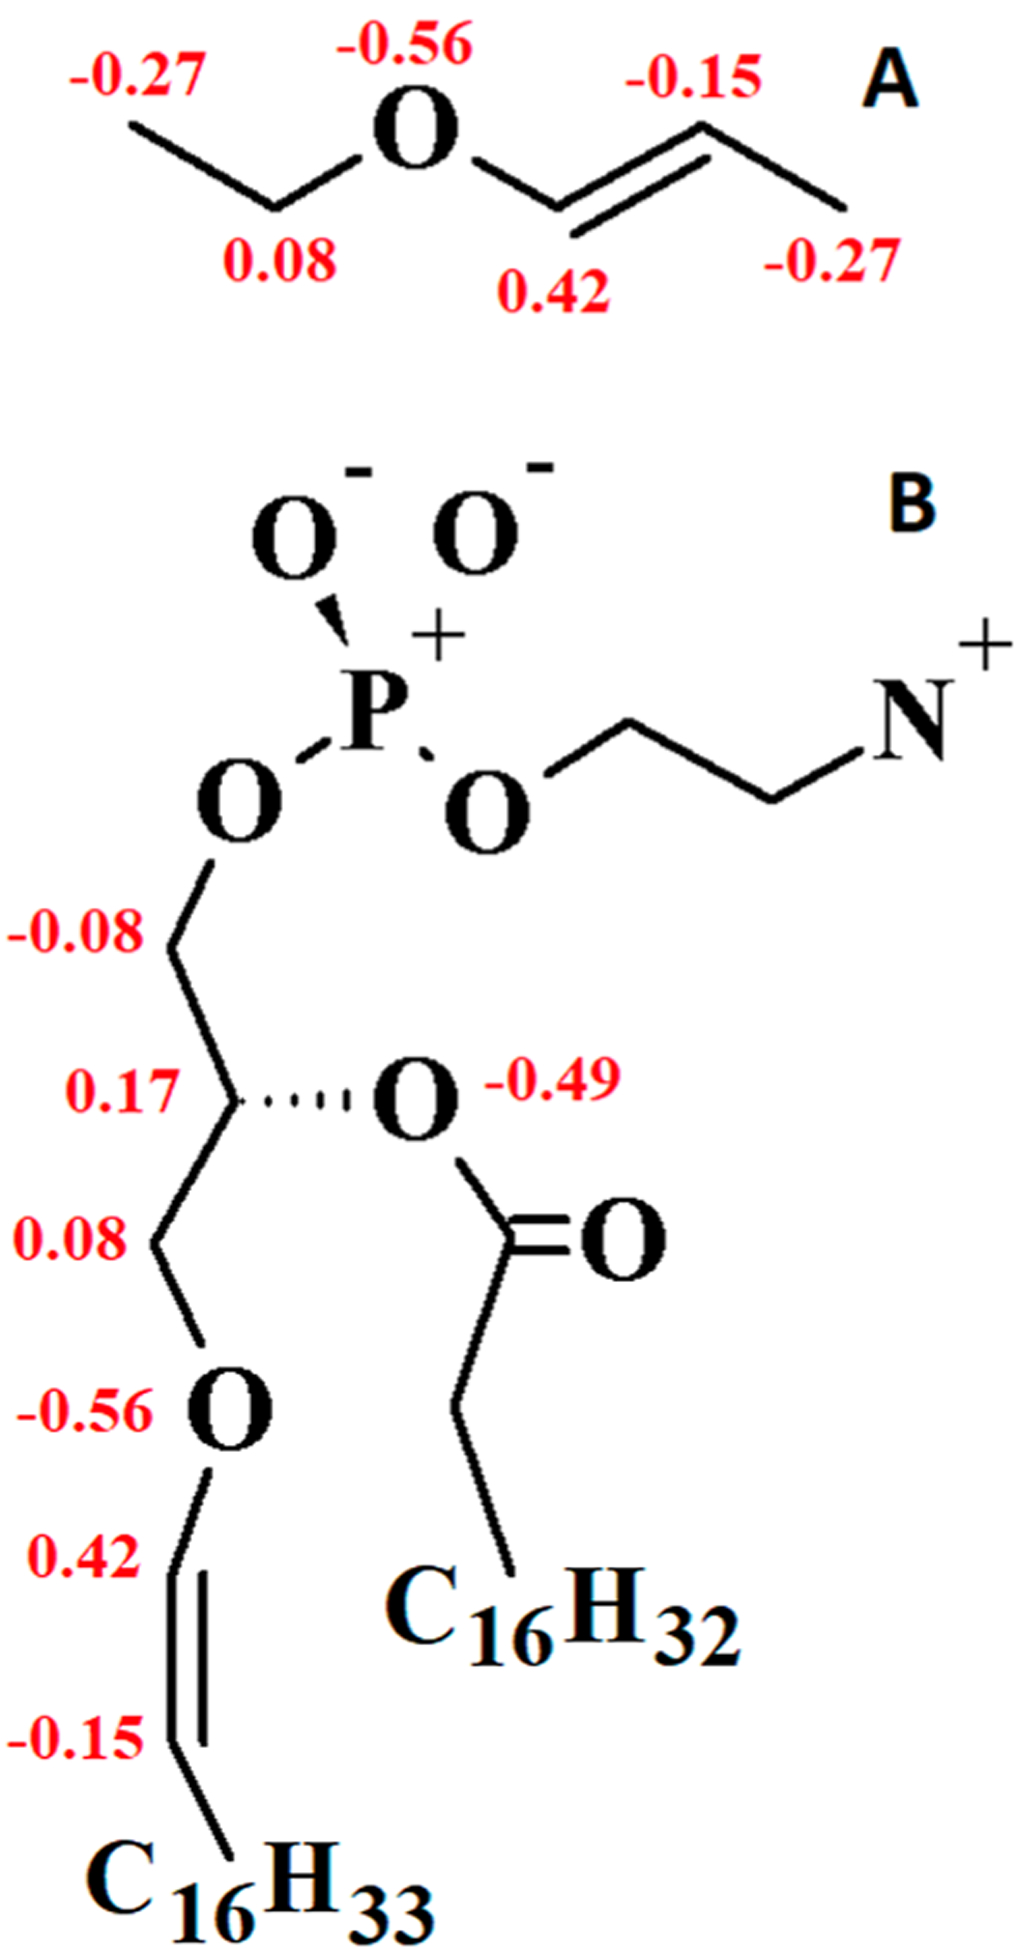
Partial charge assignments for 1-ethoxypropene and the vinyl ether linkage of PLAPE: (A) 1-ethoxypropene and (B) PLAPE (units of elementary charge, +e). Charges on heavy atoms are shown. Other charges for PLAPE are identical to C36 assignments for DOPE. 1-Ethoxypropene charges were taken directly from the vinyl region of PLAPE as a model for fitting dihedral parameters, so this should not be considered a stand-alone model. QM results for charges of 1-ethoxypropene are given in Figure S4.
QM results for partial atomic charges of model vinyl ethers 1-ethoxypropene and diethylene glycol divinyl ether are shown in Figure S4 with discussion. An alternate charge set was tested for PLAPE in which −0.36 elementary charge was assigned to the ether oxygen, the attached vinyl carbon was neutral, and the second vinyl carbon of the tail was assigned −0.20, consistent with QM results in Figure S4; but this set showed disagreement with X-ray form factors resulting in under-estimation of SA/lip (Figure S5), so the charge set in Figure 4 was chosen.
The model for 1-ethoxypropene in Figure 4 was used to fit appropriate dihedral angles. Therefore, the charges were taken directly from the vinyl region of PLAPE, and it should not be considered a stand-alone model for 1-ethoxypropene.
Figure 5 plots results for the QM potential energy scan about the C–O–C=C and C–O–C–C(=C) dihedrals of 1-ethoxypropene. The minimum of C–O–C=C occurs at 0°, an inversion of the potential energy landscape of typical C–C–C–C or C–O–C–C dihedrals which have an energy maximum in the same dihedral configuration. Final torsional fits agree well with the QM minima and local minima for both dihedrals, indicating accurate representation of the torsional energy landscape at biologically relevant temperatures.
Figure 5.
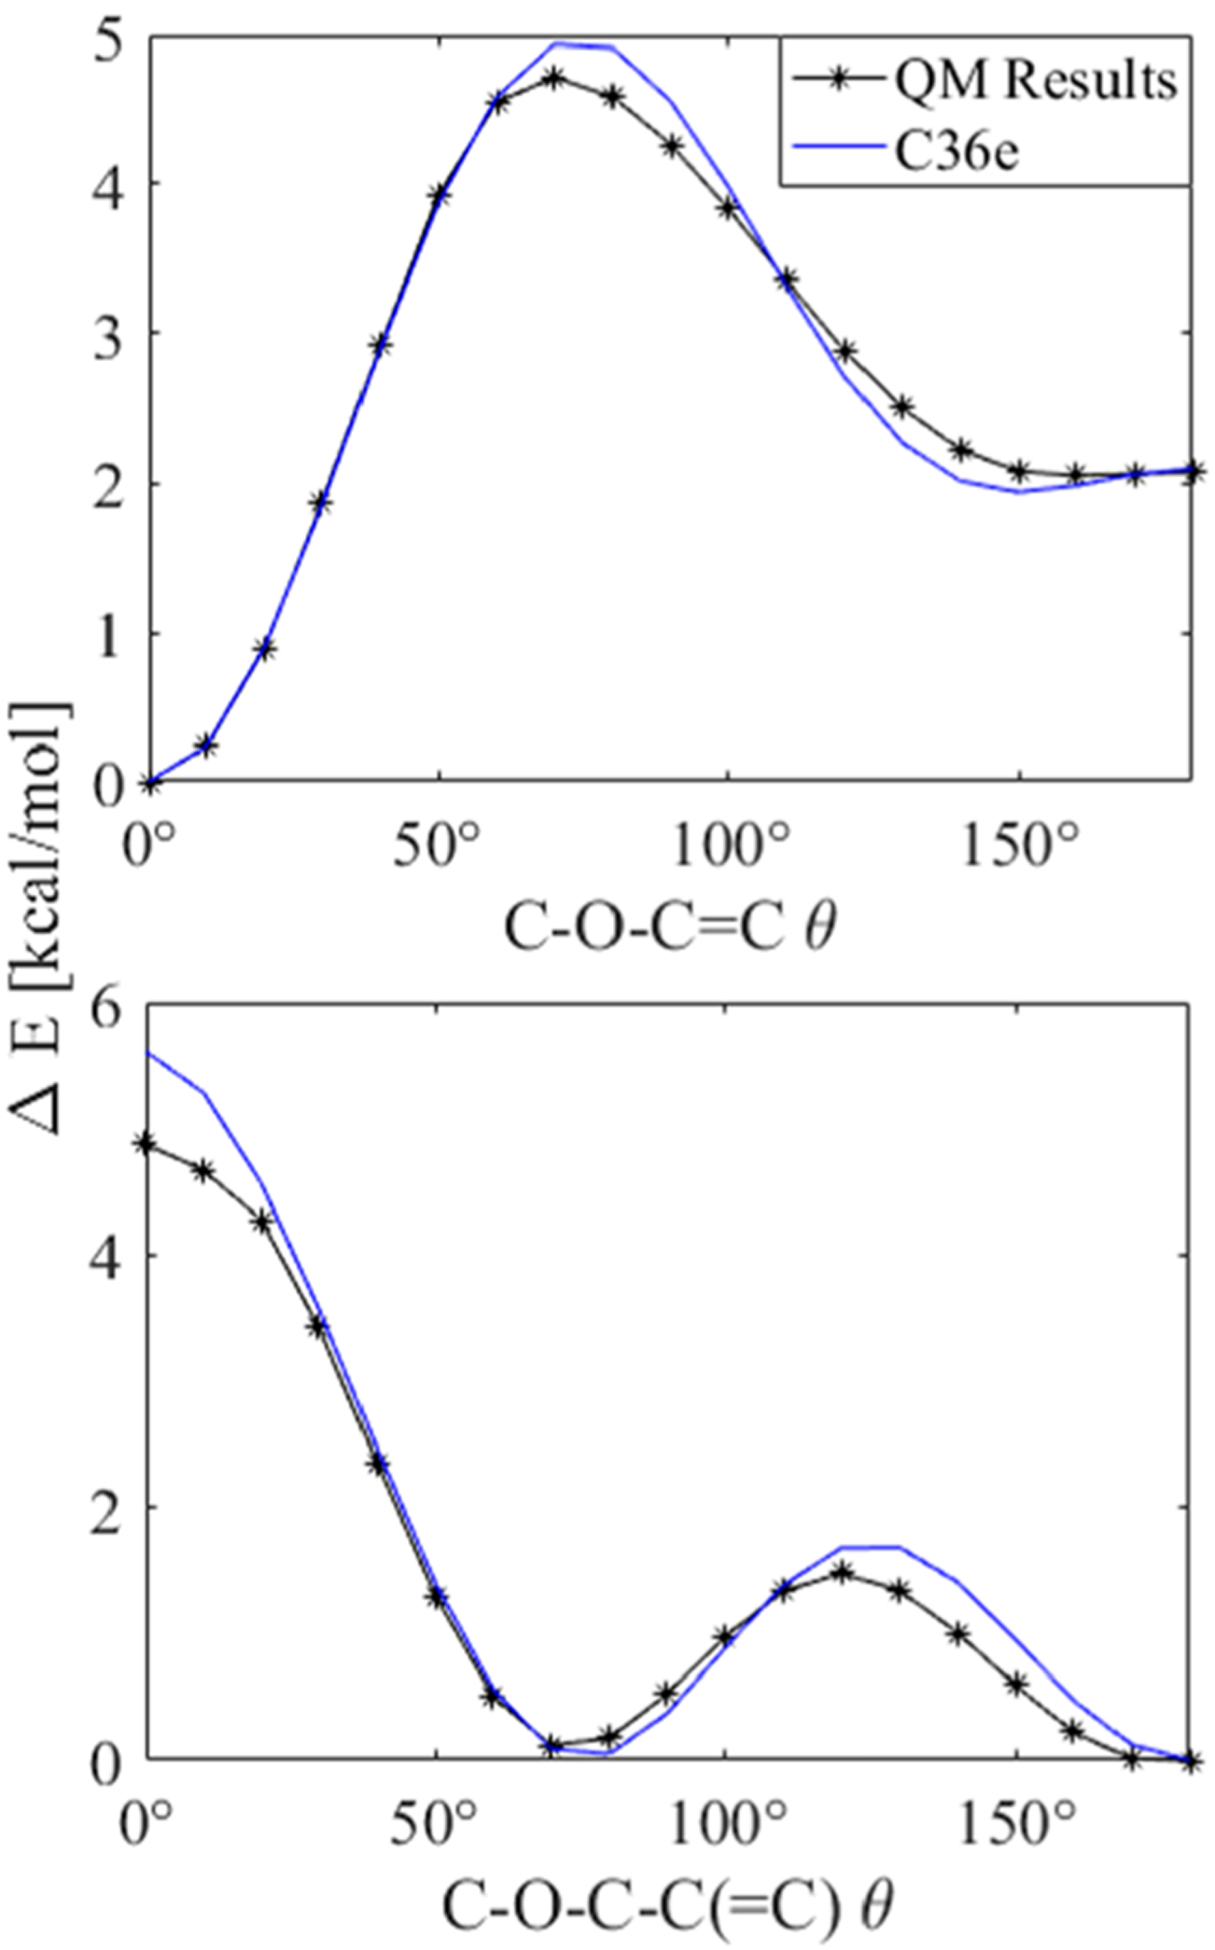
Potential energy scan about dihedrals of 1-ethoxypropene: (top) C–O–C=C and (bottom) C–O–C–C(=C); QM using MP2/cc-pVDZ//Eint[MP2:CC] (black) plotted with results after dihedral fitting (blue). Other torsions remained trans.
3.4. Molecular Dynamics Simulations.
The SA/lip for the different POPC to PLAPE (or POPE) ratios at different temperatures is reported in Table S1 and Figures 6, S6, and S7. The SA/lip for POPC at 313 K from MD simulation is slightly smaller than experiment at 310 K based on previous work79 (Table S1). Consequently, the SDP fit SA/lip for the POPC/POPE mixtures has ~1 Å2 higher values compared to our MD simulation. For POPC/PLAPE, as expected, with an increase in temperature the SA/lip also increases with a roughly constant change irrespective of composition, i.e., a 7 degree increase in temperature results in a 4 Å2 increase in SA/lip. The overall SA/lip decreases linearly with increasing concentration of PLAPE (similarly for mixtures with POPE, see Table S1), but changes are small (Figure 6). This is due to the ability of the PE headgroup to form hydrogen bonds to neighboring lipids and thus to have a more tightly packed membrane (see analysis at the end of this section). PLAPE with its vinyl ether results in a slightly bulkier lipid with a 3–3.5 Å2 increase in the SA/lip (Table S1).
Figure 6.
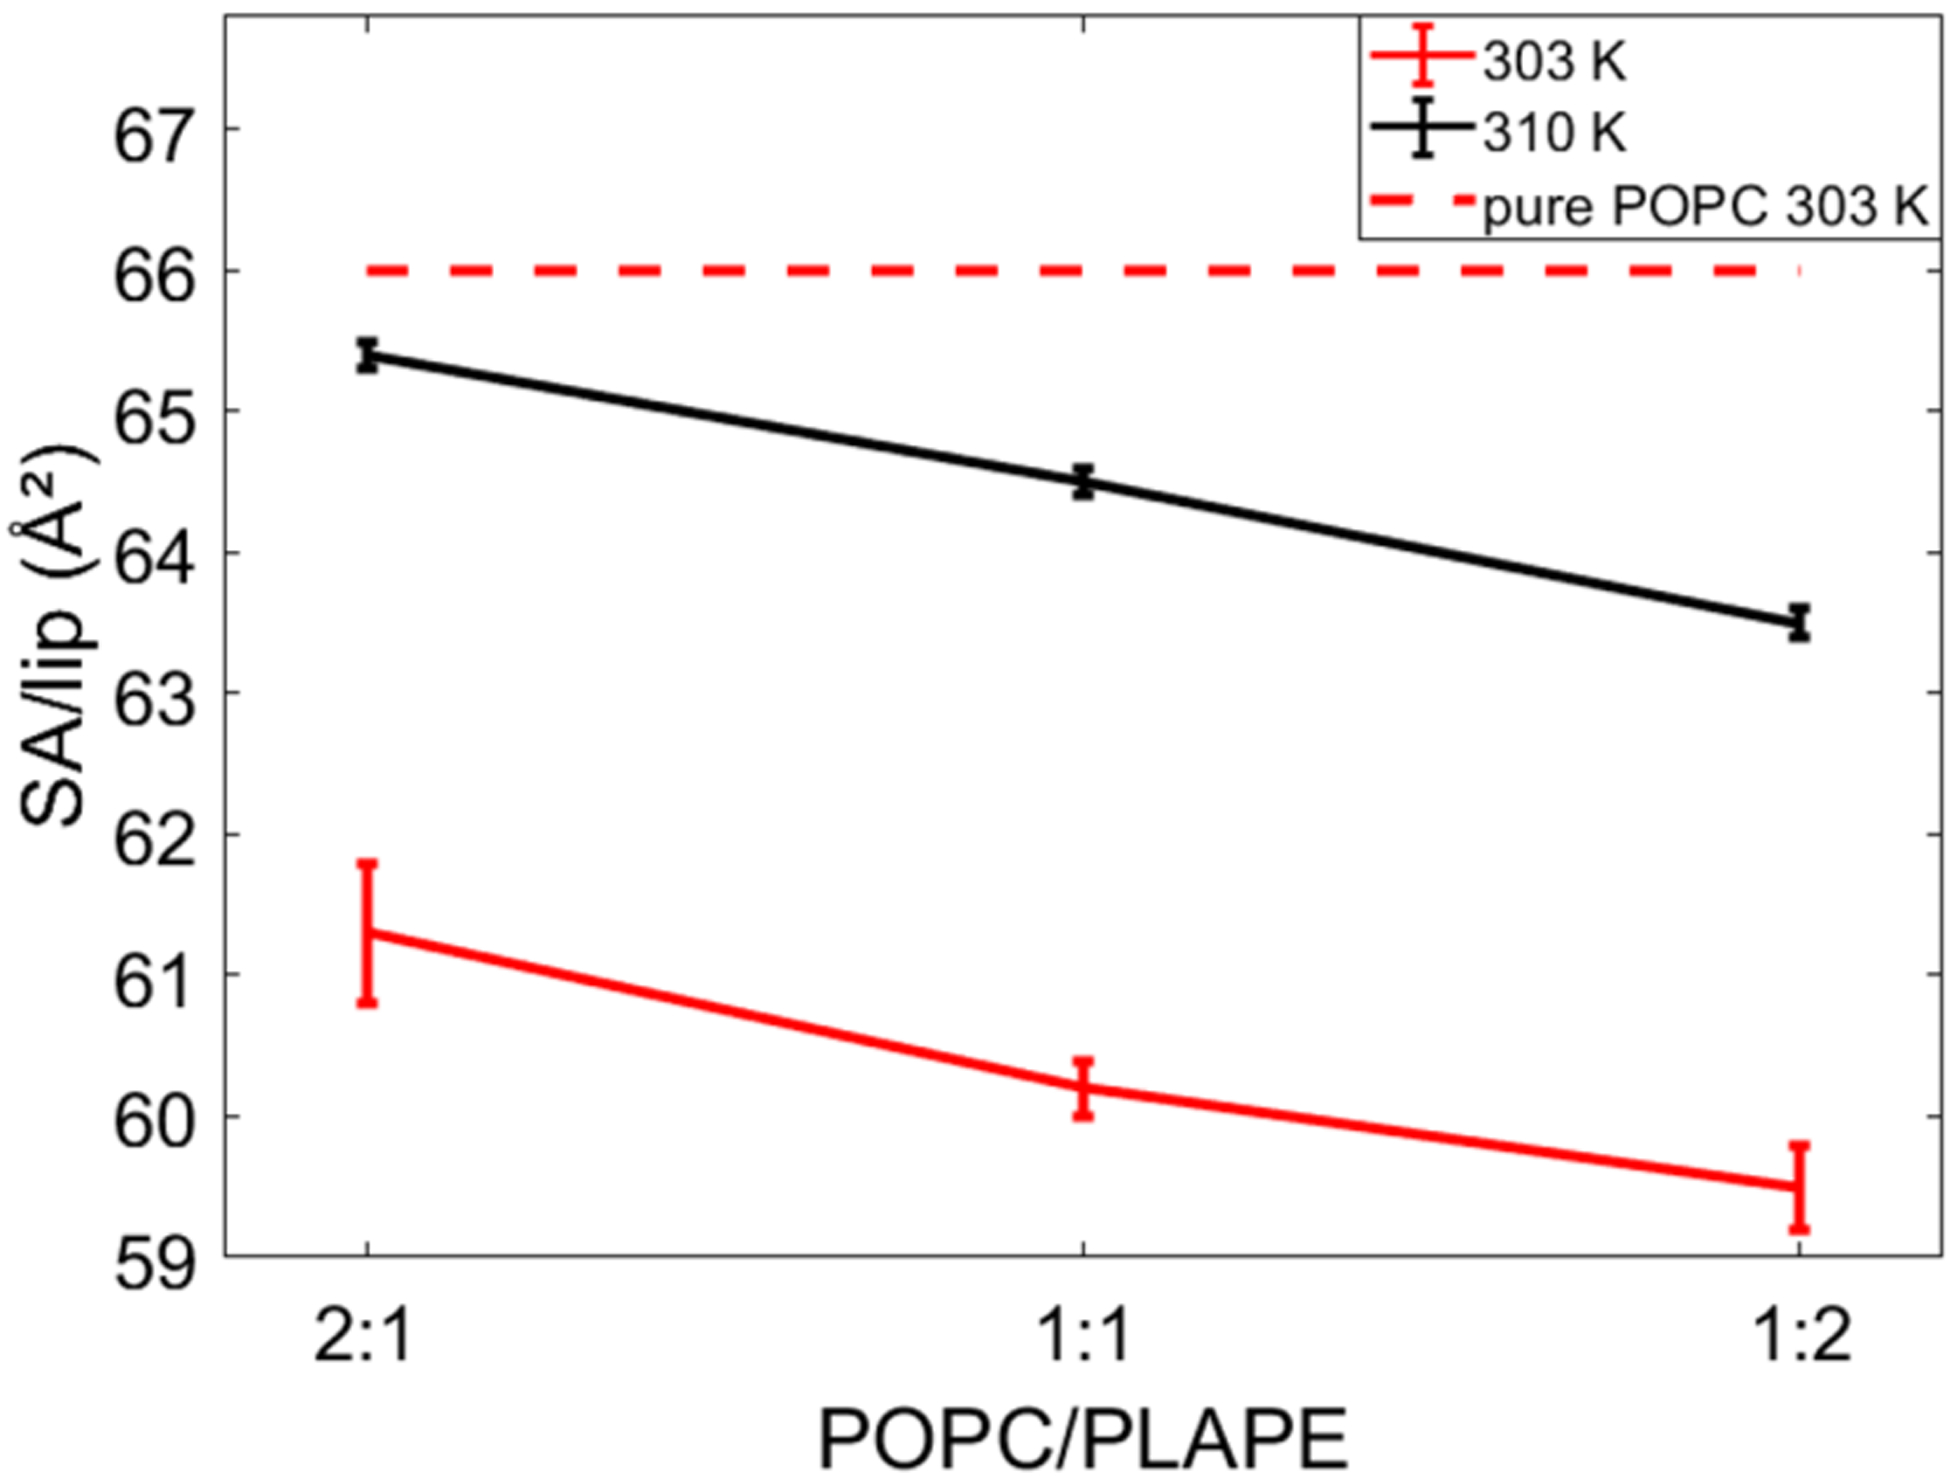
Graphical comparison of SA/lip for POPC/PLAPE mixtures at two different temperatures from MD simulations. The SA/lip of a pure POPC bilayer is represented by the red dashed lines.80
KA calculations (Table 1) show that the rigidity of POPC/PLAPE and POPC/POPE mixtures is comparable to pure POPC and POPE bilayers (POPC (303 K): 0.24 ± 0.01 N/m74 and POPE (310 K): 0.28 ± 0.01 N/m74). The larger SA/lip for the PLAPE-containing bilayers results in a reduced KA compared to mixtures with POPE. Overall, the presence of PLAPE lipids does not appear to have a major influence on bilayer elastic properties compared to a pure POPC bilayer, whereas it does result in a less rigid membrane when compared to mixtures with POPE at the same temperature.
Table 1.
KA from Simulation for POPC/PLAPE and POPC/POPE Mixtures ± Standard Error
| KA (N/m) | |||
|---|---|---|---|
| 2:1 | 1:1 | 1:2 | |
| POPC/PLAPE | |||
| 303 K | 0.21 ± 0.02 | 0.30 ± 0.02 | 0.24 ± 0.03 |
| 310 K | 0.24 ± 0.01 | 0.21 ± 0.02 | 0.22 ± 0.03 |
| POPC/POPE | |||
| 310 K | 0.30 ± 0.05 | 0.28 ± 0.02 | 0.24 ± 0.02 |
The first direct comparison with experiment was the X-ray form factor for the three PLAPE systems (Figure 7). The simulation results for the phase crossing points (zeroes) and the first two lobes are in good agreement with experiment. Crossing points are important metrics for SA/lip (or thickness), and thus it appears that our estimates of lipid packing are reasonable. The largest deviation exists for the 2:1 ratio POPC/PLAPE with the simulation showing a crossing point that is a slightly lower qz compared to experiment. This implies that the SA/lip is slightly smaller than experiment. Moreover, the third lobe has some minor deviations from experiment toward higher qz values at higher PLAPE content. The deviation between experiment and simulation is slightly higher for the POPC/POPE mixture (Figure S8). The crossing points for the MD simulations are left-shifted for the 2:1 and 1:1 mixtures and likely stemming from the simulation having a lower SA/lip compared to experiment for pure POPC bilayers (Table S1). Considering our focus here was the plasmalogen lipid, the good agreement between experiment and simulation suggests that the bilayer structure obtained from the simulations represents faithfully the measured experimental properties with minimal deviation from experiment.
Figure 7.
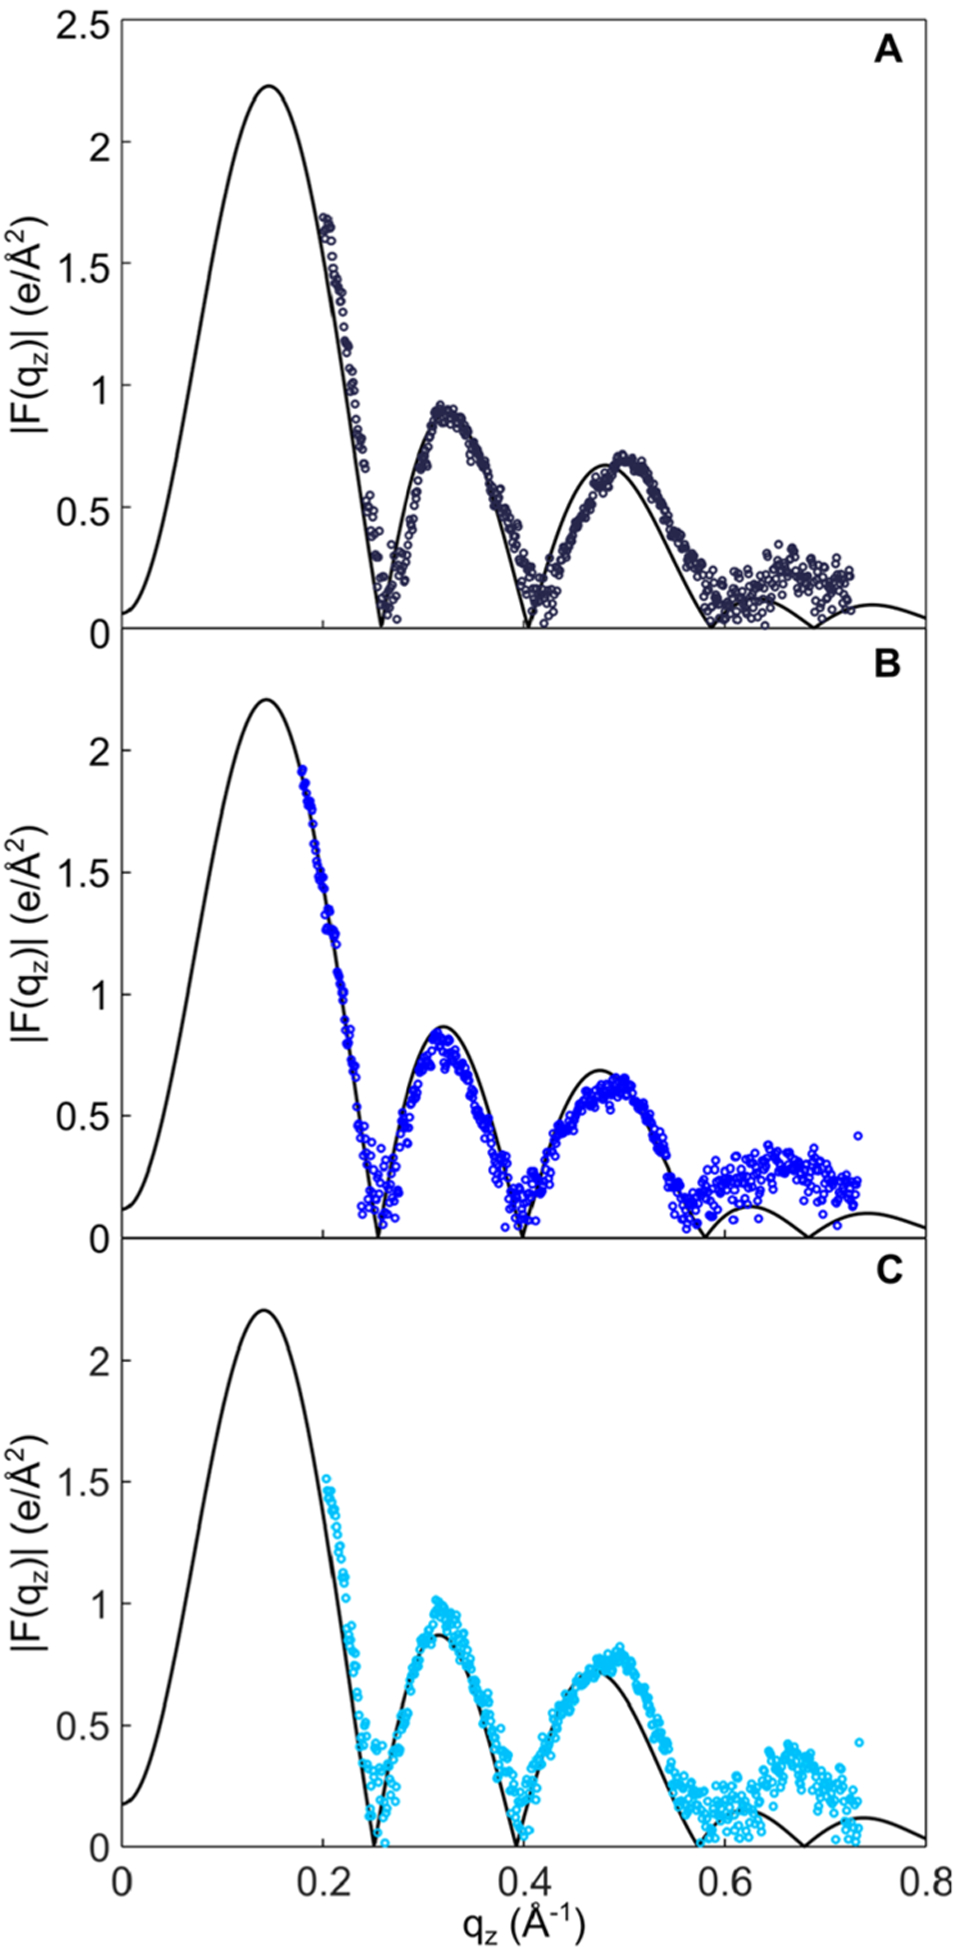
X-ray form factors (|F(qz)|) as a function of the scattering angle (qz) obtained from simulations at 310 K (black line) of three POPC/PLAPE molar ratios: (A) 2:1, (B) 1:1, and (C) 1:2. The simulation results (solid line) are compared to experimental results (dots). Calculated goodness of fit between form factors obtained from simulations and from experiment of POPC/PLAPE molar ratios is 0.019 for 2:1, 0.016 for 1:1, and 0.022 for 1:2.
Conversion of the X-ray form factors to real space yields electron density profiles (EDPs, Figure 8) for the three molar ratios shown in Figure 7. The overall density profiles look similar between mixtures of POPC with PLAPE and POPE. Fits of the SDP model to the form factors provide an estimate for the membrane component distributions and compare favorably with our simulations (Figure S1). However, there are clear differences for the carbonyl-glycerol group with simulation suggesting this distribution is asymmetric, whereas the SDP model uses Gaussian functions to fit to the form factors. Likely having a consequence, the experimental model water distribution is not a simple error function for the 1:1 and 2:1 mixtures whereas the simulations show a preserved form of an error function.
Figure 8.
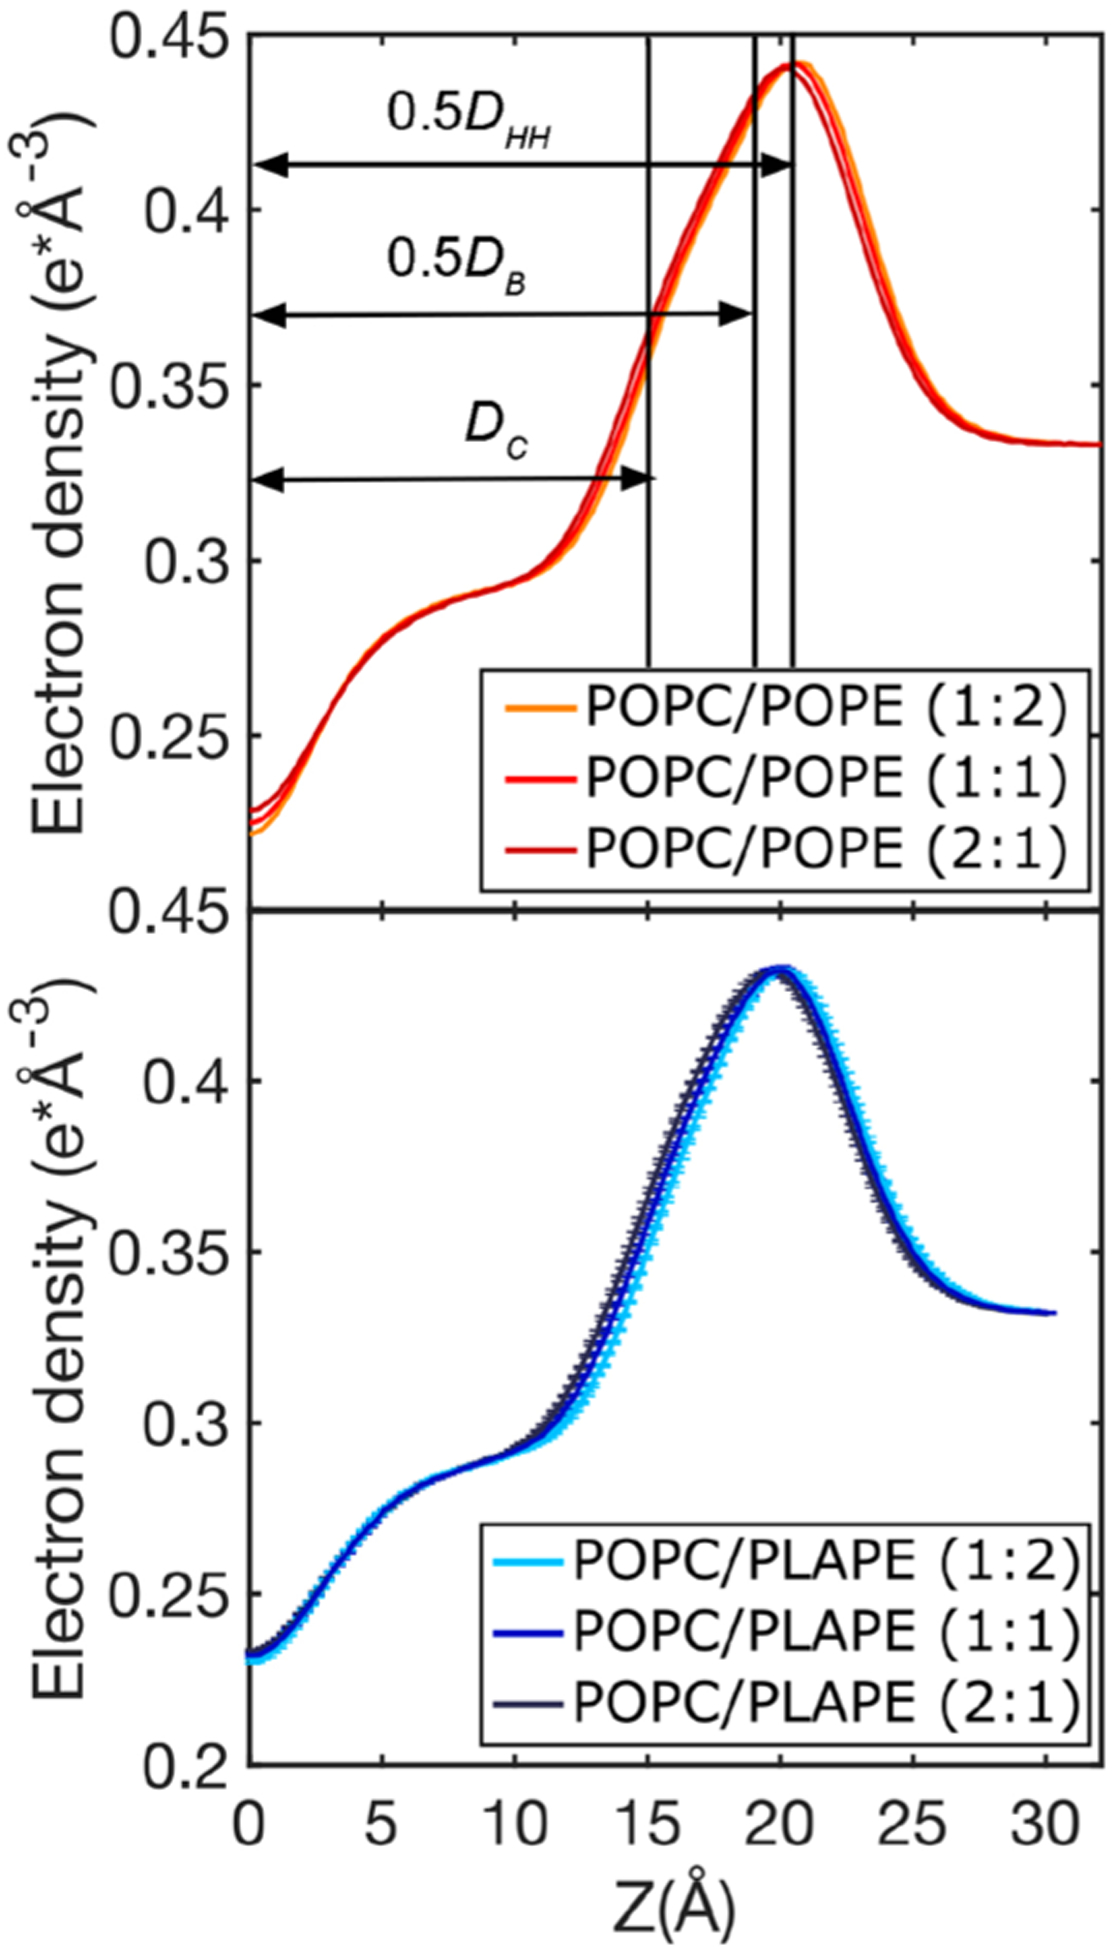
Total electron density profiles for different POPC/POPE (upper panel) and POPC/PLAPE (lower panel) mixtures obtained from MD simulations at 310 K with POPC/POPE and POPC/PLAPE molar ratios listed in the legend. Rough locations for the thickness metrics are shown in the top panel (exact values are provided in Table 2).
The EDPs can also be used to provide details regarding different measures for thickness (Table 2). Overall, the presence of the PE headgroup results in a membrane that is thicker. The DHH agrees well between the SDP model fit and MD simulation, but the DB and 2DC are higher than the values from the experimentally based model. This is likely the result of slight SA/lip disagreement for POPC bilayers and the distributions used in the SDP model. Since the SA/lip is larger for the PLAPE bilayers compared to POPE, the thicknesses are smaller for the DHH and DB. For DB, this means that water penetrates deeper with the ether lipid compared to the ester-linked POPE, which is similar to past work with 1,2-di-O-hexadecyl-sn-glycero-3-phosphocholine78 compared to dipalmitoylphosphatidylcholine.79 However, the hydrocarbon thickness is unaffected by the PE lipid type. Consistent with MD and experiment is that increasing the PE concentration increases the thicknesses of the bilayer.
Table 2.
Thicknesses (Å) of POPC/PLAPE and POPC/POPE Mixtures with POPC/PE Molar Ratiosa
| Thicknesses (Å) | ||||
|---|---|---|---|---|
| DHH | DB | 2DC | ||
| POPC/POPE (Exp) | 1:0 | 36 ± 0.5 | 37.2 ± 0.5 | 27.4 ± 0.5 |
| 2:1 | 40 ± 0.5 | 38.0 ± 0.5 | 28.6 ± 0.5 | |
| 1:1 | 41 ± 0.5 | 38.4 ± 0.5 | 29.3 ± 0.5 | |
| 1:2 | 41 ± 0.5 | 39.0 ± 0.5 | 30.0 ± 0.5 | |
| POPC/POPE (MD) | 1:0 | 38.2 ± 0.1 | 37.3 ± 0.1 | 28.0 ± 0.1 |
| 2:1 | 40.3 ± 0.1 | 39.8 ± 0.2 | 29.7 ± 0.1 | |
| 1:1 | 41.0 ± 0.1 | 40.4 ± 0.2 | 30.5 ± 0.1 | |
| 1:2 | 41.5 ± 0.2 | 40.9 ± 0.2 | 31.0 ± 0.2 | |
| POPC/PLAPE (MD) | 2:1 | 39.2 ± 0.1 | 37.7 ± 0.1 | 29.4 ± 0.1 |
| 1:1 | 39.9 ± 0.1 | 38.1 ± 0.2 | 30.2 ± 0.1 | |
| 1:2 | 40.3 ± 0.1 | 38.7 ± 0.2 | 31.0 ± 0.1 | |
DHH is the head-to-head distance, DB is the overall bilayer thickness, and 2DC is the hydrophobic thickness. The experimental estimates are based on XDS reconstruction with the SDP model. MD simulations for POPC alone are obtained from previous work at 40 °C79.
Our MD simulations with PLAPE were then compared to the NMR results for SCD of the sn-1 chain of POPC (Figure 9). This comparison depends on the time-averaged orientation of the C–D bond (or C–H bond in simulations) with respect to the bilayer and is also indicative of SA/lip, i.e., lower order correlates with higher SA/lip.81 The SCD from simulations is in excellent agreement with values measured by 2H NMR. Agreement of simulation results with NMR and X-ray data suggests that our updated force field accurately predicts the SA/lip and potentially the slight deviations between X-ray and MD for the form factors for the 2:1 POPC/PLAPE might be the result of differences in thickness, not SA/lip.
Figure 9.
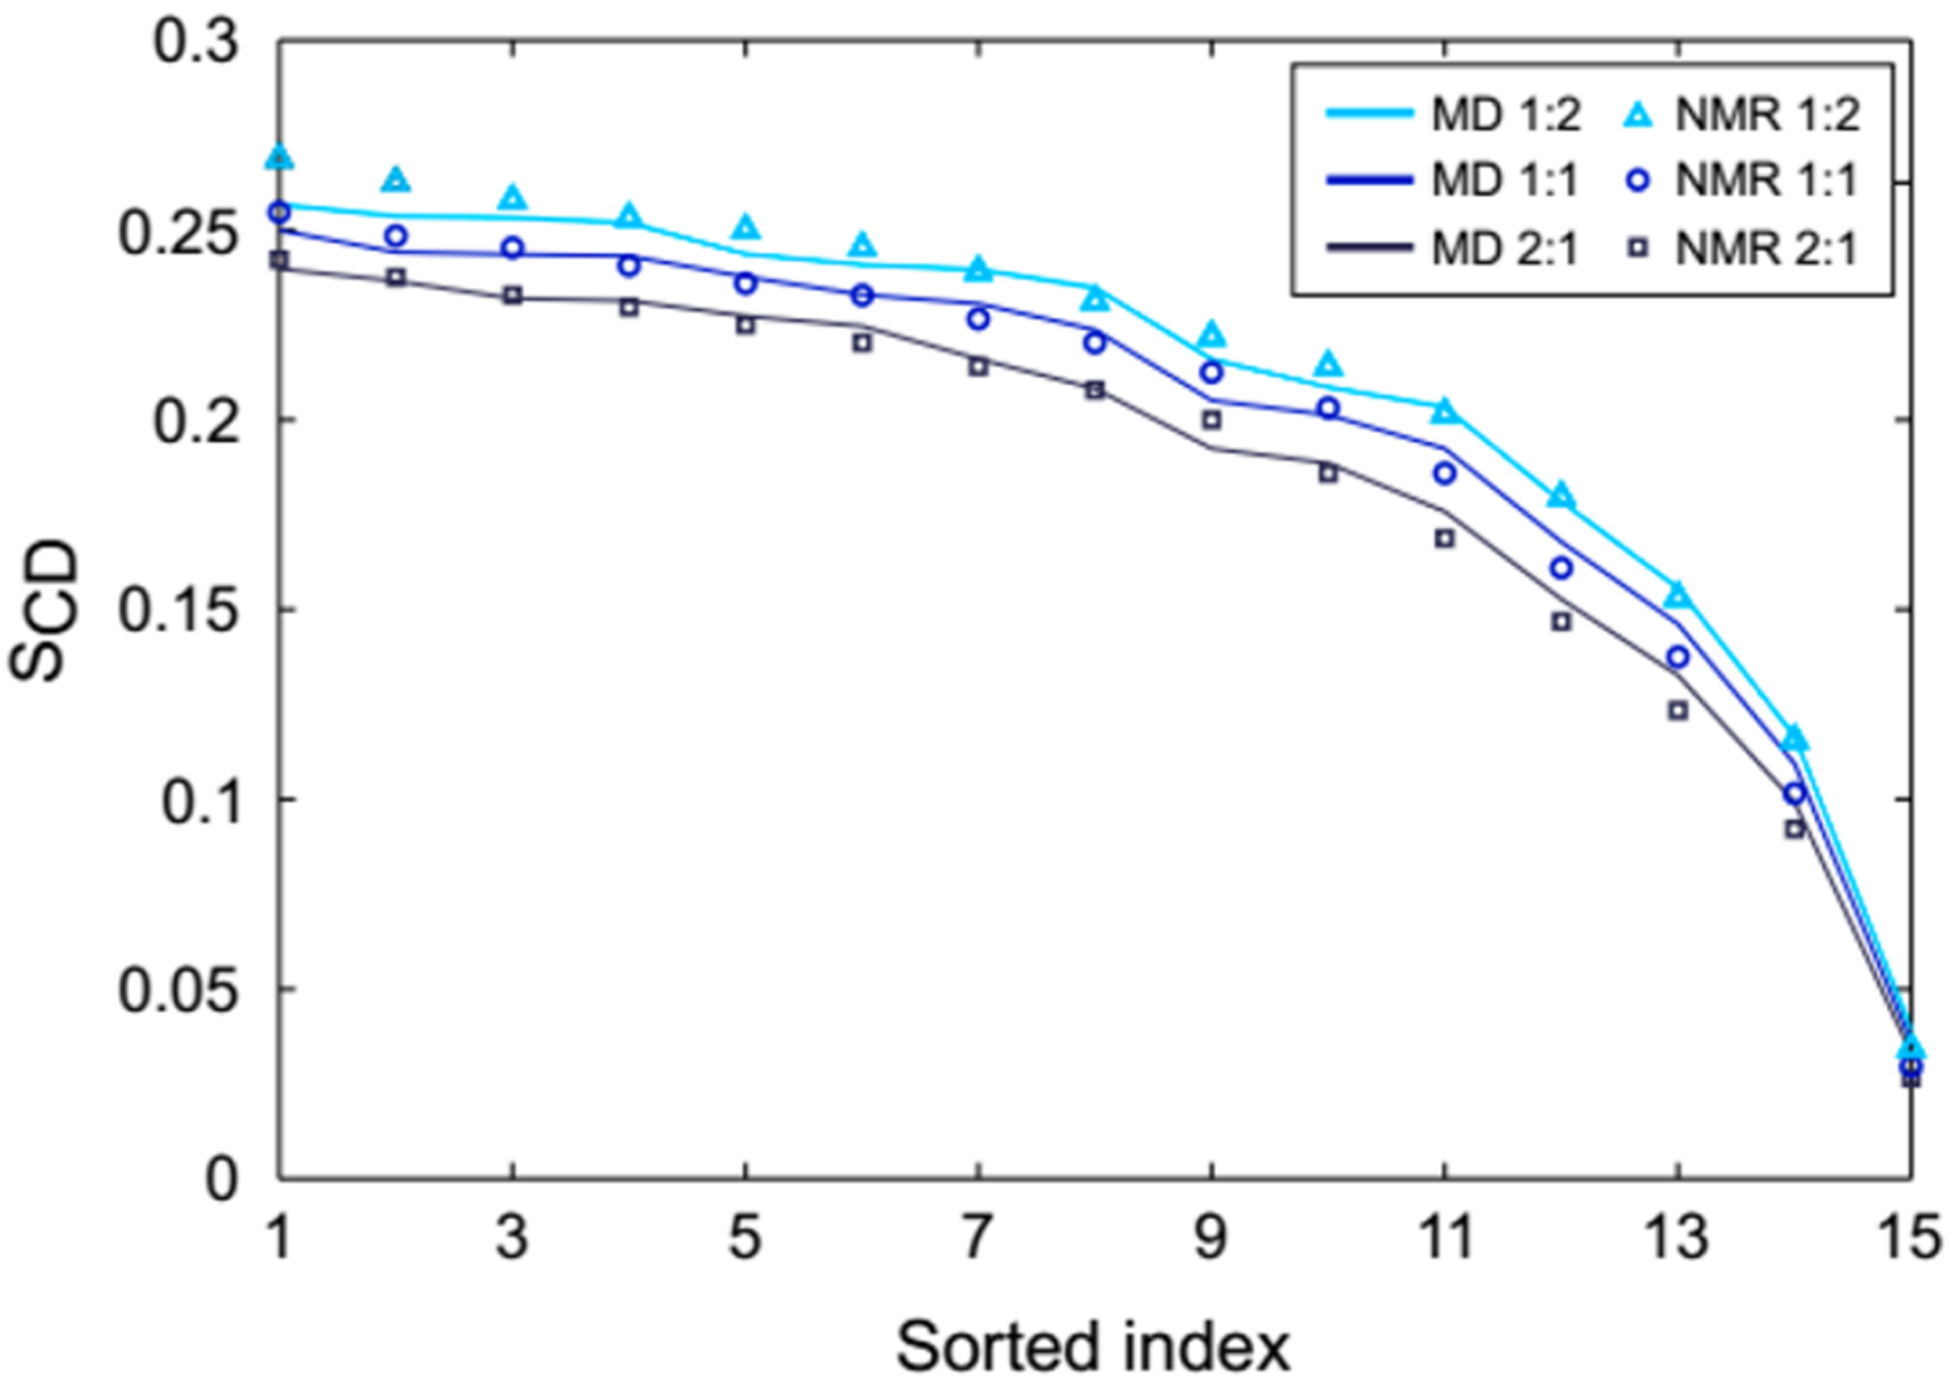
Comparison of POPC sn-1 chain SCD obtained from simulations with experimental 2H NMR measurements at 303 K using a decreasing monotonic sorting of order per methylene segment. The latter takes into consideration that 2H NMR order parameters lack assignment for a specific carbon atom along the chain. The POPC/PLAPE molar ratios are listed in the legend.
Calculated deuterium order parameters of POPC for the different molar ratios of POPC/PLAPE and POPC/POPE are shown in Figures 10 and S9, respectively. Elevated concentrations of PLAPE increase the order of both sn-1 and sn-2 chains of POPC similar to that effect observed with POPE. The same trend is observed for both chains of PLAPE, which increase with increasing PLAPE concentration as well (Figure S10).
Figure 10.
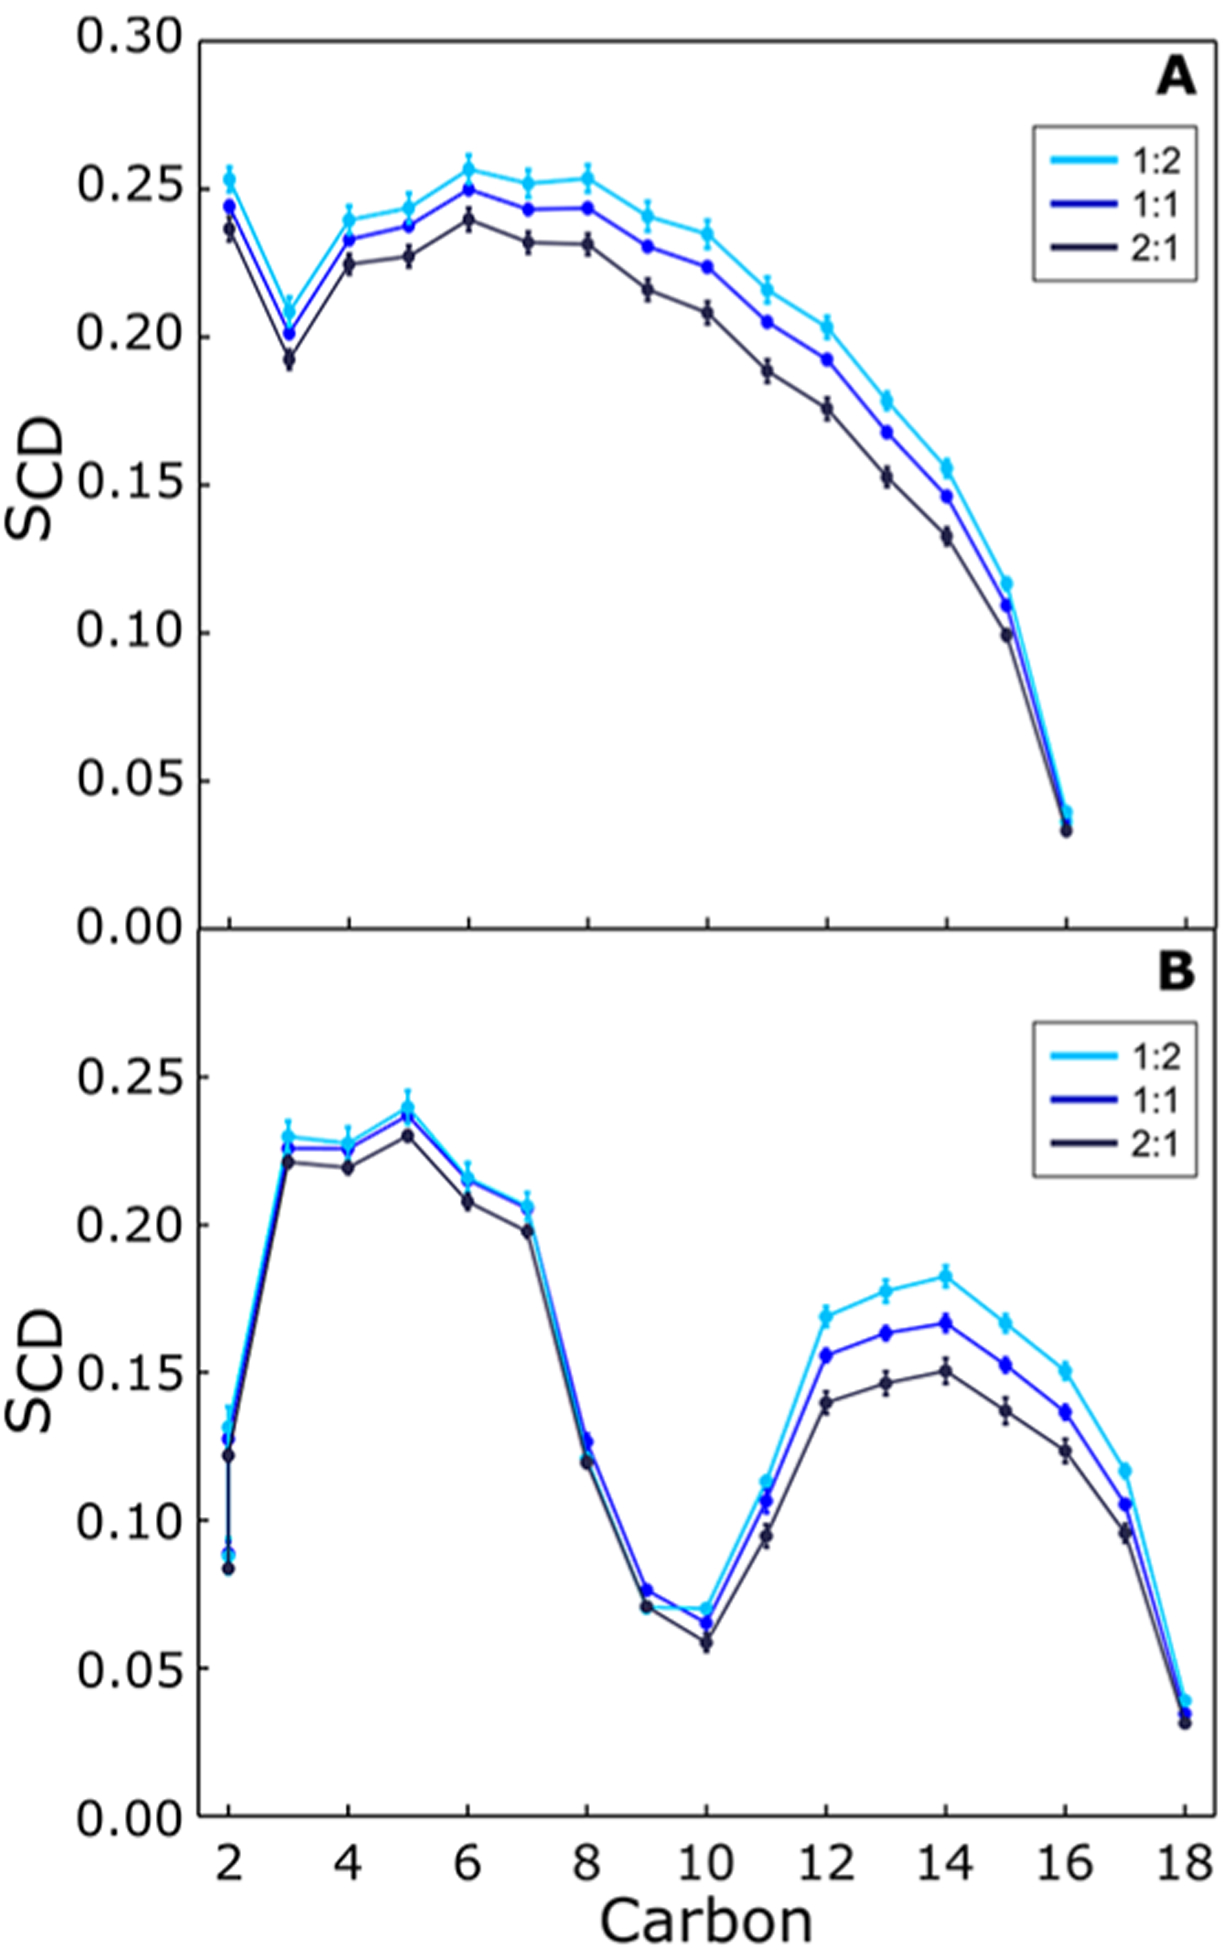
SCD calculations of POPC sn-1 (A) and sn-2 (B) chains from MD simulations of POPC/PLAPE mixtures at 303 K with POPC/PLAPE molar ratios listed in the legend. Here carbon-based order parameters are given. For the sn-2 chain, the two hydrogens attached to carbon-2 have a different splitting; therefore, the SCDs of 2R and 2S are shown separately instead of their average.
To investigate lateral organization of lipids, radial distribution functions (RDFs) for the different POPC/PLAPE and POPC/POPE mixtures were calculated (Figures 11 and S11). The distribution of lipids does not seem to be dependent on lipid composition. PE interacts with itself (Figures 11A and S11A) slightly more strongly than with POPC (Figures 11C and S11C) but similar to the POPC–POPC distribution (Figures 11B and S11B). PE/POPC distribution presents two shells, with the oxygen atoms of the phosphates pointing toward each other or away from each other. There is a preference for PE to self-associate and be independent of PLAPE concentration with additional varying structure with neighboring POPC. Overall, the RDFs for PLAPE and POPE are similar suggesting no variation due to the vinyl ether.
Figure 11.
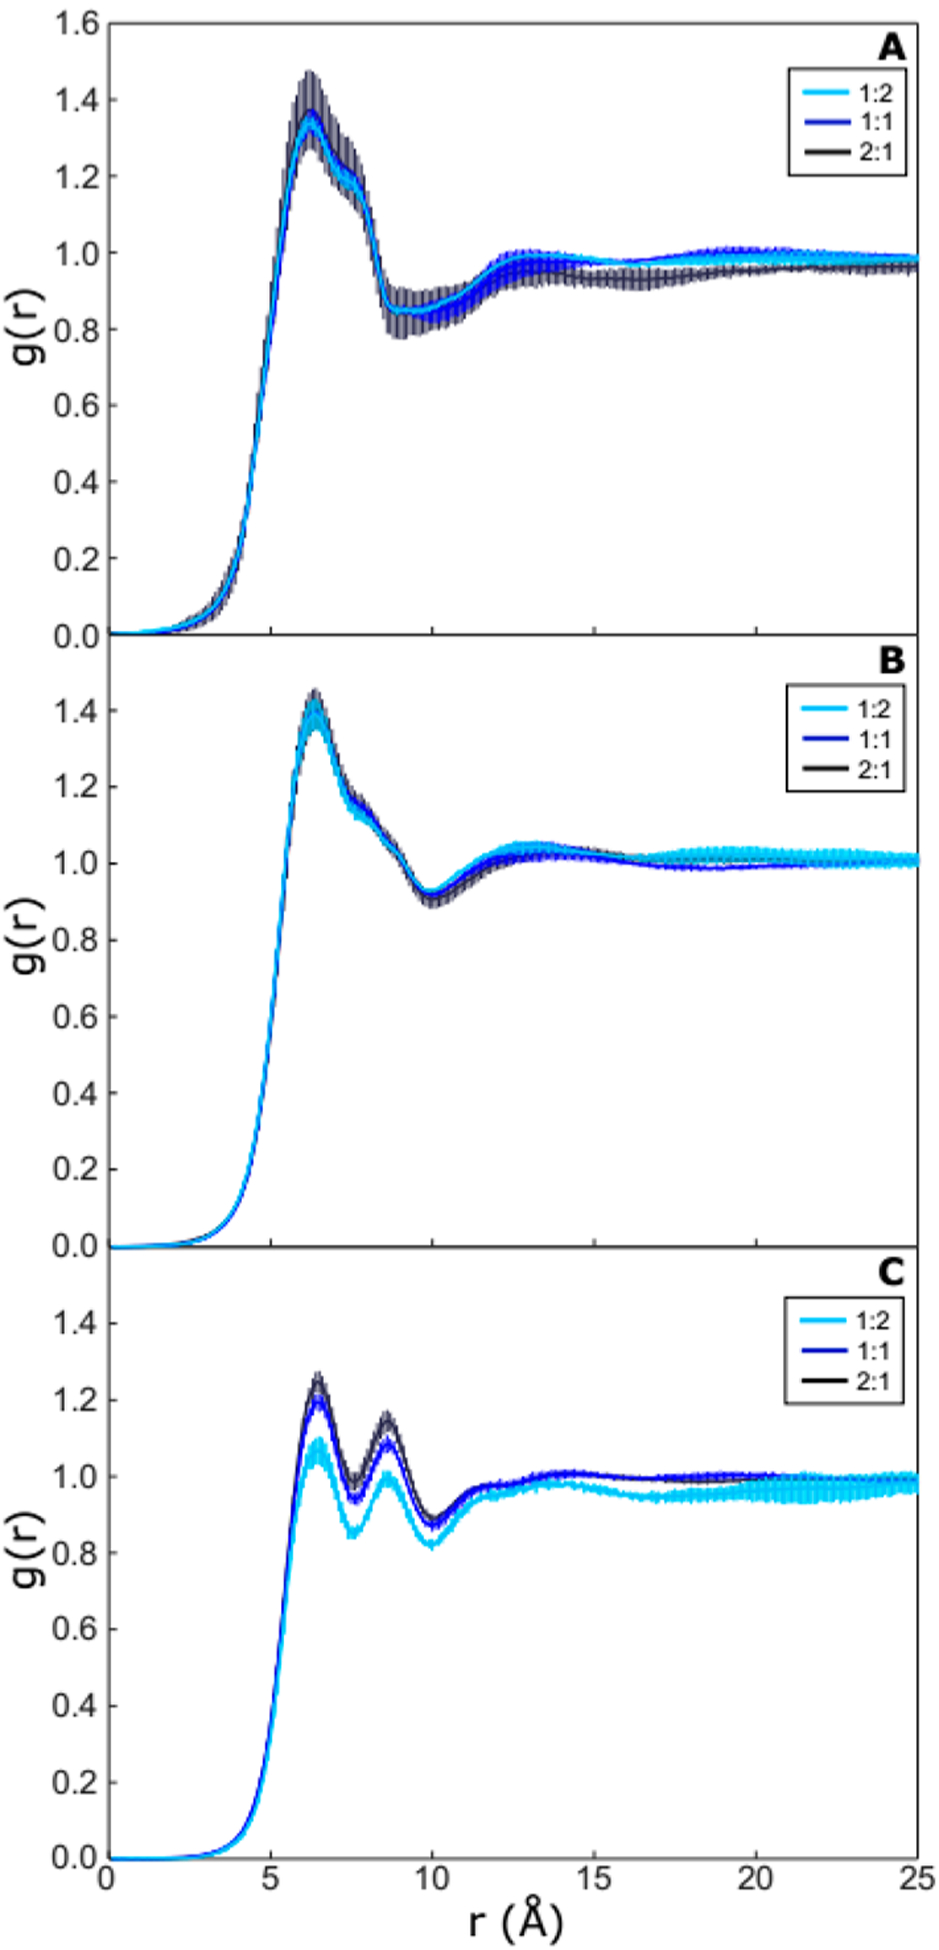
Comparison of two-dimensional radial distribution functions (RDFs) of PLAPE–PLAPE (A), PLAPE–POPC (B), and POPC–POPC (C) in POPC/PLAPE mixtures. The results are from simulations carried out at 310 K with POPC/PLAPE molar ratios listed in the legend.
Self-organization with PE lipids is commonly the result of hydrogen bond formation. The fraction of PE lipids that form hydrogen bonds varies only slightly between 0.75 and 0.80 (Table S2). The PC lipids can only act as acceptors, and 23–42% of the lipids form hydrogen bonds. Considering the weighted average of hydrogen bonds per all lipids, there is a general trend of increasing hydrogen bonds with an increase in PE lipids that ultimately results in the reduced SA/lip due to the increased lipid–lipid interaction. There is negligible difference in hydrogen bond formation between the POPE and PLAPE as this appears to be mainly lipid headgroup controlled and decoupled from the change near the hydrophilic/hydrophobic interface.
4. DISCUSSION AND CONCLUSIONS
Plasmalogen lipids are important for cellular function, and diminished plasmalogen levels in neurological membranes correlate with impairment of brain cells.17,19,26–28 In this study, the effect of variable plasmalogen lipid concentration on lipid bilayers was studied investigating three POPC/PLAPE mixtures at molar ratios of 1:2, 1:1, and 2:1. XDS and NMR experiments show that addition of PLAPE thickens the bilayer (Figure 2B, Figure 8, and Table 2), orders lipid hydrocarbon chains (Figures 9, 10, and Figure S10), and decreases lateral area per lipid (Figure 6 and Table S1). A monotonic decrease in SA/lipid and increase in bilayer thickness are detected with increasing PLAPE concentration. However, neurological membranes have complex lipid compositions.7 Related studies showed that cholesterol addition is capable of reducing the ethanolamine plasmalogen effect of decreasing SA/lipid.82 Therefore, the study of more complex plasmalogen-containing lipid mixtures that more closely resemble natural lipid membranes is needed.
There is a limited range of physiologically relevant biophysical experiments that can be conducted with plasmalogen lipids due to their very low stability against oxidation. We observed that after 24 h of sample preparation, the PLAPE lipid was fully oxidized even after taking precautions like preparing samples in an oxygen-free glovebox and adding antioxidants (Figure S3). Studies of protein binding to vesicles with neurologically relevant lipid composition, including high content of plasmalogens, are challenging to conduct within one hour after sample preparation when oxidation is likely to be low.83 Therefore, experimentally derived, atomistic force-field parameters are of great utility for elucidating the behavior of membranes containing plasmalogens.
Bilayer curvature and lipid composition are two cumulative factors controlling the binding of proteins capable of remodeling membranes.84 Plasmalogen lipids are enriched in regions of high membrane curvature,29 which in turn might increase the density of lipid-packing defects that promote binding of proteins that bend the bilayer.85–90 For example, binding of the Parkinson’s protein α-synuclein to bilayers that model neurological membranes causes significant global remodeling of the membrane (tubulation), a phenomenon that has implications for neurological disease progression.45,90,91 For α-synuclein protein-binding events, PLAPE is thought to modulate affinity of the protein for the bilayer due to its conical headgroup and postulated ability to introduce lipid packing defects.90 The area compressibility modulus, KA, determined in our simulations indicates the ability of PLAPE to stretch/compress laterally similar to POPC but to be less rigid than mixtures with POPE suggesting PLAPE might result in more lipid packing defects with its lower KA and higher SA/lip (Table S1). The excess area per lipid with bound α-synuclein compares the area of a curved membrane to a flat membrane and has emerged as a metric for the detected lateral expansion of lipid molecules during the initial stages of protein binding and remodeling.91 It would be informative to simulate the response of PLAPE-containing bilayers in the presence of bound protein, such as α-synuclein, which is now possible with the PLAPE force field.
Finally, the radial distribution functions in Figure 11 show that PLAPE in POPC self-associates without a dependence on concentration. For the interactions between PLAPE and POPC, the strength is less (lower first peak in Figure 11) than self-interaction but has a highly structured interaction with hydrogen bonding being important. Since neurological membranes have a highly complex lipid composition, including sterols and differing acyl-chains attached to the plasmalogens, future work is required to investigate the extent of demixing of plasmalogen lipids and how this may influence bilayer biophysical properties and biological function. The potential association of plasmalogens might also serve as a reservoir to protect important proteins, DNA, and RNA against oxidation and act as radical scavengers.5,9,10 Although there has been a keen focus on tocopherols92–94 in their protective ability toward oxidation, the concentration of plasmalogens is much higher in native membranes. Clearly further studies on this important lipid and its structure in membranes that represent occurrence in biology are important, and the results of this work lay the groundwork for future investigations.
Supplementary Material
ACKNOWLEDGMENTS
The research presented in this article from Dr. Klauda’s lab has been supported by the NSF grant MCB-1149187. Computational support for simulations performed in Dr. Klauda’s lab comes from the University of Maryland’s High Performance Computational Cluster Deepthought2 and time using the Extreme Science and Engineering Discovery Environment (XSEDE) allocations by grant number MCB-100139, which are supported by National Science Foundation grant number ACI-1053575. A.W. and J.N.S. gratefully acknowledge funding from the National Institutes of Health (R01 NS084998 to J.N.S.). W.E.T. and K.G. are supported by the Intramural Program of the National Institute on Alcohol Abuse and Alcoholism, National Institutes of Health. V.Z. and S.V. work was supported by a grant from the Swiss National Supercomputing Centre (CSCS) under project ID s726 and s842. V.Z. and S.V. also acknowledge support from the Swiss National Science Foundation (#PP00P3_163966). S.T.N. acknowledges support from the Winters Foundation.
Footnotes
The authors declare no competing financial interest.
Complete contact information is available at: https://pubs.acs.org/10.1021/acs.jpcb.9b08850
Supporting Information
The Supporting Information is available free of charge at https://pubs.acs.org/doi/10.1021/acs.jpcb.9b08850.
EDPs of lipid components for POPC/POPE bilayers, order parameters, NMR DePaked spectra, partial charges for vinyl ethers from QM, SA/lip table, SA/lip vs time, X-ray form factors, RDFs, and hydrogen bond populations (PDF)
Contributor Information
Ana West, Department of Chemistry, University of Georgia, Athens, Georgia 30602, United States.
Valeria Zoni, Department of Biology, University of Fribourg, Fribourg 1700, Switzerland.
Walter E. Teague, Jr, Laboratory of Membrane Biochemistry and Biophysics, National Institute on Alcohol Abuse and Alcoholism, NIH, Bethesda, Maryland 20892, United States.
Alison N. Leonard, Biophysics Graduate Program, University of Maryland, College Park, Maryland 20742, United States
Stefano Vanni, Department of Biology, University of Fribourg, Fribourg 1700, Switzerland.
Klaus Gawrisch, Laboratory of Membrane Biochemistry and Biophysics, National Institute on Alcohol Abuse and Alcoholism, NIH, Bethesda, Maryland 20892, United States.
Stephanie Tristram-Nagle, Biological Physics Group, Physics Department, Carnegie Mellon University, Pittsburgh, Pennsylvania 15213, United States.
Jonathan N. Sachs, Department of Biomedical Engineering, University of Minnesota, Twin Cities, Minnesota 55455, United States
Jeffery B. Klauda, Biophysics Graduate Program and Department of Chemical and Biomolecular Engineering, University of Maryland, College Park, Maryland 20742, United States.
REFERENCES
- (1).Braverman NE; Moser AB Functions of plasmalogen lipids in health and disease. Biochim. Biophys. Acta, Mol. Basis Dis 2012, 1822 (9), 1442–52. [DOI] [PubMed] [Google Scholar]
- (2).Dorninger F; Brodde A; Braverman NE; Moser AB; Just WW; Forss-Petter S; Brugger B; Berger J Homeostasis of phospholipids - the level of phosphatidylethanolamine tightly adapts to changes in ethanolamine plasmalogens. Biochim. Biophys. Acta, Mol. Cell Biol. Lipids 2015, 1851 (2), 117–28. [DOI] [PMC free article] [PubMed] [Google Scholar]
- (3).Dean JM; Lodhi IJ Structural and functional roles of ether lipids. Protein Cell 2018, 9 (2), 196–206. [DOI] [PMC free article] [PubMed] [Google Scholar]
- (4).Farooqui AA; Horrocks LA Book review: Plasmalogens: Workhorse lipids of membranes in normal and injured neurons and glia. Neuroscientist 2001, 7 (3), 232–245. [DOI] [PubMed] [Google Scholar]
- (5).Lessig J; Fuchs B Plasmalogens in biological systems: Their role in oxidative processes in biological membranes, their contribution to pathological processes and aging and plasmalogen analysis. Curr. Med. Chem 2009, 16 (16), 2021–41. [DOI] [PubMed] [Google Scholar]
- (6).Saab S; Mazzocco J; Creuzot-Garcher CP; Bron AM; Bretillon L; Acar N Plasmalogens in the retina: From occurrence in retinal cell membranes to potential involvement in pathophysiology of retinal diseases. Biochimie 2014, 107 (Pt A), 58–65. [DOI] [PubMed] [Google Scholar]
- (7).Macala LJ; Yu RK; Ando S Analysis of brain lipids by high performance thin-layer chromatography and densitometry. J. Lipid Res 1983, 24 (9), 1243–50. [PubMed] [Google Scholar]
- (8).Takamori S; Holt M; Stenius K; Lemke EA; Grønborg M; Riedel D; Urlaub H; Schenck S; Brügger B; Ringler P; et al. Molecular anatomy of a trafficking organelle. Cell 2006, 127 (4), 831–846. [DOI] [PubMed] [Google Scholar]
- (9).Wallner S; Schmitz G Plasmalogens the neglected regulatory and scavenging lipid species. Chem. Phys. Lipids 2011, 164 (6), 573–589. [DOI] [PubMed] [Google Scholar]
- (10).Jenkins CM; Yang K; Liu G; Moon SH; Dilthey BG; Gross RW Cytochrome c is an oxidative stress-activated plasmalogenase that cleaves plasmenylcholine and plasmenylethanolamine at the sn-1 vinyl ether linkage. J. Biol. Chem 2018, 293 (22), 8693–8709. [DOI] [PMC free article] [PubMed] [Google Scholar]
- (11).Pike LJ; Han X; Chung KN; Gross RW Lipid rafts are enriched in arachidonic acid and plasmenylethanolamine and their composition is independent of caveolin-1 expression: A quantitative electrospray ionization/mass spectrometric analysis. Biochemistry 2002, 41 (6), 2075–88. [DOI] [PubMed] [Google Scholar]
- (12).Sebastião AM; Colino-Oliveira M; Assaife-Lopes N; Dias RB; Ribeiro JA Lipid rafts, synaptic transmission and plasticity: Impact in age-related neurodegenerative diseases. Neuropharmacology 2013, 64, 97–107. [DOI] [PubMed] [Google Scholar]
- (13).Honsho M; Abe Y; Fujiki Y Dysregulation of plasmalogen homeostasis impairs cholesterol biosynthesis. J. Biol. Chem 2015, 290 (48), 28822–28833. [DOI] [PMC free article] [PubMed] [Google Scholar]
- (14).Munn NJ; Arnio E; Liu D; Zoeller RA; Liscum L Deficiency in ethanolamine plasmalogen leads to altered cholesterol transport. J. Lipid Res 2003, 44 (1), 182–92. [DOI] [PubMed] [Google Scholar]
- (15).Hossain MS; Ifuku M; Take S; Kawamura J; Miake K; Katafuchi T Plasmalogens rescue neuronal cell death through an activation of akt and erk survival signaling. PLoS One 2013, 8 (12), No. e83508. [DOI] [PMC free article] [PubMed] [Google Scholar]
- (16).Dorninger F; Forss-Petter S; Berger J From peroxisomal disorders to common neurodegenerative diseases - the role of ether phospholipids in the nervous system. FEBS Lett. 2017, 591 (18), 2761–2788. [DOI] [PMC free article] [PubMed] [Google Scholar]
- (17).Guan Z; Wang Y; Cairns NJ; Lantos PL; Dallner G; Sindelar PJ Decrease and structural modifications of phosphatidylethanolamine plasmalogen in the brain with alzheimer disease. J. Neuropathol. Exp. Neurol 1999, 58 (7), 740–7. [DOI] [PubMed] [Google Scholar]
- (18).Han X Lipid alterations in the earliest clinically recognizable stage of alzheimer’s disease: Implication of the role of lipids in the pathogenesis of alzheimer’s disease. Curr. Alzheimer Res 2005, 2 (1), 65–77. [DOI] [PubMed] [Google Scholar]
- (19).Han X Multi-dimensional mass spectrometry-based shotgun lipidomics and the altered lipids at the mild cognitive impairment stage of alzheimer’s disease. Biochim. Biophys. Acta, Mol. Cell Biol. Lipids 2010, 1801 (8), 774–83. [DOI] [PMC free article] [PubMed] [Google Scholar]
- (20).Han X; Holtzman DM; McKeel DW Plasmalogen deficiency in early alzheimer’s disease subjects and in animal models: Molecular characterization using electrospray ionization mass spectrometry. J. Neurochem 2001, 77 (4), 1168–1180. [DOI] [PubMed] [Google Scholar]
- (21).Farooqui AA; Rapoport SI; Horrocks LA Membrane phospholipid alterations in alzheimer’s disease: Deficiency of ethanolamine plasmalogens. Neurochem. Res 1997, 22 (4), 523–7. [DOI] [PubMed] [Google Scholar]
- (22).Goodenowe DB; Cook LL; Liu J; Lu Y; Jayasinghe DA; Ahiahonu PW; Heath D; Yamazaki Y; Flax J; Krenitsky KF; et al. Peripheral ethanolamine plasmalogen deficiency: A logical causative factor in alzheimer’s disease and dementia. J. Lipid Res 2007, 48 (11), 2485–98. [DOI] [PubMed] [Google Scholar]
- (23).Miville-Godbout E; Bourque M; Morissette M; Al-Sweidi S; Smith T; Mochizuki A; Senanayake V; Jayasinghe D; Wang L; Goodenowe D; et al. Plasmalogen augmentation reverses striatal dopamine loss in mptp mice. PLoS One 2016, 11 (3), No. e0151020. [DOI] [PMC free article] [PubMed] [Google Scholar]
- (24).Fabelo N; Martin V; Santpere G; Marin R; Torrent L; Ferrer I; Diaz M Severe alterations in lipid composition of frontal cortex lipid rafts from parkinson’s disease and incidental parkinson’s disease. Mol. Med 2011, 17 (9–10), 1107–18. [DOI] [PMC free article] [PubMed] [Google Scholar]
- (25).Xicoy H; Wieringa B; Martens GJM The role of lipids in parkinson’s disease. Cells 2019, 8 (1), 27. [DOI] [PMC free article] [PubMed] [Google Scholar]
- (26).Davletov B; Montecucco C Lipid function at synapses. Curr. Opin. Neurobiol 2010, 20 (5), 543–549. [DOI] [PubMed] [Google Scholar]
- (27).Brodde A; Teigler A; Brugger B; Lehmann WD; Wieland F; Berger J; Just WW Impaired neurotransmission in ether lipid-deficient nerve terminals. Hum. Mol. Genet 2012, 21 (12), 2713–24. [DOI] [PMC free article] [PubMed] [Google Scholar]
- (28).Lauwers E; Goodchild R; Verstreken P Membrane lipids in presynaptic function and disease. Neuron 2016, 90 (1), 11–25. [DOI] [PubMed] [Google Scholar]
- (29).Glaser PE; Gross RW Plasmenylethanolamine facilitates rapid membrane fusion: A stopped-flow kinetic investigation correlating the propensity of a major plasma membrane constituent to adopt an hii phase with its ability to promote membrane fusion. Biochemistry 1994, 33 (19), 5805–5812. [DOI] [PubMed] [Google Scholar]
- (30).Thai TP; Rodemer C; Jauch A; Hunziker A; Moser A; Gorgas K; Just WW Impaired membrane traffic in defective ether lipid biosynthesis. Hum. Mol. Genet 2001, 10 (2), 127–36. [DOI] [PubMed] [Google Scholar]
- (31).van Meer G; Voelker DR; Feigenson GW Membrane lipids: Where they are and how they behave. Nat. Rev. Mol. Cell Biol 2008, 9, 112. [DOI] [PMC free article] [PubMed] [Google Scholar]
- (32).Koivuniemi A The biophysical properties of plasmalogens originating from their unique molecular architecture. FEBS Lett. 2017, 591 (18), 2700–2713. [DOI] [PubMed] [Google Scholar]
- (33).Lohner K; Balgavy P; Hermetter A; Paltauf F; Laggner P Stabilization of non-bilayer structures by the etherlipid ethanolamine plasmalogen. Biochim. Biophys. Acta, Biomembr 1991, 1061 (2), 132–40. [DOI] [PubMed] [Google Scholar]
- (34).Rog T; Koivuniemi A The biophysical properties of ethanolamine plasmalogens revealed by atomistic molecular dynamics simulations. Biochim. Biophys. Acta, Biomembr 2016, 1858 (1), 97–103. [DOI] [PMC free article] [PubMed] [Google Scholar]
- (35).Kaufman AE; Goldfine H; Narayan O; Gruner SM Physical studies on the membranes and lipids of plasmalogen-deficient megasphaera elsdenii. Chem. Phys. Lipids 1990, 55 (1), 41–48. [DOI] [PubMed] [Google Scholar]
- (36).Han XL; Gross RW Alterations in membrane dynamics elicited by amphiphilic compounds are augmented in plasmenylcholine bilayers. Biochim. Biophys. Acta, Biomembr 1991, 1069 (1), 37–45. [DOI] [PubMed] [Google Scholar]
- (37).Malthaner M; Seelig J; Johnston NC; Goldfine H Deuterium nuclear magnetic resonance studies on the plasmalogens and the glycerol acetals of plasmalogens of clostridium butyricum and clostridium beijerinckii. Biochemistry 1987, 26 (18), 5826–33. [DOI] [PubMed] [Google Scholar]
- (38).Pak JH; Bork VP; Norberg RE; Creer MH; Wolf RA; Gross RW Disparate molecular dynamics of plasmenylcholine and phosphatidylcholine bilayers. Biochemistry 1987, 26 (15), 4824–30. [DOI] [PubMed] [Google Scholar]
- (39).Lohner K Is the high propensity of ethanolamine plasmalogens to form non-lamellar lipid structures manifested in the properties of biomembranes? Chem. Phys. Lipids 1996, 81 (2), 167–184. [DOI] [PubMed] [Google Scholar]
- (40).Thomas SE; Byers DM; Palmer FB; Spence MW; Cook HW Incorporation of polyunsaturated fatty acids into plasmalogens, compared to other phospholipids of cultured glioma cells, is more dependent on chain length than on selectivity between (n - 3) and (n - 6) families. Biochim. Biophys. Acta, Lipids Lipid Metab 1990, 1044 (3), 349–56. [DOI] [PubMed] [Google Scholar]
- (41).Bazinet RP; Layé, S. Polyunsaturated fatty acids and their metabolites in brain function and disease. Nat. Rev. Neurosci 2014, 15 (12), 771–785. [DOI] [PubMed] [Google Scholar]
- (42).Davletov B; Connell E; Darios F Regulation of snare fusion machinery by fatty acids. Cell. Mol. Life Sci 2007, 64 (13), 1597–608. [DOI] [PMC free article] [PubMed] [Google Scholar]
- (43).Pinot M; Vanni S; Pagnotta S; Lacas-Gervais S; Payet L-A; Ferreira T; Gautier R; Goud B; Antonny B; Barelli H Polyunsaturated phospholipids facilitate membrane deformation and fission by endocytic proteins. Science 2014, 345 (6197), 693–697. [DOI] [PubMed] [Google Scholar]
- (44).Brummel BE; Braun AR; Sachs JN Polyunsaturated chains in asymmetric lipids disorder raft mixtures and preferentially associate with α-synuclein. Biochim. Biophys. Acta, Biomembr 2017, 1859 (4), 529–536. [DOI] [PMC free article] [PubMed] [Google Scholar]
- (45).West A; Brummel BE; Braun AR; Rhoades E; Sachs JN Membrane remodeling and mechanics: Experiments and simulations of α-synuclein. Biochim. Biophys. Acta, Biomembr 2016, 1858 (7 Pt B), 1594–1609. [DOI] [PMC free article] [PubMed] [Google Scholar]
- (46).Marrink SJ; Risselada HJ; Yefimov S; Tieleman DP; de Vries AH The martini force field: Coarse grained model for biomolecular simulations. J. Phys. Chem. B 2007, 111 (27), 7812–24. [DOI] [PubMed] [Google Scholar]
- (47).Shinoda W; DeVane R; Klein ML Multi-property fitting and parameterization of a coarse grained model for aqueous surfactants. Mol. Simul 2007, 33 (1–2), 27–36. [Google Scholar]
- (48).Nagan N; Zoeller RA Plasmalogens: Biosynthesis and functions. Prog. Lipid Res 2001, 40 (3), 199–229. [DOI] [PubMed] [Google Scholar]
- (49).Tristram-Nagle SA Preparation of oriented, fully hydrated lipid samples for structure determination using x-ray scattering. Methods Mol. Biol 2007, 400, 63–75. [DOI] [PMC free article] [PubMed] [Google Scholar]
- (50).Kučerka N; Liu YF; Chu NJ; Petrache HI; Tristram-Nagle ST; Nagle JF Structure of fully hydrated fluid phase dmpc and dlpc lipid bilayers using x-ray scattering from oriented multilamellar arrays and from unilamellar vesicles. Biophys. J 2005, 88 (4), 2626–2637. [DOI] [PMC free article] [PubMed] [Google Scholar]
- (51).Liu Y; Nagle JF Diffuse scattering provides material parameters and electron density profiles of biomembranes. Phys. Rev. E Stat. Nonlin. Soft Matter Phys 2004, 69 (4 Pt 1), 040901. [DOI] [PMC free article] [PubMed] [Google Scholar]
- (52).Lyatskaya Y; Liu Y; Tristram-Nagle S; Katsaras J; Nagle JF Method for obtaining structure and interactions from oriented lipid bilayers. Phys. Rev. E: Stat. Phys., Plasmas, Fluids, Relat. Interdiscip. Top 2000, 63 (1 Pt 1), 011907. [DOI] [PMC free article] [PubMed] [Google Scholar]
- (53).Dupuy FG; Pagano I; Andenoro K; Peralta MF; Elhady Y; Heinrich F; Tristram-Nagle S Selective interaction of colistin with lipid model membranes. Biophys. J 2018, 114 (4), 919–928. [DOI] [PMC free article] [PubMed] [Google Scholar]
- (54).Davis JH; Jeffrey KR; Bloom M; Valic MI; Higgs TP Quadrupolar echo deuteron magnetic resonance spectroscopy in ordered hydrocarbon chains. Chem. Phys. Lett 1976, 42 (2), 390–394. [Google Scholar]
- (55).McCabe MA; Wassall SR Fast-fourier-transform depaking. J. Magn. Reson., Ser. B 1995, 106 (1), 80–82. [Google Scholar]
- (56).Lafleur M; Fine B; Sternin E; Cullis PR; Bloom M Smoothed orientational order profile of lipid bilayers by 2h-nuclear magnetic resonance. Biophys. J 1989, 56 (5), 1037–1041. [DOI] [PMC free article] [PubMed] [Google Scholar]
- (57).Valiev M; Bylaska EJ; Govind N; Kowalski K; Straatsma TP; Van Dam HJJ; Wang D; Niepolcha J; Arpa E; Windus TL; et al. Nwchem: A comprehensive and scalable open-source solution for large scale molecular simulations. Comput. Phys. Commun 2010, 181, 1477–1493. [Google Scholar]
- (58).Breneman CM; Wiberg KB Determining atom-centered monopoles from molecular electrostatic potentials. The need for high sampling density in formamide conformational analysis. J. Comput. Chem 1990, 11 (3), 361–373. [Google Scholar]
- (59).Klauda JB; Garrison SL; Jiang J; Arora G; Sandler SI Hm-ie: Quantum chemical hybrid methods for calculating interaction energies. J. Phys. Chem. A 2004, 108, 107–112. [Google Scholar]
- (60).Jo S; Kim T; Im W Automated builder and database of protein/membrane complexes for molecular dynamics simulations. PLoS One 2007, 2, No. e880. [DOI] [PMC free article] [PubMed] [Google Scholar]
- (61).Jo S; Kim T; Iyer VG; Im W Charmm-gui: A web-based graphical user interface for charmm. J. Comput. Chem 2008, 29, 1859–1865. [DOI] [PubMed] [Google Scholar]
- (62).Jo S; Lim JB; Klauda JB; Im W Charmm-gui membrane builder for mixed bilayers and its application to yeast membranes. Biophys. J 2009, 97, 50–58. [DOI] [PMC free article] [PubMed] [Google Scholar]
- (63).Wu EL; Cheng X; Jo S; Rui H; Song KC; Davilá-Contreras EM; Qi Y; Lee J; Monje-Galvan V; Venable RM; et al. Charmm-gui membrane builder toward realistic biological membrane simulations. J. Comput. Chem 2014, 35, 1997–2004. [DOI] [PMC free article] [PubMed] [Google Scholar]
- (64).Klauda JB; Venable RM; Freites JA; O’Connor JW; Mondragon-Ramirez C; Vorobyov I; Tobias DJ; MacKerell AD; Pastor RW Update of the charmm all-atom additive force field for lipids: Validation on six lipid types. J. Phys. Chem. B 2010, 114 (23), 7830–7843. [DOI] [PMC free article] [PubMed] [Google Scholar]
- (65).Phillips JC; Braun R; Wang W; Gumbart J; Tajkhorshid E; Villa E; Chipot C; Skeel RD; Kalé L; Schulten K Scalable molecular dynamics with namd. J. Comput. Chem 2005, 26, 1781–802. [DOI] [PMC free article] [PubMed] [Google Scholar]
- (66).Feller SE; Zhang Y; Pastor RW; Brooks BR Constant pressure molecular dynamics simulation: The langevin piston method. J. Chem. Phys 1995, 103, 4613–4621. [Google Scholar]
- (67).Martyna GJ; Tobias DJ; Klein ML Constant pressure molecular dynamics algorithms. J. Chem. Phys 1994, 101, 4177–4189. [Google Scholar]
- (68).Darden T; York D; Pedersen L Particle mesh ewald: An n log (n) method for ewald sums in large systems. J. Chem. Phys 1993, 98, 10089–10092. [Google Scholar]
- (69).Steinbach PJ; Brooks BR New spherical-cutoff methods for long-range forces in macromolecular simulation. J. Comput. Chem 1994, 15, 667–683. [Google Scholar]
- (70).Brooks BR; Brooks CL; Mackerell AD; Nilsson L; Petrella RJ; Roux B; Won Y; Archontis G; Bartels C; Boresch S; et al. Charmm: The biomolecular simulation program. J. Comput. Chem 2009, 30, 1545–614. [DOI] [PMC free article] [PubMed] [Google Scholar]
- (71).Brooks BR; Bruccoleri RE; Olafson BD; States DJ; Swaminathan S; Karplus M Charmm: A program for macromolecular energy, minimization, and dynamics calculations. J. Comput. Chem 1983, 4, 187–217. [Google Scholar]
- (72).Chodera JD A simple method for automated equilibration detection in molecular simulations. J. Chem. Theory Comput 2016, 12 (4), 1799–1805. [DOI] [PMC free article] [PubMed] [Google Scholar]
- (73).Shirts MR; Chodera JD Statistically optimal analysis of samples from multiple equilibrium states. J. Chem. Phys 2008, 129 (12), 124105. [DOI] [PMC free article] [PubMed] [Google Scholar]
- (74).Venable RM; Brown FLH; Pastor RW Mechanical properties of lipid bilayers from molecular dynamics simulation. Chem. Phys. Lipids 2015, 192, 60–74. [DOI] [PMC free article] [PubMed] [Google Scholar]
- (75).Kučerka N; Katsaras J; Nagle JF Comparing membrane simulations to scattering experiments: Introducing the simtoexp software. J. Membr. Biol 2010, 235, 43–50. [DOI] [PMC free article] [PubMed] [Google Scholar]
- (76).Kučerka N; Nagle JF; Sachs JN; Feller SE; Pencer J; Jackson A; Katsaras J Lipid bilayer structure determined by the simultaneous analysis of neutron and x-ray scattering data. Biophys. J 2008, 95 (5), 2356–2367. [DOI] [PMC free article] [PubMed] [Google Scholar]
- (77).Klauda JB; Venable RM; Freites JA; O’Connor JW; Tobias DJ; Mondragon-Ramirez C; Vorobyov I; MacKerell AD Jr.; Pastor RW Update of the charmm all-atom additive force field for lipids: Validation on six lipid types. J. Phys. Chem. B 2010, 114 (23), 7830–43. [DOI] [PMC free article] [PubMed] [Google Scholar]
- (78).Leonard AN; Pastor RW; Klauda JB Parameterization of the charmm all-atom force field for ether lipids and model linear ethers. J. Phys. Chem. B 2018, 122 (26), 6744–6754. [DOI] [PMC free article] [PubMed] [Google Scholar]
- (79).Zhuang X; Makover J; Im W; Klauda JB A systematic molecular dynamics simulation study of temperature dependent bilayer structural properties. Biochim. Biophys. Acta, Biomembr 2014, 1838 (10), 2520–2529. [DOI] [PubMed] [Google Scholar]
- (80).Venable RM; Brown FLH; Pastor RW Mechanical properties of lipid bilayers from molecular dynamics simulation. Chem. Phys. Lipids 2015, 192, 60–74. [DOI] [PMC free article] [PubMed] [Google Scholar]
- (81).Feller SE; Venable RM; Pastor RW Computer simulation of a dppc phospholipid bilayer: Structural changes as a function of molecular surface area. Langmuir 1997, 13 (24), 6555–6561. [Google Scholar]
- (82).Smaby JM; Hermetter A; Schmid PC; Paltauf F; Brockman HL Packing of ether and ester phospholipids in monolayers. Evidence for hydrogen-bonded water at the sn-1 acyl group of phosphatidylcholines. Biochemistry 1983, 22 (25), 5808–5813. [Google Scholar]
- (83).Rhoades E; Ramlall TF; Webb WW; Eliezer D Quantification of α-synuclein binding to lipid vesicles using fluorescence correlation spectroscopy. Biophys. J 2006, 90 (12), 4692–4700. [DOI] [PMC free article] [PubMed] [Google Scholar]
- (84).Vanni S; Hirose H; Barelli H; Antonny B; Gautier R A sub-nanometre view of how membrane curvature and composition modulate lipid packing and protein recruitment. Nat. Commun 2014, 5, 4916. [DOI] [PubMed] [Google Scholar]
- (85).Bigay J; Antonny B Curvature, lipid packing, and electrostatics of membrane organelles: Defining cellular territories in determining specificity. Dev. Cell 2012, 23 (5), 886–95. [DOI] [PubMed] [Google Scholar]
- (86).Drin G; Casella JF; Gautier R; Boehmer T; Schwartz TU; Antonny B A general amphipathic alpha-helical motif for sensing membrane curvature. Nat. Struct. Mol. Biol 2007, 14 (2), 138–46. [DOI] [PubMed] [Google Scholar]
- (87).Hatzakis NS; Bhatia VK; Larsen J; Madsen KL; Bolinger PY; Kunding AH; Castillo J; Gether U; Hedegard P; Stamou D How curved membranes recruit amphipathic helices and protein anchoring motifs. Nat. Chem. Biol 2009, 5 (11), 835–41. [DOI] [PubMed] [Google Scholar]
- (88).Bhatia VK; Hatzakis NS; Stamou D A unifying mechanism accounts for sensing of membrane curvature by bar domains, amphipathic helices and membrane-anchored proteins. Semin. Cell Dev. Biol 2010, 21 (4), 381–390. [DOI] [PubMed] [Google Scholar]
- (89).Vamparys L; Gautier R; Vanni S; Bennett WFD; Tieleman DP; Antonny B; Etchebest C; Fuchs PFJ Conical lipids in flat bilayers induce packing defects similar to that induced by positive curvature. Biophys. J 2013, 104 (3), 585–593. [DOI] [PMC free article] [PubMed] [Google Scholar]
- (90).Ouberai MM; Wang J; Swann MJ; Galvagnion C; Guilliams T; Dobson CM; Welland ME Α-synuclein senses lipid packing defects and induces lateral expansion of lipids leading to membrane remodeling. J. Biol. Chem 2013, 288 (29), 20883–20895. [DOI] [PMC free article] [PubMed] [Google Scholar]
- (91).Braun AR; Lacy MM; Ducas VC; Rhoades E; Sachs JN Alpha-synuclein-induced membrane remodeling is driven by binding affinity, partition depth, and interleaflet order asymmetry. J. Am. Chem. Soc 2014, 136 (28), 9962–72. [DOI] [PMC free article] [PubMed] [Google Scholar]
- (92).Marquardt D; Kucerka N; Katsaras J; Harroun TA Alpha-tocopherol’s location in membranes is not affected by their composition. Langmuir 2015, 31 (15), 4464–72. [DOI] [PubMed] [Google Scholar]
- (93).Pisoschi AM; Pop A The role of antioxidants in the chemistry of oxidative stress: A review. Eur. J. Med. Chem 2015, 97, 55–74. [DOI] [PubMed] [Google Scholar]
- (94).Laguerre M; Lecomte J; Villeneuve P Evaluation of the ability of antioxidants to counteract lipid oxidation: Existing methods, new trends and challenges. Prog. Lipid Res 2007, 46 (5), 244–282. [DOI] [PubMed] [Google Scholar]
Associated Data
This section collects any data citations, data availability statements, or supplementary materials included in this article.


