

Summary
Circadian rhythms control organismal physiology throughout the day. At the cellular level, clock regulation is established by a self-sustained Bmal1-dependent transcriptional oscillator network. However, it is still unclear how different tissues achieve a synchronized rhythmic physiology. That is, do they respond independently to environmental signals, or require interactions with each other to do so? We show that unexpectedly, light synchronizes the Bmal1-dependent circadian machinery in single tissues in the absence of Bmal1 in all other tissues. Strikingly, light-driven tissue autonomous clocks occur without rhythmic feeding behavior and are lost in constant darkness. Importantly, tissue-autonomous Bmal1 partially sustains homeostasis in otherwise arrhythmic and prematurely aging animals. Our results therefore support a two-branched model for the daily synchronization of tissues: an autonomous response branch, whereby light entrains circadian clocks without any commitment of other Bmal1-dependent clocks, and a memory branch using other Bmal1-dependent clocks to “remember” time in the absence of external cues.
Introduction
In mammalian cells, the transcription factors BMAL1 (ARNTL) and CLOCK drive the expression of several negative and positive feedback loops to establish a nearly 24-h autonomous molecular oscillator (Partch et al., 2014). The activity of this core clock provides functional cellular rhythms by imposing transcriptional oscillations in approximately 5%–20% of lineage-specific genes (Sato et al., 2017; Solanas et al., 2017; Takahashi, 2017). In turn, circadian synchronization of individual cells allows tissues to temporally regulate their physiology according to the time of day (Saini et al., 2011). Changes in environmental signals, such as the presence of light, are processed in the hypothalamic suprachiasmatic nucleus (SCN) and are transmitted to temporally synchronize clocks in peripheral tissues, potentially through neural and humoral cues (Dibner et al., 2010). Furthermore, the circadian clockwork in the SCN regulates organismal activity by controlling the sleep-wake cycle, which in turn imposes a cyclic feeding-fasting behavior and its consequent metabolic cycles (Bechtold and Loudon, 2013), all of which affect the rhythms of peripheral clocks (Damiola et al., 2000). How all these mechanisms are integrated into maintaining all tissues synchronized for the establishment of overall organismal circadian rhythms, and whether peripheral tissues require BMAL1-driven rhythmic signals from other tissues to remain synchronized, is currently unknown. Understanding the mechanism of clock synchronization is a highly relevant issue, as modifications of clock function shorten the lifespan of mammals, cause aging-related pathologies, predispose to metabolic and neurological diseases, and increase the risk to develop certain types of tumors (Geyfman et al., 2012; Janich et al., 2014; Kondratov et al., 2006; Masri et al., 2016; Puram et al., 2016).
Results
To study the extent to which peripheral tissues require other tissue-based clocks to remain synchronized, we generated a mouse model (Bmal1-stopFL mouse) that expresses Bmal1 from the endogenous locus exclusively in Cre recombinase-expressing cells in an otherwise fully Bmal1-deficient organism (Figures 1A and S1A). Bmal1-stopFL mice did not express BMAL1 in any tissue (Figure S1B) and showed all the phenotypes previously reported in conventional full-body Bmal1 knockout mice (Kondratov et al., 2006), including reduced ability to gain weight, reduced lifespan, progressive arthropathy, and corneal degeneration (Figures S1C–S1F). Crossing Bmal1-stopFL mice with mice expressing Cre recombinase under the regulation of the Keratin 14 (K14) promoter (hereafter termed reconstituted [RE] mice) allows the expression of endogenous BMAL1 in the epidermis (Figures S1G and S1H). Of note, Cre recombinase is expressed in the epidermis of K14-Cre mice around embryonic day E13.5–E14.5 (Vasioukhin et al., 1999). The specificity of the Cre-mediated expression of BMAL1 was also confirmed in offspring from crosses of Bmal1-stopFL mice with Alfp-Cre mice (Kellendonk et al., 2000), which have hepatocyte-restricted Cre expression (liver-RE mice) (Figure S1G).
Figure 1.

Light Can Entrain Peripheral Clocks Independently from Each Other
(A) The Bmal1-stopFL/K14-Cre mouse model allows Bmal1 to be expressed exclusively in K14+ cells (RE); heterozygous K14-Cre (WT) and homozygous Bmal1-stopFL KO mice were used as controls.
(B) Schematic of experimental setup to obtain circadian transcriptome of the epidermis; interfollicular epidermis was isolated at six time points around the clock in 8-week-old WT, RE, and KO females and submitted to RNA sequencing to establish thecircadian transcriptome, which was determined by using JTK_CYCLE algorithm.
(C) Core clock genes in epidermis from WT, RE, or KO mice kept under L/D entrainment (n = 3 or 4 mice per time point and genotype); adjusted p value for RE epidermis according to JTK_CYCLE is shown; expression value for each individual sample is shown.
(D and E) Phase (D) and amplitude (E) of core clock genes in WT and RE epidermis.
(F) Immunoblot of BMAL1, phosphorylated BMAL1 (p-BMAL1), and acetylated BMAL1 (ac-BMAL1) in WT or RE epidermis; ACTIN was used as loading control.
(G) Core clock genes in liver tissue from WT, liver-RE (Bmal1 expression exclusively in Alfp-Cre-expressing cells), or KO mice kept under L/D entrainment (n = 3 or 4 mice per time point and genotype); data are represented as mean ± SD.
See also Table S3.
We next obtained the circadian transcriptome of the epidermis from RE mice (with Bmal1 expression in the epidermis), K14-Cre wild-type (WT) control mice, and complete Bmal1-deficient Bmal1-stopFL (knockout [KO]) mice under standard 12 h light/12 h dark (L/D) entrainment conditions. All genes that oscillated in a circadian manner were identified from epidermal tissue that had been isolated over a 24-h period at six time points (with 4 h intervals) using the JTK_CYCLE algorithm (Figure 1B). Unexpectedly, the core circadian transcriptional machinery oscillated in epidermis even in the absence of BMAL1 in any other tissue (Figure 1C). Notably, the phase of oscillation (i.e., time of the day when the expression of each gene reaches its zenith) was preserved (Figures 1C and 1D), while the oscillatory amplitudes were slightly reduced (Figures 1C and 1E). This oscillation was not confined to transcription, as BMAL1 also oscillated at the protein level in RE mice (Figure 1F) with a similar reduction in amplitude as seen at the transcriptional level. In addition, post-translational modifications of BMAL1 that are known to regulate BMAL1 activity (phosphorylation at serine residue 42; Dang et al., 2016; and acetylation at lysine residue 538; Hirayama et al., 2007) were rhythmic in the epidermis of both WT and RE mice (Figure 1F). Transcriptional oscillation of the core clock machinery also occurred in the liver of liver-RE mice kept under standard L/D conditions, albeit with a 4-h phase advance (Figure 1G) (Koronowski et al., 2019). Therefore, these results indicate the existence of a general mechanism that allows synchronization of circadian clocks in peripheral tissues independent of circadian clocks in any other tissue.
Circadian rhythms regulate tissue homeostasis (Janich et al., 2014), which, in the epidermis, includes dictating the timing of the cell cycle and cell differentiation, responses to UV radiation and oxidative damage, and the timing of specific metabolisms of epidermal stem cells and their differentiated counterparts (Geyfman et al., 2012; Janich et al., 2011, 2013; Solanas et al., 2017; Stringari et al., 2015). Epidermal deletion of Bmal1 results in epidermal stem cell malfunction and premature skin aging, highlighting the relevance of this timing mechanism (Janich et al., 2011). Importantly, the circadian control of homeostasis in peripheral tissues, such as the epidermis, is significantly altered during physiological aging (Sato et al., 2017; Solanas et al., 2017). We found that approximately 13% of the homeostatic circadian transcriptome of WT epidermis (2,960 transcripts) was also circadian in the RE epidermis (392 transcripts) (Figures 2A, 2B, and S2A). Importantly, the oscillatory phase-distribution of these shared circadian transcripts was similar, with a separation into two main peak times: “morning genes” around zeitgeber time (ZT) 0–4 when the light phase begins and “evening genes” (Solanas et al., 2017) that peak around ZT12–16 at the beginning of the dark phase (Figures 2B–2F). However, the shared circadian transcripts had reduced amplitude of oscillation in RE compared to WT epidermis, similar to the reduction observed for the core circadian machinery (Figures 1C and 2F). Of note, 224 circadian transcripts were common to WT, RE, and KO epidermis (albeit with lower amplitudes of oscillation and 2–4 h phase shifts in KO and RE as compared to WT), indicating that approximately 7% of the circadian transcriptome of the epidermis oscillates in a manner completely independent of BMAL1 (Figures 2A, 2B, S2B, and S2C).
Figure 2.

Tissue-Autonomous Function of Epidermal Clock Is Preserved in the Absence of Non-epidermal Circadian Rhythmicity
(A) Pie diagram showing circadian genes in WT epidermis and their overlap with circadian genes expressed in RE and KO epidermis. See also Figure S2A and Table S3.
(B) Heatmaps representing expression levels of circadian genes in the indicated genotypes.
(C) Phase distribution of all circadian genes in WT or, RE epidermis.
(D) Phase distribution of genes that are circadian in both WT and RE epidermis. See also Figure S2B.
(E) Amplitude of all circadian genes in WT or RE epidermis (p = 0.54).
(F) Amplitude of genes that are circadian in both WT and RE epidermis (p = 1.2 × 10⁻⁴). See also Figure S2C.
(G–I) Representative GO terms for genes that are circadian in the epidermis of both WT and RE mice (G), only in WT mice (H), or in all three genotypes of mice analyzed (WT, RE and KO) (I).
See also Figures S2 and Tables S1 and S3.
We next analyzed the biological processes regulated by the circadian transcripts in WT-only (2,214 genes) and WT+RE (392 genes) epidermis (Figures 2A, 2B, and S2A). Gene ontology (GO) analysis revealed that the 392 WT+RE circadian transcripts are involved in cell cycle, circadian rhythm, DNA repair, and (to a lesser extent) metabolic processes (Figure 2G). Interestingly, with the exception of metabolic processes, these are precisely the physiological functions that were previously shown to be unperturbed by either aging or by different dietary regimes; that is, they remained circadian in the epidermis of mice that were either old or fed a caloric-restriction or a high-fat diet (Solanas et al., 2017). This strongly suggests that this set of genes constitutes a robust basic core circadian program that ensures the daily high turnover rate required by the epidermis to sustain its homeostasis and that, importantly, is independent of BMAL1-driven oscillations in other tissues. Conversely, the nature of the 2,214 WT-only circadian genes strongly suggests that they define the circadian output that relies on the epidermis receiving systemic/niche-derived rhythmic signals (and therefore, they lose their rhythmicity in RE mice). In this sense, the WT-only circadian output included many metabolic functions and biological categories involved in the organization of cytoskeleton and the interaction of epidermal keratinocytes with the extracellular matrix (ECM) (Figure 2H). Finally, the 224 BMAL1-independent transcripts that were circadian in all three mouse lines (WT+RE+KO) (Figures 2A and 2B) were involved in protein translation or oxidative phosphorylation (Figures 2B, 2I, S2D, and S2E). This suggests that, in addition to the known functions of BMAL1 in the regulation of translation (Lipton et al., 2015) and mitochondrial energetics (Ezagouri and Asher, 2018; Jacobi et al., 2015; Peek et al., 2013), a previously unreported BMAL1-independent timing mechanism exists to regulate circadian physiology in the epidermis at the level of translation and mitochondrial energetics.
Overall, these results indicate that the circadian transcriptome of the epidermis is subdivided into a set of core, tissue-autonomous functions (that oscillate even if BMAL1 is absent from all other tissues), which provides the minimum basic homeostasis (epidermal turnover); systemic functions, which very likely require niche-derived or systemic signals and which relate to metabolism and interactions of epidermal keratinocytes with their surrounding ECM; and functions fully independent of BMAL1, such as regulating protein translation and basic mitochondrial energetics. Importantly, the same deconvolution of core, systemic, and BMAL1-independent circadian functions was observed when analyzing liver-RE mice (Koronowski et al., 2019).
Circadian rhythms strongly respond to changes in light and diet (Damiola et al., 2000). Thus, we next asked whether rhythmic feeding, its corresponding metabolic cycles, and/or rhythmic changes in light underlie the ability of the clock of epidermal cells to remain rhythmic in the absence of other tissue BMAL1-driven rhythms. First, we measured locomotor activity under L/D conditions. As expected, WT mice showed a clear nocturnal activity pattern, which was maintained in constant darkness (D/D) (Figures 3A, 3B, and S3A). Accordingly, food intake and drinking behavior of WT mice sharply increased in the dark phase, as determined using metabolic cages and IntelliCage, respectively (Figures 3D, 3E, S3C and S3D). This translated into robust metabolic cycles of oxygen consumption, respiratory exchange ratio, and energy expenditure (Figures 3F–3H).
Figure 3.
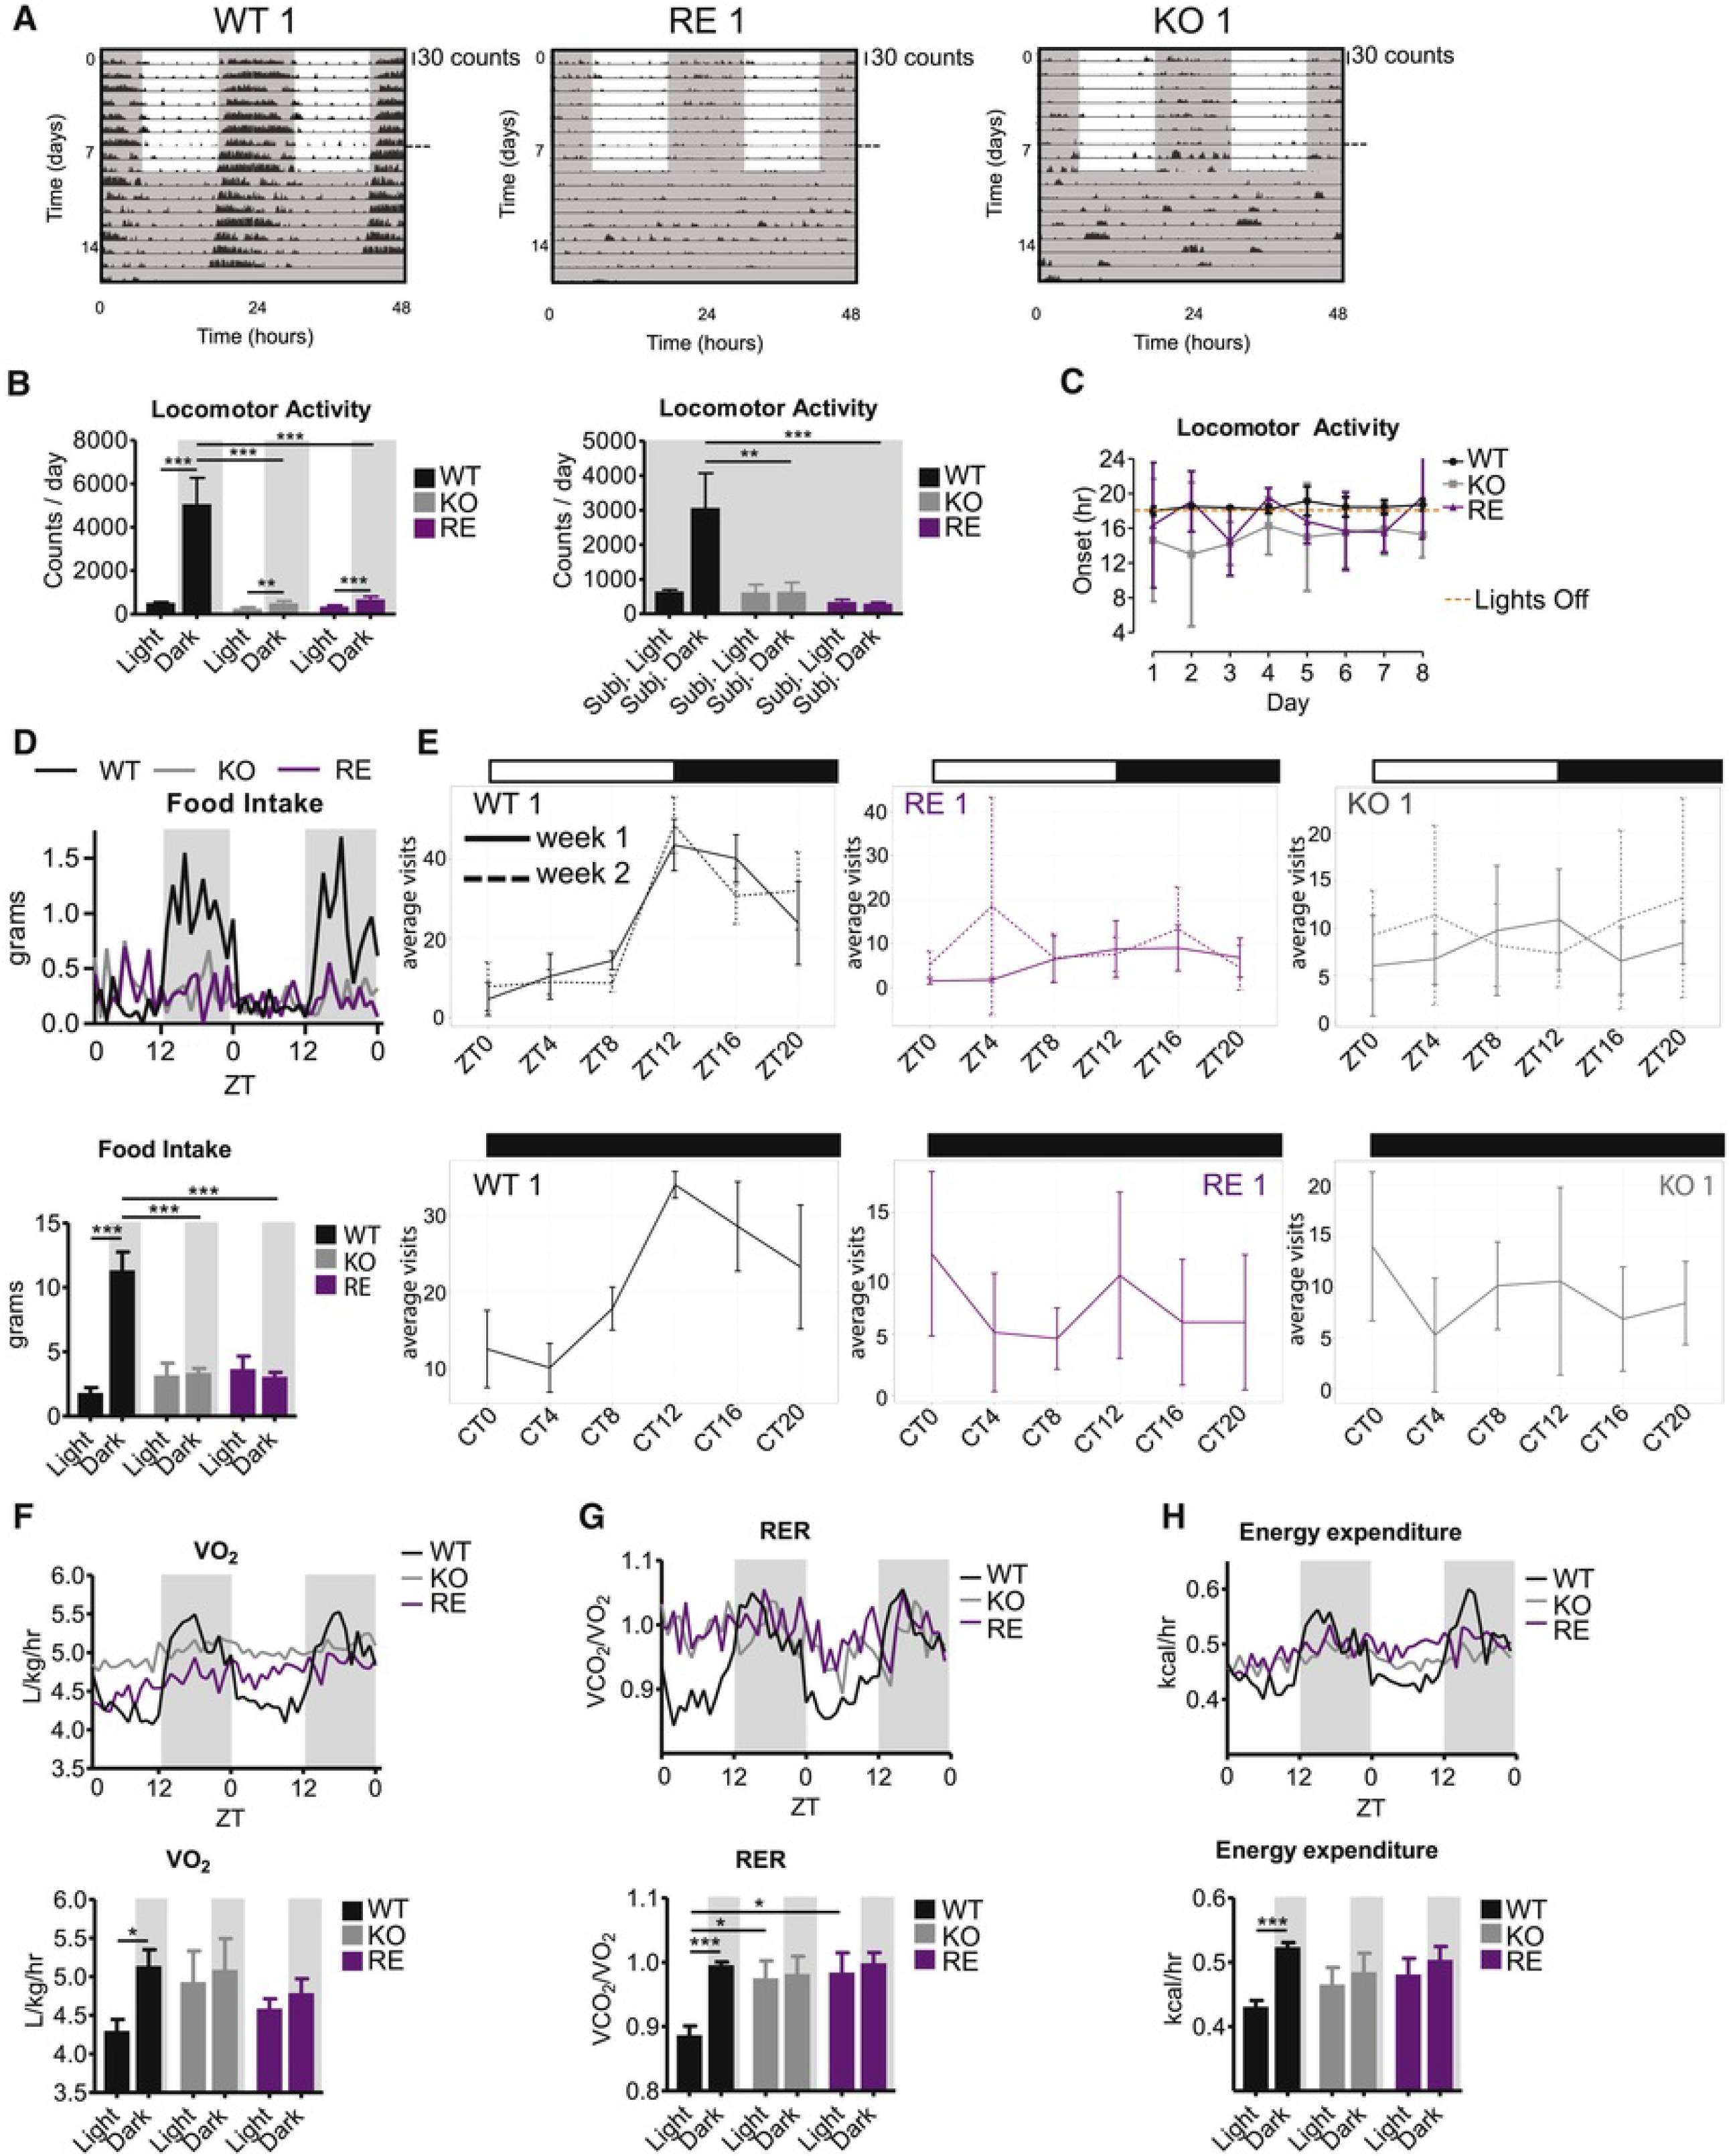
Non-epidermal Clocks Are Required to Maintain Full Circadian Behavioral Activity in Light-Entrainment Conditions
(A and B) Locomotor activity in L/D cycle and constant darkness (D/D). Joint data of two experiments: for the first measurement mice were kept in L/D for 7 days, and for the second measurement mice were kept in L/D for 2 days and afterwards for 7 days in D/D. Joining of the two measurements is marked by a horizontal dashed line.
(A) Data for representative animals duplicated over 2 days for visualization; scale bar, 30 counts.
(B) Group quantification, L/D: n(WT) = 5, n(KO) = 5, n(RE) = 4; D/D: n(WT) = 3, n(KO) = 4, n(RE) = 3. Two-way ANOVA, *p < 0.01, ***p < 0.001; data are represented as mean ± SEM. See also Figure S3A.
(C) Locomotor activity onset in L/D as determined by Clocklab. n(WT) = 5, n(KO) = 5, n(RE) = 4; data are represented as mean ± SD. See also Figure S3B.
(D) and F–H) Metabolic cage assessment of ad libitum fed mice in L/D for 2 days. Traces of group averages are shown on top, and light phase (ZT0–12)/dark phase (ZT12–24) averages are quantified below. RER, respiratory exchange ratio. Food intake and energy expenditure: n = 4 in all genotypes; VO2 and RER: n(WT) = 5, n(KO) = 5, n(RE) = 4; two-way ANOVA, *p < 0.05; ***p< 0.001. See also Figure S3C.
(E) Top: behavioral activity in L/D over 24 h measured as average visits per day to the drinking bottles of each individual WT, RE, or KO mouse over 2 weeks (shown as average visits within 4-h bins over all days from each week). Bottom: behavioral activity measured as visits to drinking bottles by individual WT, RE, and KO mice kept in D/D. Data are represented as mean ± SD. See also Figure S3D.
See also Figure S3.
On the other hand, RE and KO mice were much less active than WT mice (Figures 3A, 3B, and S3A). As previously described for full-body and brain-specific Bmal1-deficient mice, some KO mice showed a minor increase in locomotor activity in the dark phase under L/D conditions (Figures 3A, 3B, and S3A) (Bunger et al., 2000; Izumo et al., 2014, the same trend was observed for RE mice (Figures 3A, 3B, and S3A). Nevertheless, this minor increase in activity in the dark phase was highly variable among different KO and RE mice and between different days in each mouse (Figures 3C and S3B)—that is, while WT mice consistently became active at the beginning of the dark phase, RE and KO mice showed a much more variable onset of activity time that ranged between several hours before or after the beginning of the dark phase (Figures 3C and S3B). Importantly, this variable small increase in locomotor activity did not affect feeding or drinking behavior, which remained completely arrhythmic in RE and KO mice in L/D conditions (Figures 3D, 3E, S3C, and S3D). Accordingly, RE and KO mice lacked rhythmic cycles of oxygen consumption, respiratory exchange ratio, and energy expenditure (Figures 3F–3H). These results indicate that the ability of the epidermis to retain a functional core clock machinery, in the absence of BMAL1 elsewhere, cannot be due to signals derived from a rhythmic pattern of feeding or its associated metabolism.
We therefore next turned to studying whether the epidermis of RE mice might be responding to light independently of BMAL1 in other tissues. To do so, WT, RE, and KO mice were kept in complete darkness (12 h D/12 h D [D/D]) for approximately 7 days (between 156 h and 176 h). As in the L/D experiments (Figure 1), epidermal tissue was isolated over a 24-h period at six time points, and the transcriptomes were sequenced and analyzed (Figure 4A). Of note, these experiments were performed with 8-week-old mice that had not started to develop the pathologies associated to full-body Bmal1 deletion. As expected, after 1 week in darkness, the core clock machinery in WT epidermis was still robustly circadian (Figure 4B), with 2,302 circadian transcripts related to the same biological functions that constitute the epidermal clock output of WT mice under standard L/D light entrainment conditions (e.g., cell cycle, DNA repair, circadian rhythms, metabolic pathways) (Figures 4C–4E). In stark contrast, RE mice were completely behaviorally arrhythmic (Figures 3A, 3B, 3D, 3E, S3A, S3C and S3D), and their epidermis no longer displayed any oscillatory behavior of the core clock machinery after 7 days in darkness (D/D) (Figure 4B). Only Per2 and Bmal1 (Arntl) were scored as circadian, albeit with a minimal amplitude and borderline statistical significance (Figure 4B), and only 53 of the 2,302 transcripts that were circadian in WT epidermis under D/D conditions still oscillated in the epidermis of RE mice (Figures 4C–4E and S4A). Thus, the core clock machinery of the epidermis of RE mice requires cyclic changes in light to functionally oscillate in a synchronized manner.
Figure 4.

Non-epidermal Clocks Are Required to Maintain Rhythmicity in the Epidermis in the Absence of Light
(A) Schematic of experimental setup for obtaining the circadian transcriptome after 6–7 days in darkness; the interfollicular epidermis was isolated at six time points around the clock from 8-week-old WT, RE, and KO females that were kept in complete darkness for 156–176 h and submitted to RNA-seq to establish the circadian transcriptome, which was determined by using JTK_CYCLE.
(B) Core clock genes in WT, RE, and KO epidermis after 6–7 days in the dark (n = 3 or 4 mice per genotype and time point); adjusted p value for RE epidermis according to JTK_CYCLE; data are represented as mean ± SD.
(C) Pie diagram showing circadian genes after 6–7 days in darkness in WT epidermis and the overlap with circadian genes in RE and KO. See also Figure S4A and Table S4.
(D) Heatmap representing expression levels of circadian genes in WT.
(E) Representative GO terms for genes that are circadian only in WT epidermis; full lists of GO terms available in Table S2.
Since we pooled data from several RE animals to obtain these results, the absence of circadian transcriptional cycles in the RE epidermis in constant darkness can be attributed either to a loss of synchronization between individual animals (i.e., phase dispersion) or to each individual mouse becoming arrhythmic. If loss of rhythmicity in the RE epidermis would be due to a loss of synchronization between individual mice, then a high variability of core clock gene expression would be expected between the individual RE samples at each time point. However, the expression level of the core clock genes between individual RE mice at each time point was highly coherent (Figure 4B), strongly arguing against the possibility that individual RE mice remain rhythmic, but phase dispersed, in the absence of light. Thus, to test whether indeed the epidermis of RE mice became arrhythmic after 1 week in darkness, we collected epidermal samples (through small ear snips) of each individual WT, RE, and KO mouse every 4 h during 20 h (i.e., 6 consecutive time points) after 7 days in D/D. This allowed measuring the expression of Bmal1 in the epidermis of each mouse over one day. As expected, the expression of Bmal1 in the epidermis of each WT mouse was rhythmic with the predicted phase (Figure S4B), although with some degree of variability, probably due to the influence of the repetitive handling of the animals for collecting the samples. Importantly, the expression of Bmal1 was clearly arrhythmic in the epidermis of each RE mouse (Figure S4B), indicating that tissue arrhythmia, rather than phase dispersion between different mice, underlies the lack of BMAL1-driven oscillations in the epidermis of mice placed in constant darkness.
Thus, light can strikingly synchronize the clock of a peripheral tissue, such as the epidermis, even when other tissue-specific clocks are absent. However, and importantly, BMAL1-dependent circadian signals emanating from other organs (in this case, non-epidermal) are essential to maintain near 24-h rhythmicity at the tissue level in the absence of light and must therefore act as a mechanism to ensure a memory of past light regime. Similar results were obtained in liver-RE mice (Koronowski et al., 2019).
Whole-body deletion of Bmal1 in mice causes several progressive pathologies, including arthritis, corneal degeneration, insulin resistance, muscle wasting, cardiac defects, reduced body weight, brittle bones and cartilage, and skin hypertrophy (Kondratov et al., 2006). These pathologies cause severe premature aging in Bmal1−/− mice, resulting in a significantly reduced life expectancy of only about 9 months (Kondratov et al., 2006) (compared to 18–24 months for most mice strains). Moreover, deletion of Bmal1 in specific tissues, in an otherwise fully rhythmic animal, results in strong signs of premature tissue aging (Janich et al., 2014). For instance, it was previously shown that conditional deletion of Bmal1 only in K14-positive cells results in premature loss of homeostasis of the epidermis in 4- to 5-month-old mice, with a significant accumulation of terminally differentiated cells in the cornified layer (Janich et al., 2011).
Restricted expression of Bmal1 in K14-positive cells in RE mice did not rescue the reduced lifespan or weight loss of full-body Bmal1-KO mice (Figures 5A and 5B). However, expression of endogenous Bmal1 exclusively in the epidermis (RE mice) significantly rescued the premature aging of the tissue, as shown by a reduction of the thickness of the cornified layer in 30-week-old RE mice as compared to KO mice (Figure 5C). In this sense, expression of the keratinocyte terminal differentiation marker LORICRIN was markedly increased in the suprabasal epidermal layer, and even in some basal layer cells, in KO epidermis (Figure 5G). However, accumulation of LORICRIN was strongly reduced in RE epidermis compared to KO epidermis. Thus, tissue-intrinsic BMAL1 is partially capable of sustaining homeostasis of the epidermis.
Figure 5.

Epidermal BMAL1 Is Required to Prevent Increased Differentiation
(A) Kaplan Meier survival curve for WT, RE, and KO mice (no significant difference between KO and RE, p = 0.2730).
(B) Weight curve for WT, RE, and KO mice; data are represented as mean ± SD.
(C) Epidermal cornification measured as thickness of cornified layer; p(RE versus WT) = 1.97 × 10⁻³, p(RE versus KO) = 1.33 × 10⁻⁶, p(WT versus KO) = 8.79 × 10⁻¹⁰); data are represented as mean ± SD; scale bar, 100 μm.
(D) Venn diagram showing the overlap between genes that are significantly up- or downregulated in KO or RE epidermis as compared to WT epidermis using 8-week-old mice under L/D conditions (n = 23 each for KO and RE).
(E) Gene expression heatmap of markers that describe different populations of keratinocytes according to their differentiation status in WT, RE, or KO epidermis of 8-week-old females.
(F) Expression level of markers that describe different populations of keratinocytes according to their differentiation status that are significantly up- or downregulated in epidermis from both RE and KO mice as compared to WT mice.
(G) Representative images of intensity levels of KERATIN 14 (marker for basal cell layer) and LORICRIN (marker for epidermal differentiation); scale bar, 50μm.
See also Figure S5.
We next analyzed the changes in gene expression in KO and RE epidermis as compared to WT epidermis of 8-week-old mice (Figure 5D) by following expression changes of genes independent of the time of day (adjusted p ≤ 0.05). Interestingly, many more genes were differentially expressed between KO and WT epidermis than between RE and WT epidermis (4,826 compared to 248 genes, respectively), further indicating that the homeostasis of the epidermis of RE mice is significantly maintained even if RE mice show strong signs of overall aging (Figure 5D). We used single-cell RNA sequencing (RNA-seq) data to compare these gene expression changes to the transcriptome signatures that occur as keratinocytes progressively differentiate during epidermal stratification (Joost et al., 2016). Expression of keratinocyte differentiation markers was upregulated, while that of basal epidermal cell markers (stem and progenitor cells) was downregulated in KO and RE epidermis as compared to their WT counterparts (Figure 5E). Notably, however, markers of epidermal differentiation were more upregulated in KO epidermis than RE epidermis, while the opposite was true for genes that define epidermal progenitors (Figure 5F). Importantly, we observed a very similar pattern of changes in gene expression related to epidermal differentiation in KO and RE mice kept 1 week in complete darkness (Figures S5C–S5F). In other words, KO epidermis expressed higher levels of many more epidermal differentiation genes than RE epidermis (Figures S5D–S5F). Since the core clock machinery and the circadian transcriptome of the epidermis of RE mice are arrhythmic after 1 week in darkness at the tissue level (Figure 4), our observation indicates that the rescue of the premature aging of the epidermis in RE mice is likely to be partly independent of the function of BMAL1 to generate synchronized transcriptional cycles in the epidermis.
Discussion
Overall, our results show that unexpectedly, light can synchronize the BMAL1-dependent core circadian machinery in the epidermis and the hepatocytes of the liver (Koronowski et al., 2019) in the absence of BMAL1-driven clocks in other tissues. Furthermore, our results strongly suggest that the core clock machinery establishes a robust tissue-autonomous clock output to maintain a basic homeostasis while at the same time reading systemic cues, and possibly locally niche-derived signals that depend on BMAL1 being present in other tissues, to allow communication between different tissues. Interestingly, a previous study has shown that in the absence of light, clock rhythmicity is maintained in peripheral tissues if Bmal1 is depleted in the majority of SCN neurons (Husse et al., 2014). This might suggest that the circadian rhythm of peripheral tissues can be synchronized in constant darkness by non-SCN-derived clocks when the SCN clock has been disrupted (i.e., a compensatory mechanism). However, in the study of Husse and colleagues, mice were kept in constant darkness for only 2–3 days prior to analyzing peripheral tissue rhythmicity in vivo (Husse et al., 2014), which might not have been sufficiently long enough for them to gain the full spectrum of arrhythmia (as seen in RE epidermis after 7 days in darkness). Indeed, explanted peripheral tissues are known to lose their circadian rhythms progressively rather than abruptly (Izumo et al., 2014), and it seems likely that the circadian rhythms of tissues progressively fade when RE mice are in constant darkness.
We have shown that changes in light, rather than a rhythmic feeding behavior and associated metabolism, are responsible for maintaining the clock machinery functionally synchronized in the epidermis of RE mice. Importantly, we show that the absence of light causes epidermal arrhythmia rather than phase dispersion of different RE mice. That said, our experimental approach cannot distinguish between whether the epidermis of each RE mouse is arrhythmic in constant darkness because its individual keratinocytes are rhythmic but phase dispersed or because each keratinocyte becomes arrhythmic. Individual disaggregated cells retain circadian oscillations in cell culture (Nagoshi et al., 2004) and at the subtissue level in tissue explants during several days (Izumo et al., 2014). However, in the absence of a synchronizing stimulus—e.g., serum shock or dexamethasone treatment—the cell population in culture becomes unsynchronized due to phase dispersion between individual cells (Nagoshi et al., 2004). This suggests that, at least in vitro, individual cells can maintain a functional circadian clockwork but require an entrainment cue (Zeitgeber) to remain synchronized. Thus, it is possible that in constant darkness, individual keratinocytes of the epidermis of RE mice could be oscillating, but in an unsynchronized manner, resulting in whole-tissue arrhythmia. Unfortunately, testing this directly in mice remains challenging, since any intravital imaging based on fluorescent clock reporters, with the current imaging technology available, would interfere with the normal behavior of the animal (e.g., anesthesia, interference with the locomotor activity, light/dark cycle, feeding behavior), thereby altering its circadian rhythm. In addition, available models to measure circadian rhythms in vivo do not yet provide imaging resolution at the single-cell level (Hamada et al., 2016; Saini et al., 2013). However, and importantly, irrespective of the cause of tissue arrhythmia in the epidermis of RE mice in constant darkness (i.e., phase dispersion between different cells, or arrhythmia at the cellular level), the physiological consequence is the same: a detrimental loss of daily transcriptional cycles.
It has been historically hypothesized that clocks are organized in a hierarchical manner, with a central BMAL1-controlled pacemaker in the SCN that sends synchronizing signals to slave clocks in peripheral tissues (Albrecht, 2012). Instead, it has been recently proposed that light might be able to entrain peripheral tissues independently from the SCN clock (Husse et al., 2014, 2015) or potentially even in a manner completely independent of a functional SCN (Tahara et al., 2012). Our results provide, for the first time, in vivo functional proof of the existence of at least two pathways that differentially regulate peripheral clock synchronization, which we have termed the “immediate response” and the “memory branch.”. The immediate response allows changes in light perception to be signaled to peripheral tissues. This branch regulates tissue-autonomous Bmal1 expression but is independent of BMAL1 activity in other tissues (as the tissue-specific core clock machinery is rhythmic in L/D conditions in RE epidermis but ceases to oscillate when RE mice are placed in constant darkness). We speculate that this branch allows tissues to autonomously maintain their core circadian physiology and to respond and adjust to environmental changes.
Mechanistically, our results show that the immediate branch is not established by rhythmic feeding or its associated metabolism. Furthermore, it is unlikely to be strongly influenced by a masking effect of locomotor activity. On the other hand, our results strongly indicate that this mechanism is responsive to light, although the precise mechanism is unknown. One possibility is that light synchronizes the epidermal circadian clock through its direct detection by keratinocytes. For instance, mammalian epidermal keratinocytes express some photopigments (Haltaufderhyde et al., 2015; Kim et al., 2013b; Kojima et al., 2011) that mediate their direct response to UV light (Kim et al., 2013b; Kojima et al., 2011). Although future studies are needed to study this potential mechanism, it is unlikely to be a general mechanism that is responsible for synchronizing peripheral tissues for two main reasons. First, and importantly, the immediate branch of the circadian clock synchronization is also present in internal organs, such as the liver (Figure 1G) (Koronowski et al., 2019), where direct exposure to light cannot take place. Second, many mouse strains in the wild remain mostly underground during the hours of exposure to light. A second more plausible mechanism regulating the immediate branch might be through peripheral neural signaling. In this sense, light can stimulate hairfollicle growth through an eye-to-skin axis that relies on communication from photopigment melanopsin and sympathetic neural signaling (Fan et al., 2018). Furthermore, sympathetic neural signals are likely general regulators of tissue homeostasis, as already described for hematopoietic stem cells, the pancreas, and the prostate, among other tissues (Hanoun et al., 2015). Whether light-stimulated sympathetic neural pathways act through the local circadian clockwork in the hair follicle remains to be determined.
Conversely, the memory branch likely functions to maintain robustness against changes in the regime of light exposure, with signals coming from BMAL1 in other organs acting as a memory of the previous time of light exposure. This memory branch is responsible for maintaining not only overall organism behavior (Bunger et al., 2000; Husse et al., 2014) (Figures 3 and S3), but also near 24-h circadian rhythmicity in peripheral tissues in the absence of light as a circadian entrainment cue (Figure 4). Thanks to the integration of both branches, peripheral clocks harbor the ability to react to changes in light entrainment yet maintain a certain degree of rhythmic robustness. Future research will reveal if and how these two mechanisms interact to establish organismal circadian rhythmicity and which pathways control each of them.
Our results have important implications for our health. Humans in the modern lifestyle are constantly faced with drastic alterations in light exposure due to abundance of light at night and the ability to rapidly move across time zones. This might result in both branches of the clock being regularly out of phase. Thus, the immediate response branch adjusts peripheral clocks based on light exposure (whether from the sun or from an artificial source), yet the memory branch resists this change, provoking a constant state of (social) jet lag. Considering the strong detrimental impact that clock alterations exert on the physiology of tissues and the whole organism, it is likely that constant desynchronization of these two entrainment pathways negatively influences our health; these effects have been observed in the extreme case of shift workers (Roenneberg and Merrow, 2016) but are likely to be much more widespread (Roenneberg and Merrow, 2016). The Bmal1-stopFL mouse model allows for the first time to identify these two distinct branches of clock control, to dissect the mechanisms underlying their regulation in vivo, and to possibility identify means to maintain their correct synchrony.
STAR★Methods
Contact for Reagent and Resource Sharing
Further information and requests for resources and reagents should be directed to and will be fulfilled by the Lead Contact, Salvador Aznar Benitah (salvador.aznar-benitah@irbbarcelona.org). The Alfp-Cre mouse line was obtained under a Material and Transfer Agreement (MTA) signed with Prof. Dr. Günther Schütz at the Deutsches Krebsforschungszentrum (Heidelberg) which excludes further distribution without the consent of the provider.
Experimental Model and Subject Details
All mice were bred and maintained at the animal facilities of the Barcelona Science Park in strict accordance with the Spanish and European Union regulations. All experimental protocols were approved by the Catalan Government, in accordance with applicable legislation and the guidelines of the Institutional Animal Care and Use Committee (IACUC) of the Barcelona Science Park.
Animal experiments were designed and conducted with consideration of the ARRIVE guidelines, the details of which were as follows. Bmal1-stop-FL mice and subsequent crossings were generated as described in the “Generation of BMAL1-stop-FL Mice” section below. Male and female littermates were used for lifespan and body weight experiments. Female mice were used for all other experiments with the exception of the ear snip experiment and the analysis of aged back skin, which was done with males. Unless otherwise stated, mice were maintained in a standard 12 h light:12 h darkness (L/D) photoperiod at 22°C degrees with ad libitum access to standard chow diet. Experiments were conducted with 8–12 week-old mice prior to the phenotypic onset of abnormalities.
Method Details
Generation of Bmal1-stopFL mice
Bmal1-stopFL mice were generated using a conditional gene trap approach. A stop cassette containing a splice acceptor (SA), a mCherry reporter gene, a poly-A tail and a neomycin resistance cassette flanked by FRT sites was flanked by loxP sites and introduced after the first translated exon (exon 5) of the Arntl gene, which codes for BMAL1. The neomycin resistance cassette flanked by FRT sites was used for clonal selection and removed by FLP-mediated recombination after successful germline transmission. The stop cassette prevents transcriptional read-through after exon 5 in the Arntl gene. Cre-mediated recombination excises the loxP flanked stop cassette and the mCherry reporter, thereby reconstituting the wild-type Arntl locus with only one loxP site left between exon 5 and exon 6. Bmal1-stopFL mice were generated in the C57BL/6 background, and K14-Cre and Alfp-Cre mice were backcrossed to the C57BL/6 background for at least ten generations. Mice heterozygous for the Bmal1-stopFL locus and for the K14-Cre or Alfp-Cre were crossed to generate the following experimental animals: WT - Arntlwt/wt, K14-Cretg/wt or Alfp-cretg/wt; RE – ArntlstopFL/stopFL, K14-Cretg/wt or Alfp-cretg/wt; KO - ArntlstopFL/stopFL, K14-Crewt/wt or Alfp-crewt/wt.
Isolation of Epidermis
For the transcriptomic studies of circadian oscillations, four female mice (8 weeks old) were used per genotype at each of the 6 time points. For the darkness experiment (D/D), mice were transferred to 24 h darkness per day at 7 weeks of age and kept in darkness for a total of 156 h to 176 h.
For sample collection, 1 cm2 of back skin was collected for histology immediately after sacrifice; the remaining skin was used to isolate the interfollicular epidermis. To separate the interfollicular epidermis from the dermis, skin samples were scraped with a scalpel to remove the hypodermis and then floated for approximately 40 min at 37°C on 1 mg/mL dispase (Sigma-Aldrich) dissolved in PBS. Dispase was inactivated with 15% chelated fetal bovine serum (GIBCO) diluted in EMEM medium without calcium (Lonza). The interfollicular epidermis was mechanically disaggregated and dissociated, and then sequentially filtered through a 100-μm and a 40-μm Cell Strainer. Cell pellets of 1 million cells were frozen for later RNA extraction. Remaining cells were frozen for later protein extraction.
For repetitive collection of epidermis from the same individual mouse, small pieces of ear were taken at 6 consecutive time points. 3 WT, 3 RE and 2 KO mice were kept in darkness for 156 h to- 176 h prior to sample collection. Ear snips were taken every 4 h under red light illumination. Ventral and dorsal halves of the ear snips were separated manually with forceps and floated for 40 min at 37°C on 1 mg/mL dispase (Sigma-Aldrich) dissolved in PBS. The epidermal sheet was mechanically separated from the dermis and frozen in TRIzol (Invitrogen, Carlsbad, CA) for later RNA extraction.
For the study of aged epidermis, back skin samples from 12 WT, 17 RE and 7 KO males were taken at 30 weeks of age. Mice were weighed once a week and their health status closely monitored according to work protocols approved by the Catalan Government.
IntelliCage Drinking Behavior Measurements
To monitor physiological activity, mouse activity was measured in IntelliCage cages (Lipp et al., 2005, Proc. Meas. Behav.), which allows basal physiological activity to be measured in a social environment. Microchips were inserted in the back of three (9 to 20 week old) females per genotype to monitor individual visits to the drinking dispenser. Mice were adapted for one week to the cages before the start of the experiment. Mice were subjected to the normal L/D photoperiod for the first week (week 1; Figures 3E upper panel, S3C left panel), were switched to constant darkness for one week (Figures 3E lower panel, S3C right panel), and then subjected again to normal L/D for another week (week 2 in Figures 3E upper panel, S3C left panel). The activity for each mouse was analyzed separately for each week and is shown as average visits per day during each 4-h time bin.
Metabolic Cage Data Acquisition
Indirect calorimetry was performed with negative flow Oxymax-CLAMS (Columbus Instruments, Columbus, OH) hardware system cages. 10–14 week old mice were singly housed and given a 24 hour acclimation period to the metabolic cage. Throughout the experiment, standard chow and water were available ad libitum and mice were put under a L/D cycle throughout the whole experiment. Measurements of VO2, VCO2, food intake, water intake and feeding activity were taken every 10 min for 2 consecutive days at room temperature. Respiratory exchange ratio (RER = VCO2/VO2) was calculated by the accompanying Oxymax software.
Locomotor Activity
Locomotor activity of individually housed 10–16 week old mice was measured using optical beam motion detection (Starr Life Sciences). Data were collected using Minimitter VitalView 5.0 data acquisition software and analyzed using Clocklab (Actimetrics).
RNA Extraction
Total RNA was extracted from liver tissue or isolated interfollicular epidermis by homogenization in TRIzol (Invitrogen, Carlsbad, CA). Following RNA, DNA and protein layer separation with chloroform, RNA was precipitated with a standard isopropanol/ethanol procedure. Pelleted and washed RNA was resuspended in RNase-free water and quantified using the NanoDrop system (Thermo Fisher, Waltham, MA).
Real-Time Quantitative PCR
Real-time quantitative PCR for the liver samples was carried out with SsoAdvanced Universal SYBR Green Supermix (BioRad) on an Applied Biosystems Quant Studio 3 (Thermo Fisher). Delta CTs were calculated and further normalized to 18S rRNA values for each sample. Primer sequences are listed in Table S5. For gene expression, complementary DNA (cDNA) was synthesized from 1 μg RNA by reverse transcription with iScript cDNA Synthesis Kit (BioRad). Expression levels in the different genotypes were calculated as the average expression of the biological replicates relative to WT at ZT0.
Real-time quantitative PCR for the ear epidermis was carried out with Taqman Gene Expression Master Mix (Thermo Fisher) on an Applied Biosystems QuantStudio 6 Flex (Thermo Fisher). Delta CTs were calculated and further normalized to B2m and Hprt1. Taqman probes are listed in Table S5. For gene expression, complementary DNA (cDNA) was synthesized from 200 ng RNA by reverse transcription with Applied Biosystems High Capacity cDNA Reverse Transcription Kit (Thermo Fisher).
RNA-Sequencing
Quality control for quantity and quality of the total RNA was done using the Qubit RNA HS Assay (Life Technologies) and RNA 6000 Nano Assay on a Bioanalyzer 2100 (Agilent). RNA-seq libraries (starting from 500 ng total RNA) were constructed with the TruSeqStranded mRNA LT Sample Prep Kit (Illumina, Rev.E, October 2013). The final libraries were validated on an Agilent 2100 Bioanalyzer with the DNA 7500 assay (Agilent). Libraries were sequenced on HiSeq2000 (Illumina, Inc) in paired-end mode with a read length of 2 × 50 bp using TruSeq SBS Kit v4. On average, 48 million paired-end reads were generated for each sample in a fraction of a sequencing v4 flow cell lane, following the manufacturer’s protocol.
Western Blot
Cell pellets were lysed in standard RIPA Buffer with cOmplete protease inhibitor cocktail (Roche), phosphatase inhibitor cocktail I (Abcam), nicotinamide and trichostatin A (both Sigma-Aldrich) and sonicated 5 times for 10 s with 20% amplitude (Vibra Cell VCX750). 10 μg of interfollicular epidermal cell lysates (50 μg for the detection of acetylated BMAL1) were loaded on 6%–10% polyacrylamide gels (Bio-Rad Laboratories). The following antibodies were used: anti-BMAL1 (Abcam, ab93806), antiphophorylated BMAL1 (Ser42) (Cell Signaling, 13936), anti-acetylated BMAL1 (Lys538) (Merck Millipore, AB15396), anti-TUBULIN (Sigma-Aldrich, T7816) and anti-ACTIN (Sigma-Aldrich, A5228).
Immunohistochemistry
Mouse back skin was fixed in 10% neutral buffered formalin for 3 h at room temperature and then processed for embedding in paraffin blocks. Paraffin-embedded tissue sections (3 μm in thickness) were air-dried and further dried at 60°C overnight. Haematoxylin/Eosin staining was performed using a CoverStainer (Dako - Agilent) and following standard procedures.
Immunohistochemistry was performed manually. Prior to immunohistochemistry, sections were dewaxed and antigen retrieval was done with Tris-EDTA buffer at pH9 in a boiler for 20 min. Quenching of endogenous peroxidase was performed by 10 min of incubation with Peroxidase-Blocking Solution (Dako REAL S2023). R.T.U Animal Free Block and diluent (SP-50035, Vector) was used to block non-specific labeling for 30 min. Primary antibody RFP Rabbit polyclonal IgG (1:100; Rockland, 600–401-379) was incubated at room temperature overnight. AffiniPure Goat Anti-Rabbit IgG (H+L) (1:200; Jackson ImmunoResearch Labs, 111–005-003) was incubated for 60 min to amplify the signal. BrightVision Poly-HRP-Anti Goat IgG Biotin-free, Ready-to-use (ImmunoLogic, DPVG 55HRP) was used to detect the labeling. Antigen–antibody complexes were revealed with 3–3′-diaminobenzidine (K3468, Dako), with the same time exposure in each sample (30 s). Sections were counterstained with Haematoxylin (Dako, S202084) and mounted with Mounting Medium, Toluene-Free (CS705, Dako) using a Dako CoverStainer. Specificity of staining was confirmed by omission of the primary antibody.
For immunofluorescence stainings antigen retrieval was performed for 20 min at 97°C with citrate (pH 6) on 3-micron tissue sections. Sections were permeabilized for 20 min with a 0.05% Triton X-100 in PBS solution, and blocked with a 10% goat serum in PBS solution for 1 h at room temperature. Primary antibody incubation was done overnight at 4°C. Secondary antibody incubation was done at room temperature for 2 h. All washes were done with PBS/ 0.1% Tween20/ 3% BSA. Nuclei were stained with DAPI (Invitrogen).
The following primary antibodies were used: anti-LORICRIN (1:500 Abcam, ab85679), anti-KERATIN 14 (1:1000 BioLegend, Poly9060). These secondary antibodies were used: anti-chicken Alexa Fluor 647 (1:500, Thermo Fisher Scientific A-21449), anti-rabbit Alexa Fluor 568 (1:500, Thermo Fisher Scientific A-11036).
Microscopy and Image Analysis
Sections stained with hematoxylin & eosin (H&E) or mCherry sections were imaged using a NanoZoomer 2.0HT (Hamamatsu, Japan) (20 × objective at 0.46 μm/pixel). Thickness of cornified layer was quantified with QuPath software (Bankhead et al., 2017) by measuring the maximum extension of the cornified layer between each pair of hair follicles in a skin section. Fluorescence pictures were acquired using a Leica TCS SP5 confocal microscope (63 × 1.40 oil objective) at 1024×1024 pixel resolution. Images were processed using the Fiji v2.0.0- rc-14/1.49 g software (ImageJ; Schindelin et al., 2012).
Quantification and Statistical Analysis
RNA-Sequencing Data Analysis
The Trimmomatic (version 0.36) software (Bolger et al., 2014) was used to correct the quality and remove possible contaminations from the paired-end RNA-seq data. Reads were aligned to the reference genome (mm10 and Ensembl transcriptome version GRCm38.81) by TopHat (version 2.1.1) (Kim et al., 2013a). After alignment, the read count was done with the featureCounts (version 1.6.0) software. Overall, three samples were removed from further analysis in the L/D experiment (samples 5WT3 and 5RE3 due to quality issues, and sample 3KO1 due to wrong genotype), and four samples were removed from further analysis in the D/D experiment due to quality issues (samples 5RE1, 6RE1, 6WT4 and 6KO4).
Identification of Circadian Genes
To identify circadian genes from the different sets of RNA-seq data, the Jonckheere-Terpstra-Kendall (JTK_CYCLE) algorithm was used (Hughes et al., 2010). Count data were normalized with the RPKM normalization, using the edgeR rpkm function (version 3.18.1). For all array sets, a permutation-based P value of < 0.01 was considered significant.
Expression levels for all circadian genes in each time point were calculated as the average log2 RPKM of the biological replicates, with error bars of the replicates representing standard deviation.
Amplitude and phase estimations of circadian genes were extracted from the JTK_CYCLE algorithm. Kernel density estimations (KDE) were computed and plotted for the oscillation amplitudes from each array using the Seaborn library (version 0.7.1) of Python (version 2.7.11, within Anaconda 4.0.0 [64-bit]). Phase estimations were performed by computing the corresponding histogram from each array and fitting the parametric distribution to the data, using the Seaborn library. The R version used was 3.4.4.
For the generation of the heatmaps of circadian genes, the mean expression value of all replicates per time point and genotype was generated and subsequently normalized by calculating the z-score of each gene (RPKM) per time point and genotype over all time points and genotypes. Genes were ordered according to their lag obtained from the JTK_CYCLE output file. The heatmaps were plotted using Python (version 3.6.1).
Gene Ontology
GO analysis was performed using the functional annotation tool of DAVID Bioinformatics Resources 6.7 (Huang et al., 2009a, 2009b). The GO terms belonging to “biological processes all” (BP_all) were used for GO term comparison, the q value was calculated using the Benjamini Hochberg procedure (Tables S1 and S2).
Differential Expression
The differential expression analysis between the different genotypes was conducted with DESeq2 (Love et al., 2014). The same samples that were included in the circadian transcriptome analysis of WT, RE and KO epidermis, irrespective of the time point, were used as replicates. Differentially expressed genes were identified as genes having an adjusted p value less than 0.05.
For the generation of the heatmaps, the mean expression over the 6 time points of the day within each genotype was calculated for those genes that constitute the transcriptome signatures of the progressive states of differentiation (Joost et al., 2016) (n = 22–23 for each genotype, see description of “RNA-sequencing data analysis”). The heatmaps show the z-score per gene (rows) of the RPKM for each genotype (columns). The heatmaps were visualized using Python (version 3.6.1).
Statistics
Circadian genes were determined by JTK_CYCLE (Hughes et al., 2010), with a Bonferroni adjusted P value cut off of < 0.01. Amplitudes of the different experimental groups were compared by unpaired t test with Welch’s correction. Comparison of the survival curves was performed with Prism 7 (version 7.0b) using the log-rank (Mantel–Cox) test, and cornified layer thickness was compared using one-way analysis of variation (ANOVA) with Tukey correction.
For each experiment, the number of biological replicates, inclusion/exclusion criteria (when appropriate) and visual representation information (i.e., mean, error bar, etc. of graphs) can be found in the figure legends or related STAR Method description.
Data and Software Availability
Datasets generated and/or analyzed to support this study have been deposited online in the Gene Expression Omnibus (GEO) under accession number GEO: GSE115104 (L/D experiment, Figures 1, 2, 5, and S2) and GEO: GSE114943 (D/D experiment, Figures 4, S4, and S5).
Supplementary Material
Table S1. GO Term Analysis for L/D Experiment, Related to Figure 2
Table S2. GO Term Analysis for D/D Experiment, Related to Figure 4
Table S3. RNA Sequencing Data and JTK_CYCLE Output for L/D Experiment, Related to Figures 1 and 2
Table S4. RNA Sequencing Data and JTK_CYCLE Output for D/D Experiment, Related to Figures 4 and S4
Table S5. Primer Sequences, Related to STAR Methods
Key Resources Table.
| REAGENT or RESOURCE | SOURCE | IDENTIFIER |
|---|---|---|
| Antibodies | ||
| Rabbit polyclonal anti-BMALl | Abcam | Cat# ab93806; RRID:AB_10675117 |
| Rabbit anti-phosphorylated BMAL1 (Ser42) | Cell Signaling | Cat# 13936 |
| Rabbit polyclonal anti-acetylated BMAL1 (Lys538) | Merck Millipore | Cat# AB15396; RRID:AB_1977054 |
| Mouse monoclonal anti-ACTIN | Sigma-Aldrich | Cat# A5228; RRID:AB_262054 |
| Mouse monoclonal anti-TUBULIN | Sigma-Aldrich | Cat# T7816; RRID:AB_261770 |
| Rabbit polyclonal anti-RFP | Rockland | Cat# 600-401-379; RRID:AB_2209751 |
| AffiniPure Goat anti-Rabbit IgG | Jackson ImmunoResearch Labs | Cat# 111-005-003; RRID:AB_2337913 |
| BrightVision Poly-HRP-anti Goat IgG Biotin-free | ImmunoLogic | Cat# DPVG 55HRP |
| Rabbit polyclonal anti-LORICRIN | Abcam | Cat# ab85679; RRID:AB_2134912 |
| Chicken polyclonal anti-KERATIN 14 | BioLegend | Cat# 906001; RRID:AB_2565055 |
| Goat anti-Chicken IgY, Alexa Fluor 647 | Thermo Fisher Scientific | Cat# A-21449; RRID:AB_2535866 |
| Goat anti-Rabbit IgG, Alexa Fluor 568 | Thermo Fisher Scientific | Cat# A-11036; RRID:AB_10563566 |
| Chemicals, Peptides, and Recombinant Proteins | ||
| SsoAdvanced Universal SYBR Green Supermix | BioRad | Cat# 1725270 |
| Taqman Gene Expression Master Mix | Thermo Fisher | Cat# 4369016 |
| Critical Commercial Assays | ||
| Applied Biosystems High Capacity cDNA Reverse Transcription Kit | Thermo Fisher | Cat# 4368814 |
| iScript cDNA Synthesis Kit | BioRad | Cat# 1708890 |
| Deposited Data | ||
| L/D RNA-sequencing dataset | Gene Expression Omnibus | GEO: GSE115104 |
| D/D RNA-sequencing dataset | Gene Expression Omnibus | GEO: GSE114943 |
| Experimental Models: Organisms/Strains | ||
| Mouse: Wild Type - Bmal1wt/wt; K14-cretg/wt | this paper | N/A |
| Mouse: Bmal1 knockout - Bmal1stopFL/stopFL; K14-cretg/wt | this paper | N/A |
| Mouse: Bmal1 Epidermis-Reconstituted - Bmal1stopFL/stopFL; K14-cretg/wt | this paper | N/A |
| Mouse: Wild Type - Bmal1wt/wt; Alfp-cretg/wt | this paper | N/A |
| Mouse: Bmal1 knockout - Bmal1stopFL/stopFL; Alfp-crewt/wt | this paper | N/A |
| Mouse: Bmal1 Hepatocyte- Reconstituted (Liver-RE) - Bmal1stopFL/stopFL; AIfp-cretg/wt | this paper | N/A |
| Oligonucleotides | ||
| qPCR Primers | This paper | Table S3 |
| Software and Algorithms | ||
| Jonckheere-Terpstra-Kendall (JTK_CYCLE) algorithm | Hughes et al., 2010 | N/A |
| Trimmomatic (version 0.36) | Bolger et al., 2014 | N/A |
| TopHat (version 2.1.1) | Kim et al., 2013a | https://ccb.jhu.edu/software/tophat/index.shtml |
| edgeR rpkm function (version 3.18.1) | N/A | https://bioconductor.org/packages/release/bioc/html/edgeR.html |
| Python (version 3.6.1) | N/A | https://www.python.org/downloads/release/python-361/ |
| DAVID Bioinformatics Resources 6.7 | Huang et al., 2009a, 2009b | https://david.ncifcrf.gov/ |
| DESeq2 | Love et al., 2014 | https://bioconductor.org/packages/release/bioc/html/DESeq2.html |
| Prism 7.0 | GraphPad | https://www.graphpad.com/scientific-software/prism/ |
Highlights.
Light synchronizes circadian clocks in absence of other Bmal1-dependent clocks
Synchronization of circadian clocks by light does not rely on rhythmic feeding
In absence of light, circadian synchronization requires non-tissue-autonomous Bmal1
Epidermal Bmal1 partly sustains homeostasis in arrhythmic, prematurely aging mice
Acknowledgments
We thank Manolis Pasparakis for kindly providing us with the liver-specific Alfp-Cre mouse line. Research in the lab of S.A.B. is supported by the European Research Council (ERC), the government of Cataluña (SGR grant), the government of Spain (MINECO), and the Fundación Botín and Banco Santander through Santander Universities. P.-S.W. was supported by an EMBO long-term fellowship and by a Juan de la Cierva fellowship from the Spanish MINECO. V.M.Z. has received financial support through the “la Caixa” INPhINIT Fellowship Grant for Doctoral Studies at Spanish Research Centers of Excellence, “la Caixa” Foundation, Barcelona (ID 100010434). The fellowship code is LCF/BQ/IN17/11620018. The project has received funding from the European Union’s Horizon 2020 research and innovation program under the Marie Skłodowska-Curie grant agreement no. 713673. A.S. was supported by a MINECO grant. I.M.G. was supported by a MMRES fellowship from the Barcelona Institute of Science and Technology (BIST). K.K. was supported by a postdoctoral fellowship from the Japan Society for the Promotion of Science (JSPS). K.B.K. was supported by a postdoctoral fellowship from NIH-NINDS, T32 5T32NS045540. The CNIC is supported by the MINECO and the Pro-CNIC Foundation and is a Severo Ochoa Center of Excellence (MINECO award SEV-2015-0505). IRB Barcelona is the recipient of a Severo Ochoa Award of Excellence from MINECO (Government of Spain). We thank Veronica Raker for manuscript editing.
Footnotes
Declaration of Interests
The authors declare no competing interests.
Light can synchronize circadian clocks within the epidermis in the absence of BMAL1-driven clocks in all other tissues.
Supplemental Information
Supplemental Information can be found online at https://doi.org/10.1016/j.cell.2019.05.009.
References
- Albrecht U, Timing to perfection: the biology of central and peripheral circadian clocks, Neuron 74, 2012, 246–260. [DOI] [PubMed] [Google Scholar]
- Bankhead P, Loughrey MB, Fernández JA, Dombrowski Y, McArt DG, Dunne PD, McQuaid S, Gray RT, Murray LJ, Coleman HG, et al. , QuPath: Open source software for digital pathology image analysis, Sci. Rep. 7, 2017, 16878. [DOI] [PMC free article] [PubMed] [Google Scholar]
- Bechtold DA and Loudon AS, Hypothalamic clocks and rhythms in feeding behaviour, Trends Neurosci. 36, 2013, 74–82. [DOI] [PubMed] [Google Scholar]
- Bolger AM, Lohse M and Usadel B, Trimmomatic: a flexible trimmer for Illumina sequence data, Bioinformatics 30, 2014, 2114–2120. [DOI] [PMC free article] [PubMed] [Google Scholar]
- Bunger MK, Wilsbacher LD, Moran SM, Clendenin C, Radcliffe LA, Hogenesch JB, Simon MC, Takahashi JS and Bradfield CA, Mop3 is an essential component of the master circadian pacemaker in mammals, Cell 103, 2000, 1009–1017. [DOI] [PMC free article] [PubMed] [Google Scholar]
- Damiola F, Le Minh N, Preitner N, Kornmann B, Fleury-Olela F and Schibler U, Restricted feeding uncouples circadian oscillators in peripheral tissues from the central pacemaker in the suprachiasmatic nucleus, Genes Dev. 14, 2000, 2950–2961. [DOI] [PMC free article] [PubMed] [Google Scholar]
- Dang F, Sun X, Ma X, Wu R, Zhang D, Chen Y, Xu Q, Wu Y and Liu Y, Insulin post-transcriptionally modulates Bmal1 protein to affect the hepatic circadian clock, Nat. Commun 7, 2016, 12696. [DOI] [PMC free article] [PubMed] [Google Scholar]
- Dibner C, Schibler U and Albrecht U, The mammalian circadian timing system: organization and coordination of central and peripheral clocks, Annu. Rev. Physiol. 72, 2010, 517–549. [DOI] [PubMed] [Google Scholar]
- Ezagouri S and Asher G, Circadian control of mitochondrial dynamics and functions, Curr. Opin. Physiol. 5, 2018, 25–29. [Google Scholar]
- Fan SM, Chang YT, Chen CL, Wang WH, Pan MK, Chen WP, Huang WY, Xu Z, Huang HE, Chen T, et al. , External light activates hair follicle stem cells through eyes via an ipRGC-SCN-sympathetic neural pathway, Proc Natl. Acad. Sci. USA 115, 2018, E6880–E6889. [DOI] [PMC free article] [PubMed] [Google Scholar]
- Geyfman M, Kumar V, Liu Q, Ruiz R, Gordon W, Espitia F, Cam E, Millar SE, Smyth P, Ihler A, et al. , Brain and muscle Arnt-like protein-1 (BMAL1) controls circadian cell proliferation and susceptibility to UVB-induced DNA damage in the epidermis, Proc. Natl. Acad. Sci. USA 109, 2012, 11758–11763. [DOI] [PMC free article] [PubMed] [Google Scholar]
- Haltaufderhyde K, Ozdeslik RN, Wicks NL, Najera JA and Oancea E, Opsin expression in human epidermal skin, Photochem. Photobiol. 91, 2015, 117–123. [DOI] [PMC free article] [PubMed] [Google Scholar]
- Hamada T, Sutherland K, Ishikawa M, Miyamoto N, Honma S, Shirato H and Honma K, In vivo imaging of clock gene expression in multiple tissues of freely moving mice, Nat. Commun 7, 2016, 11705. [DOI] [PMC free article] [PubMed] [Google Scholar]
- Hanoun M, Maryanovich M, Arnal-Estapé A and Frenette PS, Neural regulation of hematopoiesis, inflammation, and cancer, Neuron 86, 2015, 360–373. [DOI] [PMC free article] [PubMed] [Google Scholar]
- Hirayama J, Sahar S, Grimaldi B, Tamaru T, Takamatsu K, Nakahata Y and Sassone-Corsi P, CLOCK-mediated acetylation of BMAL1 controls circadian function, Nature 450, 2007, 1086–1090. [DOI] [PubMed] [Google Scholar]
- Huang W, Sherman BT and Lempicki RA, Bioinformatics enrichment tools: paths toward the comprehensive functional analysis of large gene lists, Nucleic Acids Res. 37, 2009a, 1–13. [DOI] [PMC free article] [PubMed] [Google Scholar]
- Huang W, Sherman BT and Lempicki RA, Systematic and integrative analysis of large gene lists using DAVID bioinformatics resources, Nat. Protoc 4, 2009b, 44–57. [DOI] [PubMed] [Google Scholar]
- Hughes ME, Hogenesch JB and Kornacker K, JTK_CYCLE: an efficient nonparametric algorithm for detecting rhythmic components in genome-scale data sets, J. Biol. Rhythms 25, 2010, 372–380. [DOI] [PMC free article] [PubMed] [Google Scholar]
- Husse J, Leliavski A, Tsang AH, Oster H and Eichele G, The light-dark cycle controls peripheral rhythmicity in mice with a genetically ablated suprachiasmatic nucleus clock, FASEB J. 28, 2014, 4950–4960. [DOI] [PubMed] [Google Scholar]
- Husse J, Eichele G and Oster H, Synchronization of the mammalian circadian timing system: Light can control peripheral clocks independently of the SCN clock: alternate routes of entrainment optimize the alignment of the body’s circadian clock network with external time, BioEssays 37, 2015, 1119–1128. [DOI] [PMC free article] [PubMed] [Google Scholar]
- Izumo M, Pejchal M, Schook AC, Lange RP, Walisser JA, Sato TR, Wang X, Bradfield CA and Takahashi JS, Differential effects of light and feeding on circadian organization of peripheral clocks in a forebrain Bmal1 mutant, eLife 3, 2014. [DOI] [PMC free article] [PubMed] [Google Scholar]
- Jacobi D, Liu S, Burkewitz K, Kory N, Knudsen NH, Alexander RK, Unluturk U, Li X, Kong X, Hyde AL, et al. , Hepatic Bmal1 Regulates Rhythmic Mitochondrial Dynamics and Promotes Metabolic Fitness, Cell Metab. 22, 2015, 709–720. [DOI] [PMC free article] [PubMed] [Google Scholar]
- Janich P, Pascual G, Merlos-Suárez A, Batlle E, Ripperger J, Albrecht U, Cheng HY, Obrietan K, Di Croce L and Benitah SA, The circadian molecular clock creates epidermal stem cell heterogeneity, Nature 480, 2011, 209–214. [DOI] [PubMed] [Google Scholar]
- Janich P, Toufighi K, Solanas G, Luis NM, Minkwitz S, Serrano L, Lehner B and Benitah SA, Human epidermal stem cell function is regulated by circadian oscillations, Cell Stem Cell 13, 2013, 745–753. [DOI] [PubMed] [Google Scholar]
- Janich P, Meng QJ and Benitah SA, Circadian control of tissue homeostasis and adult stem cells, Curr. Opin. Cell Biol. 31, 2014, 8–15. [DOI] [PubMed] [Google Scholar]
- Joost S, Zeisel A, Jacob T, Sun X, La Manno G, Lönnerberg P, Linnarsson S and Kasper M, Single-Cell Transcriptomics Reveals that Differentiation and Spatial Signatures Shape Epidermal and Hair Follicle Heterogeneity Cell Syst. 3, 2016, 221–237. [DOI] [PMC free article] [PubMed] [Google Scholar]
- Kellendonk C, Opherk C, Anlag K, Schütz G and Tronche F, Hepatocyte-specific expression of Cre recombinase, Genesis 26, 2000, 151–153. [DOI] [PubMed] [Google Scholar]
- Kim D, Pertea G, Trapnell C, Pimentel H, Kelley R and Salzberg SL, TopHat2: accurate alignment of transcriptomes in the presence of insertions, deletions and gene fusions, Genome Biol. 14, 2013a, R36. [DOI] [PMC free article] [PubMed] [Google Scholar]
- Kim HJ, Son ED, Jung JY, Choi H, Lee TR and Shin DW, Violet light down-regulates the expression of specific differentiation markers through Rhodopsin in normal human epidermal keratinocytes, PLoS ONE 8, 2013b, e73678. [DOI] [PMC free article] [PubMed] [Google Scholar]
- Kojima D, Mori S, Torii M, Wada A, Morishita R and Fukada Y, UV-sensitive photoreceptor protein OPN5 in humans and mice, PLoS ONE 6, 2011, e26388. [DOI] [PMC free article] [PubMed] [Google Scholar]
- Kondratov RV, Kondratova AA, Gorbacheva VY, Vykhovanets OV and Antoch MP, Early aging and age-related pathologies in mice deficient in BMAL1, the core componentof the circadian clock, Genes Dev. 20, 2006, 1868–1873. [DOI] [PMC free article] [PubMed] [Google Scholar]
- Koronowski KB, Kinouchi K, Welz P-S, Smith JG, Zinna VM, Shi J, Samad M, Chen S, Magnan CN, Kinchen JM, et al. , Defining the Independence of the Liver Circadian Clock, Cell 177, 2019, this issue, XXX–XXX. [DOI] [PMC free article] [PubMed] [Google Scholar]
- Lipton JO, Yuan ED, Boyle LM, Ebrahimi-Fakhari D, Kwiatkowski E, Nathan A, Güttler T, Davis F, Asara JM and Sahin M, The Circadian Protein BMAL1 Regulates Translation in Response to S6K1-Mediated Phosphorylation, Cell 161, 2015, 1138–1151. [DOI] [PMC free article] [PubMed] [Google Scholar]
- Love MI, Huber W and Anders S, Moderated estimation of fold change and dispersion for RNA-seq data with DESeq2, Genome Biol. 15, 2014, 550. [DOI] [PMC free article] [PubMed] [Google Scholar]
- Masri S, Papagiannakopoulos T, Kinouchi K, Liu Y, Cervantes M, Baldi P, Jacks T and Sassone-Corsi P, Lung Adenocarcinoma Distally Rewires Hepatic Circadian Homeostasis, Cell 165, 2016, 896–909. [DOI] [PMC free article] [PubMed] [Google Scholar]
- Nagoshi E, Saini C, Bauer C, Laroche T, Naef F and Schibler U, Circadian gene expression in individual fibroblasts: cell-autonomous and self-sustained oscillators pass time to daughter cells, Cell 119, 2004, 693–705. [DOI] [PubMed] [Google Scholar]
- Partch CL, Green CB and Takahashi JS, Molecular architecture of the mammalian circadian clock, Trends Cell Biol. 24, 2014, 90–99. [DOI] [PMC free article] [PubMed] [Google Scholar]
- Peek CB, Affinati AH, Ramsey KM, Kuo HY, Yu W, Sena LA, Ilkayeva O, Marcheva B, Kobayashi Y, Omura C, et al. , Circadian clock NAD+ cycle drives mitochondrial oxidative metabolism in mice, Science 342, 2013, 1243417. [DOI] [PMC free article] [PubMed] [Google Scholar]
- Puram RV, Kowalczyk MS, de Boer CG, Schneider RK, Miller PG, McConkey M, Tothova Z, Tejero H, Heckl D, Järås M, et al. , Core Circadian Clock Genes Regulate Leukemia Stem Cells in AML, Cell 165, 2016, 303–316. [DOI] [PMC free article] [PubMed] [Google Scholar]
- Roenneberg T and Merrow M, The Circadian Clock and Human Health, Curr. Biol. 26, 2016, R432–R443. [DOI] [PubMed] [Google Scholar]
- Saini C, Suter DM, Liani A, Gos P and Schibler U, The mammalian circadian timing system: synchronization of peripheral clocks, Cold Spring Harb. Symp. Quant. Biol. 76, 2011, 39–47. [DOI] [PubMed] [Google Scholar]
- Saini C, Liani A, Curie T, Gos P, Kreppel F, Emmenegger Y, Bonacina L, Wolf JP, Poget YA, Franken P and Schibler U, Real-time recording of circadian liver gene expression in freely moving mice reveals the phase-setting behavior of hepatocyte clocks, Genes Dev. 27, 2013, 1526–1536. [DOI] [PMC free article] [PubMed] [Google Scholar]
- Sato S, Solanas G, Peixoto FO, Bee L, Symeonidi A, Schmidt MS, Brenner C, Masri S, Benitah SA and Sassone-Corsi P, Circadian Reprogramming in the Liver Identifies Metabolic Pathways of Aging, Cell 170, 2017, 664–677. [DOI] [PMC free article] [PubMed] [Google Scholar]
- Solanas G, Peixoto FO, Perdiguero E, Jardí M, Ruiz-Bonilla V, Datta D, Symeonidi A, Castellanos A, Welz PS, Caballero JM, et al. , Aged Stem Cells Reprogram Their Daily Rhythmic Functions to Adapt to Stress, Cell 170, 2017, 678–692. [DOI] [PubMed] [Google Scholar]
- Stringari C, Wang H, Geyfman M, Crosignani V, Kumar V, Takahashi JS, Andersen B and Gratton E, In vivo single-cell detection of metabolic oscillations in stem cells, Cell Rep. 10, 2015, 1–7. [DOI] [PMC free article] [PubMed] [Google Scholar]
- Tahara Y, Kuroda H, Saito K, Nakajima Y, Kubo Y, Ohnishi N, Seo Y, Otsuka M, Fuse Y, Ohura Y, et al. , In vivo monitoring of peripheral circadian clocks in the mouse, Curr. Biol 22, 2012, 1029–1034. [DOI] [PubMed] [Google Scholar]
- Takahashi JS, Transcriptional architecture of the mammalian circadian clock, Nat. Rev. Genet 18, 2017, 164–179. [DOI] [PMC free article] [PubMed] [Google Scholar]
- Vasioukhin V, Degenstein L, Wise B and Fuchs E, The magical touch: genome targeting in epidermal stem cells induced by tamoxifen application to mouse skin, Proc. Natl. Acad. Sci. USA 96, 1999, 8551–8556. [DOI] [PMC free article] [PubMed] [Google Scholar]
Associated Data
This section collects any data citations, data availability statements, or supplementary materials included in this article.
Supplementary Materials
Table S1. GO Term Analysis for L/D Experiment, Related to Figure 2
Table S2. GO Term Analysis for D/D Experiment, Related to Figure 4
Table S3. RNA Sequencing Data and JTK_CYCLE Output for L/D Experiment, Related to Figures 1 and 2
Table S4. RNA Sequencing Data and JTK_CYCLE Output for D/D Experiment, Related to Figures 4 and S4
Table S5. Primer Sequences, Related to STAR Methods
Data Availability Statement
Datasets generated and/or analyzed to support this study have been deposited online in the Gene Expression Omnibus (GEO) under accession number GEO: GSE115104 (L/D experiment, Figures 1, 2, 5, and S2) and GEO: GSE114943 (D/D experiment, Figures 4, S4, and S5).