

Abstract
Introduction
Diagnosis of Alzheimer's disease (AD) based on amyloid beta (A), pathologic tau (T), and neurodegeneration (N) biomarkers in peripheral fluids promises to accelerate clinical trials and intercept disease earlier.
Methods
Qualification of a Simoa plasma p217+tau assay was performed, followed by clinical utility evaluation in a cohort of 227 subjects with broad A and T spectrum.
Results
The p217+tau plasma assay was accurate, precise, dilution linear, and highly sensitive. All measured samples were within linear range of the assay, presented higher concentration in AD versus healthy controls (P < .0001), and plasma and cerebrospinal fluid levels correlated (r2 = 0.35). The plasma p217+tau results were predictive of central T and A status (area under the curve = 0.90 and 0.90, respectively) with low false +/– rates.
Discussion
The assay described here exhibits good technical performance and shows potential as a highly accurate peripheral biomarker for A or T status in AD and cognitively normal subjects.
Keywords: Alzheimer's disease, biomarker, p212tau, p217tau, phosphorylation, plasma, tau
1. INTRODUCTION
More than five million people in the United States are living with Alzheimer's disease (AD), and the number is growing with an aging population. Indeed, 10% of people over age 65 have AD, and it is the fifth leading cause of death in this population. 1 , 2 Overall AD is the sixth leading cause of death in the United States (one in three seniors die with AD or another dementia), and it is estimated to have cost the United States $305 billion in 2020. 3 Early and accurate diagnosis and staging are deemed critical to managing, and possibly treating, AD symptoms. Clinical trials of potential disease‐modifying therapeutics are often focused on identifying subjects prior to overt symptoms. Identifying and staging these pre‐symptomatic subjects with high accuracy is currently one of the most challenging aspects of AD trials.
Numerous biochemical changes can be detected up to 20 years before onset of symptoms of AD, which has led to the ATN research framework for diagnosing and staging AD based on amyloid (A), tau (T), and neurodegeneration (N) measurements. 4 Tau positron emission tomography (PET) has emerged as the gold standard for measuring tau neurofibrillary tangle (NFT) pathology in patients, 5 , 6 , 7 and the US Food and Drug Administration recently approved Tauvid (flortaucipir F18) for this purpose. However, tau PET is expensive and global manufacturing of the radiotracers is challenging. Cerebrospinal fluid (CSF) phosphorylated tau (p‐tau), and neurofilament light chain (NfL) are commonly used biomarkers for T and N, respectively, and they may complement tau PET and magnetic resonance imaging (MRI). 8 , 9 However, these tests require lumbar punctures, which complicates testing.
Less invasive and expensive measures for ATN promise to dramatically increase screening and staging of AD and as such many reports of blood‐based amyloid, tau, and NfL assays have been reported, with varying levels of clinical relevance. It is often unclear which particular form of amyloid, tau, or NfL is the best analyte in blood and a logical approach is to apply lessons learned from CSF, and then explore plasma or serum assays targeting this form of the analyte.
Tau has > 30 potential phosphorylation sites, and it is not clear which epitope might be the most reflective of disease stage. 10 The most commonly used form is p181tau, perhaps due to its relatively high abundance, yet current assays show only a modest dynamic range from healthy controls (HC) to AD (3–5x) and do not show p181tau elevation until some years after amyloid PET levels begin to increase. 11 , 12 , 13 Mass spectrometry (MS)‐based methods to scan tau phosphorylation intensity across the AD spectrum have suggested other sites may be further upregulated in disease, including phosphorylation of threonines 212 and 217. 14 , 15 , 16 , 17 Enzyme‐linked immunosorbent assay (ELISA) methods to measure p217tau in CSF have been recently reported, confirming that this tau species has a larger percent increase in AD than p181tau, may be perturbed earlier in the disease process, and is particularly specific to AD versus other neurodegenerative conditions. 18 , 19 , 20 In particular the CSF p217+tau Simoa assay, which uses the p217+tau‐targeted monoclonal antibody (mAb) PT3, paired with HT43 mAb (anti‐N‐terminal tau), is highly sensitive, precise, accurate, dilution linear, and revealed robust increases in AD subjects. 19
Here we show that our CSF p217+tau assay in its original form is not suitable for use in plasma, due to substantial matrix interference. A new assay was thus developed to increase sensitivity and stringency, followed by technical validation. The new plasma p217+tau assay measured all samples, HC to AD, in the linear range and with good precision and dilution linearity, indicating it is fit for purpose. Interestingly, the signal is higher in plasma than serum and reveals comparable tau fragmentation as in CSF. The plasma p217+tau signal is higher in AD than HC, correlates moderately with CSF p217+tau, and predicts CSF A and T status with high accuracy. The work presented here suggests that the plasma p217+tau assay is useful for prescreening subjects for AD clinical trials and may even serve as a peripheral pharmacodynamic marker assay.
RESEARCH IN CONTEXT
Systematic review: The authors reviewed the literature using traditional sources (e.g., PubMed, abstracts, presentations). The understanding of tau as a biomarker in Alzheimer's disease (AD) has progressed rapidly, with consensus that specific phosphorylated tau (p‐tau) forms may be particularly relevant for AD diagnosis and progression tracking, and that measures in plasma may be possible. These relevant citations are appropriately cited.
Interpretation: Our findings are consistent with recent reports that accurate prediction of amyloid and tau status from plasma is now possible via highly sensitive and stringent probing of p217tau in blood. Our report adds further understanding of plasma p217's nature and utility via the assay's sensitivity to quantify analyte even in control subjects.
Future directions: This novel method for predicting amyloid and tau status could one day be used for clinical trial enrollment and early detection of AD. To enable this, further study will focus on comparison to positron emission tomography, cognitive decline, and AD specificity.
2. MATERIALS AND METHODS
2.1. Human biosamples
Matching plasma, serum, and CSF samples for pilot studies (Figures 1 and 5 [HC subjects]) were purchased from PrecisionMed (cohorts 7009 and 8009) with informed consent for use in assay development.
FIGURE 1.
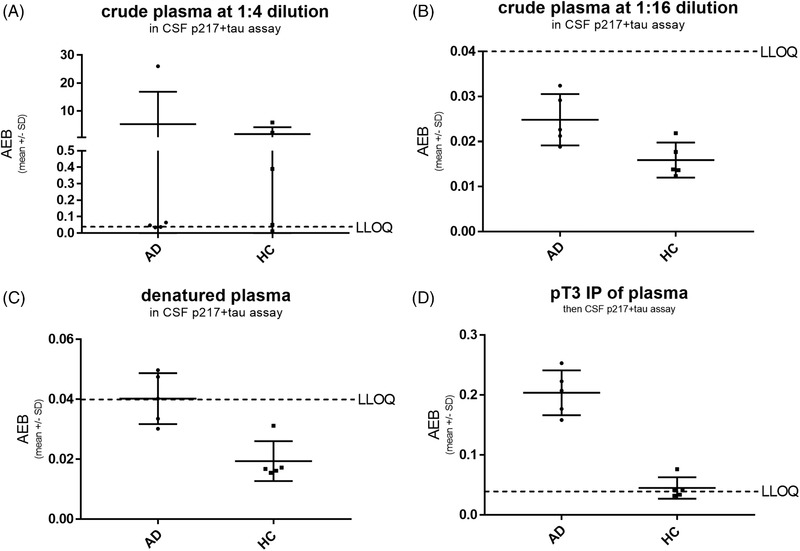
Cerebrospinal fluid (CSF) p217+tau assay fails technical validation in plasma, due to interference and insufficient sensitivity. A panel of five healthy control (HC) and five Alzheimer's disease (AD) plasma sample was tested at 1:4 (A) and 1:16 (B) dilution in the CSF p217+tau “short” assay, revealing most samples were < lower limit of quantitation (LLOQ; average enzyme per bead [AEB] = signal = 0.04). Outlier high‐signal samples at 1:4 dilution were reduced to < LLOQ at 1:16 dilution, indicating lack of dilution linearity. Denaturing plasma via acid/heat technique also reduced all outlier high signal (C). Immunoprecipitation of plasma with anti‐p217+tau monoclonal antibodies mAb prior to measurement with CSF 217+tau assay reveals higher sample in all AD samples (D)
FIGURE 5.
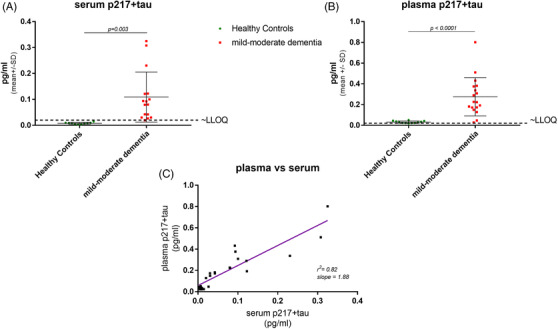
p217+tau found at ≈2x higher levels in plasma versus serum. A set of matching (A) serum and (B) plasma from 10 healthy controls and 16 mild‐to‐moderate dementia subjects was measured with the p217+tau assay. In each sample type significantly higher average concentration was seen in mild‐to‐moderate dementia subjects versus healthy controls. However, the plasma samples reported ~2x the concentration of the serum samples (C)
Matching plasma, serum, and CSF samples from 21 mild‐to‐moderate dementia subjects for follow‐up and development studies (Figures 2, 4, 5 [AD subjects], and 8A) were obtained from Janssen clinical trial AAB‐001‐201 (demographics shown in Table S1 in supporting information) with informed consent for use in study and development of biomarker assays for AD.
FIGURE 2.
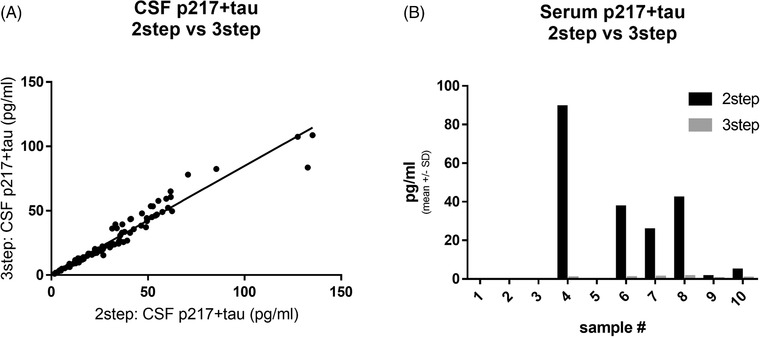
Three‐step p217+tau assay abolishes artifact signal in blood. A, A panel of 96 cerebrospinal fluid (CSF) samples was measured with two‐step p217+tau assay and three‐step p217+tau assay, revealing tight correlation (r2 = 0.939). B, A panel of 10 serum samples was measured with two‐step and three‐step p217+tau assays, revealing outlier high signal in at least four samples in two‐step assay but not in the three‐step assay
FIGURE 4.
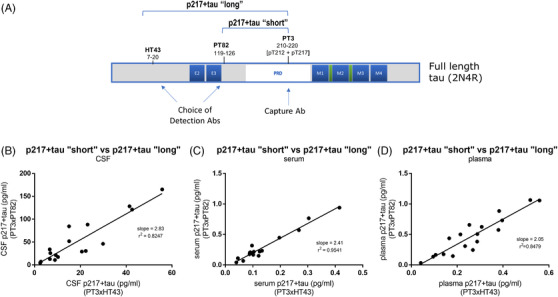
p217+tau fragmentation in blood may be similar extent to that in cerebrospinal fluid (CSF). A, Schematic showing epitopes of the Abs used in the p217+tau “short” (PT3xPT82) and p217+tau “long” (PT3xHT43) assays. A set of matching (B) CSF, (C) serum, and (D) plasma from 18 subjects with mild‐to‐moderate dementia was measured with the p217+tau “short” and p217+tau “long” assays. In each sample type the p217+tau “short” assay reported ≈2x the concentration of the p217+tau “long” assay, indicating the fragmentation level between these epitopes may be similar in these three sample types
FIGURE 8.
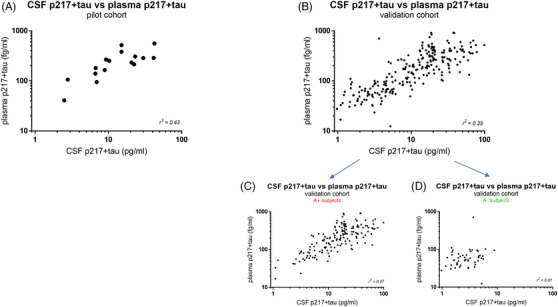
Plasma p217+tau correlates moderately with cerebrospinal fluid (CSF) p217+tau. A, Matching CSF and plasma from a pilot cohort of 16 amyloid‐positive subjects with dementia were measured with the respective p217+tau assays, revealing a moderate positive correlation (r2 = 0.43). B, Matching CSF and plasma from the validation cohort (n = 227 subjects; 69% mild‐to‐moderate dementia, 31% cognitively normal) was measured with the respective p217+tau assays, confirming the moderate positive correlation (r2 = 0.35). The validation cohort data was separated into subjects that were amyloid (C) positive (n = 160) or (D) negative (n = 50), revealing that the CSF:plasma correlation was only seen in amyloid‐positive subjects (r2 = 0.27 versus 0.01 for A+ vs. A– subjects). CSF amyloid data was not available for the remaining 17 subjects in the validation cohort so are not present in panels C or D
Matching plasma and CSF samples from 227 subjects for the validation cohort (Figures 7, 8B, 9, and 10) were obtained from Janssen clinical trials ELN11572301/302 (subjects with mild‐to‐moderate dementia) and CHARIOT PRO (REGISTRYALZ0001; cognitively normal subjects; demographics shown in Table S2 in supporting information) with informed consent for use in scientific research to better understand AD or to develop tests for AD. Dementia was diagnosed in ELN11572391/302 via National Institute of Neurological and Communicative Disorders and Stroke‐Alzheimer's Disease and Related Disorders Association clinical criteria with concomitant Mini‐Mental State Examination (MMSE) score of 16 to 26; CSF amyloid beta (Aβ_42/40 ratio indicates 81% of these subjects were amyloid positive. The remaining subjects (19%) thus had dementia of unknown cause (non‐AD). 21
FIGURE 7.
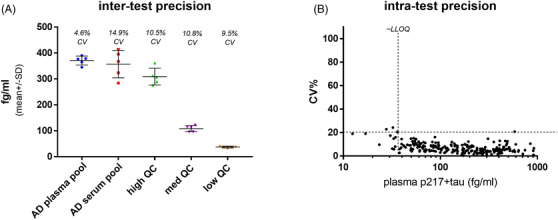
Plasma p217+tau assay reveals good sensitivity and precision. A, A panel of five quality control (QC) samples (1 Alzheimer's disease [AD] plasma pool, 1 AD serum pool, and 3 calibrant‐spiked buffers) were measured on the plasma p217+tau assay on five separate days, revealing good inter‐test precision (5%–15% coefficient of variation (CV)). B, Plasma samples from a validation cohort of 227 subjects (157 mild‐to‐moderate dementia and 70 cognitively normal) were measured with the plasma p217+tau assay, revealing average intra‐test precision of 7.1% CV 98.2% of samples measured with < 20% CV)
FIGURE 9.
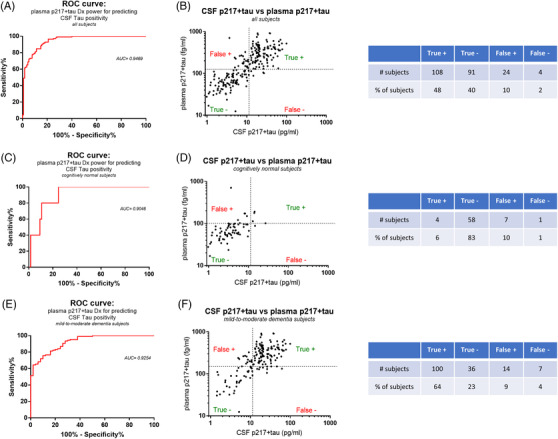
Plasma p217+tau predicts central tau positivity with high accuracy. A, Using a cerebrospinal fluid (CSF) p217+tau cutoff of 11.4 pg/mL for central tau positivity (based on equivalency to Innotest p181 cutoff of 52 pg/mL; Figure S1) the data in Figure 5B was analyzed by receiver operating characteristic (ROC) curve, revealing that the plasma p217+tau data predicted central tau status with high accuracy (area under the curve (AUC) = 0.9419). B, Youden index analysis of the ROC curve resulted in optimal plasma p217+tau cutoff point of124.6 fg/mL. This cutoff achieved low false positive (10%) and false negative (2%) rates for predicting CSF p217+tau status. The AUC and false positive/negative rates were similar when focusing on subjects with dementia (n = 157) (E,F) versus cognitively normal subjects (n = 70) (C,D)
FIGURE 10.
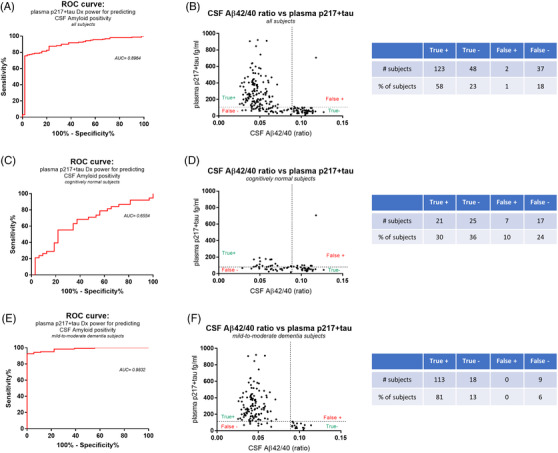
Plasma p217+tau predicts central amyloid positivity with high accuracy. A, Using a cerebrospinal fluid (CSF) amyloid beta (Aβ)42/40 ratio cutoff of 0.089 for central amyloid positivity the data in the Validation cohort (n = 210) was analyzed by receiver operating characteristic (ROC) curve,revealing that the plasma p217+tau data predicted central amyloid status with high accuracy (area under the curve (AUC) = 0.8964). B, Youden index analysis of the ROC curve resulted inoptimal plasma p217+tau cutoff point of 103.9 fg/mL affording the best balance of sensitivity and specificity. This cutoff achieved low false positive (1%) and false negative (18%) rates for predicting CSF amyloid status. The AUC and false positive/negative rates were improved further by focusing on subjects with dementia (n = 140) (E,F) versus cognitively normal subjects (n = 70)(C,D)
Matching plasma and CSF samples from 36 subjects for the plasma extraction and denaturing study (Figure 10) were obtained from PrecisionMed (demographics shown in Table S3 in supporting information) with informed consent for use in assay development.
CSF samples for identifying a CSF p217+tau cutoff for central T positivity (Figure S1 in supporting information) were obtained from Janssen clinical trial ELN11572301/302 (demographics shown in Table S4 in supporting information) with informed consent for use in study and development of biomarker assays for AD.
All CSF samples were from lumbar collections and stored in 0.5 or 2 mL polypropylene tubes at <‐70°C until use. All plasma was from K2 EDTA collection tubes and was stored in 0.5 or 2 mL polypropylene tubes at <‐70°C until use. All serum was stored in 0.5 or 2 mL polypropylene tubes at <‐70°C until use.
2.2. Biochemical reagents
Tris‐Base was obtained from Fisher Scientific (cat#X171‐07). Sodium chloride (NaCl) was obtained from BDH (cat#BDH9286). Triton X‐100 (Tx‐100) was obtained from EMD Millipore (cat#648466). Heterophilic blocker 9 (HBR9) was obtained from Scantibodies Laboratory, Inc. (cat#3KC564). Bovine serum albumin (BSA‐fraction V) was obtained from Millipore (cat#2930). Guanidine hydrochloride (GuHCl) 8 M buffer was obtained from VWR Chemicals (cat#BDH7427‐1). Sodium acetate (NaOAc) was obtained from Sigma‐Aldrich (cat#241245). Trifluoroacetic acid (TFA) was obtained from Sigma‐Aldrich (cat#T6508). C18 reverse phase column was obtained from Waters (cat#WAT020515). Recombinant tau protein (full length aka rhTau441) was obtained from rPeptide (cat#T‐1101‐1).
2.3. ELISA reagents
PT3 mAb (JRD/PT/3; epitope = aa210‐220 of human tau, requiring phosphorylation at aa217 and enhanced binding from additional phosphorylation at aa212), 22 HT43 mAb (JRD/hTau/43; epitope = aa7–20 of human tau), and PT82 (JRD/PT/82; epitope = aa119–126 of human tau) were obtained from Janssen. Because pT3 binding requires phosphorylation at aa217, but is enhanced by concomitant phosphorylation at aa 212, the tau species recognized is termed “p217+tau.” Calibrant peptides for use in the p217+tau assays were produced by New England Peptides; their design is described in Triana‐Balzer et al. 19 All Simoa homebrew reagents and HD‐1 instrument were obtained from Quanterix. CSF p217+tau assay used Simoa homebrew diluent for sample dilution and reagent prep. Plasma p217+tau assay used custom sample diluent (Tris, NaCl, Tx100, 0.45 ug/mL HBR9, 2% BSA). Innotest p181tau, Innotest Aβ42, and Innotest Aβ40 kits were obtained from Fujirebio. For determining amyloid status from CSF an Aβ42/40 ratio < 0.089 = A+.
2.4. Plasma immunoprecipitation method
PT3 mAb was conjugated via NHS chemistry to magnetic beads (Thermo Fisher, cat#88827), then washed 2x with TBS/Tween20, then 1x with PBS/BSA (1%). Beads (50ul) were incubated with 0.5 mL serum for 1.5 hours, then washed 2x with TBS/Tween20 and 1x with water before elution with 75 μl glycine. Eluate was neutralized with 1 M TrisBase (12% by volume) then heated at 85°C for 7 minutes to denature any eluted PT3 mAb. After chilling, the samples were measured at 1:4 dilution in p217+tau assay.
2.5. Plasma tau extraction method
Plasma was mixed with 2.1% perchloric acid (1:4 dilution, hence 1 mL plasma + 3 mL perchloric acid) and incubated for 30 minutes with rocking at room temperature. Samples were centrifuged for 10 minutes at 30,000 x g and supernatants were run through C18 SepPak. The filters were washed with 1% TFA in water, and tau was then eluted with 1% TFA in 70% ethanol. The elutes were made to 30 mM NaCl and taken to dryness in a vacuum concentrator (Explorer Savant, Thermo Fisher). The dried fractions were re‐suspended in plasma p217+tau assay buffer and measured with p217+tau “short” assay.
2.6. Plasma heat denaturing method
Plasma was mixed 0.2 M NaOAc (at 1:3 dilution; hence 150ul plasma + 300 uL NaOAc) then heated at 95°C with 400 rpm mixing for 5 minutes in a Thermomixer (Eppendorf), followed by chilling on wet ice for 10 minutes. Samples were then centrifuged for 10 minutes at 14,000 x g. Supernatant was collected and neutralized with Tris Base (7% by volume) before measurement at 1:2 dilution in plasma p217+tau assay.
2.7. Statistical analyses
All linear correlations were performed with Pearson's model. All comparisons between groups were determined via unpaired parametric students t‐test (Figures 5A,B) or receiver operating characteristic (ROC) curve (Figures 9A,C,E and 10A,C,E). Ideal cutoff concentrations for plasma p217+tau predicting amyloid or tau status were determined using Youden's Index (specificity + sensitivity – 100) (Figures 9B,D,F and 10B,D,F).
3. RESULTS
3.1. CSF p217+tau assay fails technical validation in plasma, due to matrix interference and insufficient sensitivity
The assay developed for measuring p217+tau in CSF 21 was used to measure signal in a panel of five AD and five HC plasma samples. Samples were measured at 1:4 and 1:16 dilution in crude plasma. At 1:4 dilution 6/10 samples measured at or below lower limit of quantitation (LLOQ; signal/noise > 2 and coefficient of variation [CV] < 20%); the other four samples presented markedly higher signal (11‐745x above LLOQ). At 1:16 dilution all samples measured below LLOQ, this indicating that the high signal at 1:4 dilution in the 4/10 subjects noted above was substantially non‐linear and thus can be considered artifact from the plasma matrix (Figure 1A,B). In comparison dilution from 1:4 to 1:128 of CSF yields dilution linear measurements. 19
Plasma was also measured after acid/heat denaturing technique 23 and compared to the 1:4 crude plasma signal. Tau in general, and CSF p217+tau, are known to be heat stable, 19 , 24 yet most interfering substances are not. As seen for total tau in d'Abramo et al., 23 the high p217+tau signal in the 4/10 plasma samples was eliminated after denaturing, again indicating this signal is not true tau signal (Figure 1C). Intriguingly, the 1:16 crude plasma data and the acid/heat denatured plasma data indicated higher signal in AD versus HC, suggesting that steps to eliminate matrix interference can reveal biomarker‐relevant p217+tau signal in plasma. However poor sensitivity precludes using these techniques.
Immunoprecipitation (IP) of p217+tau signal on beads, elution via acid/heat, and then measurement in Simoa CSF p217+tau assay revealed signal above LLOQ in nearly all samples and again higher signal in AD versus HC (Figure 1D). These results indicated that purification and concentration of the plasma p217+tau signal could yield a useful plasma p217+tau assay.
3.2. Three‐step p217+tau assay abolishes artifact signal in blood
To eliminate the laborious and imprecise manual IP step, the three‐step protocol in Simoa was used. The CSF p217+tau uses two‐step protocol (Step 1 = capture mAb agent, sample, and detection mAb agent are mixed then washed, Step 2 = mAb‐sample‐mAb complex and streptavidin‐beta‐galactosidase are mixed). The three‐step protocol is similar but introduces a wash before incubating with the detection agent, thus in essence the first step is an IP. The incubation time and sample volume input for this first step was also increased (original method = 50 uL plasma, incubated with capture beads for 15 minutes; final method = 172 uL plasma, incubated for 35 minutes) to allow maximal capture of signal. A panel of 96 CSF samples was first tested with both the two‐step and the three‐step protocol, revealing high correlation (r2 = 0.94, slope = 0.8) in the two measurements (Figure 2A). A panel of 10 serum samples was measured with both the two‐step and three‐step protocol, revealing that the three‐step method dramatically reduced or even eliminated the high p217+tau signal seen in 6/10 subjects with two‐step method (Figure 2B). This again indicates that there is negligible matrix interference in CSF, but substantial positive interference in blood products. The three‐step method, with time and volume improvements, was thus selected as the blood‐based p217+tau assay.
3.3. Custom sample diluent further reduces matrix interference
The composition of the sample diluent was evaluated to add further stringency to the measurement. The impact of buffer type (PBS vs. Tris), NaCl concentration, and presence of heterophilic blocker (e.g., blocking human anti‐mouse interactions) was measured in terms of impact on artifact serum p217+tau signal and on number of beads detected at the end of the ELISA method. Low number of beads is often indicative of bead clumping and was confirmed here via white light image (data not shown). A panel of three serums was measured, alongside calibrant peptide/diluent as negative control, with eight custom diluent recipes and the Simoa homebrew diluent.
Use of the Simoa homebrew diluent yielded lower bead counts in serums versus calibrant/diluent (1688–2921 vs. 5378). All eight custom diluents improved the beads counts in serum, and substantially reduced artifact signal seen in two serums with Simoa homebrew diluent (Figure 3). Particular improvement was seen when using Tris buffer, lower NaCl concentration, and heterophilic blocker, thus these were selected for the final sample diluent composition.
FIGURE 3.
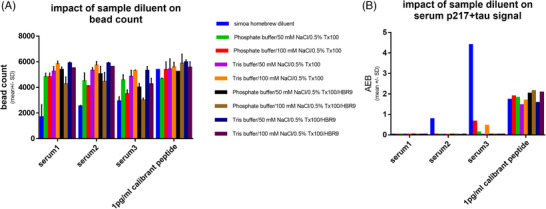
Custom sample diluent reduces bead clumping and artifact signal. A panel of four samples (3 Alzheimer's disease [AD] serum samples and calibrant peptide) were measured in three‐step p217+tau assay after 1:2 dilution in a panel of sample diluents. The diluents varied in (a) base buffer, (b) salt concentration, and (c) presence of heterophilic blocker (HBR9). The diluent impact on (A) bead count and (B) signal was measured, revealing that all custom buffers rescued the low bead count and outlier high signal seen with Simoa homebrew buffer in serum. The ideal diluents were Tris based with HBR9 included. AEB = signal
3.4. p217+tau fragmentation in blood may be of similar extent to that in CSF
CSF tau is known to be highly fragmented and the relative biomarker significance of these unique fragments is not known. 25 , 26 As such, the CSF p217+tau assay was developed in two forms, based on choice of detection mAb PT82 (targets mid‐region) or HT43 (anti‐N‐terminus) to study fragmentation patterns. Use of the former agent measures any p217+tau containing at least the mid‐region aa (119–220) and is thus termed p217+tau “short.” Use of the latter agent measures p217tau species extending further toward the N‐terminus (aa 7‐220), and is thus termed p217+tau “long” (Figure 4A). The p217+tau “short” assay should detect all the same tau molecules as p217+tau “long” and additional shorter forms as well.
Because blood contains many more proteases than CSF we wondered if plasma p217+tau might be more fragmented in the periphery. To characterize the nature of the blood p217+tau signal, we measured a panel of serum, plasma, or CSF samples from 18 AD subjects using the two forms of the p217+tau assay. The CSF revealed good correlation between the two assays (r2 = 0.8247) and ~2x higher concentrations with the p217+tau “short” assay (slope = 2.83). The serum and plasma samples revealed similar pattern (r2 = 0.9541 and 0.8479; slope = 2.41 and 2.05 for serum and plasma, respectively), indicating there is not greater fragmentation between the HT43 and PT82 epitopes (aa20–119) in blood products (Figure 4B,D). Despite the p217+tau “short” assay reporting higher concentrations the p217+tau “long” assay was selected as the final plasma p217+tau assay due to its superior sensitivity (due to lower background signal)
3.5. p217+tau is found at ~2x higher levels in plasma versus serum
To evaluate if choice of blood product might impact the p217+tau measurement a panel of 26 matching serum and plasma samples was measured. Both assays revealed higher signal in subjects with mild‐to‐moderate dementia (n = 16) versus healthy controls (n = 10). However, all the HCs measured < LLOQ in serum, and nearly all (9/10) measured in linear range with plasma (Figures 5A,B). The plasma and serum p217+tau concentration measures correlated well (r2 = 0.82); however, the plasma measurements were on average ~1.9x higher than those in serum (Figure 5C). Therefore, to further enhance the sensitivity of the blood p217+tau assay the matrix of choice was selected as plasma.
3.6. Plasma p217+tau assay has good dynamic range, sensitivity, dilution linearity, and inter‐/intra‐run precision
To assess linear range a calibrant curve spanning 0.005 to 30 pg/mL was measured over five runs. The curves aligned well and reported increasing signal across the entire range, but occasionally saturated at the top point, suggesting 0.005 to 10 pg/mL as the dynamic range for the method (Figure 6A). To evaluate dilution linearity a panel of three AD serums and one AD plasma was tested at 1:2, 1:3, 1:4, 1:5, and 1:6 dilution. Dilution‐corrected concentrations were all within 20% of 1:3 dilution. As such, 1:2 dilution was selected as ideal, to aid in sensitivity (Figure 6B). To evaluate inter‐run precision a panel of five quality control (QC) samples was made and aliquoted: AD plasma pool, AD serum pool, and three concentrations of calibrant peptide. The panel was measured over five runs, revealing good inter‐run precision (5‐15% CV; Figure 7A). To evaluate sensitivity and precision in a typical sample analysis a large cohort of plasma samples (n = 227 subjects aka Validation cohort; 69% mild‐to‐moderate dementia subjects, 31% cognitively normal subjects) was measured in quadruplicate. All samples were detected (presented signal > limit of detection) and with acceptable precision (< 25% CV, mean CV = 7.1%). In fact, 223/227 samples (98.2%) presented with < 20% CV. To better establish a LLOQ a cutoff of 37 fg/mL was set based on the point below which the plasma measurements were more likely to present > 20% CV; 94.7% of all samples measured above this LLOQ (Figure 7B).
FIGURE 6.
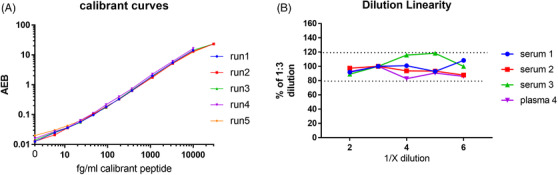
Plasma 217+tau assay has wide dynamic range and good dilution linearity. A, A 12‐point calibrant curve was run on the plasma p217+tau assay on five separate days, revealing consistent signal with a wide dynamic range (5–30,000 fg/mL). B, A panel of Alzheimer's disease (AD) serum and plasma samples (n = 4) were measured in the plasma p217+tau assay at dilutions of 1:2, 1:3, 1:4, 1:5, and 1:6. Dilution corrected concentrations were compared to 1:3 dilution, revealing all dilutions tested were within 20% of each other
3.7. Plasma p217+tau concentration correlates moderately with CSF p217+tau in amyloid‐positive subjects
To compare peripheral (plasma) versus central (CSF) p217+tau measurements a set of matching CSF and plasma samples from a pilot cohort of AD subjects (n=16) was measured, revealing modest positive correlation (r2 = 0.43). Plasma p217+tau concentrations were 1.95 +/– 0.23% (mean+/– standard error of the mean [SEM]) of CSF p217+tau concentrations (Figure 8A). Next, CSF p217+tau from the validation cohort described in Figure 7B was measured, confirming the prior result (r2 = 0.35; plasma p217+tau concentrations = 1.87 +/– 0.11% (mean+/– SEM) of CSF p217+tau concentrations; Figure 8B). Separating the validation cohort by amyloid status (CSF Aβ42/40 ratio < 0.089 = A+) revealed the positive correlation was driven by the amyloid‐positive subjects (r2 = 0.27 vs. 0.01 for A+ vs. A– subjects, respectively) and plasma:CSF p217+tau ratio was slightly, but significantly, lower in the am yloid‐positive cohort (1.63 +/– 0.08% vs. 2.73 +/– 0.39% [mean +/– SEM] for A+ versus A– subjects, P < .0001 using unpaired t‐test; Figure 8C,D).
3.8. Plasma p217+tau assay predicts CSF tau status with high accuracy
To evaluate the utility of the plasma p217+tau assay to predict central tau status we used CSF p181tau as the standard of truth. In the ATN framework Innotest p181tau can be used as the T assay, with p181tau concentration of ≥52 pg/mL = T positive as cutoff. 27 , 28 To establish a CSF p217+tau cutoff, CSF from a cohort of 286 samples (89% A+/mild‐to‐moderate dementia patients) was measured with p181tau and p217+tau assays, determining that Innotest p181tau of 52 pg/ml = Janssen p217+tau “long” of 11.4 pg/mL (Figure S1).
Using CSF p217+tau 11.4 pg/mL as standard of truth cutoff for tau positivity in the validation cohort (Figure 8B) the plasma p217+tau data predicted CSF T status with high accuracy (area under the curve [AUC] = 0.9469; Figure 9A). A Youden index analysis of the ROC curve resulted in optimal plasma p217+tau cutoff point of 124.6 fg/mL, which yielded good performance (sensitivity = 96.43%; specificity = 79.13%; positive predictive value [PPV] = 81.81%; negative predictive value [NPV] 95.79%) and very low false +/– rates [10% and 2%, respectively]; Figure 9B). Separating the cohort into cognitively normal (n = 70) versus mild‐to‐moderate dementia (n = 157) subjects revealed similar predictive power in each subset (CN: AUC = 0.9046, cutoff = 100.9 fg/mL; sensitivity = 80%; specificity = 89.23%; PPV = 36.36%; NPV = 98.31%; false +/– rates = 10% and 1%, respectively; Dementia: AUC = 0.9254, cutoff = 148.6 fg/mL; sensitivity = 93.46%; specificity = 72%; PPV = 87.72%; NPV 83.72%; false +/– rates = 9% and 4%, respectively; Figures 9C‐F).
3.9. Plasma p217+tau assay predicts CSF amyloid status with high accuracy
Because p217tau is reported to be very closely correlated to amyloid levels, 14 , 15 , 16 , 17 we sought to also determine whether the plasma p217+tau assay could predict A status. In the ATN framework CSF Aβ42/40 ratio has been reported as one of the best non‐PET indicators of amyloid status. 29 , 30 , 31
Using Aβ42/40 ratio cutoff of ≤0.089 = A+ as standard of truth (internal data) in the validation cohort the plasma p217+tau data predicted CSF A status with high accuracy (AUC = 0.8964; Figure 10A). A Youden index analysis of the ROC curve resulted in optimal plasma p217+tau cutoff point of 103.9 fg/mL, which yielded good performance (sensitivity = 76.88%; specificity = 96%; PPV = 98.40%; NPV 56.47%) and very low false +/– rates (1% and 18%, respectively; Figure 10B). Separating the cohort into cognitively normal (n = 70) versus mild‐to‐moderate dementia (n = 140) subjects revealed improvement in the predictive accuracy in the dementia cohort (CN: AUC = 0.6554, cutoff = 77.4 fg/mL; sensitivity = 55.26%; specificity = 78.13%; PPV = 75.00%; NPV 59.53%; false +/– rates = 10% and 24%, respectively; Dementia: AUC = 0.9832, cutoff = 112.6 fg/mL; sensitivity = 92.62%; specificity = 100%; PPV = 100%; NPV 66.67%; false +/– rates = 0% and 6%, respectively; Figures 10C‐F).
3.10. Plasma:CSF p217+tau correlation is not improved by biochemical purification
To better understand why the CSF:plasma p217+tau correlation is only moderate (r2 = 0.35, Figure 8B) we again measured a cohort of matching CSF and plasma samples (n = 36), but included a set of the plasmas that had tau chemically extracted and a set of the plasmas that had most non‐tau analytes denatured by heat. If the correlation from crude plasma is based on matrix interference it would be likely that at least one of these biochemical purification techniques might improve the linear correlation coefficient. Instead, the plasma p217+tau to CSF p217+tau correlations were very similar among these three different plasma measurements (r2 = 0.6418, 0.6748, 0.5484 for measurements from crude plasma, extracted plasma, and denatured plasma respectively; Figure S2 in supporting information).
4. DISCUSSION
AD is a devastating condition that has eluded therapeutic intervention attempts for many decades, and is predicted to grow in prevalence. One of the widely held explanations for the numerous clinical trial failures is that earlier intervention in the disease, ideally far before when clinical symptoms present, is needed. However, objectively identifying these subjects is quite difficult. PET imaging and CSF measures of amyloid and tau have recently yielded assays and cutpoints for this identification, but the process is expensive and invasive, and thereby is not efficient for routine trial enrollment. Peripheral measures of amyloid and tau are thus needed to enable early interception of this disease.
CSF p‐tau is believed to be one of the best fluid‐based staging markers of AD, 8 , 9 , 10 , 11 , 12 , 13 and in particular p217tau has emerged as one of the most AD‐specific and ‐enriched species. 14 , 15 , 16 , 17 Indeed, measurement of CSF p217tau by MSD or Simoa methods is sufficiently sensitive to detect the analyte even in healthy controls, and revealed good correlation with tau PET, amyloid PET, and brain volume. 18 , 19 , 20 Translation of these assays to blood has not been straightforward however, due to even lower levels of p217tau in the periphery and added matrix interference in blood products. Indeed, early efforts at measuring tau in blood indicated substantial artifact signal and lack of clinical utility. 23 , 32
Here we describe a highly sensitive, quantitative, robust, and scalable method for measuring p217+tau in human plasma. The method has a dynamic range of 2 to 10,000 fg/mL and reports all plasma samples (including healthy controls) in this linear range. The method has good inter‐ and intra‐test precision (< 20%) and dilution linearity in the range of quantifiable signal (2–6x). The assay uses the Simoa HD‐1/X platform, which has become widely adopted at academic labs and contract research organizations globally and is thus easily transferred to other sites and fully automated to minimize labor and imprecision.
The assay relies on the high affinity and specificity of the PT3 mAb, which recognizes tau phosphorylated at threonine residues 212 and 217. 22 Phosphorylation of amino acid 217 is the minimally required epitope, yet phosphorylation of amino acid 212 enhances binding, and thus the recognition is termed “p217+tau.” As described for the CSF p217+tau assay, measurement of species containing both p212 and p217 may yield additional diagnostic relevance than measurement of just one of these residues. 19 Indeed, while liquid chromatography/mass spectrometry (LC/MS) studies of paired helical filament (PHF) tau revealed monophosphorylated peptides containing pT217 alone, pT212 was only found in peptides that also contained phosphorylation of S214 or T217. 14 Multiphosphorylated tau has been hypothesized to be more pathological, and indeed pT212/pS214 dual phosphorylated tau is the epitope of the “AD‐specific” AT100 mAb. 33 As such it is possible that recognition of the dual epitope pT212/pT217 may afford even greater AD‐specificity than pT217 alone.
Two assays for measuring p217+tau were developed, differing only in their detection antibody, to study potential differences in the diagnostic potential of p217+tau fragments of varying lengths. Because both assays (p217+tau “short” and p217+tau “long”) reveal nearly identical performance and diagnostic potential, the core reagent PT3 appears to be the key element to the assay power. While the p217+tau “short” (PT3xPT82) assay recognizes more tau fragments than the p217+tau “long” (PT3xHT43) assay the latter is more sensitive and so is the recommended format for the plasma p217+tau assay.
Several reports have shown that CSF tau is highly fragmented, mostly via loss of the C‐terminus. Predominantly observed species are comprised of N‐terminal, mid‐region, and select microtubule binding region (MTBR) epitopes, and additional major cleavage sites are likely in the region from aa 70‐120 and at ~aa 224. 15 , 26 , 34 , 35 , 36 Fractionation of CSF prior to assay has shown that CSF p217+tau is also entirely of fragmented nature, lacking C‐terminus and potentially also cleaved between aa7‐119. 19 Here we show, by comparing the p217+tau “short” and p217+tau “long” assay results, that plasma p217+tau may present a similar level of fragmentation in the aa 7‐119 region as in CSF. This finding matches more detailed evaluation of plasma tau using mass spectrometry. 37 This is relevant because there is more protease activity in blood than in CSF, and thus understanding the nature of the signal in blood may be relevant for optimal accuracy and diagnostic potential.
The development of the new plasma p217+tau assay revealed several findings. First, the levels of p217+tau in plasma are ~50x lower than in CSF, and as such additional sensitivity is required. This was achieved by increasing the sample input and incubation time with the capture agent, as well as adding a wash step before introducing the detection agent. The benefit of the added wash step on sensitivity was not obvious, and additionally suggested that there may be negative interference from plasma or serum matrix components on the recognition of tau by the detection agents. Indeed, adding the wash step also dramatically reduced positive matrix interference, presented as artifact high signal in ~20% of samples. This finding may explain why prior plasma tau assay literature often reported lack of significant correlation with CSF or clinical utility. 32 To further reduce the matrix interference the sample diluent composition was explored extensively, settling on a buffer containing a relatively high level of heterophilic blocker (to inhibit human anti‐mouse artifact), stringent detergent (TritonX‐100 instead of routinely used Tween‐20 in immuno‐assays), and blocking agent (2% BSA).
Unexpectedly it was identified that the p217+tau assay reports ~2x higher concentration in ethylenediaminetetraacetic acid (EDTA) plasma versus serum. This finding may reflect proteolysis occurring during the clotting process but should be studied in future experiments. Comparison to lithium, heparin, and anticoagulant citrate dextrose plasma should be evaluated as well. Therefore, currently the suggested sample type for the peripheral p217+tau assay is K2 EDTA plasma.
Clinical relevance of the plasma p217+tau assay for determining central tau positivity was shown via comparison to CSF p217+tau and p181tau. The latter assay is widely used as a marker of tau pathology in the ATN framework, and comparison to a cutoff of 52 pg/mL p181tau (Innotest) revealed that the plasma p217+tau data could predict central T status with very high accuracy (AUC = 0.9419), in line with a recent report on an MSD‐based p217tau assay. 38 , 39 The predictive power was similar in subjects with normal cognition or mild‐to‐moderate dementia. In addition, the plasma p217+tau assay predicted central amyloid positivity, as determined by CSF Aβ42/40 ratio, with very high accuracy (AUC = 0.8964), in line with prior reports with MSD or LC/MS methods. 37 , 38 As such the Simoa plasma p217+tau assay described here could be used as a prescreening tool for AD trial enrollment that requires amyloid or tau positivity; indeed, the plasma p217+tau had very low false positive and negative rates (10% and 2%, respectively, for T positivity; 1% and 18%, respectively for A positivity). Additional study is recommended to confirm these findings and determine ideal cutoffs in various patient populations (e.g., asymptomatic vs. prodromal), particularly via comparison to PET imaging. However, at this point the data presented here and with the MSD p217tau assay indicate that measurement with either of these assays can be an amyloid and tau screening tool, to be confirmed with CSF or PET measures.
In addition to predicting CSF T status in a binary fashion, the plasma p217+tau shows moderate linear correlation with CSF p217+tau (r2 = 0.35). Interestingly this correlation is only seen in amyloid‐positive subjects, in line with the highly AD‐specific nature of the p217 epitope in CSF. 15 , 16 , 19 While CSF p217+tau has been shown to correlate well with amyloid and tau status, it is unknown whether its concentrations are driven by amyloid or tau pathology. Lack of concordance between CSF and plasma p217+tau in amyloid‐negative subjects might reflect lack of pathological regulation of its expression in these subjects or could simply be due to the lack of assay performance in these lowest concentration plasma samples. Further study is needed to delineate which pathology is responsible for the plasma p217+tau levels.
If indeed peripheral p217+tau is of central nervous system (CNS) origin it would be important to understand its transport is passive (e.g., diffusion) or active (e.g., via molecular transporters), and if this transport is impacted across the AD spectrum. As the blood brain barrier (BBB) is thought to be compromised in some AD cases, 40 , 41 , 42 , 43 we hypothesized that the plasma p217+tau/CSF p217+tau ratio would be higher in amyloid‐positive versus ‐negative subjects. Unexpectedly, the opposite was seen (2.73% vs. 1.62% plasma/CSF p217+tau ratio in amyloid‐negative vs. ‐positive subjects). This could be due to plasma p217+tau modifications in AD (e.g., aggregates, fragmentation, dephosphorylation, etc.). Further study to confirm this finding is warranted given the small sample size here, and the extreme sensitivity requirements for accurate quantification of plasma p217+tau in amyloid‐negative subjects. If the result is confirmed, the mechanism for this ratio shift could be relevant to understanding the limitations of relying on plasma for p217+tau measurement.
The lack of stronger correlation between plasma and CSF p217+tau could be due to inaccuracy of one of these measures (likely plasma, due to the greater challenges in its detection) or that the peripheral p217+tau is not entirely of CNS origin or nature (e.g., additional fragmentation, instability, etc.). To evaluate the former possibility, we purified the p217+tau from plasma using chemical extraction or selective denaturing of most non‐tau components. Comparison to CSF p217+tau with these sample types revealed no improvement of the correlation coefficient after either biochemical purification technique. This suggests that the lack of tighter correlation between the CSF and plasma p217+tau measurements may not be due to matrix interference in the latter. It is possible that peripheral p‐tau is not entirely of CNS origin, or is further modified in the periphery. Further study on the nature of peripheral p‐tau is warranted.
To our knowledge the plasma p217+tau assay on Simoa HD‐X platform presented here is one of only two reported immuno‐assays targeting this epitope in plasma, the other being the MSD p217tau assay first reported in 2020. 38 , 39 A direct comparison of these two assays has not been performed on the same sample set, yet some predictions can be made based on the data in these two papers. (1) The MSD assay targets p217 selectively, while the Simoa assay presented here targets p217 and surrounding phosphorylation events, which could yield a more pathologically relevant readout (see above). Indeed, the strategy used in developing the p217+tau assay differs from the LC/MS and other immunoassays in that the core reagent (PT3) was raised against pathological tau (PHF), which circumvents depending on an a priori hypothesis of which tau modifications are most relevant. (2) The MSD assay may not be as sensitive as the Simoa assay, indeed in Palmqvist et al 38 25% of HC subjects and 7% of AD subjects had MSD p217tau plasma measurements below limit of detection, while here we show that all HC and AD subjects had Simoa p217+tau plasma measurements in linear range. (3) The MSD p217tau assay has been more extensively tested, however, and requires a smaller sample volume. (4) The Simoa p217+tau assay is fully automated, meaning less lab time and less opportunity for imprecision; however, maximum sample throughput (133 samples per run when measured in duplicate) is less than with manual assays or other platforms.
Importantly, the clinical sample findings here are largely in line with that reported with the MSD p217tau assay. 38 , 39 For example: plasma p217tau correlates moderately with CSF (r2 = 0.27 here with A+ subjects, and r2 = 0.39 in Palmqvist et al 38 with A+ subjects), leading to high accuracy in predicting central tau status. Second, this correlation is only seen in amyloid‐positive subjects. Third, plasma p217tau is present at ~1% to 2% the levels of CSF p217tau. Finally, plasma p217tau is significantly elevated in AD versus HC, suggesting ability to predict central amyloid status as well. The concordance of our findings with those with the alternate p217tau assay confirms the relevance of this blood‐based biomarker for AD. Additional study of both assays is recommended, ideally in large sample cohorts tested with both assays.
The full diagnostic and staging potential of the plasma p217+tau assay described here is still unknown. Whether p217+tau is AD‐specific or found in other tauopathies should be evaluated further; however, data from the MSD p217tau assay suggests the signal is especially enriched in amyloid‐positive subjects, even when looking in subjects with dementia. Indeed, in CSF other tau assays (e.g., t‐tau, p181tau) do not show elevated signal in several non‐AD tauopathies. 44
We show here that p217+tau is substantially higher in AD versus HC, and thus might be useful as a diagnostic tool. Studies of plasma p217 with MSD assay, or CSF p217+tau by LC/MS or immuno‐assay suggests that this marker may be useful for staging or predicting cognitive decline as well. Evaluation of plasma p217+tau concentration dynamics across the full spectrum of healthy controls to demented AD subjects (or with long‐term longitudinal sampling) is needed. Comparison of plasma p217+tau concentrations to brain tau and amyloid burden as measured by PET and cognitive scores would allow correlation of this peripheral measurement to central tau levels and cognitive function. Indeed, plasma p217tau, as measured by MSD p217tau or LC/MS, has been shown recently to correlate well with tau PET and amyloid PET, and to predict A and T status with superior accuracy to any other blood‐based measurements. 37 , 38 , 39 In summary, the measurement of plasma p217+tau appears to be a highly AD‐specific, accurate, sensitive, and precise method for determining central amyloid and tau status in a non‐invasive manner. Additional characterization and validation of the method is underway, leading to its inclusion in the standard AD clinical trial toolkit in the near future.
CONFLICTS OF INTEREST
G.T.B., S.M., K.V.K., C.T., R.S., M.M., and H.K. are employees of Janssen Research and Development, a pharmaceutical company of Johnson and Johnson.
Supporting information
Supporting Information
Supporting Information
Supporting Information
ACKNOWLEDGMENTS
We thank Imperial College London and the Principal Investigators (Professor Lefkos Middleton and Professor Craig Ritchie) of CHARIOT PRO SubStudy (REGISTRYALZ0001) for collection and storage of human biosamples. We thank Wendy Galpern, Hong Sun, and David Henley (Janssen R&D) for critical review during development of the assay and this manuscript.
Triana‐Baltzer G, Moughadam S, Slemmon R, et al. Development and validation of a high‐sensitivity assay for measuring p217+tau in plasma. Alzheimer's Dement. 2021;13:e12204. 10.1002/dad2.12204
REFERENCES
- 1. Hebert LE, Weuve J, Scherr PA, Evans DA. Alzheimer's disease in the United States (2010‐2050) estimated using the 2010 census. Neurology. 2013;80(19):1778‐1783. [DOI] [PMC free article] [PubMed] [Google Scholar]
- 2. Heron M. Deaths: leading causes for 2016. Natl Vital Stat Rep. 2018;67(6):1‐77. [PubMed] [Google Scholar]
- 3. www.alz.org/alzheimers‐dementia/facts‐figures
- 4. Burnham SC, Coloma PM, Li QX, et al. Application of the NIA‐AA research framework: towards a biological definition of Alzheimer's disease using cerebrospinal fluid biomarkers in the AIBL study. J Prev Alz Dis. 2019;6(4):248‐255. [DOI] [PubMed] [Google Scholar]
- 5. Brier MR, Gordon B, Friedrichsen K, et al. Ances BM (2016) Tau and Aβ imaging, CSF measures, and cognition in Alzheimer's disease. Sci Transl Med. 2016;8(338):338ra66. [DOI] [PMC free article] [PubMed] [Google Scholar]
- 6. Jack CR Jr, Wiste HJ, Schwarz CG, et al. Longitudinal tau PET in ageing and Alzheimer's disease. Brain. 2018;141(5):1517‐1528. [DOI] [PMC free article] [PubMed] [Google Scholar]
- 7. Hanseeuw BJ, Betensky RA, Jacobs HIL, et al. Association of amyloid and tau with cognition in preclinical Alzheimer's disease; a longitudinal study. JAMA. 2019;76(8):915‐924. [DOI] [PMC free article] [PubMed] [Google Scholar]
- 8. Olsson B, Lautner R, Andreasson U, et al. CSF and blood biomarkers for the diagnosis of Alzheimer's disease: a systematic review and meta‐analysis. Lancet Neurol. 2016;15(7):673‐684. [DOI] [PubMed] [Google Scholar]
- 9. Gordon BA, Friedrichsen K, Brier M, et al. The relationship between cerebrospinal fluid biomarkers of Alzheimer pathology and positron emission tomography tau imaging. Brain. 2016;139(Pt8):2249‐2260. [DOI] [PMC free article] [PubMed] [Google Scholar]
- 10. Wang JZ, Liu F. Microtubule‐associated protein tau in development, degeneration and protection of neurons. Prog Neurobiol. 2008;85(2):148‐175. [DOI] [PubMed] [Google Scholar]
- 11. De Riva V, Galloni E, Marcon M, et al. Analysis of combined CSF biomarkers in AD diagnosis. Clin Lab. 2014;60(4):629‐634. [DOI] [PubMed] [Google Scholar]
- 12. Barthelemy NR, Bateman RJ, Hirtz C, et al. Cerebrospinal fluid phospho‐tau T217 outperforms T181 as a biomarker for the differential diagnosis of Alzheimer's disease and PET amyloid‐positive patient identification. Alzheimers Res Ther. 2020;12(1):26. [DOI] [PMC free article] [PubMed] [Google Scholar]
- 13. Barthelemy NR, Li Y, Joseph‐Mathurin N, et al. Dominantly inherited Alzheimer network (2020) a soluble phosphorylated tau signature links tau, amyloid and the evolution of stages of dominantly inherited alzheimer's disease. Nat Med;26(3):398‐407. [DOI] [PMC free article] [PubMed] [Google Scholar]
- 14. Hanger DP, Byers HL, Wray S, et al. Novel phosphorylation sites in tau from Alzheimer brain support a role for casein kinase 1 in disease pathogenesis. J Biol Chem. 2007;282(32):23645‐23654. [DOI] [PubMed] [Google Scholar]
- 15. Barthélemy NR, Gabelle A, Hirtz C, et al. Differential mass spectrometry profiles of tau protein in the cerebrospinal fluid of patients with Alzheimer's disease, progressive supranuclear palsy, and dementia with Lewy bodies. J Alzheimers Dis. 2016;51:1033‐1043. [DOI] [PubMed] [Google Scholar]
- 16. Barthélemy NR, Bateman RJ, Marin P, et al. Tau hyperphosphorylation on T217 in cerebrospinal fluid is specifically associated to amyloid β‐pathology. bioRxiv. 2017. 10.1101/226977. bioRxiv. [DOI] [Google Scholar]
- 17. Sato C, Barthélemy NR, Mawuenyega KG, et al. Tau kinetics in neurons and the human central nervous system. Neuron. 2018;97(6):1284‐1298.e7. [DOI] [PMC free article] [PubMed] [Google Scholar]
- 18. Palmqvist S, Insel PS, Stomrud E, et al. Cerebrospinal fluid and plasma biomarker trajectories with increasing amyloid deposition in Alzheimer's disease. EMBO Mol Med. 2019;11(12):e11170. [DOI] [PMC free article] [PubMed] [Google Scholar]
- 19. Triana‐Baltzer G, Van Kolen K, Theunis C, et al. Development and validation of a high sensitivity assay for measuring p217+tau in cerebrospinal fluid. J Alzheimers Dis. 2020;77(4):1417‐1430. [DOI] [PMC free article] [PubMed] [Google Scholar]
- 20. Janelidze S, Stomrud E, Smith R, et al. Cerebrospinal fluid p‐tau217 performs better than p‐tau181 as a biomarker of Alheimer's disease. Nat Commun. 2020;11(1):1683. [DOI] [PMC free article] [PubMed] [Google Scholar]
- 21. Salloway S, Sperling R, Fox NC, et al. Two phase 3 trials of bapineuzimab in mild‐to‐moderate Alzheimer's disease. N Engl J Med. 2014;370(4):322‐333. [DOI] [PMC free article] [PubMed] [Google Scholar]
- 22. Van Kolen K, Malia TJ, Theunis C, et al. Development and functional characterization of JNJ‐63733657, a humanized anti‐phospho Tau selective monoclonal antibody. J Alzheimers Dis. 2020;77(4):1397‐1416. [DOI] [PubMed] [Google Scholar]
- 23. d'Abramo C, Acker C, Schaachter J, et al. Detecting tau in serum of transgenic animals after tau immunotherapy treatment. Neurobiol Aging. 2016;37:58‐65. [DOI] [PMC free article] [PubMed] [Google Scholar]
- 24. Hernandez MA, Avila J, Andreu JM. Physicochemical characterization of the heat‐stable microtubule‐associated protein MAP2. Eur J Biochem. 1986;154(1):41‐48. [DOI] [PubMed] [Google Scholar]
- 25. Neergard JS, Dragsbaek K, Christiansen C, Karsdal MA, Brix S, Henriksen K. Two novel blood‐based biomarker candidates measuring degradation of tau are associated with dementia: a prospective study. PLoS One. 2018;13(4):e0194802. [DOI] [PMC free article] [PubMed] [Google Scholar]
- 26. Meredith JE, Sankaranarayanan S, Guss V, et al. Characterization of novel CSF Tau and pTau biomarkers for Alzheimer's disease. PLoS One. 2013;8(10):e76523. [DOI] [PMC free article] [PubMed] [Google Scholar]
- 27. Malnar M, Kosicek M, Bene R, et al. Use of cerebrospinal fluid biomarker analysis for improving Alzheimer's disease diagnosis in a non‐specialized setting. Acta Neurobiol Exp (Wars). 2012;72(3):264‐271. [DOI] [PubMed] [Google Scholar]
- 28. Tapiola T, Alafuzoff I, Herukka SK, et al. Cerebrospinal fluid {beta}‐amyloid 42 and tau proteins as biomarkers of Alzheimer‐type pathological changes in the brain. Arch Neurol. 2009(66):382‐389. [DOI] [PubMed] [Google Scholar]
- 29. Baldeiras I, Santana I, Joao Leitao M, et al. Addition of the Aβ42/40 ratio to the cerebrospinal fluid biomarker profile increases the predictive value for underlying Alzheimer's disease dementia in mild cognitive impairment. Alzheimers Res Ther. 2018;10(1):33. 10.1186/s13195-018-0362-2. [DOI] [PMC free article] [PubMed] [Google Scholar]
- 30. Hansson O, Lehmann S, Otto M, Zetterberg H, Lewczuk P. Advantages and disadvantages of the use of the CSF Amyloid β (Aβ) 42/40 ratio in the diagnosis of Alzheimer's Disease. Alzheimers Res Ther. 2019;11(1):34. 10.1186/s13195-019-0485-0. [DOI] [PMC free article] [PubMed] [Google Scholar]
- 31. Alcolea D, Pegueroles J, Munoz L, et al. Agreement of amyloid PET and CSF biomarkers for Alzheimer's disease on Lumipulse. Ann Clin Transl Neurol. 2019;6(9):1815‐1824. [DOI] [PMC free article] [PubMed] [Google Scholar]
- 32. Mattsson N, Zetterberg H, Janelidze S, et al. ADNI investigators (2016) plasma tau in Alzheimer disease. Neurology;87(17):1827‐1835. [DOI] [PMC free article] [PubMed] [Google Scholar]
- 33. Zheng‐Fischhofer QY, Biernat J, Mandelkow EM, Illenberger S, Godemann R, Mandelkow E. Sequential phosphorylation of tau by glycogen synthase kinase‐3beta and protein kinase A at Thr212 and Ser214 generates the Alzheimer‐specific epitope of antibody AT100 and requires a paired‐helical‐filament‐like conformation. Eur J Biochem. 1998;252:542‐552. [DOI] [PubMed] [Google Scholar]
- 34. Barthelemy NR, Fenaille F, Hirtz C, et al. Tau protein quantification in human cerebrospinal fluid by targeted mass spectrometry at high sequence coverage provides insights into its primary structure heterogeneity. J Proteome Res. 2016;15(2):667‐676. [DOI] [PubMed] [Google Scholar]
- 35. Cicognola C, Brinkmalm G, Wahlgren J, et al. Novel tau fragments in cerebrospinal fluid: relation to tangle pathology and cognitive decline in Alzheimer's disease. Acta Neuropathol. 2019;137(2):279‐296. [DOI] [PMC free article] [PubMed] [Google Scholar]
- 36. Horie K, Barthelemy NR, Sato C, Bateman RJ. CSF tau microtubule binding region identifies tau tangle and clinical stages of Alzheimer's disease. Brain. 2021;144(2):515‐527. [DOI] [PMC free article] [PubMed] [Google Scholar]
- 37. Barthélemy NR, Horie K, Sato C, Bateman RJ. Blood plasma phosphorylate‐tau isoforms track CNS change in Alzheimer's disease. J Exp Med. 2020;217(11):e20200861. [DOI] [PMC free article] [PubMed] [Google Scholar]
- 38. Palmqvist S, Janelidze S, Quiroz YT, et al. Discriminative accuracy of plasma phospho‐tau217 for Alzheimer disease versus other neurodegenerative disorders. JAMA. 2020;324(8):772‐781. [DOI] [PMC free article] [PubMed] [Google Scholar]
- 39. Janelidze S, Berron D, Smith R, et al. Associations of plasma phospho‐tau217 levels with tau positron emission tomography in early Alzheimer disease. JAMA Neurol. 2020:e204201. in press. [DOI] [PMC free article] [PubMed] [Google Scholar]
- 40. Daneman R. The blood‐brain barrier in health and disease. Ann Neurol. 2012;72(5):648‐672. [DOI] [PubMed] [Google Scholar]
- 41. Ryu JK, McLarnon JG. A leaky blood‐brain barrier, fibrinogen infiltration and microglial reactivity in inflamed Alzheimer's disease brain. J Cell Mol Med. 2009;13(9A):2911‐2925. [DOI] [PMC free article] [PubMed] [Google Scholar]
- 42. Erickson MA, Banks WA. Blood‐brain barrier dysfunction as a cause and consequence of Alzheimer's disease. J Cereb Blood Flow Metab. 2013;33(10):1500‐1513. [DOI] [PMC free article] [PubMed] [Google Scholar]
- 43. Yamazaki Y, Kanekiyo T. Blood‐brain barrier dysfunction and the pathogenesis of Alzheimer's disease. Int J Mol Sci. 2017;18(9):1965. [DOI] [PMC free article] [PubMed] [Google Scholar]
- 44. Wagshal D, Sankaranarayanan S, Guss V, et al. Divergent CSF tau alterations in two common tauopathies: alzheimer's disease and progressive supranuclear palsy. J Neurol Neurosurg Psychiatry. 2015;86(3):244‐250. [DOI] [PMC free article] [PubMed] [Google Scholar]
Associated Data
This section collects any data citations, data availability statements, or supplementary materials included in this article.
Supplementary Materials
Supporting Information
Supporting Information
Supporting Information