

Abstract
BACKGROUND AND PURPOSE: Monitoring of intraparenchymal brain tissue oxygen tension (PbrO2) is an emerging tool in neurocritical care. The purpose of this study was to determine if there is a relationship between CT perfusion (CTP) imaging parameters and PbrO2.
METHODS: Nineteen patients underwent continuous PbrO2 monitoring with probes placed to target white matter in the cerebral hemisphere. Twenty-two CTP studies were performed at the level of the oxygen electrode, as identified on concurrent nonenhanced CT. CTP analysis software was used to measure mean transit time (MTT) and cerebral blood volume (CBV) and to derive cerebral blood flow (CBF) for a region of interest (ROI) surrounding the oxygen probe. For correlation, PbrO2 levels and other physiologic parameters were recorded at the time of CTP.
RESULTS: PbrO2 values at the time of CTP were 2.7–54.4 mm Hg, MTT was 1.86–5.79 seconds, CBV was 1.18–8.76 mL/100 g, and CBF was 15.2–149.2 mL/100 g/min. MTT but not CBV or CBF was correlated with PbrO2 (r = −0.50, P = .017). MTT, CBV, or CBF were not correlated with other physiologic parameters, including mean arterial pressure, cerebral perfusion pressure, intracranial pressure, and fraction of inspired oxygen. On multivariable analysis, only PbrO2 was independently associated with MTT.
CONCLUSION: CTP assessment of ROI surrounding an oxygen probe in the intraparenchymal brain tissue is feasible and showed a significant correlation between PbrO2 and MTT. Further studies are warranted to determine the role of CTP in assessing acute brain injury and whether it can be used to prospectively identify brain regions at risk for tissue hypoxia that should be targeted for advanced neuromonitoring.
Direct measurement of cerebral oxygenation and metabolism is gaining acceptance as a useful strategy for monitoring secondary ischemic brain injury in neurocritical care. The use of oxygen electrodes in the intraparenchymal brain tissue has been described in a wide range of largely observational clinical research studies in patients with traumatic brain injury and subarachnoid hemorrhage (1–5). Several devices are now commercially available in the United States and in Europe. However, even with the emergence of new technology and monitoring capabilities, important questions remain about their use: What is actually being measured? In which brain region should the probe or probes be placed? Understanding these issues is likely important for clarifying the physiologic nature and clinical importance of local brain tissue oxygen tension (PbrO2).
Current intraparenchymal monitors provide primarily focal measurements of PbrO2, and the desired location for probe placement remains a point of debate. Techniques involve either direct placement in a selected region of the brain at the time of craniotomy or, in most cases, placement done in the intensive care unit by using a standard method that targets the cerebral white matter of one hemisphere. Focal probes such as these are ideally placed in tissue at high risk for secondary brain injury; at present, this placement is assumed on the basis of findings on anatomic neuroimaging (usually CT) and clinical assessment. However, if neuroimaging measures of perfusion or metabolism are correlated with measures obtained from these advanced neuromonitors (such as PbrO2), initial neuroimaging could be used to specifically select the region for probe placement and to assess brain regions that are not monitored.
Dynamic CT perfusion (CTP) imaging is an emerging technique that is increasingly used to evaluate patients with acute ischemic stroke (6, 7). This technique can be performed with most helical CT scanners and allows the assessment of a variety of parameters on one or more axial sections. By injecting contrast material and by performing sequential imaging of the section of interest, the mean transit time of contrast agent through brain tissue (MTT), the cerebral blood volume (CBV), and the cerebral blood flow (CBF) can be evaluated for a region of interest (ROI). However, the use of CTP has not been thoroughly evaluated in patients with other acute brain injuries, such as head trauma or intracerebral hemorrhage. Because of previous work in a swine model in which we found that PbrO2 has carbon dioxide reactivity and pressure autoregulation (8) and because of previous reports in which PbrO2 was correlated with CBF from xenon CT in humans (9, 10), we hypothesized that measures from CTP are correlated with PbrO2 in patients with brain injury. Therefore, we undertook this prospective cohort study to determine the feasibility of using CTP in patients with acute brain injuries who are undergoing monitoring of brain tissue oxygen and to determine whether PbrO2 on advanced neuromonitoring is related to physiologic parameters from CTP.
Methods
Patients with traumatic brain injury or nontraumatic intracerebral hemorrhage who were undergoing monitoring of brain tissue oxygen as part of a larger cohort study of advanced neuromonitoring were eligible for this study. Institutional review board approval was obtained for all aspects of this study. Because the patients were obtunded or comatose, informed consent was obtained from a legally authorized surrogate in all cases. As part of the overall protocol, after brain-tissue oxygen probe was placed, nonenhanced head CT was performed to determine its location. For this nested cohort study, a consecutive sample of subjects undergoing CTP was assembled by performing dynamic CTP at the same time as postplacement CT.
Brain Tissue Oxygen-Probe Placement and Patient Care
All subjects underwent placement of an oxygen electrode (Licox Clarke type; Integra Neurosciences, Plainsboro, NJ) through a multiluminal cranial bolt. The tip of the oxygen electrode was placed approximately 26 mm below the dura into the frontal white matter of either (1) the most affected cerebral hemisphere, as determined on nonenhanced head CT at admission, or (2) the cerebral hemisphere with remaining overlying skull if decompressive hemicraniectomy was performed before probe placement. A concurrent brain temperature probe was placed, and PbrO2 levels were automatically corrected for brain temperature by using the Licox oxygen computer monitor (Licox; Integra Neurosciences). As part of standard care, a ventriculostomy, which was not part of the assembly for the brain oxygen probe, was also placed in each patient to monitor and treat changes in intracranial pressure. Patients with traumatic brain injury received clinical care in accordance with published guidelines (11), as did those with nontraumatic intracerebral hemorrhage (12). In the intensive care unit, physiologic information, including PbrO2, brain temperature, intracranial pressure, arterial blood pressure, heart rate, body temperature, respiratory rate, and fraction of inspired oxygen (FiO2) were recorded at 1-minute intervals by using a locally developed data acquisition system. During CT, these physiologic variables were recorded manually. All patients were intubated and mechanically ventilated, and a transport ventilator was used during their transport to the CT suite to maintain the exact same FiO2 and minute ventilation as those delivered in the intensive care unit. During 18 CTP studies, physiologic parameters were recorded in the CT scanner just before start of the bolus of contrast agent for correlation with CTP-derived parameters. For the other four studies, this information was not collected during CT; therefore, we used physiologic parameters collected just after the patients’ return to the intensive care unit.
CT Protocol
All CT scans were obtained on a single-detector helical scanner (HiSpeed CT/i; GE Medical Systems, Milwaukee, WI). All subjects underwent nonenhanced head CT (axial 5-mm collimation) after placement of a brain-tissue oxygen probe. Because the electrode was visible as a hyperattenuation on CT, the initial images were used to select the level for CTP (Fig 1). Because the oxygen-sensing region spanned 5 mm from the tip of the probe, the axial level corresponding to the most inferior aspect of the probe was used. CTP images were acquired during rapid bolus injection (4 mL/second) of nonionic iodinated contrast agent (Omnipaque 300, 40 mL total; Amersham, Princeton, NJ) via a peripheral (usually forearm) vein. Dynamic (cine) scanning (80 kVp, 200 mA) was repeated at this single axial section (10-mm collimation) after a 5-second delay, for total of 50 images at a rate of one per second. All CTP studies were transferred in DICOM format to an imaging workstation (Advantage Workstation, GE Medical Systems) by means of an optical disk and reviewed by using deconvolution-based CTP analysis software (CT Perfusion2, GE Medical Systems). A single investigator (W.S.S.) who was blinded to brain-tissue oxygen values and other patient characteristics performed all analyses. Standard threshold values in Hounsfield units were used to exclude air and bone (and consequently the metallic tip of the oxygen probe) from analysis. MTT, CBV, and CBF were measured for a standard circular 350-mm2 ROI that encompassed the sensing area of the oxygen probe (Fig 1A). Color maps were created for MTT, CBV, and CBF by using a standard color scale (Fig 1B). For subjects who underwent multiple CT studies after probe placement as part of their regular clinical care, CTP was concurrently performed if possible and the studies included in the dataset.
Fig 1.
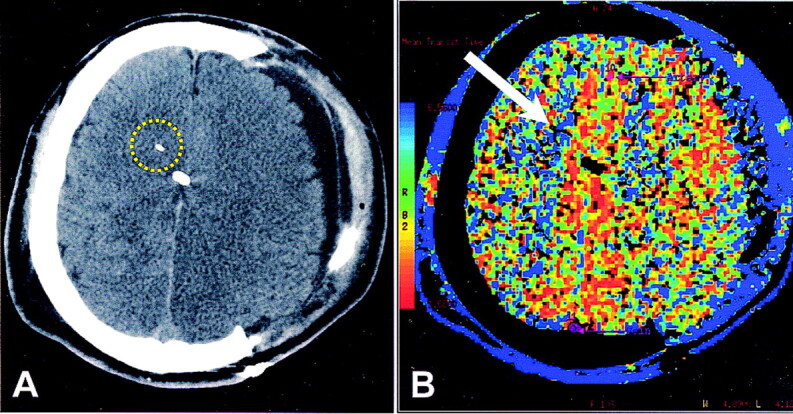
Patient who underwent hemicraniectomy after head trauma.
A, Nonenhanced CT scan shows the tip of the brain-tissue oxygen probe as a white linear attenuation in the right hemispheric white matter. Midline white attenuation is a ventriculostomy catheter. Yellow circle indicates the ROI for CTP analysis.
B, CTP color map of MTT. On the reference bar, blue indicates the slowest MTT. Arrow points to the tip of the oxygen probe. Overall, MTT is decreased on the side of hemicraniectomy, indicating more rapid transit. Surrounding blue rim represents scalp perfusion.
Statistical Analysis
All computer-derived and manually acquired physiologic data and CTP results were entered into a spreadsheet (Excel; Microsoft, Redmond, WA). Mean arterial and cerebral perfusion pressures were calculated from this raw data. Characteristics of the cohort were described as overall frequencies or as the mean ± standard deviation as appropriate. The Pearson product-moment correlation coefficient was determined for the relationship between PbrO2 or other physiologic parameters and MTT, CBV, or CBF, as the distribution for MTT, CBV, CBF, and PbrO2 were approximately normal. Cerebral perfusion pressure and inspired oxygen content have been shown to influence PbrO2 after brain injury (13, 14). Therefore, a multivariable model was developed to ascertain whether these factors influenced any relationship between MTT and PbrO2. Because variables may show correlation between studies performed in the same subject, linear regression tends to cause overestimation of the precision of results. Therefore, generalized estimating equations were used to account for clustering of observations within individuals. The leverage and Cook distance were determined for each data point for the relationship between PbrO2 and MTT to determine whether any data point exerted disproportionate influence on this relationship (15). All statistical analyses were performed by using software (Stata version 8.0; Stata Corp., College Station, TX), and P < .05 indicated a statistically significant difference.
Results
Nineteen subjects (17 men, two women; median age, 45 years; age range, 19–76 years) underwent 22 CTP studies. Fifteen subjects had traumatic brain injury, and four had nontraumatic intracerebral hemorrhage. Time from injury to placement of the brain-tissue oxygen probe was 15 ± 10 hours, and time from probe placement to CTP was 57 ± 51 hours. Table 1 summarizes the physiologic characteristics of the subjects during CTP and their findings.
TABLE 1:
Physiologic variables in 22 subjects during CTP and CTP findings
| Variable | Value |
|---|---|
| Mean arterial pressure (mm Hg) | 98 ± 12 |
| Intracranial pressure (mm Hg) | 15 ± 6 |
| Cerebral perfusion pressure (mm Hg) | 83 ± 11 |
| FiO2 | 0.41 ± 0.12 |
| PbrO2 (mm Hg) | 27.6 ± 13.3 |
| Mean Transit Time (second) | 3.83 ± 1.09 |
| CBV (mL/100 g) | 3.94 ± 1.95 |
| CBF (mL/100 g/min) | 59.7 ± 38.1 |
Note.—Data are the mean ± standard deviation.
PbrO2 values during CTP were 2.7–54.4 mm Hg. On CTP, MTT for the ROI around the brain-tissue oxygen probe was 1.86–5.79 seconds, CBV for this ROI was 1.18–8.76 mL/100 g, and CBF was 15.2–149.2 mL/100 g/min. Despite individual variability, PbrO2 had a significant inverse correlation with MTT (r = −0.50, P = .017) but no relationship with CBV (r = 0.21, P = .36) or CBF (r = 0.27, P = .22) (Fig 2). intracranial pressure, mean arterial pressure, cerebral perfusion pressure, or FiO2 was not significantly related to MTT, CBV, or CBF.
Fig 2.

Plots of PbrO2.
A, PbrO2 is inversely and significantly correlated with MTT (P = .017).
B and C, PbrO2 is not significantly related to CBV or CBF.
Variability in the PbrO2-MTT relationship (Fig 2) suggested that PbrO2 did not entirely account for MTT. Therefore, multivariable analysis was undertaken to determine whether the relationship between PbrO2 and MTT was independent of other physiologic parameters that have been demonstrated to influence PbrO2. In this multivariable model including PbrO2, FiO2, and cerebral perfusion pressure, only PbrO2 was independently associated with MTT on CTP. After we adjusted for FiO2 and cerebral perfusion pressure, each 10-mm Hg decrease in PbrO2 was associated with an increase in MTT of about 0.5 second.
Discussion
To our knowledge, this is the first report of dynamic CTP as a tool for evaluating specific brain ROIs in patients undergoing advanced neuromonitoring after acute brain injury. Others have considered the possibility of using advanced physiologic neuroimaging to validate and correlate measures from intraparenchymal brain metabolic monitors. In two studies of Xe CT for measuring quantitative CBF, PbrO2 varied directly with CBF (9, 10). In a study of positron emission tomography (PET), change in PbrO2 was correlated with change in end-capillary O2 tension despite the lack of correlation between the absolute values of these measures (16). Another group investigated the relationship between oxygen extraction fraction on PET and changes in focal brain chemistry, as measured with intraparenchymal microdialysis; the oxygen extraction fraction and the lactate-to-pyruvate ratio were correlated during hyperventilation (17). Just as each intraparenchymal cerebral metabolic monitor may have strengths and weaknesses, so do each of these various types of physiologic neuroimaging. Additional studies such as ours will help to validate and better elucidate these important invasive and noninvasive technologies.
Strengths and Limitations of CTP
The major strength of CTP is that it is easily performed with most modern CT scanners, and it can be added as a sequence to CT that is already being performed as part of regular clinical care, without the need for additional technical personnel. Because contrast material is injected intravenously, as with other enhanced CT studies, no additional inhalational apparatus is required, as with Xe CT, and no access to radioisotopic material is necessary, as with PET. Xe CT and PET are expensive and require research staff and specialized equipment that may be available in only a few centers (18). Even newer MR techniques can be unwieldy in critically injured patients. With CTP, a nondiffusible indicator method is used to assess CBF, whereas Xe CT involves a diffusible tracer method (7). When these methods were directly compared, they are highly correlated, but CTP may tend to cause overestimation of CBF when parenchymal regions that include arterial branches are assessed (19, 20). Even with potential limitations, the ubiquitous use of CT to evaluate and treat patients with acute head injury and stroke makes the investigation of CTP of practical importance. Whether it provides physiologic neuroimaging that can be integrated into new approaches to multimodality monitoring in neurocritical care remains to be determined.
Exploration of CTP in patients with acute intracerebral hemorrhage (21) and acute traumatic brain injury is just beginning. CTP imaging was used in patients with traumatic brain injury to obtain information about cerebral autoregulation complementary to that provided by measurements of cerebral perfusion pressure alone (22). Although use of CTP in investigations of acute ischemic stroke is expanding, whether assumptions used to determine measured parameters, especially quantitative blood flow, translate as reliably in this setting as to other disorders is unclear. The accuracy of CTP depends on an intact blood-brain barrier (18), and during software analysis, selection of an appropriate arterial input function with which to compare the ROI is required. In acute ischemic stroke, most single-section CTP studies are performed at the level of the third ventricle, whereas in our study, the section of interest was always closer to the vertex to correspond to the level of the brain-tissue oxygen probe. To minimize variability in CTP study methods, we also chose a standard circular ROI of fixed size instead of manually adjusting the ROI to conform to white matter. Our mean CBF values were notably higher than those of previous studies of Xe CT to investigate white matter flow, though most of our values were within reported ranges (9, 10, 23). Although results of correlation studies between Xe CT and CTP are encouraging, some of our CTP-derived CBF values could have been overestimated as a result of technical aspects in performing CTP and interpreting the findings. (For example, a small amount of gray matter might have been included in the ROI because of partial-volume averaging, a cortical vein or artery might have been included in the ROI, or assumptions about blood-brain integrity might have been inaccurate.) Although post hoc exclusion of patients with CBF > 100 mL/100 g/min did not change the results, this is clearly an important area for future clarification regarding CTP in patients with disorders other than ischemic stroke (18, 24). A comparison of focal CBF measured concurrently by using CTP and a parenchymal blood flow probe, such as the currently available thermal-diffusion probe, would best address this issue (25).
Physiology of Microvascular Perfusion
The idea that measures of microvascular perfusion might be correlated with focally measured tissue oxygen tension makes intuitive sense. It is well known that oxygen gradients exist in the microcirculation, and it is further hypothesized that microvascular pathways with higher flow have higher oxygen content (26). This supports the idea that the direct measurement of tissue oxygen tension by using microelectrodes or the evaluation of ROIs by using physiologic neuroimaging, such as CTP, may provide measures of the regional pool of available oxygen better than just calculations of the global arterial oxygen content. The fact that MTT is correlated with PbrO2 suggests that PbrO2 is more a measure of microvascular flow than a marker of actual tissue ischemia. Emerging results in animals and humans support this view (8, 27).
CBF represents volume over time. We evaluated MTT and CBV from CTP in addition to the more familiar CBF because this allowed us to assess which component of CBF, time or volume, was most related to PbrO2. In a previous study of noninjured anesthetized swine, we found a strong relationship between directly measured CBF and PbrO2 in the subset undergoing both measurements (8). In studies of Xe CT in patients with head trauma, PbrO2 varied directly with CBF (9, 10), though the correlation was considerably weaker than that of the swine study. The fact that CBF was not related to PbrO2 in this study raises important questions about microvascular cerebral physiology. Although the injured state in humans may possibly alter the normal PbrO2-CBF relationship found in noninjured swine, this would disagree with previous results for CBF measured with Xe CT. More likely, the time required for blood to travel through tissue, as represented by MTT, is a more precise correlate of PbrO2 than actual volume of blood over time. Whether this lack of correlation between CBF and PbrO2 is due to dissociation between blood volume and transit time in the pathologically injured brain (as might occur with local edema or a depressed cerebral metabolic rate) or more related to methodologic issues with CTP assessment of CBF requires further evaluation.
Study Limitations and Future Directions
This study had several limitations related to both the specific cohort and the overall controversies about CTP. Primarily because of logistical and personnel availability, a consecutive convenience sample of subjects undergoing both CTP and PbrO2 monitoring, rather than the entire consecutive cohort of patients undergoing PbrO2, was included for this initial study of feasibility and correlation. For similar reasons, CTP studies were performed at varying times after initial placement of the brain oxygen monitor. Also, the cohort included subjects with both traumatic brain injury and nontraumatic intracerebral hemorrhage. In the context of this study, it is difficult to determine whether these factors influenced the relationship between CTP parameters and PbrO2. However, this heterogeneity between subjects should, if anything, diminish rather than enhance correlation. Furthermore, to be clinically useful, any correlation between neuroimaging and advanced neuromonitoring should be independent of disease and of the time of measurement. Certainly, other routinely used measures,such as mean arterial pressure, intracranial pressure, and FiO2, are not valid for only a particular disease or time of measurement. Also, because of technical issues, we were unable to measure end-tidal CO2 concentrations during the CTP studies. However, because the same ventilator settings were maintained by using transport ventilators, end-tidal CO2 likely remained stable. Although this would not affect the primary relationship between MTT and PbrO2, it did not allow us to consider end-tidal CO2 in a multivariable model. For four studies, physiologic information was not collected in the CT scanner; therefore, parameters collected immediately after the patients’ return to the intensive care unit were used. During these studies, PbrO2 was essentially the same before and after CT, and other physiologic and ventilatory parameters were maintained during transport. However, minor changes could not be ruled out. We believe that these issues did not influence our main findings because sensitivity analyses adjusted for time from probe placement to CT, using only patients with head trauma, or using only studies in which physiologic parameters were collected during CT yielded similar results, although they had less power to detect the relationship of interest.
Several important questions remain. We chose to test the hypothesis of a linear relationship between PbrO2 and MTT, both in single pairwise correlation and in a multivariable model. Although this relationship was statistically significant, we observed notable variability between subjects, as shown in Figure 2. This variability is not surprising given that, in our study of noninjured anesthetized swine, baseline PbrO2 varied from 21.6 to 65.1 mm Hg (8). Individual variability in baseline or postinjury microcirculatory oxygen gradients may affect the relationship between MTT and PbrO2. Although none of the data points exerted disproportionate leverage or influence on the PbrO2-MTT relationship, a straight line might not have been the best way to describe this relationship. We had relatively few patients with very low PbrO2 because, in this elective study, we deferred CTP in patients who were clinically unstable. Therefore, it would be premature to suggest that a specific MTT cutoff point can be used to define brain tissue hypoxia. The next step in these investigations should be the prospective use of CTP in a larger cohort of patients with acute brain injury, such as head trauma and intracerebral hemorrhage. Questions about the usefulness and reliability of CTP for assessing baseline flow, autoregulation, and physiologic reserve can be assessed for these conditions. A larger study should also address the usefulness of CTP in predicting clinical outcomes and in potentially guiding therapy to improve outcomes. In addition, improvements in the methods of CTP analysis can be more formally assessed (24). Prospective use of CTP before placement of brain-tissue oxygen monitors should also be studied to determine whether CTP can be used to target a region at high risk for tissue hypoxia for probe placement.
Conclusion
On dynamic CTP imaging, MTT is correlated with PbrO2 and this relationship is independent of cerebral perfusion pressure and FiO2. Because CTP is feasible with current CT technology, this type of physiologic neuroimaging could potentially be integrated into emerging approaches for multimodality monitoring of the cerebral metabolic state in acute brain injury. Because of the complexity of the postinjury state, a single monitor is unlikely to provide complete information. The next step is to determine whether the practical availability of CTP can be harnessed as a useful tool to initially evaluate acute brain injury and as a complimentary tool to improve techniques of advanced metabolic brain monitoring.
TABLE 2:
Multivariable model of the relationship between physiologic parameters and MTT
| Parameter | Coefficient* | 95% Confidence Interval | P Value |
|---|---|---|---|
| PbrO2 (mm Hg) | −0.42 | −0.72, −0.12 | .006 |
| FiO2 | 0.42 | −4.18, 42.6 | .98 |
| Cerebral perfusion pressure (mm Hg) | 0.04 | −0.38, 0.46 | .85 |
Expressed per 10-mm Hg change in PbrO2 and cerebral perfusion pressure and per 0.10 change in FiO2.
Acknowledgments
We thank Dr William Dillon for his advice regarding CTP and for providing analysis hardware and software. We also thank Dr Max Wintermark for his advice regarding CTP technology. We also wish to thank the CT technologists and intensive care unit nurses at San Francisco General Hospital for their excellent assistance with this protocol.
Footnotes
Supported by the National Institute of Neurological Disorders and Stroke grant K23NS41420, National Center for Injury Prevention and Control, Centers for Disease Control and Prevention grant R49CCR903697, and a grant from the University of California, San Francisco, Research Evaluation and Allocation Committee.
References
- 1.Goodman JC, Valadka AB, Gopinath SP, Uzura M, Robertson CS. Extracellular lactate and glucose alterations in the brain after head injury measured by microdialysis. Crit Care Med 1999;27:1965–1973 [DOI] [PubMed] [Google Scholar]
- 2.Gopinath SP, Valadka AB, Uzura M, Robertson CS. Comparison of jugular venous oxygen saturation and brain tissue PO2 as monitors of cerebral ischemia after head injury. Crit Care Med 1999;27:2337–2345 [DOI] [PubMed] [Google Scholar]
- 3.Meixensberger J, Jaeger M, Vath A, Dings J, Kunze E, Roosen K. Brain tissue oxygen guided treatment supplementing ICP/CPP therapy after traumatic brain injury. J Neurol Neurosurg Psychiatry 2003;74:760–764 [DOI] [PMC free article] [PubMed] [Google Scholar]
- 4.Sarrafzadeh AS, Sakowitz OW, Kiening KL, Benndorf G, Lanksch WR, Unterberg AW. Bedside microdialysis: a tool to monitor cerebral metabolism in subarachnoid hemorrhage patients? Crit Care Med 2002;30:1062–1070 [DOI] [PubMed] [Google Scholar]
- 5.Sarrafzadeh AS, Sakowitz OW, Callsen TA, Lanksch WR, Unterberg AW. Detection of secondary insults by brain tissue pO2 and bedside microdialysis in severe head injury. Acta Neurochir Suppl 2002;81:319–321 [DOI] [PubMed] [Google Scholar]
- 6.Smith WS, Roberts HC, Chuang NA, et al. Safety and feasibility of a CT protocol for acute stroke: combined CT, CT angiography, and CT perfusion imaging in 53 consecutive patients. AJNR Am J Neuroradiol 2003;24:688–690 [PMC free article] [PubMed] [Google Scholar]
- 7.Wintermark M, Maeder P, Thiran JP, Schnyder P, Meuli R. Quantitative assessment of regional cerebral blood flows by perfusion CT studies at low injection rates: a critical review of the underlying theoretical models. Eur Radiol 2001;11:1220–1230 [DOI] [PubMed] [Google Scholar]
- 8.Hemphill JC III, Knudson MM, Derugin N, Morabito D, Manley GT. Carbon dioxide reactivity and pressure autoregulation of brain tissue oxygen. Neurosurgery 2001;48:377–383 [DOI] [PubMed] [Google Scholar]
- 9.Valadka AB, Hlatky R, Furuya Y, Robertson CS. Brain tissue PO2: correlation with cerebral blood flow. Acta Neurochir Suppl 2002;81:299–301 [DOI] [PubMed] [Google Scholar]
- 10.Doppenberg EM, Zauner A, Bullock R, Ward JD, Fatouros PP, Young HF. Correlations between brain tissue oxygen tension, carbon dioxide tension, pH, and cerebral blood flow: a better way of monitoring the severely injured brain? Surg Neurol 1998;49:650–654 [DOI] [PubMed] [Google Scholar]
- 11.Guidelines Authors. Management and Prognosis of Severe Traumatic Brain Injury. Brain Trauma Foundation; J Neurotrauma 2000;17:451–627 [Google Scholar]
- 12.Broderick JP, Adams HP Jr, Barsan W, et al. Guidelines for the management of spontaneous intracerebral hemorrhage: a statement for healthcare professionals from a special writing group of the Stroke Council, American Heart Association. Stroke 1999;30:905–915 [DOI] [PubMed] [Google Scholar]
- 13.Kiening KL, Hartl R, Unterberg AW, Schneider GH, Bardt T, Lanksch WR. Brain tissue pO2-monitoring in comatose patients: implications for therapy. Neurol Res 1997;19:233–240 [DOI] [PubMed] [Google Scholar]
- 14.Van Santbrink H, Vd Brink WA, Steyerberg EW, Carmona Suazo JA, Avezaat CJ, Maas AI. Brain tissue oxygen response in severe traumatic brain injury. Acta Neurochir (Wien) 2003;145:429–438 [DOI] [PubMed] [Google Scholar]
- 15.Cook RD. Assessment of local influence. J Royal Stat Soc Series B-Methodol 1986;48:133–169 [Google Scholar]
- 16.Gupta AK, Hutchinson PJ, Fryer T, et al. Measurement of brain tissue oxygenation performed using positron emission tomography scanning to validate a novel monitoring method. J Neurosurg 2002;96:263–268 [DOI] [PubMed] [Google Scholar]
- 17.Hutchinson PJ, Gupta AK, Fryer TF, et al. Correlation between cerebral blood flow, substrate delivery, and metabolism in head injury: a combined microdialysis and triple oxygen positron emission tomography study. J Cereb Blood Flow Metab 2002;22:735–745 [DOI] [PubMed] [Google Scholar]
- 18.Latchaw RE, Yonas H, Hunter GJ, et al. Guidelines and recommendations for perfusion imaging in cerebral ischemia: a scientific statement for healthcare professionals by the writing group on perfusion imaging, from the Council on Cardiovascular Radiology of the American Heart Association. Stroke 2003;34:1084–1104 [DOI] [PubMed] [Google Scholar]
- 19.Wintermark M, Thiran JP, Maeder P, Schnyder P, Meuli R. Simultaneous measurement of regional cerebral blood flow by perfusion CT and stable xenon CT: a validation study. AJNR Am J Neuroradiol 2001;22:905–914 [PMC free article] [PubMed] [Google Scholar]
- 20.Machida K, Nakano H. Comparison of cerebral blood flow with Xe-inhalation CT and perfusion CT. Nippon Hoshasen Gijutsu Gakkai Zasshi 2003;59:302–308 [DOI] [PubMed] [Google Scholar]
- 21.Rosand J, Eskey C, Chang Y, Gonzalez RG, Greenberg SM, Koroshetz WJ. Dynamic single-section CT demonstrates reduced cerebral blood flow in acute intracerebral hemorrhage. Cerebrovasc Dis 2002;14:214–220 [DOI] [PubMed] [Google Scholar]
- 22.Wintermark M, Chiolero R, van Melle G, et al. Relationship between brain perfusion computed tomography variables and cerebral perfusion pressure in severe head trauma patients. Crit Care Med 2004;32:1579–1587 [DOI] [PubMed] [Google Scholar]
- 23.Furuya Y, Hlatky R, Valadka AB, Diaz P, Robertson CS. Comparison of cerebral blood flow in computed tomographic hypodense areas of the brain in head-injured patients. Neurosurgery 2003;52:340–345 [DOI] [PubMed] [Google Scholar]
- 24.Kudo K, Terae S, Katoh C, et al. Quantitative cerebral blood flow measurement with dynamic perfusion CT using the vascular-pixel elimination method: comparison with H2(15)O positron emission tomography. AJNR Am J Neuroradiol 2003;24:419–426 [PMC free article] [PubMed] [Google Scholar]
- 25.Horn P, Vajkoczy P, Thome C, Muench E, Schilling L, Schmiedek P. Xenon-induced flow activation in patients with cerebral insult who undergo xenon-enhanced CT blood flow studies. AJNR Am J Neuroradiol 2001;22:1543–1549 [PMC free article] [PubMed] [Google Scholar]
- 26.Tsai AG, Johnson PC, Intaglietta M. Oxygen gradients in the microcirculation. Physiol Rev 2003;83:933–963 [DOI] [PubMed] [Google Scholar]
- 27.Menzel M, Soukup J, Henze D, et al. Brain tissue oxygen monitoring for assessment of autoregulation: preliminary results suggest a new hypothesis. J Neurosurg Anesthesiol 2003;15:33–41 [DOI] [PubMed] [Google Scholar]