Abstract
BACKGROUND AND PURPOSE: MR imaging of the salivary glands has been applied to the diagnosis of Sjögren’s syndrome; however, the diagnosis remains qualitative. We sought to establish and evaluate quantitative MR imaging criteria for the diagnosis of Sjögren’s syndrome.
METHODS: MR imaging with a 47-mm microscopy coil was performed in 83 patients with xerostomia (55 patients with Sjögren’s syndrome, 28 without Sjögren’s syndrome). MR images were obtained by T1-weighted and fat-suppressed T2-weighted imaging and by MR sialography of the parotid glands. MR imaging findings of the parotid glands in Sjögren’s syndome included increases in fat areas and decreases in intact lobule areas. These MR images were morphometrically analyzed for the diagnostic criteria.
RESULTS: MR imaging with a microscopy coil demonstrated well the details of the damaged parotid glands in patients with xerostomia. Quantitative MR imaging of fat, intact gland lobule, and number of sialoectatic foci significantly and highly correlated with severity of disease. Receiver operating characteristic (ROC) curve analysis demonstrated that quantitative MR imaging yielded high diagnostic ability in differentiating patients with xerostomia who have Sjögren’s syndrome from those without Sjögren’s syndrome, with areas under the ROC curve of 0.94 for fat area, 0.98 for intact lobule area, and 0.91 for number of sialoectatic foci. The best cutoff points by quantitative MR imaging were each associated with high sensitivity and specificity, and, when used in combination, yielded 96% sensitivity and 100% specificity.
CONCLUSION: Quantitative MR imaging effectively differentiated the parotid glands in patients with xerostomia who have Sjögren’s syndrome from those without the syndrome and provided criteria for staging the gland disease.
Sjögren’s syndrome is an autoimmune disease and is characterized by lymphocytic infiltration in exocrine glands such as the salivary and lacrimal glands, resulting in dry mouth and dry eyes (1). Characteristic features of minor salivary gland parenchyma include lymphocyte infiltration, disappearance of acinus, and fibrosis (2). In most cases, the diagnosis of Sjögren’s syndrome is made clinically based on the sicca syndrome and the connective tissue disorder associated with serologic abnormalities (3). These criteria are 1) positive for ocular symptoms indicating dry eyes; 2) positive for oral symptoms indicating dry mouth; 3) objective evidence for dry eyes, such as Schirmer’s test and Rose Bengal score; 4) positive for lymphocyte focus score in minor salivary glands; 5) objective evidence of major salivary gland involvement by salivary flow rate test and sialography; and 6) positive for serologic test of Sjögren’s syndrome antigen A (SS-A) and antigen B (SS-B). The presence of any four of these six criteria is needed for diagnosing Sjögren’s syndrome. Sialography may be useful in staging Sjögren’s syndrome, since patients’ symptoms and serologic data may not correlate well with severity of the disease (4).
Recently, MR imaging features were established for the parotid gland in patients with Sjögren’s syndrome. Areas of high signal intensity on T1-weighted MR images, which may indicate increased amounts of fat tissues, are evident in the glands of patients with Sjögren’s syndrome (5). Several MR techniques are now available for identifying and staging the disease, including T1- and T2-weighted imaging (5), MR sialography (6), and diffusion-weighted MR imaging (7). These techniques have advantages and disadvantages, and the diagnostic and staging criteria of the disease have been largely descriptive or semiquantitative, and diagnostic performance of these MR imaging findings remains to be clarified.
A report describing good discriminative ability of MR imaging of the parotid glands in Sjögren’s syndrome reported by Niemelä et al (8) was very informative, but because of the lack of a control series with sicca symptoms without evidence of Sjögren’s syndrome, they could not assess the specificity of the methods. The purpose of the current study therefore was to evaluate diagnostic performance with MR imaging of the parotid glands in discriminating patients with xerostomia who have Sjögren’s syndrome from those without Sjögren’s syndrome. For this purpose, we performed quantitative analysis of MR images obtained by T1-weighted and fat-suppressed T2-weighted imaging by using a microscopy coil, to assess gland damages in Sjögren’s syndrome.
Methods
Patients
We studied 83 consecutive patients (68 women and 15 men; age range, 20–85 years; mean age, 63 years) with xerostomia and xerophthalmia, suggestive of Sjögren’s syndrome, at presentation. We accrued these patients from February 2003 to March 2004. Two patients other than these 83 patients were excluded from the study because of poor image quality. Final diagnoses were made on the basis of the criteria raised by Vitali et al (3). As a result, 55 patients (53 women and two men; age range, 20–77 years; mean age, 53 years) received the diagnosis of Sjögren’s syndrome, and the remaining 28 (15 women and 13 men; age range, 38–85 years; mean age, 68 years) were negative for the disease. Serologic data showed that SS-A, SS-B, and antinuclear antibody were positive, respectively, in 77%, 40%, and 96% of the patients with xerostomia who had Sjögren’s syndrome and were positive, respectively, in 4.2%, 0%, and 33.3% of the patients with xerostomia who did not have Sjögren’s syndrome.
We tentatively categorized the 83 patients into stages of grade 0–4. The 28 patients at grade 0 were negative for the Vitali’s criteria for Sjögren’s syndrome (3). We further categorized the remaining 55 patients, who were positive for the Vitali’s criteria, into four grades (grade 1–4) on the basis of the results by conventional sialography (9). This grading system was used to quantify MR imaging findings in each grade. The quantitative data of the fat area, intact lobule area, and sialoectatic foci were evaluated for their correlations with the grades by conventional sialography. Then, the best cutoff points (or MR imaging criteria) were determined for each imaging finding (fat area, intact lobule area, and sialoectatic foci), as described in Results.
We also studied eight consecutive patients (three women and five men; age range, 37–64 years) who presented with recurrent symptoms suggestive of chronic parotitis, such as swelling and pain. Of these, two (one woman and one man; ages, 37 and 55 years) showed obvious abnormalities in MR imaging features of the parotid glands. We obtained approval from our institutional review board and informed consent from the patients.
MR Imaging
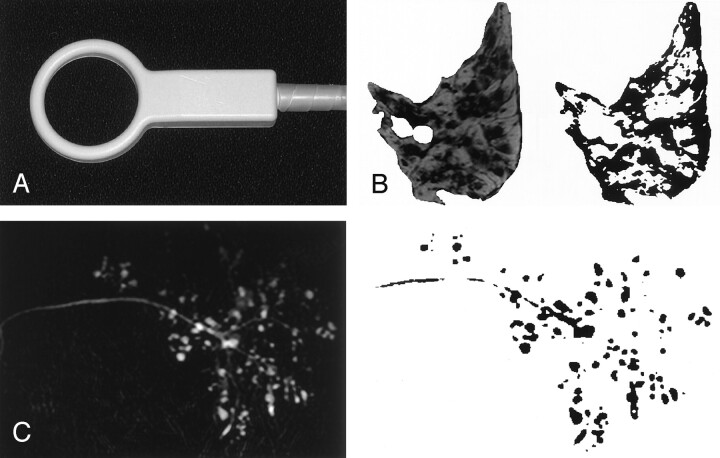
MR imaging was performed by using a 47-mm microscopy coil (Philips Medical Systems, Best, the Netherlands) (Fig 1A). Initially, axial T1-weighted images (TR/TE/NEX = 550/10/3) of the parotid glands were obtained with a 1.5-T MR imager (Gyroscan Intera 1.5T Master; Philips Medical Systems) by using a conventional spin-echo sequence. Also, axial, fat-suppressed, T2-weighted (2885/80/4) images were obtained with a turbo spin-echo sequence (spectral presaturation with inversion-recovery [SPIR]). The section thickness was 2 mm. T1-weighted MR imaging was performed with a matrix of 160 × 136, field of view of 5 cm, and an intersection gap of 0.2 mm. Imaging time was 3 minutes 46 seconds. Fat-suppressed T2-weighted imaging was performed with a matrix of 160 × 144, FOV of 5 cm, and an intersection gap of 0.2 mm. Imaging time was 3 minutes 59 seconds. We did not use contrast material enhancement.
Fig 1.
Quantitative MR imaging.
A, Photograph of the 47-mm microscopy coil used for T1-weighted and fat-suppressed T2-weighted (SPIR) imaging, as well as for MR sialography.
B and C, MR images (left) were converted to binary data (right). Fat areas (on T1-weighted images) and intact lobule areas (on fat-suppressed T2-weighted images) were calculated as percentages of the maximal cross-sectional areas of the same glands on T1-weighted image (B). On the MR sialogram (C), the numbers and areas of the sialoectatic high-intensity signals were enumerated.
Then, MR sialography was performed by using a single-section single-shot turbo spin-echo sequence (8000/800–1000/1–6) for all 83 patients. The section thickness was 3–4 cm. MR sialograms were obtained with a matrix of 192 × 150, FOV of 7 cm, turbo spin-echo factor of 150, and echo spacing of 10.6 ms. The imaging time was 8–56 seconds.
Quantification of MR Findings
Measurements were performed on a cathode-ray tube monitor by placing a region of interest onto the parotid gland image that had a maximal area of a single gland on T1-weighted and fat-suppressed T2-weighted MR images. The size of the region of interest was manually determined so that it encompassed as much parotid area as possible on MR images. The retromandibular vein and the intraglandular main duct were excluded from the region of interest. The total parotid gland areas were quantified as pixels on T1-weighted images. The fat and intact lobule areas were separately quantified as pixels on T1-weighted and fat-suppressed T2-weighted images, respectively, and were expressed as percentages of the total parotid gland area. The fat areas were identified on T1-weighted images as those with high signal intensities that were decreased on fat-suppressed T2-weighted images. The lobule areas were determined on fat-suppressed T2-weighted images as those with intermediate signal intensities. These processes were performed using the ImageJ version 1.29 software program (Wayne Rasband; http://rsb.info.nih.gov/ij/) (Fig 1B). The measurements were performed by two radiologists (Y.T. and M.S.), and the data were averaged.
In the preliminary study, we assessed the reproducibility of the technique. To this end, we calculated the intraoperator and interoperator measurement errors. The precision errors were 2.7% coefficient of variation (fat area) and 2.2% coefficient of variation (lobule area) for repeated (three times) measurements of the same parotid image by a single radiologist; 5.5% coefficient of variation (fat area) and 4.9% coefficient of variation (lobule area) for a single measurement of the same parotid gland image by each of three radiologists.
We also determined the severity of the affected parotid glands by calculating the area and numbers of sialoectatic high-signal-intensity areas as determined with MR sialography. The sialoectatic area of each of the glands was quantified as pixels. The measurements were also performed by the two radiologists (Y.T. and M.S.), and the data were averaged (Fig 1C).
Salivary Flow Rate Test
The salivary flow rate of the patients was quantified by means of the Saxon test (10). Briefly, sterile gauze was placed in a plastic tube, and the dry gauze and tube were weighed together. After preexistent oral fluid was removed, saliva was collected by having patients chew vigorously on the gauze for exactly 2 minutes (once at every 1 second). Salivary flow rate was determined by subtracting the original weight from the weight obtained after chewing. A previous work showed that healthy control subjects produced greater than 2.75 g/2 minutes of saliva (5).
Conventional Sialography
Conventional sialography of the parotid glands was performed in all 83 patients by using the nonionizing contrast medium iopamidol (Iopamiron; Schering AG, Berlin, Germany). The sialographic staging of Sjögren’s syndrome was determined on the basis of the lateral views, according to the criteria of Rubin and Holt (9).
Single and Multiple Linear Regression Analyses with a Stepwise Method
Simple regression analysis was performed on salivary flow rates obtained by the Saxon test and on the MR imaging findings. Stepwise regression analysis was performed as a forward or backward stepping procedure based on a likelihood ratio test, with a P value less than .05 for variable inclusion and greater than .1 for exclusion from the model. Stepwise regression analysis was performed with the statistical software package SPSS for Macintosh, version 6.1 (SPSS, Chicago, IL).
Receiver Operating Characteristic Curve Analysis
The diagnostic performance of the morphometric MR imaging criteria (fat area, gland lobule area, and sialoectatic foci) was analyzed by receiver operating characteristic (ROC) curve analysis (ROCKIT; Metz CE, Chicago, IL) (11). A binormal ROC curve was fitted to each MR criterion, by using ROCKIT software. Areas under the ROC curves (Az) for each MR diagnostic criterion were calculated to compare the diagnostic ability of the MR criteria. Az values were expressed as means ± standard errors, and the significance of difference in Az value between the MR imaging criteria was tested with Student t test.
Results
MR Imaging Features of Parotid Glands in Sjögren’s Syndrome
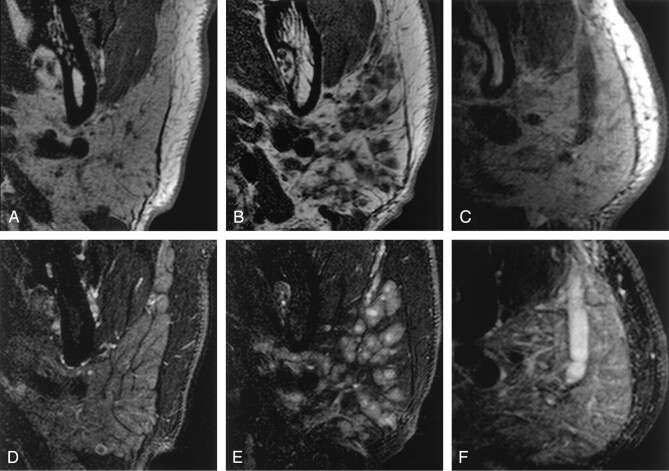
On T1-weighted images, the normal parotid glands and the glands with inflammation were of intermediate signal intensity and were homogeneous, except for the intraglandular duct structures and vessels (Fig 2A and 2C). In contrast, glands affected with Sjögren’s syndrome were heterogeneous and consisted of low- and high-signal-intensity areas (Fig 2B). The high-intensity areas on T1-weighted MR images of the glands in patients with Sjögren’s syndrome are considered to represent fat deposition in the glands (5).
Fig 2.
Characteristic MR imaging features of the parotid glands.
A–C, Axial T1-weighted images of parotid glands from a xerostomia patient without Sjögren’s syndrome (A), from a xerostomia patient with Sjögren’s syndrome (B), and from a patient with parotitis (C).
D–F, Axial fat-suppressed T2-weighted images of parotid glands from the xerostomia patient without Sjögren’s syndrome (D), from the xerostomia patient with Sjögren’s syndrome (E), and from the patient with parotitis (F), same patients as shown in A–C, respectively. Note the high-signal-intensity cores in the gland of the patient with Sjögren’s syndrome (E), suggestive of lymphocyte aggregations in the gland. This may be a characteristic feature of the glands affected by this disease.
Fat-suppressed T2-weighted images revealed gland lobule architectures by decreasing signals from interlobular fat tissues (Fig 2D). Water-rich tissues and spaces were illustrated as high-intensity areas on fat-suppressed T2-weighted images (Fig 2E and 2F). High-intensity spot areas relative to the remaining gland lobules were also very characteristic MR features of the glands affected by Sjögren’s syndrome (Fig 2E).
MR Imaging Grading of Parotid Glands in Sjögren’s Syndrome
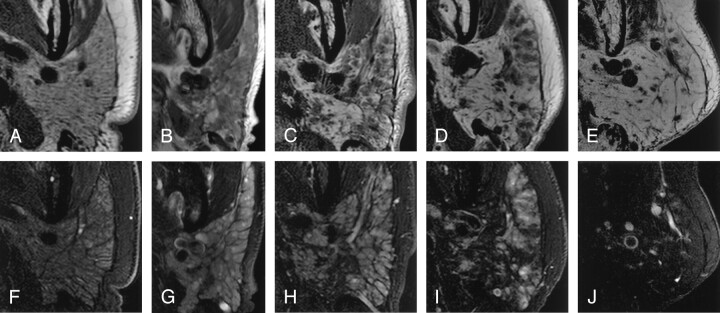
Of the 83 patients with xerostomia, 28 were negative (grade 0) for the Sjögren’s syndrome criteria used in the present study. We categorized the 55 patients positive for the criteria further into four grades (grades 1–4) on the basis of conventional sialographic criteria (9); patients with grade 0 were negative for Sjögren’s syndrome. Hereafter, we refer to this grading system as classic. We found that T1 and fat-suppressed T2-weighted MR imaging features of the parotid glands correlated well with this classic grading system for Sjögren’s syndrome (Fig 3).
Fig 3.
MR imaging features of the parotid glands relative to conventional sialographic grades in xerostomia patients with or without Sjögren’s syndrome.
A–E, Axial T1-weighted MR images of the parotid glands in patients whose conventional sialographs were categorized as grade 0 (A), grade 1 (B), grade 2 (C), grade 3 (D), or grade 4 (E). Note that fat areas in the glands increase with the grades.
F–J, Axial fat-suppressed T2-weighted MR images of the parotid glands in patients (same patients as in A–E, respectively) whose conventional sialographs were categorized as grade 0 (F), grade 1 (G), grade 2 (H), grade 3 (I), or grade 4 (J). Note that intact lobule areas in the glands decrease with the grades.
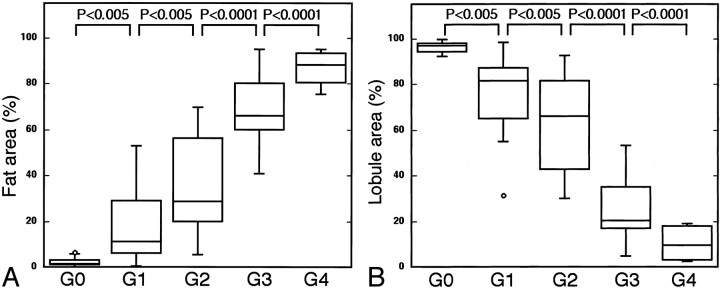
To substantiate these findings, we quantified the MR imaging features of the parotid glands in the patients with and those without Sjögren’s syndrome (Fig 4). When expressed as percentages of the maximum areas on the T1-weighted images of the glands, the fat area (high-signal-intensity area on T1-weighted images of the glands) increased (Fig 4A) and the intact lobule area (intermediate-signal-intensity area on fat-suppressed T2-weighted images of the glands) decreased (Fig 4B) as the classic grades became higher.
Fig 4.
T1-weighted and fat-suppressed T2-weighted MR imaging features of the parotid glands correlated well with conventional sialographic features. The horizontal bar indicates mean; small circles, outliers.
A, Graph shows a high correlation between fat areas as assessed on T1-weighted MR images and conventional sialographic grades (G0–G4).
B, Graph shows a high correlation between intact lobule area as assessed on fat-suppressed T2-weighted MR images and conventional sialographic grades (G0–G4).
Discrepancy Between MR Sialography and Conventional Sialography
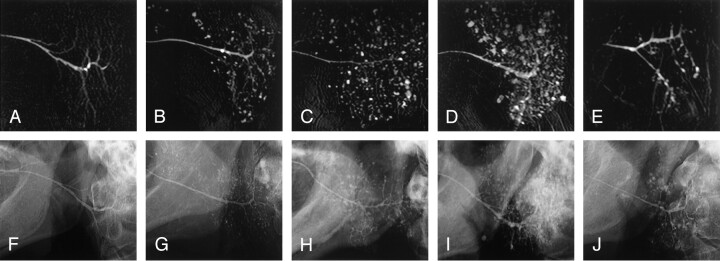
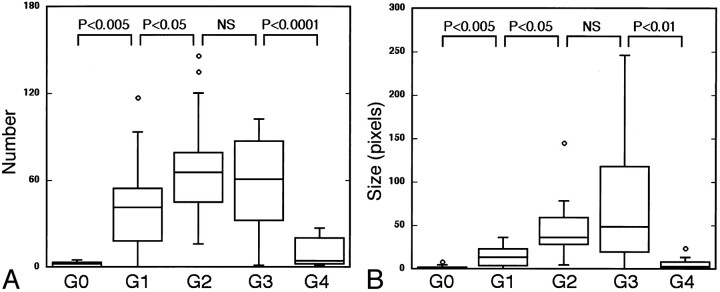
Sialoectatic patterns characteristic of Sjögren’s syndrome were evident in the parotid glands (Fig 5). However, when comparing images of MR sialography with those of conventional sialography from the same patients with xerostomia, there was a discrepancy between these two sialographic findings at the highest stages of the disease; on conventional sialograms the sizes of sialoectatic foci in the glands were larger at higher grades, but on MR sialograms sialoectatic foci in grade 4 glands were decreased in number and size compared with those in grade 3 glands (Fig 6). The quantitative analysis showed that the numbers and size of MR sialoectatic foci increased along with increases in classic grades up to grade 2, whereas the sialoectatic measures on MR sialograms in patients at grade 3 were not significantly different from those at grade 2, and those at grade 4 were lower than those at grade 1 (Fig 7). These findings implied that the two techniques might depict different pathologic events in the affected glands, at least in part.
Fig 5.
A–C, Sagittal MR sialography of parotid glands from a xerostomia patient without Sjögren’s syndrome (A), a xerostomia patient with Sjögren’s syndrome (B), and a patient with parotitis (C).
Fig 6.
Discrepancy in imaging features of the parotid glands between MR sialography and conventional sialography.
A–J, MR sialograms (A–E) and conventional sialograms (F–J) of the parotid glands in xerostomia patients with or without Sjögren’s syndrome: grade 0 (A and F), grade 1 (B and G), grade 2 (C and H), grade 3 (D and I), and grade 4 (E and J). Note apparent differences in sialographic features at grade 4 (E versus J).
Fig 7.
MR sialographic features are not correlative to conventional sialographic features in the end stages of the disease. The horizontal bar indicates mean; small circles, outliers.
A and B, Graphs show the relationship between the number of sialoectatic foci (A) and the size of sialoectatic foci (B) on MR sialograms and the grades (G0–G4) with conventional sialography. Note the poor correlations between these two sialographic features at grades 3 and 4. NS indicates not significant.
Correlation Between T1-Weighted and Fat-Suppressed T2-Weighted MR Findings and Disease Severity
Simple and multiple linear regression analyses were performed to explore the relationship between fat area, intact gland lobule area, and numbers and total areas of MR sialoectatic foci and salivary flow rates by Saxon test and the classic grades (grades 0–4). All of the MR images measures and the Saxon test significantly correlated with the classic grades of the disease. On multiple regression analyses by a stepwise (forward and backward) method, however, only fat area or intact lobule area and the number of sialoectatic foci significantly correlated with the classic grades (Table 1). Together, these results suggest that the MR findings correlated with severity of disease.
TABLE 1:
Simple and multiple regression analyses of MR microscopic criteria and Saxon test
| Analysis Method and Variable | Coefficient | SE | R2 | P Value |
|---|---|---|---|---|
| Simple regression | ||||
| Saxon | −0.412 | 0.077 | 0.283 | <.0001 |
| Fat area | 0.038 | 0.002 | 0.838 | <.0001 |
| Lobule area | −0.038 | 0.002 | 0.842 | <.0001 |
| Sialoectasia | ||||
| Number | 0.012 | 0.004 | 0.099 | .0039 |
| Size | 0.013 | 0.004 | 0.116 | .0018 |
| Multiple regression | ||||
| Forward | ||||
| Lobule area + no. of sialoectatic foci | −0.035/0.005 | 0.002/0.002 | 0.839 | <.0001 |
| Backward | ||||
| Fat area + no. of sialoectatic foci | 0.035/0.006 | 0.002/0.002 | 0.844 | <.0001 |
Note.−SE indicates standard error; R2, coefficient of determination.
ROC Analysis of MR Findings in Diagnosing the Parotid Glands in Sjögren’s Syndrome
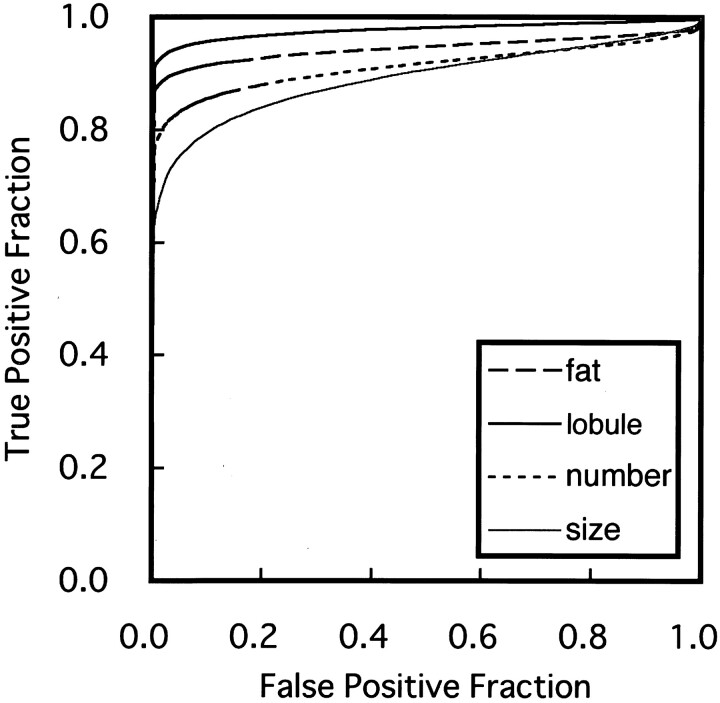
Given that the two MR imaging findings (increased areas of fat and decreased areas of intact lobule) significantly and highly correlated with the grades determined by conventional sialography (Table 1), we next determined by ROC analysis the diagnostic ability of the MR imaging findings in differentiating xerostomia patients with Sjögren’s syndrome from those without Sjögren’s syndrome. The MR findings of intact gland lobule area on fat-suppressed T2-weighted images yielded high Az values (0.98 ± 0.02) (Fig 8). Az values for the MR imaging finding of fat area on T1-weighted images were at a similar level (0.94 ± 0.03) to those for intact lobule area. However, the MR sialographic findings of number and size of sialoectatic foci yielded lower Az values (0.91 ± 0.04 and 0.89 ± 0.04, respectively) compared with criteria by T1-weighted and fat-suppressed T2-weighted imaging.
Fig 8.
Graph shows averaged ROC curves for MR imaging criteria for differentiating xerostomia patients with Sjögren’s syndrome from those without Sjögren’s syndrome, by using fat area on T1-weighted images, intact lobule area on fat-suppressed T2-weighted images, and the number and size of sialoectatic foci on MR sialograms. The Az values calculated from ROC curves, which indicate the diagnostic ability using these criteria, are as follows: Az (fat area) = 0.94 ± 0.03, Az (lobule area) = 0.98 ± 0.02, Az (number) = 0.91 ± 0.04, and Az (size) = 0.89 ± 0.04.
Discrimination Analyses with MR Criteria
The compromise cutoff points of the MR criteria for Sjögren’s syndrome, which were associated with the best accuracy (91.6% for fat area, 95.2% for intact lobule area, 86.7% for numbers of sialoectatic foci, and 81.9% for total size of sialoectasia), were 5% and 90% for fat area and intact lobule area, respectively, and six for the number of sialoectatic foci (Table 2). These best cutoff points yielded moderate to high sensitivity and specificity. Furthermore, combinations of these MR imaging criteria resulted in increased discriminating ability, yielding 96% sensitivity, 100% specificity, and 97.6% accuracy.
TABLE 2:
Discrimination analysis of MR microscopic criteria
| Variable | Sensitivity (%) | Specificity (%) | Accuracy (%) |
|---|---|---|---|
| Fat area (%) | |||
| 4 | 94.5 | 82.1 | 90.4 |
| 5* | 92.7 | 89.3 | 91.6 |
| 10 | 87.3 | 100.0 | 91.6 |
| 15 | 87.3 | 100.0 | 84.3 |
| Lobule area (%) | |||
| 95 | 94.5 | 75.0 | 88.0 |
| 90* | 92.7 | 100.0 | 95.2 |
| 85 | 85.5 | 100.0 | 90.4 |
| 80 | 76.4 | 100.0 | 84.3 |
| No. of sialoectatic foci | |||
| 3 | 87.3 | 75.0 | 83.1 |
| 6* | 80.0 | 100.0 | 86.7 |
| 9 | 78.2 | 100.0 | 85.5 |
| Fat area (5%) + no. of sialoectatic foci (6) | 96.4 | 100.0 | 97.6 |
| Lobule area (90%) + no. of sialoectatic foci (6) | 96.4 | 100.0 | 97.6 |
Best cutoff points.
Discussion
We evaluated MR imaging with a microscopy coil for the assessment of damaged parotid glands in patients with Sjögren’s syndrome. We found that the MR imaging criteria yielded high performance in diagnosing Sjögren’s syndrome. These techniques are very simple, require no radiation, and can depict the structural details of the damaged glands. Therefore, MR imaging with a microscopy coil may be a promising alternative to conventional sialography. We postulate here that the combined use of MR imaging by T1-weighted or fat-suppressed T2-weighted imaging and MR sialography is useful for the assessment of damaged salivary glands in Sjögren’s syndrome.
MR Imaging of the Parotid Gland in Sjögren’s Syndrome
Heterogeneity in MR signal intensity has been reported to be characteristic of the salivary glands affected by Sjögren’s syndrome (5, 12). Recent reports demonstrated that these changes were due to varying degrees of fat deposition in the glands (13). The use of MR imaging with a microscopy coil enabled more precise morphometric analyses of the glands.
Fat-suppressed T2-weighted MR imaging clearly reveals the intact gland lobule morphology by removing fat tissue signals and also by emphasizing water-rich tissues and spaces. There is probably an inverse relationship between the area of fat and intact gland lobule area, since disease-induced fat deposition in the gland will eventually diminish the area of functional gland lobule. Results of the multiple linear regression analysis conducted in the present study support this view (Table 1).
We also noted an even higher signal intensity core area in the parotid glands of patients with Sjögren’s syndrom (Figs 2E and 3G, 3H, 3I). This feature was characteristic of the glands in patients with Sjögren’s syndrome and was found in 10 (18%; two patients at grade 1, six at grade 2, and two at grade 3) of the 55 patients with Sjögren’s syndrome, but not in xerostomia patients without Sjögren’s syndrome (Fig 2D). The experimental study by 9.4-T MR imaging of Sjögren’s syndrome model mice (lpr-/-) suggested that these core areas with high signal intensity might represent mononuclear cell aggregations (unpublished data, Takagi et al, November 2003). This MR imaging finding thus may be a pathognomonic feature for Sjögren’s syndrome.
MR Sialography in Sjögren’s Syndrome
Sialography is useful in staging Sjögren’s syndrome, since patients’ symptoms may not correlate well with the severity of disease (4). MR sialography is a good candidate as an alternative to conventional x-ray sialography, a cumbersome procedure that is contraindicated in patients with acute sialoadenitis (14). The MR microsialographic technique used in the present study was very simple, rapid (8 seconds of imaging time when the number of signal acquisition is 1), and provided high-spatial-resolution images by using a microscopy coil. MR sialography was reported to be 91–100% accurate for identifying early stages of the disease (15). However, MR sialography may not correlate well with conventional sialography in the later stages of disease. Indeed, we found in the present study that sialoectatic patterns obtained at grade 4 were significantly different from those obtained with conventional sialography.
MR sialography is fundamentally a hydrography technique, and, therefore, it depicts water-rich foci, such as edematous foci. Consistent with this idea, the extent of sialoectasia was dramatically reduced in grade 4 of the parotid gland, where the greatest areas of the glands were replaced by fat as shown on T1-weighted and fat-suppressed T2-weighted images.
Together, these findings suggest that conventional sialography and MR sialography depict different aspects of the disease. In this context, it is interesting that diffusion-weighted MR imaging of the parotid glands in Sjögren’s syndrome, which visualizes molecular diffusion of the water in the gland tissues, was found to correlate well with the T1-weighted MR imaging grading of the glands, but not with conventional sialographic grades (7).
Diagnostic Ability of MR Imaging Criteria
A combination of T1-weighted and fat-suppressed T2-weighted MR imaging and MR sialography yielded high sensitivity (96%) and specificity (100%) for the differentiation of xerostomia patients with Sjögren’s syndrome from those without Sjögren’s syndrome. The staging of Sjögren’s syndrome on the basis of imaging findings has been descriptive or at most semiquantitative (5, 8, 13). A major problem with such a staging system has been interrater variability (16). To reduce the problem of interrater variability, quantitative methods are needed to assess damaged glands in Sjögren’s syndrome. It is clear that MR imaging with a microscopy coil provides detailed and potentially quantifiable images of damaged parotid glands in Sjögren’s syndrome. In addition, the technique is also beneficial to patient management, since it does not require any radiation, as with conventional sialography, or surgery, as with lip biopsy. However, careful validation of MR imaging findings is required before the importance of these findings is established with respect to disease activity. If properly validated, high-spatial-resolution MR images of the salivary glands may become a powerful and noninvasive test for examining and staging damages to the glands in Sjögren’s syndrome, and for differentiation from diseases that mimic Sjögren’s syndrome such as hyperlipidemia (17, 18).
{/PICK;0265f3;;;page;;;;yes;1;18656n;21120n;5} {/GRAPH;;comptd;;center;stack} {/CAPT;;;center;stack;2112n} {/PICK;0265f6;;;page;;;;yes;1;18656n;21120n;6} {/GRAPH;;comptd;;center;stack} {/CAPT;;;center;stack;2112n} {/GRAPH;;comptd;;right;stack} {/CAPT;52800n;;left;balign;2112n} {/PICK;0265f8;;;block;;;;yes;1;18656n;21120n;7} {/GRAPH;;comptd;;center;stack} {/CAPT;;;center;stack;2112n}
References
- 1.Diagnosis of Sjögren’s syndrome [editorial]. Lancet 1992;340:150–151 [PubMed] [Google Scholar]
- 2.Daniels TE. Labial salivary gland biopsy in Sjögren’s syndrome: assessment as a diagnostic criterion in 362 suspected cases. Arthritis Rheum 1984;27:147–156 [DOI] [PubMed] [Google Scholar]
- 3.Vitali C, Bombardieri S, Jonsson R, et al. Classification criteria for Sjögren’s syndrome: a revised version of the European criteria proposed by the American-European Consensus Group. Ann Rheum Dis 2002;61:554–558 [DOI] [PMC free article] [PubMed] [Google Scholar]
- 4.Youseum DM, Kraut MA, Chalian AA. Major salivary gland imaging. Radiology 2000;216:19–29 [DOI] [PubMed] [Google Scholar]
- 5.Izumi M, Eguchi K, Ohki M, et al. MR imaging of the parotid gland in Sjögren’s syndrome: a proposal for new diagnostic criteria. AJR Am J Roentgenol 1996;166:1483–1487 [DOI] [PubMed] [Google Scholar]
- 6.Tonami H, Ogawa Y, Matoba M, et al. MR sialography in patients with Sjögren’s syndrome. AJNR Am J Neuroradiol 1998;19:1199–1203 [PMC free article] [PubMed] [Google Scholar]
- 7.Sumi M, Takagi Y, Uetani M, et al. Diffusion-weighted echo-planar MR imaging of the salivary glands. AJR Am J Roentgenol 2002;178:959–965 [DOI] [PubMed] [Google Scholar]
- 8.Niemelä RK, Pääkkö E, Suramo I, Takalo R, Hakala M. Magnetic resonance imaging and magnetic resonance sialography of parotid glands in primary Sjögren’s syndrome. Arthritis Care Res 2001;45:512–518 [DOI] [PubMed] [Google Scholar]
- 9.Rubin P, Holt JF. Secretary sialography in disease of the major salivary glands. AJR Am J Roentgenol 1957;77:575–598 [PubMed] [Google Scholar]
- 10.Kohler PF, Winter ME. A quantitative test for xerostomia: the Saxon test, an oral equivalent of the Schirmer test. Arthritis Rheum 1985;28:1128–1132 [DOI] [PubMed] [Google Scholar]
- 11.Metz CE. ROC methodology in radiologic imaging. Invest Radiol 1986;21:720–733 [DOI] [PubMed] [Google Scholar]
- 12.Sumi M, Izumi M, Yonetsu K, Nakamura T. Sublingual gland: MR features of normal and diseased states. AJR Am J Roentgenol 1999;172:717–722 [DOI] [PubMed] [Google Scholar]
- 13.Izumi M, Eguchi K, Nakamura H, Nagataki S, Nakamura T. Premature fat deposition in the salivary glands associated with Sjögren’s syndrome: MR and CT evidence. AJNR Am J Neuroradiol 1997;18:951–958 [PMC free article] [PubMed] [Google Scholar]
- 14.Tonami H, Higashi K, Matoba M, Yokota H, Yamamoto I, Sugai S. A comparative study between MR sialography and salivary gland scintigraphy in the diagnsosis of Sjögren syndrome. J Comput Assist Tomogr 2001;25:262–268 [DOI] [PubMed] [Google Scholar]
- 15.Ohbayashi N, Yamada I, Yoshino N, Sasaki T. Sjögren syndrome: comparison of assessment with MR sialography and conventional sialography. Radiology 1998;209:683–688 [DOI] [PubMed] [Google Scholar]
- 16.Goldbach-Mansky R, Woodburn J, Yao L, Lipsky PE. Magnetic resonance imaging in the evaluation of bone damage in rheumatoid arthritis: a more precise image or just a more expensive one? Arthritis Rheum 2003;48:585–589 [DOI] [PubMed] [Google Scholar]
- 17.Izumi M, Hida A, Takagi Y, Kawabe Y, Eguchi K, Nakamura T. MR imaging of the salivary glands in sicca syndrome: comparison of lipid profiles and imaging in patients with hyperlipidemia and patients with Sjögren’s syndrome. AJR Am J Roentgenol 2000;175:829–834 [DOI] [PubMed] [Google Scholar]
- 18.Izumi M, Nakamura H, Nakamura T, Eguchi K, Nakamura T. Sjögren’s syndrome (SS) in patients with human T cell leukemia virus I–associated myelopathy: paradoxical features of the major salivary glands compared to classical SS. 1999;26:2609–2614 [PubMed] [Google Scholar]


