

Abstract
Investigation of biological processes at the single cell or subcellular level is critical in order to better understand heterogenous cell populations. Nanoscale secondary ion mass spectrometry (NanoSIMS) enables multiplexed, quantitative imaging of the elemental composition of a sample surface at high resolution (< 50 nm). Through measurement of two different isotopic variants of any given element, NanoSIMS provides nanoscale isotope ratio measurements. When coupled with stable isotope tracer methods, the measurement of isotope ratios functionally illuminates biochemical pathways at suborganelle resolution. In this review, we describe the practical application of NanoSIMS to study biological processes in organisms ranging from microbes to humans, highlighting experimental applications that have provided insight that is largely unattainable by other methods.
Introduction
Recent advances in single cell genomics and proteomics have revealed important heterogeneity in cell populations previously viewed as uniform1, 2. However, the investigation of biochemical pathways has typically involved analytical methods where the requisite sample input consists of pooled cells or tissue samples, merging numerous cells into one homogenous sample, which may obscure biologically relevant heterogeneity. Therefore, developing new approaches to functionally interrogate biological processes at subcellular resolution will be critical to fully understand biological complexity at the single cell and single organelle level.
Various modalities of imaging mass spectrometry quantify molecular or elemental composition with sufficient resolution to capture individual cells3, 4. In this review, we focus on one such technology, nanoscale secondary ion mass spectrometry, which is often referred to by its proprietary name: NanoSIMS. This instrument is designed to ionize and quantify atoms and polyatomic clusters in very small areas. With a spatial resolution of less than 50nm, the NanoSIMS instrument can easily image individual cells and resolve many subcellular structures5, 6. The NanoSIMS can also perform isotope ratio measurements, thereby coupling high resolution imaging with the quantitative measurement of stable isotope tracers7. The merger of stable isotope tracer methods with NanoSIMS for biological applications has been described using various terms, including multi-isotope imaging mass spectrometry (MIMS), NanoSIMS with stable isotope probing (Nano-SIP), and stable isotope labeling kinetics and nanoscale secondary ion mass spectrometry (SILK-SIMS)6, 8, 9. Here, we present an overview of the application of NanoSIMS to biology and biomedical research, with a dual emphasis on practical considerations in experimental design and on a set of examples that demonstrate the potential to explore biochemical processes at a scale that is largely inaccessible with other existing methods.
Nanoscale secondary ion mass spectrometry
The essential principles of secondary ion mass spectrometry (SIMS) were conceived in the 1960’s and then advanced in the NanoSIMS instrument with incorporation of sophisticated new ion optics (Figure 1)5, 10, 11. The NanoSIMS instrument merges an ion microprobe and a magnetic sector mass spectrometer, each containing features that facilitate quantitative imaging of biological processes in a tractable manner. Recent articles, including a review by Agui-Gonzalez and colleagues in this issue of JAAS, have reviewed the principles of secondary ion mass spectrometry (SIMS) and/or NanoSIMS in detail12, 13. For the purposes of this review, we will focus on those specifications of most direct relevance to cell biological experiments.
Figure 1. Nanoscale secondary ion mass spectrometry (NanoSIMS).

The surface of a sample is rastered with a focused primary ion beam from a cesium or oxygen source. Secondary ions are extracted and passed through a series of ionic lenses and slits so that the secondary ion beam is focused in a plane. A double sector mass spectrometer separates the ions by mass in the focusing plane. A series of up to 7 moveable detectors are aligned to capture data for 7 different masses from the same spot of the sample surface. A quantitative mass image is derived for each measured mass.
In order to produce a quantitative image of a sample surface, a field is rastered by a focused primary ion beam, resulting in sputtering of atoms and polyatomic clusters that comprise the sample’s surface layers. Most existing instruments are equipped with a cesium source and a duoplasmatron oxygen source, which enhance the yield of negatively charged and positively charged ions, respectively. Biological studies have rarely utilized the duoplamatron oxygen source due to various technical factors including poor ionization yield relative to the cesium source. The recent implementation of a new radiofrequency oxygen source as an optional component to the NanoSIMS 50L instrument improves high resolution imaging of positively charged secondary ions, which may be reflected in the biological literature as this new feature is installed in academic laboratories14, 15.
As the sample surface is rastered with the primary ion beam, an immersion lens exerts an electrostatic accelerating field, drawing in the ionized fraction of sputtered atoms and polyatomic clusters and shaping these so-called secondary ions into a beam (the secondary ion beam). These secondary ions represent the analytes that are subsequently measured by a Mattauch-Herzog style magnetic sector mass spectrometer, which contains a series of electron multiplier detectors (4–7) aligned along a focal plane and tuned to measure specific ionic masses of interest. The mass resolution is sufficiently high so as to distinguish ionic species of similar molecular weights, for example, the NanoSIMS can resolve 13C14N, 12C15N, and 12C14N1H all of which have a molecular weight of approximately 27 daltons6, 16. Irrespective of the analyte of interest, however, each pixel in a NanoSIMS image is representative of an independent measurement of emitted secondary ions. The dimensions of each pixel—reflecting the lateral imaging resolution—are dependent upon the focusing of the primary ion beam to probe small areas of the sample surface. The immersion lens and subsequent ion optics facilitate the capture and transmission of secondary ions with an efficiency of up to ~80%. The efficiency of ionization (at most a few percent) and secondary ion capture is an important determinant of analytical throughput, because the generation of a quantifiable image requires counting a sufficient number of secondary ions per pixel to reveal statistically meaningful spatial contrast. Configuration of the primary ion beam to achieve the highest lateral imaging resolution of ~30 nm, however, comes at the cost of a reduction in secondary ion yield. Addressing many biological questions may not require the highest imaging resolution, and as such we more commonly operate at a resolution in the 50–250 nm range. In addition, because NanoSIMS images are derived from the sputtering of the uppermost atomic layers of the sample, features elucidated during analysis that might benefit from higher resolution imaging can be investigated at higher resolution with a second pass analysis6, 17. Due to inherent variability in biological systems, achieving adequate statistical precision to answer questions of interest may often challenge their practicality, with respect to analytical time. The balance between the throughput demands of a given biological question and the ideal analytical parameters is a critical consideration in experimental design and a recurrent theme in this review.
Defining the elemental composition of cells and tissues
The most conceptually straightforward NanoSIMS application is to quantify a specific mass of interest, either because its spatial distribution reveals qualitative histological/structural information or because its local concentration in a specific domain is of biological relevance. To date, the most useful data for identification of cells and subcellular structures are measurements of 12C14N, 31P, and 32S (Figure 2). 12C14N images delineate cell borders and certain intracellular features, including isotopically bright nuclei and nucleoli6, 16. Phosphorus-31 images reveal nuclear contours due to the high phosphate content of nuclear chromatin17, 18. As such, 31P emission correlates with the labeling pattern of nucleotide analogs (e.g., bromodeoxyuridine, BrdU) and DNA stains such as 4′,6-diamidino-2-phenylindole (DAPI) (Figure 3)17, 19–21. In nuclei, 32S images reveal a pattern that is the negative of 31P images. However, other specific cellular structures, such as melanin granules in the hair shaft or intracellular granules found in small intestinal Paneth cells or in circulating polymorphonuclear cells, do demonstrate strong 32S emission, presumably due to the high content of sulfur-rich proteins17, 19, 22.
Figure 2. NanoSIMS mass images reveal cell-type specific histological features.
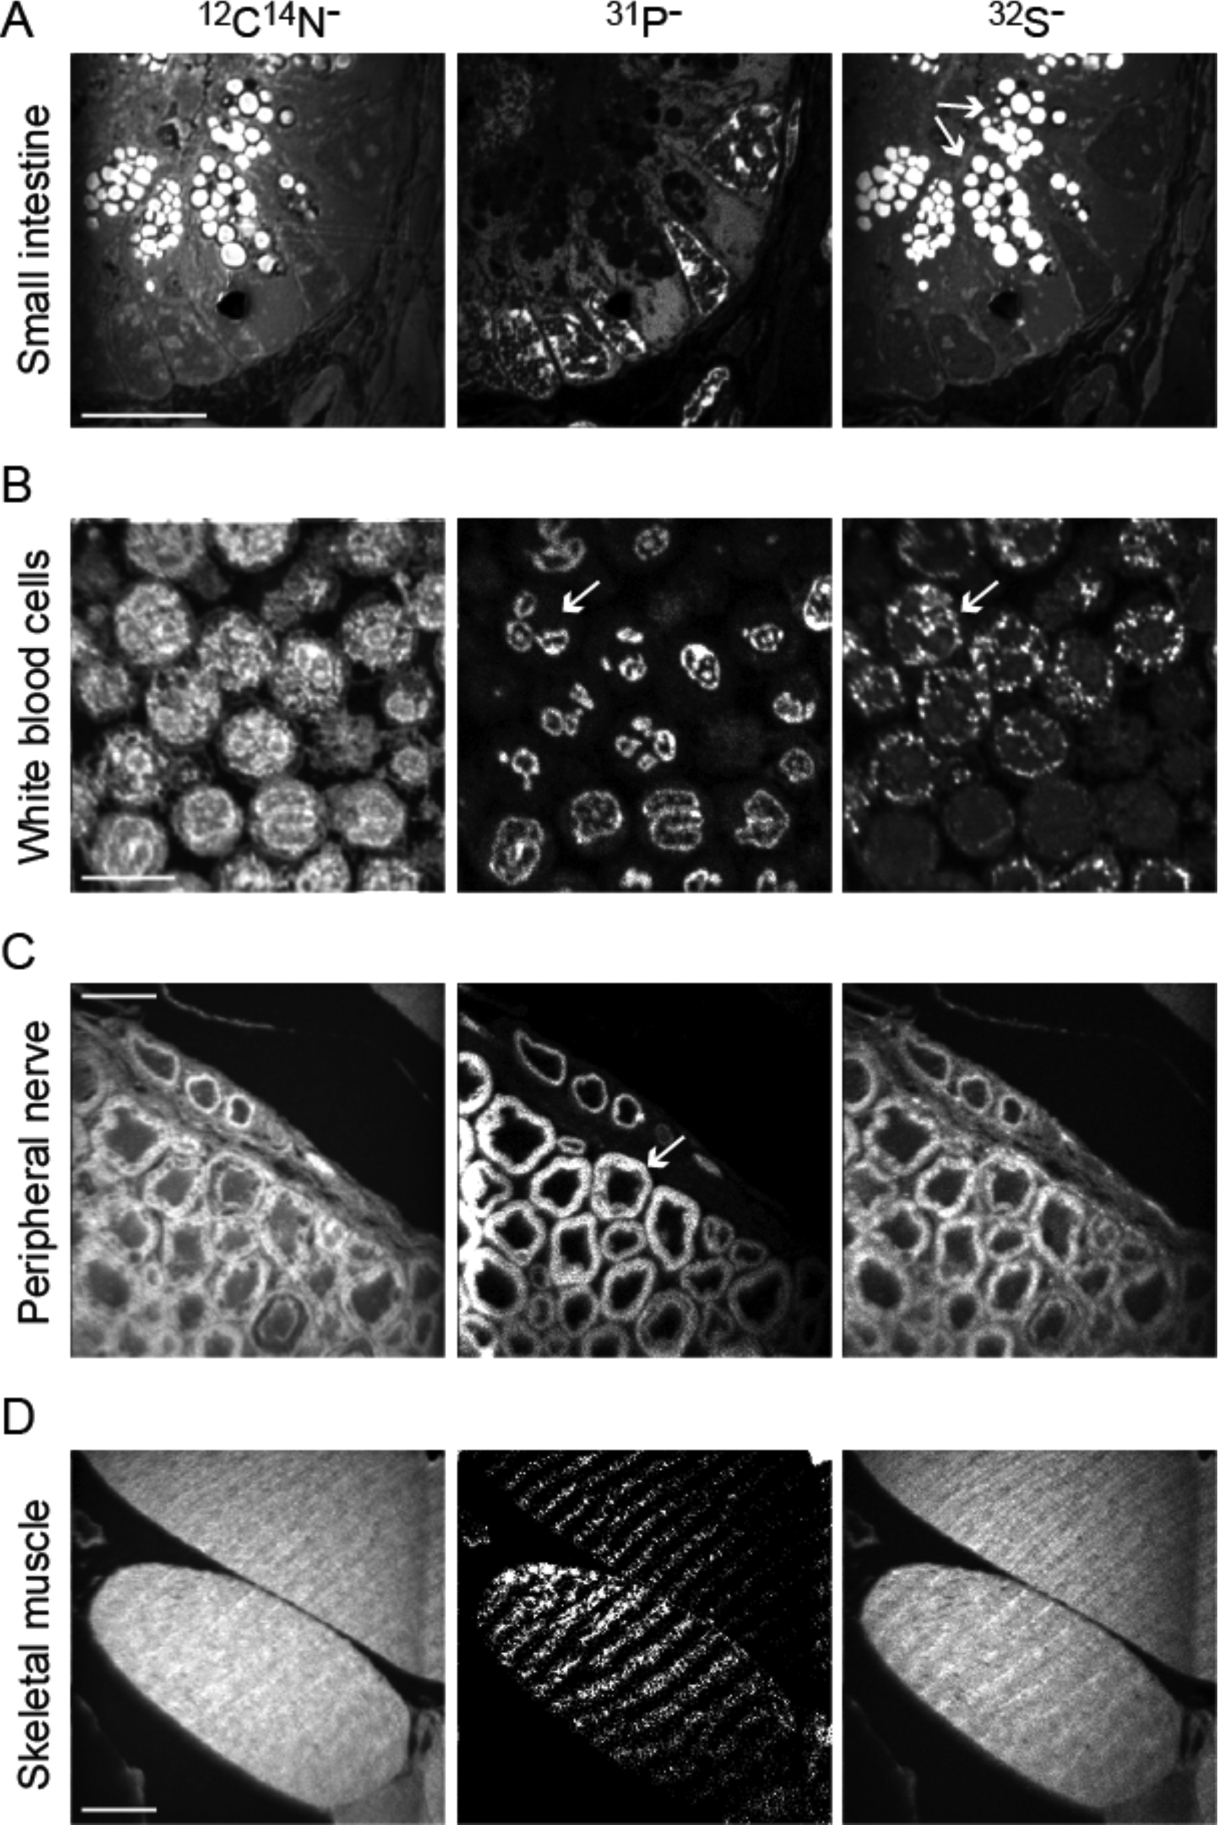
Images of 12C14N (left column), 31P (middle column), and 32S (right column) reveal complementary information to enable the resolution of cell borders, subcellular features, including some features that are stereotypical for specific cell types. Scale bars = 10μm.
(A) Images from the crypt of the murine small intestine, characterized by interspersed Panel cells. The sulfur rich granules (arrows) that define Paneth cells appear brightly in 12C14N and 32S images.
(B) Pelleted and sectioned human white blood cells. The nuclei appear bright in the 31P images, including the multi-lobed nuclei of polymorphnuclear cells (PMN, arrow). PMNs also contain sulfur rich granules evident as bright spots in the 32S images.
(C) Murine peripheral nerve in cross section. Phospholipids in the myelin sheaths (arrow) appear bright in the 31P images.
(D) Murine skeletal muscle, sectioned obliquely. Stereotypical striations are evident to varying degrees in the 3 images.
Figure 3. NanoSIMS measurement of a tracer containing a rare element.

A mitotic cell in prophase imaged in the crypt of the murine small intestine, harvested after 24 hours of labeling with bromodeoxyuridine (BrdU), a nucleotide analogue that is incorporated into newly synthesized DNA during cell division. BrdU contains contains bromine (Br), which is measurable as 81Br by NanoSIMS. The newly replicated chromosomes (arrow) appear bright in 12C14N, 31P, and 81Br images. The chromosomes appear dark in 32S images.
Mapping the cellular or intracellular distribution of specific elements may also localize and quantify elements that themselves have important biological properties beyond any specific anatomic information. For example, local concentrations of zinc and iron may regulate protein structure and/or function to serve as cofactors for specific biochemical reactions23–28. Therefore, the measurement of such elements at high spatial resolution holds promise for revealing the critical determinants of cellular or organelle function.
It is also possible to measure elements that are rare in cells/tissues, but which are a detectable component of labeling compounds or metal-conjugated antibodies. For example, the incorporation of halogenated labeling compounds can be imaged, because the natural background concentration of many such elements in cells is extremely low17, 29. The nucleotide analogue, Bromo-deoxyurine (BrdU), which is incorporated into replicating DNA during cell division, is one such example that is detectable by the direct measurement of bromine ions (e.g., 79Br, 81Br)6, 30. Bromine signal colocalizes with 31P (highly concentrated in chromatin) in segregating chromosomes during mitosis or near the nuclear membrane where chromatin is typically condensed in post-mitotic cells17.
In an approach that conceptually builds on immunostaining methods utilized for electron microscopy (“Immunogold labeling”), the direct measurement of gold-conjugated antibodies targeting an antigen of interest is also achievable with NanoSIMS31, 32. In addition to traditional antibody reagents used for EM, NanoSIMS can map cellular antigenic variation using transition metal-conjugated antibody probes, as developed for mass cytometry33. Given the large number of isotopic variants, multiplexed immunodetection of numerous antigens is feasible. With NanoSIMS, however, multi-detection is limited by the number of detectors (typically 5 or 7), in contrast to other recently developed imaging platforms that capture an unselected mass spectral range with time of flight mass spectrometry34, 35. As such, the NanoSIMS is more useful for localization of antibodies in contexts where concomitant functional metabolic tracer quantification is needed.
Many NanoSIMS applications involving direct measurement of an ion of interest are qualitative (e.g., identification of structures based on stereotypical features) or involve assessment of a dichotomous variable (e.g., labeled versus unlabeled). When considering quantitation of continuous variables, such as when mapping the subcellular distribution of rare elements, additional caveats must be considered, as differences in ionization efficiency across the surface of the sample, even within a given analytical field, may influence ion counts. Therefore, we view such measurements as semi-quantitative, the reliability of which can be enhanced through a careful selection of controls. Collectively, images based on the intensity of single ion emission provide histological delineation of cells and subcellular structures, localize bioactive elements such as zinc and iron to subcellular domains, or enable detection of labels that contain rare elements.
Tracking stable isotopes by isotope ratio measurements
Stable isotopes are intra-elemental variants differing in atomic mass due to an alternative number of neutrons36, 37. Many elements have more than one stable isotopic form; however, in the context of metabolic studies, the term “stable isotope” is often used to denote the rare variant(s) that do not radioactively decay. Stable isotopes are thus ideal tracers because their enrichment in a molecule above the natural, stable background generally does not confer any toxicity beyond those attributable to the parent molecule. In non-mammalian systems, for example, the provision of a sufficient stable isotope enriched substrate so as to achieve organism-wide atomic concentrations of approximately 20% 13C or 60% 18O—equivalent to 1–2 orders of magnitude above natural abundance—does not seem to impair growth or affect biological processes38, 39. The exception to this rule is the potential for biological effects with deuterium. At an organism-wide 2H concentration above 15%, growth is inhibited in organisms ranging from microbes to mammals40–42. Moreover, the rapid administration of 2H-water (i.e., heavy water) to achieve a circulating concentration of approximately 1% causes vertigo in humans, even though maintenance dosing after a period of equilibration is not associated with symptoms19. This likely reflects the 2-fold relative mass difference between deuterium and the more common isotope of hydrogen, in contrast to the smaller relative mass differences between stable isotopes of other elements commonly used for tracer studies. For most studies utilizing deuterium-enriched compounds at tracer doses that do not dramatically alter the systemic atom concentration of deuterium, or studies involving other commonly used stable isotopes (Carbon and Nitrogen), stable isotope tracers can be viewed as innocuous. As such, stable isotope tracers have been broadly used in model organisms and in human research subjects, including the most vulnerable groups such as critically ill children and pregnant women43.
The incorporation of a tracer enriched in a rare stable isotopic variant is detectable by an increase in the isotope ratio relative to the natural background ratio (Figure 4). Historically, isotope ratios in biological specimens exposed to stable isotope tracers were measured in bulk with isotope ratio mass spectrometry44. Even with instrumental modifications designed to measure small sample sizes, such measurements required pooling of cells or cellular constituents45. The simultaneous measurement of multiple different ionic species from sub-50nm domains enables configuration of the NanoSIMS instrument as a nanoscale isotope ratio mass spectrometer. In order to quantitatively track stable isotope tracers, the NanoSIMS must be tuned such that two of the detectors capture the counts of two different isotopes of a given element6, 7. An important advantage of measuring a molecular label via the isotope ratio—as opposed to direct single-isotope measurement as achieved with halogenated labels—is that subtle changes in ionization efficiency across a sample surface affect both isotopes of a given mass similarly6. As such, tracking labels via measurement of an isotopic ratio serves the added advantage of being self-normalizing, and hence more quantitative. Therefore, the power of applying NanoSIMS to biological questions stems from the coupling of quantitative functional measurements with an imaging resolution that reveals sufficient cellular details so as to define individual cells and subcellular structures6, 17, 21, 22, 46.
Figure 4. Quantitative imaging of stable isotope tracers with NanoSIMS.

A melanoma cell line was labeled for 12 hours with 15N-glutamine, then pelleted, embedded (EPON), sectioned to 0.5 microns, mounted on silicon wafers, and imaged with NanoSIMS. There are different software options for visualizing NanoSIMS images, including L’Image, Look@NanoSIMS, WinImage, and OpenMIMS, which was developed as an opensource plugin to ImageJ. All images shown in Figures 2–4 have been generated in OpenMIMS. In this example, quantitative mass images of 12C15N (top left) and 12C14N (bottom left) were acquired in parallel. These two measurements were utilized to generate a quantitative ratio image (15N/14N), shown here as a hue saturation intensity (HSI) image. The lower bound of the scale (blue) is set at the naturally occurring ratio, which for 15N/14N is 0.37%. The upper bound of the scale is set to demonstrate regional differences in enrichment (such has the intense labeling hotspots correlating to nucleoli contained in the nucleus (arrows). In this image, the upper bound is set to 1.85% (or 500% above the natural ratio). Any changes to the scale will affect the color pattern and thus the visual interpretation of the data but the underlying quantitative data remains unmodified. The inset shows magnification of a small region at the margin of a nucleolus (3 × 3 pixels). The numbers in the pixels indicate the ion counts in each pixel. Top number = 12C15N ions. Middle number = 12C14N ions. Bottom number = 15N/14N ratio expressed as a %: (total 12C15N ions / total 12C14N ions) × 100.
Overview of biological applications of NanoSIMS
Over the past decade, there has been an expansion of NanoSIMS applications to biology as the early experience with studies of microbiology have been extended to other fields and organisms ranging from plants to humans. Here, we review several broad thematic applications of NanoSIMS, describing specific studies that illustrate common experimental themes or which exemplify the unique capabilities of the instrumentation.
Nutrient flux in microbial organisms
NS analyses have been most extensively demonstrated in the field of microbiology, where metabolic pathways have been extensively interrogated with NanoSIMS in a wide variety of microbial organisms in different environmental contexts47. Early applications involved quantification of carbon and nitrogen fixation by individual bacteria48–50. Since there are no radioactive isotopes of nitrogen—and therefore no possibility of performing autoradiographic studies as achievable with 14C tracers—such studies have provided a previously unappreciated demonstration of nitrogen metabolism51. Moreover, the biologically relevant nuance revealed by measurements of single organisms is exemplified by studies that have found unexpected heterogeneity that would not be appreciated with bulk analyses; for example, single cell measurements of nitrogen fixation have revealed functionally distinct subpopulations within a larger population of otherwise isogenic bacteria52. Probing of microorganisms with isotopically labeled substrates in their natural microenvironments has also revealed non-cell autonomous intercellular nutrient fluxes within bacterial colonies and/or symbiotic fluxes between microbes and their hosts48, 53–57. Such examples of NanoSIMS revealing how microbes metabolically interact with each other and with their microenvironment is conceptually similar to the metabolic pathways that are important in multicellular organisms ranging from plants to animals. In this manner, the microbiological experience has provided a template for the application of NanoSIMS to studies of higher organisms.
Nucleic acid synthesis and cell division
Numerous studies have utilized stable isotope tagged thymidine, which is incorporated as substrate for DNA synthesis during cell division, in a method that is analogous to the utilization of radiolabeled thymidine or halogenated nucleotide analogues19, 21, 46, 58–60. In most studies, cell division has been detected by a binary labeling event: for example, cells that divided during a period of 15N-thymidine administration are identified as 15N-enriched in their nuclei, whereas undivided cells are unlabeled. This has enabled precise measurement of the dynamics of cardiac myocyte proliferation or new adipocyte formation during aging and in the context of physiological stimuli.
What does the identification of cell division with NanoSIMS provide above that which is achievable with more traditional methods, such as the use of halogenated analogues coupled with fluorescence microscopy? First, the possibility of tracking cell division with non-toxic stable isotopes mitigates the possibility that the labeling reagent itself modulates the biologic endpoints, an issue of particular relevance to studies of slow turnover tissues that may require a sustained period of label administration for accurate interrogation. Second, the spatial resolution afforded by NanoSIMS provides higher fidelity identification of cell-type and cell borders than that achievable with light microscopy alone21, 46. This is particularly critical in heterogeneous tissues comprised of cell types with disparate rates of turnover where misattribution of cell identity may be a source of measurement error. Third, the precision achievable with mass spectrometry allows for the capture of cell turnover in complementary fashion by quantitative measurement of dilution of label as part of a pulse-chase experimental design17, 46. Such an approach is facilitated by the quantification of DNA labeling as a continuous variable across 2 or more orders of magnitude, a quantitative range not feasible with other labeling methods (e.g. fluorescence)17. Therefore, the application of NanoSIMS is most powerfully applied to questions related to DNA synthesis and cell division, where higher fidelity imaging and quantification are desired, or for studies of slow turnover tissues where prolonged administration of innocuous stable isotope labels facilitates study designs that would not be feasible with DNA labels with less favorable toxicity profiles.
Lipid metabolism
Early applications of NanoSIMS to lipid biology mapped stable isotope labeled lipid components of synthetic lipid bilayers, an approach that has since been extended to map labeled lipid species in the plasma membranes of cells61–63. More recent work has leveraged the fact that lipid droplets are readily identifiable in cells and tissue sections after fixation with osmium tetroxide. Hypoxia has been shown to drive triglyceride synthesis and lipid droplet formation in the neural tissue of Drosophila, based on the trafficking of labeled precursors to lipid droplets64. NanoSIMS analyses have revealed the heterogeneity of whole cell lipid metabolism in populations of adipocytes within murine adipose tissue depots after administration of labeled triglycerides or lipogenic precursors65. Stable isotope tagged triglycerides have been tracked from the murine circulation into small lipid droplets in individual cardiac myocytes, which unexpectedly occurred independently of the standard pathway of an endothelial cell intermediary66. Collectively, these examples underscore the power of NanoSIMS to reveal aspects of lipid biology which are difficult to directly assess by other methods, because: (1) the question requires quantification and mapping of subcellular lipid-containing structures, (2) the target tissue provides insufficient material for more traditional bulk mass spectrometry methods due to the small size of the model organism (e.g. Drosophila), or (3) single cell resolution reveals unexpected heterogeneity of whole cell lipid metabolism in a large population of cells that might otherwise appear homogeneous.
Protein turnover
Amino acid tracers have also been utilized in studies of protein turnover, taking advantage of the fact that a dominant intracellular fate of amino acids is as precursors for protein synthesis67. NanoSIMS has been deployed to demonstrate fundamental questions related to protein synthesis and trafficking in small domains in a variety of organisms68. 15N-leucine pulse chase studies in frogs and mice demonstrated focal hotspots of rapid protein turnover at the extreme tips of the stereocilia that project from hair cells in the inner ear69. Through 15N pulse-chase studies conducted in rodents over even longer time-scales of months to years, extremely long-lived proteins were detected in discrete subcellular domains corresponding to the nuclear pore complex or chromatin70. However, unlike proteomics approaches used for bulk-sample analyses, NanoSIMS does not provide protein specificity. NanoSIMS also cannot distinguish between alternative metabolic fates of amino acids, for example their catabolic utilization as an energy source or divergence to nucleic acid synthesis. As such, for many applications, alternate metabolic fates must be considered and NanoSIMS will provide maximal impact when the unique spatial resolution afforded by NanoSIMS is leveraged together with complementary methods that provide molecular specificity70, 71.
Glucose metabolism
As a critical source of fuel for cellular homeostasis and growth, glucose and its metabolism is highly relevant to fundamental cellular physiology and disease states ranging from diabetes to cancer. The centrality of glucose metabolism in biology is underscored by the widespread use of glucose tracers in medical imaging, such as tracking 18F-2-deoxyglucose (FDG) by positron emission tomographic (PET) imaging. When coupled with isotopically labeled glucose or intermediates in glucose metabolism, NanoSIMS can provide conceptually similar data, but at cellular and subcellular resolution. In one example, 13C-glucose labeling of glycogen in the liver and brain, enabled an assessment of glycogen synthesis72. This study extended what was known from bulk tissue studies by defining the temporal spatial dynamics of glycogen synthesis in the perinuclear regions of individual hepatocytes. In a study of murine atherosclerosis, a disease associated with FDG-avidity on tissue-scale PET imaging, NanoSIMS unexpectedly revealed intense glucose utilization by a subset of smooth muscle cells in the vessel wall immediately underlying the plaque, thereby demonstrating that glucose avidity was not just a manifestation of focal inflammatory cell infiltration73. These examples demonstrate the power of NanoSIMS when applied to define the spatiotemporal dynamics of glucose tracers at high resolution; however, there is an important caveat in that the carbon backbone of glucose has numerous intracellular fates, including as substrate for anaerobic and aerobic respiration, processes which produce metabolic intermediates that can serve as substrate for synthesis of components of cellular biomass, including lipids and nucleic acids. The NanoSIMS signal after glucose labeling is likely to be affected by the loss of some freely diffusible glucose metabolites during standard fixation and dehydration of the sample. As a practical consequence, therefore, NanoSIMS is most applicable to glucose tracer studies where metabolic specificity either is not necessary for the question at hand, when molecular specificity is provided by orthogonal bulk analyses, or when the metabolic fate can be deduced by observing the trafficking of label to a stereotypical intracellular structure; for example, glucose label that traffics to intracellular lipid droplets presumably has been coopted as substrate for de novo lipogenesis65, 74.
Human applications
There is extensive precedent for the utilization of stable isotope tracers in human studies, due to the aforementioned favorable lack of toxicity relative to other labeling approaches and further supported by the quantitative gain from utilization of mass spectrometry as the mode of tracer measurement43. Only recently has the NanoSIMS been applied to in vivo human studies. The first in vivo human studies have demonstrated the utility of using precursors to nucleotide salvage or de novo nucleotide synthesis to capture the birth of new white blood cells in circulation or new adipocytes in subcutaneous adipose tissue17, 46. Measurement of cellular replication in humans is likely to be of particular relevance to questions related to tissue development or response to tissue injury, including as a modality to assess mechanisms and the effectiveness of candidate regenerative therapies.
NS has also been applied to study the dynamics of β-amyloid deposition in the brains of patients with Alzheimer’s Disease9. In this study, tracer was administered to hospice patients that suffered from dementia and who agreed to donation of their brains post-mortem for NanoSIMS analysis. This experience underscores one of the more important challenges to more widespread application of NanoSIMS to human studies, namely the requirement to obtain tissue. While certain more superficial tissues, such as adipose tissue, can be repetitively sampled at prospectively defined intervals with minimal risk, sampling of internal organs in most cases will require coordination with a surgical procedure that is part of the subjects clinical care or collection of post-mortem tissue at autopsy. An obligate consequence of post-mortem tissue collection, as used in the Alzheimer’ study, is the introduction of a variable, and difficult to predict, time interval between in vivo label administration and the acquisition of tissue.
A second important aspect of human translational studies is that in contrast to model organisms, which are bred in controlled environments and in many instances genetically in-bred, human translational studies must contend with greater variability in physiological and pathophysiological processes and hence will generally require higher numbers of subjects to achieve sufficient statistical power. This reality establishes a pressure point for human NanoSIMS studies, where the cost of NanoSIMS and analytical throughput limitations may render some high-impact experiments practically challenging. Therefore, NanoSIMS may be most powerfully applied to human biological questions where the requisite statistical power is dependent on the number of organelles or cells analyzed—such as comparisons between cell populations within a heterogeneous tissue—rather than on comparisons between different human cohorts or experimental groups. Aside from these practical considerations, no other method achieves similar sub-organelle resolution for functional, cell biological studies in humans.
Experimental design and analytical considerations
Given the relatively limited number of NanoSIMS instruments dedicated to biological applications world-wide, many of the practical aspects related to the design and conduct of a biological experiment for NanoSIMS analysis have not been comprehensively discussed, nor have standardized approaches to sample preparation and instrumental analysis been developed. Here we provide a practical approach to NanoSIMS experiments, referencing the published literature when relevant and reflecting our cumulative experience with a wide variety of sample types and experimental systems.
Analytical considerations
Although it is beyond the scope of this review to detail the specifics of operating a NanoSIMS instrument, a few analytical considerations are worthy of mention due to their direct relevance to upstream experimental design. There is substantial variability in the ease with which individual elements across the periodic table are measured by NanoSIMS. The ionization efficiency inherent to any given element is a critical determinant of sensitivity and therefore of analytical throughput. If an element is not measurable as a native ion due to poor ionization efficiency, then it may be measurable as a di- or poly-atomic cluster. The most broadly utilized example of this concept is the analysis of nitrogen. Due to the extremely low electron affinity of native nitrogen, the practical measurement of isotope ratios of nitrogen (15N/14N) is possible with high sensitivity through the capture of nitrogen containing polyatomic ions, most commonly CN− (12C15N/12C14N)7, 75. Polarity of ions is an additional factor. When operating in the common negative ion mode using the cesium source, for example, biologically important elements, such as iron or zinc, can only be captured as a di- or poly-atomic cluster (e.g. in oxide form)23, 76.
A second consideration pertains to the number of measurable ionic species, which is dictated by the detector configuration. NanoSIMS instruments have as few as 4 and as many as 7 functional detectors. In principle, therefore, an instrument with 7 detectors can measure up to 3 isotope ratios, corresponding to 3 different stable isotope labels. The utilization of automated peak switching, where two different ionic species are measured in an alternating fashion with acquisition of successive planes of increasing depth, augments the number of detectable ions74, 77. This approach can be very useful for applications where it is desirable to measure multiple labels, while still capturing ions that provide histological information (e.g. 31P and 32S).
Physical constraints on analytical mass range limit multiplexing at the extremes of the mass spectrum. When at least one detector is tuned to capture elements of high mass such as Au, detectors in the lower range cannot be physically aligned in close enough proximity along the focal plane to simultaneously capture ions of close mass (e.g. 12C15N and 12C14N)31. Conversely, when tuned to 1H (e.g. for 2H/1H ratio measurements), configuring the detectors at the extremes of the radius of the mass spectrometer limits the highest mass to approximately 25X that of the lowest mass. As such, mass 28 (28Si−) is at the upper limit of measurable masses when tuned to 1H78. Such mass constraints are of particular relevance in biology because deuterated molecules are commonly utilized stable isotope tracers74. One potential solution is to obtain data sequentially for two different mass ranges, an approach that requires a retuning step. Not only is this time-consuming, but it also means that the two different sets of imaging data are not acquired simultaneously from the same sputtered material. Another option is to capture the hydrogen ratio as a polyatomic cluster (e.g. C2D/C2H)74, 77, 79, 80. This approach pushes the mass resolution limit of the commercial NanoSIMS such that C2D cannot be completely separated from other polyatomic species of similar mass. The C2D approach is not therefore applicable when high accuracy, high precision measurements are required; however, the approach is valuable for biological experiments where the degree of labeling is high and/or when relativistic quantification between organelles or cells is sufficient.
The a priori consideration of requisite accuracy and precision is of more generalizable import, beyond the specific instance of deuterium measurements. Achievement of higher accuracy and precision comes at the cost of reduced analytical throughput. High precision measurements require obtaining sufficient ion counts as dictated by the Poisson distribution. Meeting higher ion count requirements translates into greater time of acquisition for each imaging field. NanoSIMS measurements requiring the highest degree of accuracy must also account for specific sources of instrumental artifact. The so-called quasi-simultaneous arrival (QSA) effect occurs when two or more ions arrives at the detector at a similar time and as a result are counted as one, a consideration when measuring abundant ions81. The QSA effect disproportionately affects the more common ionic form, and therefore results in an artificial increase in the measured relative concentration of the more rare isotopic variant. Although there are methods to correct for QSA, introduction of a correction coefficient introduces an unmeasured variable that may not always fully account for the degree of QSA. The topography of the sample surface may also impact the sputtering process and in turn ionization efficiency, often in unpredictable ways. In addition, regional variability in the molecular composition of the sample itself may influence ionization efficiency by the so-called matrix effect. Because it is difficult to account for and correct all such instrumental artifacts, the verification of subtle isotopic enrichment within a given sample requires frequent comparisons with standards and/or unlabeled control samples, further increasing analytical time. Due to these collective issues, operating the NanoSIMS instrument to achieve the highest accuracy and precision is time consuming. Because testing biological hypotheses with sufficient statistical power often requires a sufficiently high “n,” the optimal experiment may be rendered impractical if high precision and accuracy is required. Fortuitously, the intrinsic variance of many biological systems often greatly exceeds any variability introduced by subtle analytical artifact. Therefore, it is often worth sacrificing some degree of analytical precision and accuracy to gain analytical throughput.
Labeling protocol
For experiments involving measurement of tracer(s), a first question is the choice of isotopic label. The decision of which elemental component(s) of a molecule to enrich with a rare isotopic variant is dictated by a combination of biological and practical considerations, most of which are related to achieving an optimal balance between signal and noise. Isotope ratio measurements with NanoSIMS involve counting atoms of the rare versus more common isotopic variants. Therefore, in order to minimize tracer dilution by high background, the ideal stable isotope tag is one with low terrestrial abundance (low natural isotope ratio) and relatively low total elemental concentration in the target sample. As an example, if a candidate tracer molecule contains both nitrogen and carbon, we generally select 15N as the label. Carbon is a more abundant element than nitrogen in most biological samples, which is compounded by the fact that the rare variant of carbon (13C=1.07%) is more abundant relative to the rare variant of nitrogen (15N=0.37%). In addition, embedding resins commonly used for preparation of tissue sections are carbon-rich, further diluting signal from 13C-labeling. While these issues usually do not render 13C unusable as a label, the lower signal relative to background comes at the cost of a longer requisite analysis time to detect label in a statistically meaningful manner.
A second question pertains to which position or positions in the tracer molecule to enrich in the rare isotopic variant. It is generally desirable to maximize signal by enriching as many of the molecular positions with the rare variant as long as synthetically feasible and not cost prohibitive. The one caveat to this rule is that atoms in different molecular positions may have different metabolic fates and therefore in some instances the biological question at hand may require enrichment with the rare variant at a specific molecular position.
Finally, careful consideration to dose, timing, and route of administration is crucial. With cell culture experiments, the kinetics of the biochemical pathway of interest is the primary variable to consider, because label dosing can be carefully controlled with defined culture media. For in vivo studies, there are additional considerations in order to achieve optimal tracer concentration and exposure duration at the target domain. For example, experiments with microorganisms in their natural ecology may have to contend with diffusion of liquid or gas tracers into the surrounding environment. In order to achieve sufficient tracer exposure, barriers to constrain tracer diffusion may be required82, 83, or the natural ecology may be sampled in a controlled environment and/or artificially recapitulated in the laboratory at a small scale in order to achieve controlled labeling conditions84, 85. For in vivo studies in model organisms, the published literature regarding the physiological concentration, distribution, and metabolism of the parent molecule can inform a dosing protocol. For example, when a biological process of interest is slow or when discrete labeling events are infrequent, prolonged administration of label may be indicated21, 46. Pulse-chase labeling protocols introduce the dimension of time, which is particularly powerful when combined with the quantitative power and spatial resolution conferred by NanoSIMS. The careful and collective consideration of the aforementioned aspects of label selection and dose prior to the first experiment serves to minimize analytical time spent validating labeling parameters, thereby accelerating the discovery process.
Sample preparation
Sample preparation encompasses a range of different steps undertaken from the time of sample harvest to the introduction of the sample to the NanoSIMS instrument. Imperative to this process is the production of a sample that is mounted on the support structure that can be introduced into the analysis chamber at high vacuum, and which has been prepared in a manner that optimizes analytical throughput.
First, one must determine how to preserve the sample. For cells and tissues, this typically requires some sort of fixation. Similar to other high resolution imaging modalities, optimization of fixation with cocktails of multiple different chemical fixatives produces the highest quality images. However, optimal fixation may come at the cost of losing the possibility of performing complementary staining protocols. Osmium tetroxide, which is used to preserve lipids, stains tissues black; whereas, some of the most potent aldehyde fixatives (e.g. glutaraldehyde) impede immunologic-based stains due to the strength of crosslinking and associated autofluorescence. Therefore, fixation with formalin or paraformaldehyde is advisable when immunostaining and/or other specialized chemical stains are planned.
A related question is whether the analytical target—a molecular tracer for example—is freely diffusible and not “fixable.” In such an instance, the process of fixation and dehydration may leach the signal away. This pitfall may be solved by cryoharvesting the sample, fixation with freeze substitution, and low temperature embedding. Analysis of frozen samples in a low temperature analysis chamber is another potential solution. Existing NanoSIMS instruments do not have this capability; however, precedent of a frozen analysis chamber exists in other forms of SIMS and this may be an option with future NanoSIMS instruments86.
Once samples are mounted on an appropriate support for NanoSIMS analysis, additional preparatory steps may facilitate analytical throughput. We routinely photograph samples after they are mounted on silicon wafers in a sample holder to guide selection of analytical fields in order to minimize analytical dead time. Different forms of microscopy can be utilized, including scanning electron microscopy or differential interference contrast (DIC) microscopy to identify anatomic structures or orthogonal fluorescent labels9, 17. X-Y coordinates for target regions can be recorded and transformed to reference points for the NanoSIMS stage. After imaging the samples and recording coordinates of target regions, a layer of a conductive element can be applied by sputter coater to optimize the uniformity of ionization through dissipation of charging at the sample surface. We routinely apply a thin layer (10–20nm) of gold prior to analysis except in situations where gold itself is an analyte of interest (e.g. measurement of gold-conjugated antibodies) or when imaging delicate structures at the highest lateral resolution, where we have found that gold sputter-coating may impart a granular artifact to some of the images that are most useful for histological information (e.g. CN). Collectively, optimization of sample preparation can have a dramatic downstream effect on analytical throughput, rendering impractical experiments feasible19, 20.
Multi-modality imaging
Many biological questions may require orthogonal or complementary analyses. Due to the cost and time-intensive nature of NanoSIMS analysis, it is often advisable to use complementary bulk analytical methods such as IRMS as a confirmation of labeling and/or as a first-pass test of a hypothesis. Beyond the collection of orthogonal data sets, however, an important and evolving area involves the merger of NanoSIMS with other modalities that can be leveraged to image the same sample. Complementary imaging methods may enable resolution of subcellular structures or organelles that cannot be identified with NanoSIMS imaging alone. For example, atomic force microscopy (AFM) or electron microscopy (EM) can be merged with NanoSIMS by sequential imaging of the same sample or by analysis of adjacent sections70, 87, 88. After alignment of images, the higher resolution morphological images (EM or AFM) can identify and select structure(s) of interest to guide extraction of functional labeling data from the NanoSIMS images.
NS can also be combined with parallel imaging modalities that identify cells or structures by specific molecular features. Fluorescence in situ hybridization (FISH) has frequently been combined with NanoSIMS for microbiological applications89. As an adjunct to NanoSIMS metabolic measurements (e.g. nitrogen fixation), FISH can serve as a biomarker of microbial identity, which is of particular importance in studies of polymicrobial communities. This concept also applies to the merger of NanoSIMS analyses with immunostaining and light microscopic identification protein markers21, 90. Other forms of imaging mass spectrometry including matrix-assisted laser desorption ionization mass spectrometry (MALDI) imaging and time of flight (TOF)-SIMS may also provide complementary analytical output, albeit at lower resolution91, 92. While there are challenges to leveraging different forms of imaging mass spectrometry on the same sample, in particular those methods that utilize different approaches to sample preparation such as MALDI, the possibility of tracking metabolic labels at high spatial resolution with NanoSIMS will be powerfully complemented by parallel imaging of specific metabolites, even if obtained at lower resolution.
Conclusions and future areas of innovation
In summary, NanoSIMS quantitatively images the elemental composition of a sample surface down to a lateral resolution of ~30nm. When coupled with stable isotope tracers, the measurement of isotope ratios functionally illuminates biochemical pathways in subcellular domains. Moreover, recent improvements in the technical specifications of the NanoSIMS instrument open up a range of exciting new potential applications. The radiofrequency oxygen source greatly improves the measurement of positively charged ions, many of which are critical to cellular signaling and physiology (e.g., Ca). One of the challenges inherent to imaging free ions or other diffusible small molecules in fixed cells is that such analytes are often not stabilized by standard sample processing methods. Therefore, a new temperature controlled stage may enable analysis of non-dehydrated, frozen samples, in which freely diffusible ions and labels have been stabilized by rapid freezing.
There is also an important role for industry and academic innovation beyond advancement of the core technological specifications. One barrier to more widespread utilization of NanoSIMS is cost. While there is currently only one company (CAMECA) that commercially produces NanoSIMS instruments, and therefore no direct competitive stimulus for innovation, new instrumentation that incorporates principles of NanoSIMS and/or optimizes a narrower subset of NanoSIMS applications at higher throughput and/or lower cost would be a welcome addition to the marketplace. One such example is the SIMS-based MIBI imaging of metal-conjugated antibodies, the original proof-of-concept of which was established with a NanoSIMS instrument33, 34. The cost of performing NanoSIMS analyses, however, goes beyond that which is directly attributable to purchasing and maintaining an instrument. One aspect that currently sets NanoSIMS apart from other high-cost technologies utilized by biologists, such as genome scale sequencing, is the unpredictability of the analytical product inclusive of the requisite time to answer a given question. The unpredictability factor will be partially addressed as more applications are published, which we anticipate will lead to standardization of analytical approaches for similar questions.
Although some important studies have utilized NanoSIMS analysis as the primary experimental method, many complex biological questions will require parallel imaging, either because certain structures or cell types require additional identification beyond what NanoSIMS analyses can directly provide, or to provide molecular specificity. A more seamless integration of NanoSIMS with other imaging methods will allow for the full realization of the synergistic power of multimodality imaging, not just at the level of sample preparation, but also through optimization of software to facilitate image alignment and the merging of data sets collected sequentially on the sample or in parallel on adjacent sections93.
Finally, the level of requisite expertise to perform NanoSIMS analyses is currently a major barrier to many biology laboratories, where project leaders usually do not have the relevant analytical background to perform NanoSIMS analyses. In this regard, innovations to the operating software could have a major impact, for example, through automation of more aspects of instrument tuning and troubleshooting. Software improvements could similarly have a positive impact on analyses conducted in automated mode, where algorithms for self-correction of sputtering conditions and tuning could render automated analyses more reliable. Collectively these types of advances hold the potential to augment throughput while bringing the operation of the NanoSIMS instrument out of the realm of the highly trained specialist to the broader scientific community. Despite these collective challenges, the ever-expanding list of biological questions that have been probed and solved by NanoSIMS—many of which have not been directly accessible by other methods—provides strong rationale for the ongoing efforts to advance NanoSIMS into new areas of biology.
References
- 1.Amir el AD, Davis KL, Tadmor MD, Simonds EF, Levine JH, Bendall SC, Shenfeld DK, Krishnaswamy S, Nolan GP and Pe’er D, Nature biotechnology, 2013, 31, 545–552. [DOI] [PMC free article] [PubMed] [Google Scholar]
- 2.Anderson K, Lutz C, van Delft FW, Bateman CM, Guo Y, Colman SM, Kempski H, Moorman AV, Titley I, Swansbury J, Kearney L, Enver T and Greaves M, Nature, 2011, 469, 356–361. [DOI] [PubMed] [Google Scholar]
- 3.Chughtai K and Heeren RM, Chemical reviews, 2010, 110, 3237–3277. [DOI] [PMC free article] [PubMed] [Google Scholar]
- 4.Bodzon-Kulakowska A and Suder P, Mass spectrometry reviews, 2016, 35, 147–169. [DOI] [PubMed] [Google Scholar]
- 5.Slodzian G, Daigne B, Girard F, Boust F and Hillion F, Biol Cell, 1992, 74, 43–50. [DOI] [PubMed] [Google Scholar]
- 6.Lechene C, Hillion F, McMahon G, Benson D, Kleinfeld AM, Kampf JP, Distel D, Luyten Y, Bonventre J, Hentschel D, Park KM, Ito S, Schwartz M, Benichou G and Slodzian G, J Biol, 2006, 5, 20. [DOI] [PMC free article] [PubMed] [Google Scholar]
- 7.Peteranderl R and Lechene C, J Am Soc Mass Spectrom, 2004, 15, 478–485. [DOI] [PubMed] [Google Scholar]
- 8.Pett-Ridge J and Weber PK, Methods in molecular biology, 2012, 881, 375–408. [DOI] [PubMed] [Google Scholar]
- 9.Wildburger NC, Gyngard F, Guillermier C, Patterson BW, Elbert D, Mawuenyega KG, Schneider T, Green K, Roth R, Schmidt RE, Cairns NJ, Benzinger TLS, Steinhauser ML and Bateman RJ, Frontiers in neurology, 2018, 9, 169. [DOI] [PMC free article] [PubMed] [Google Scholar]
- 10.Castaing R and Slodzian GJ, Microscopie, 1962, 1, 395–399. [Google Scholar]
- 11.Liebl H, J Appl Phys, 1967, 38, 5277–5283. [Google Scholar]
- 12.Nunez J, Renslow R, Cliff JB 3rd and Anderton CR, Biointerphases, 2017, 13, 03B301. [DOI] [PubMed] [Google Scholar]
- 13.Castner DG, Biointerphases, 2017, 12, 02C301. [DOI] [PMC free article] [PubMed] [Google Scholar]
- 14.Malherbe J, Penen F, Isaure MP, Frank J, Hause G, Dobritzsch D, Gontier E, Horreard F, Hillion F and Schaumloffel D, Analytical chemistry, 2016, 88, 7130–7136. [DOI] [PubMed] [Google Scholar]
- 15.Penen F, Malherbe J, Isaure MP, Dobritzsch D, Bertalan I, Gontier E, Le Coustumer P and Schaumloffel D, Journal of trace elements in medicine and biology : organ of the Society for Minerals and Trace Elements, 2016, 37, 62–68. [DOI] [PubMed] [Google Scholar]
- 16.McMahon G, Saint-Cyr HF, Lechene C and Unkefer CJ, J Am Soc Mass Spectrom, 2006, 17, 1181–1187. [DOI] [PubMed] [Google Scholar]
- 17.Steinhauser ML, Bailey AP, Senyo SE, Guillermier C, Perlstein TS, Gould AP, Lee RT and Lechene CP, Nature, 2012, 481, 516–519. [DOI] [PMC free article] [PubMed] [Google Scholar]
- 18.Guerquin-Kern JL, Hillion F, Madelmont JC, Labarre P, Papon J and Croisy A, Biomedical engineering online, 2004, 3, 10. [DOI] [PMC free article] [PubMed] [Google Scholar]
- 19.Guillermier C, Fazeli PK, Kim S, Lun M, Zuflacht JP, Milian J, Lee H, Francois-Saint-Cyr H, Horreard F, Larson D, Rosen ED, Lee RT, Lechene CP and Steinhauser ML, JCI insight, 2017, 2, e90349. [DOI] [PMC free article] [PubMed] [Google Scholar]
- 20.Steinhauser ML, Guillermier C, Wang M and Lechene CP, Surf Interface Anal, 2014, 46, 165–168. [DOI] [PMC free article] [PubMed] [Google Scholar]
- 21.Senyo SE, Steinhauser ML, Pizzimenti CL, Yang VK, Cai L, Wang M, Wu TD, Guerquin-Kern JL, Lechene CP and Lee RT, Nature, 2013, 493, 433–436. [DOI] [PMC free article] [PubMed] [Google Scholar]
- 22.Hallegot P, Peteranderl R and Lechene C, The Journal of investigative dermatology, 2004, 122, 381–386. [DOI] [PubMed] [Google Scholar]
- 23.Kumar S, Rajagopalan S, Sarkar P, Dorward DW, Peterson ME, Liao HS, Guillermier C, Steinhauser ML, Vogel SS and Long EO, Molecular cell, 2016, 62, 21–33. [DOI] [PMC free article] [PubMed] [Google Scholar]
- 24.Lu J, Baccei A, Lummertz da Rocha E, Guillermier C, McManus S, Finney LA, Zhang C, Steinhauser ML, Li H and Lerou PH, Stem cell research, 2018, 28, 48–55. [DOI] [PubMed] [Google Scholar]
- 25.Moore KL, Chen Y, van de Meene AM, Hughes L, Liu W, Geraki T, Mosselmans F, McGrath SP, Grovenor C and Zhao FJ, The New phytologist, 2014, 201, 104–115. [DOI] [PubMed] [Google Scholar]
- 26.Weng N, Jiang H and Wang WX, Environmental science & technology, 2017, 51, 14426–14435. [DOI] [PubMed] [Google Scholar]
- 27.Quintana C, Bellefqih S, Laval JY, Guerquin-Kern JL, Wu TD, Avila J, Ferrer I, Arranz R and Patino C, Journal of structural biology, 2006, 153, 42–54. [DOI] [PubMed] [Google Scholar]
- 28.Byrne ME, Ball DA, Guerquin-Kern JL, Rouiller I, Wu TD, Downing KH, Vali H and Komeili A, Proceedings of the National Academy of Sciences of the United States of America, 2010, 107, 12263–12268. [DOI] [PMC free article] [PubMed] [Google Scholar]
- 29.Behrens S, Losekann T, Pett-Ridge J, Weber PK, Ng WO, Stevenson BS, Hutcheon ID, Relman DA and Spormann AM, Applied and environmental microbiology, 2008, 74, 3143–3150. [DOI] [PMC free article] [PubMed] [Google Scholar]
- 30.Lau KH, Christlieb M, Schroder M, Sheldon H, Harris AL and Grovenor CR, Journal of microscopy, 2010, 240, 21–31. [DOI] [PubMed] [Google Scholar]
- 31.Wilson RL, Frisz JF, Hanafin WP, Carpenter KJ, Hutcheon ID, Weber PK and Kraft ML, Bioconjugate chemistry, 2012, 23, 450–460. [DOI] [PMC free article] [PubMed] [Google Scholar]
- 32.Thiery-Lavenant G, Guillermier C, Wang M and Lechene C, Surf Interface Anal, 2014, 46, 147–149. [DOI] [PMC free article] [PubMed] [Google Scholar]
- 33.Angelo M, Bendall SC, Finck R, Hale MB, Hitzman C, Borowsky AD, Levenson RM, Lowe JB, Liu SD, Zhao S, Natkunam Y and Nolan GP, Nature medicine, 2014, 20, 436–442. [DOI] [PMC free article] [PubMed] [Google Scholar]
- 34.Keren L, Bosse M, Marquez D, Angoshtari R, Jain S, Varma S, Yang SR, Kurian A, Van Valen D, West R, Bendall SC and Angelo M, Cell, 2018, 174, 1373–1387 e1319. [DOI] [PMC free article] [PubMed] [Google Scholar]
- 35.Giesen C, Wang HA, Schapiro D, Zivanovic N, Jacobs A, Hattendorf B, Schuffler PJ, Grolimund D, Buhmann JM, Brandt S, Varga Z, Wild PJ, Gunther D and Bodenmiller B, Nature methods, 2014, 11, 417–422. [DOI] [PubMed] [Google Scholar]
- 36.Urey HC, Science, 1933, 78, 566–571. [DOI] [PubMed] [Google Scholar]
- 37.Sturup S, Hansen HR and Gammelgaard B, Analytical and bioanalytical chemistry, 2008, 390, 541–554. [DOI] [PubMed] [Google Scholar]
- 38.Gregg CT, Hutson JY, Prine JR, Ott DG and Furchner JE, Life sciences, 1973, 13, 775–782. [DOI] [PubMed] [Google Scholar]
- 39.Samuel D, Wof A, Meshorer A and Wasserman I, Stable Isotopes: Proceedings of the Third International Conference, 1973, 353–360. [Google Scholar]
- 40.Lewis GN, Science, 1934, 79, 151–153. [DOI] [PubMed] [Google Scholar]
- 41.Barbour HG, The Yale journal of biology and medicine, 1937, 9, 551–565. [PMC free article] [PubMed] [Google Scholar]
- 42.Lester W Jr., Sun SH and Seber A, Annals of the New York Academy of Sciences, 1960, 84, 667–677. [DOI] [PubMed] [Google Scholar]
- 43.Steinhauser ML and Lechene CP, Seminars in cell & developmental biology, 2013, 24, 661–667. [DOI] [PMC free article] [PubMed] [Google Scholar]
- 44.Schoenheimer R and Rittenberg D, Science, 1938, 87, 221–226. [DOI] [PubMed] [Google Scholar]
- 45.Polissar PJ, Fulton JM, Junium CK, Turich CC and Freeman KH, Analytical chemistry, 2009, 81, 755–763. [DOI] [PubMed] [Google Scholar]
- 46.Kim SM, Lun M, Wang M, Senyo SE, Guillermier C, Patwari P and Steinhauser ML, Cell metabolism, 2014, 20, 1049–1058. [DOI] [PMC free article] [PubMed] [Google Scholar]
- 47.Musat N, Musat F, Weber PK and Pett-Ridge J, Current opinion in biotechnology, 2016, 41, 114–121. [DOI] [PubMed] [Google Scholar]
- 48.Lechene CP, Luyten Y, McMahon G and Distel DL, Science, 2007, 317, 1563–1566. [DOI] [PubMed] [Google Scholar]
- 49.Popa R, Weber PK, Pett-Ridge J, Finzi JA, Fallon SJ, Hutcheon ID, Nealson KH and Capone DG, The ISME journal, 2007, 1, 354–360. [DOI] [PubMed] [Google Scholar]
- 50.Musat N, Halm H, Winterholler B, Hoppe P, Peduzzi S, Hillion F, Horreard F, Amann R, Jorgensen BB and Kuypers MM, Proceedings of the National Academy of Sciences of the United States of America, 2008, 105, 17861–17866. [DOI] [PMC free article] [PubMed] [Google Scholar]
- 51.Volland J-M, Schintlmeister A, Zambalos H, Reipert S, Mozetič P, Espada-Hinojosa S, Turk V, Wagner M and Bright M, The ISME journal, 2018, 12, 714–727. [DOI] [PMC free article] [PubMed] [Google Scholar]
- 52.Schreiber F, Littmann S, Lavik G, Escrig S, Meibom A, Kuypers MM and Ackermann M, Nature microbiology, 2016, 1, 16055. [DOI] [PubMed] [Google Scholar]
- 53.Ploug H, Musat N, Adam B, Moraru CL, Lavik G, Vagner T, Bergman B and Kuypers MM, The ISME journal, 2010, 4, 1215–1223. [DOI] [PubMed] [Google Scholar]
- 54.Foster RA, Kuypers MM, Vagner T, Paerl RW, Musat N and Zehr JP, The ISME journal, 2011, 5, 1484–1493. [DOI] [PMC free article] [PubMed] [Google Scholar]
- 55.Tarquinio F, Bourgoure J, Koenders A, Laverock B, Sawstrom C and Hyndes GA, The ISME journal, 2018, 12, 2796–2800. [DOI] [PMC free article] [PubMed] [Google Scholar]
- 56.Kopp C, Domart-Coulon I, Barthelemy D and Meibom A, Science advances, 2016, 2, e1500681. [DOI] [PMC free article] [PubMed] [Google Scholar]
- 57.Kopp C, Pernice M, Domart-Coulon I, Djediat C, Spangenberg JE, Alexander DT, Hignette M, Meziane T and Meibom A, mBio, 2013, 4, e00052–00013. [DOI] [PMC free article] [PubMed] [Google Scholar]
- 58.Alkass K, Panula J, Westman M, Wu TD, Guerquin-Kern JL and Bergmann O, Cell, 2015, 163, 1026–1036. [DOI] [PubMed] [Google Scholar]
- 59.Vujic A, Lerchenmuller C, Wu TD, Guillermier C, Rabolli CP, Gonzalez E, Senyo SE, Liu X, Guerquin-Kern JL, Steinhauser ML, Lee RT and Rosenzweig A, Nature communications, 2018, 9, 1659. [DOI] [PMC free article] [PubMed] [Google Scholar]
- 60.Enikolopov G, Guillermier C, Wang M, Trakimas L, Steinhauser M and Lechene C, Surf Interface Anal, 2014, 46, 140–143. [DOI] [PMC free article] [PubMed] [Google Scholar]
- 61.Kraft ML, Weber PK, Longo ML, Hutcheon ID and Boxer SG, Science, 2006, 313, 1948–1951. [DOI] [PubMed] [Google Scholar]
- 62.Frisz JF, Lou K, Klitzing HA, Hanafin WP, Lizunov V, Wilson RL, Carpenter KJ, Kim R, Hutcheon ID, Zimmerberg J, Weber PK and Kraft ML, Proceedings of the National Academy of Sciences of the United States of America, 2013, 110, E613–622. [DOI] [PMC free article] [PubMed] [Google Scholar]
- 63.Galli Marxer C, Kraft ML, Weber PK, Hutcheon ID and Boxer SG, Biophysical journal, 2005, 88, 2965–2975. [DOI] [PMC free article] [PubMed] [Google Scholar]
- 64.Bailey AP, Koster G, Guillermier C, Hirst EM, MacRae JI, Lechene CP, Postle AD and Gould AP, Cell, 2015, 163, 340–353. [DOI] [PMC free article] [PubMed] [Google Scholar]
- 65.He C, Hu X, Weston TA, Jung RS, Heizer P, Tu Y, Ellison R, Matsumoto K, Gerhardt H, Tontonoz P, Fong LG, Young SG and Jiang H, Biochemical and biophysical research communications, 2018, 504, 899–902. [DOI] [PMC free article] [PubMed] [Google Scholar]
- 66.He C, Weston TA, Jung RS, Heizer P, Larsson M, Hu X, Allan CM, Tontonoz P, Reue K, Beigneux AP, Ploug M, Holme A, Kilburn M, Guagliardo P, Ford DA, Fong LG, Young SG and Jiang H, Cell metabolism, 2018, 27, 1055–1066 e1053. [DOI] [PMC free article] [PubMed] [Google Scholar]
- 67.Hosios AM, Hecht VC, Danai LV, Johnson MO, Rathmell JC, Steinhauser ML, Manalis SR and Vander Heiden MG, Developmental cell, 2016, 36, 540–549. [DOI] [PMC free article] [PubMed] [Google Scholar]
- 68.Moore KL, Tosi P, Palmer R, Hawkesford MJ, Grovenor CR and Shewry PR, Plant biotechnology journal, 2016, 14, 1876–1882. [DOI] [PMC free article] [PubMed] [Google Scholar]
- 69.Zhang DS, Piazza V, Perrin BJ, Rzadzinska AK, Poczatek JC, Wang M, Prosser HM, Ervasti JM, Corey DP and Lechene CP, Nature, 2012, 481, 520–524. [DOI] [PMC free article] [PubMed] [Google Scholar]
- 70.Toyama BH, Arrojo EDR, Lev-Ram V, Ramachandra R, Deerinck TJ, Lechene C, Ellisman MH and Hetzer MW, The Journal of cell biology, 2019, 218, 433–444. [DOI] [PMC free article] [PubMed] [Google Scholar]
- 71.Toyama BH, Savas JN, Park SK, Harris MS, Ingolia NT, Yates JR 3rd and Hetzer MW, Cell, 2013, 154, 971–982. [DOI] [PMC free article] [PubMed] [Google Scholar]
- 72.Takado Y, Knott G, Humbel BM, Escrig S, Masoodi M, Meibom A and Comment A, Nanomedicine : nanotechnology, biology, and medicine, 2015, 11, 239–245. [DOI] [PubMed] [Google Scholar]
- 73.Guillermier C, Doherty SP, Whitney AG, Babaev VR, Linton MF, Steinhauser ML and Brown JD, JCI insight, 2019, 4, e128528. [DOI] [PMC free article] [PubMed] [Google Scholar]
- 74.Guillermier C, Poczatek JC, Taylor WR and Steinhauser ML, International journal of mass spectrometry, 2017, 422, 42–50. [DOI] [PMC free article] [PubMed] [Google Scholar]
- 75.Li K, Sinha B and Hoppe P, Analytical chemistry, 2016, 88, 3281–3288. [DOI] [PubMed] [Google Scholar]
- 76.Newsome L, Lopez Adams R, Downie HF, Moore KL and Lloyd JR, FEMS microbiology ecology, 2018, 94. [DOI] [PMC free article] [PubMed] [Google Scholar]
- 77.Guillermier C, Steinhauser ML and Lechene CP, Surf Interface Anal, 2014, 46, 150–153. [DOI] [PMC free article] [PubMed] [Google Scholar]
- 78.Kopf SH, McGlynn SE, Green-Saxena A, Guan Y, Newman DK and Orphan VJ, Environmental microbiology, 2015, 17, 2542–2556. [DOI] [PMC free article] [PubMed] [Google Scholar]
- 79.Slodzian G, Wu TD, Bardin N, Duprat J, Engrand C and Guerquin-Kern JL, Microscopy and microanalysis : the official journal of Microscopy Society of America, Microbeam Analysis Society, Microscopical Society of Canada, 2014, 20, 577–581. [DOI] [PubMed] [Google Scholar]
- 80.Bardin N, Duprat J, Slodzian G, Wu T-D, Baklouti D, Dartois E, Brunetto R, Engrand C and Guerquin-Kern J-L, International journal of mass spectrometry, 2015, 393, 17–24. [Google Scholar]
- 81.Slodzian G, Hillion F, Stadermann FJ and Zinner E, Applied Surface Science, 2004, 231–232, 874–877. [Google Scholar]
- 82.Bougoure J, Ludwig M, Brundrett M, Cliff J, Clode P, Kilburn M and Grierson P, Plant, cell & environment, 2014, 37, 1223–1230. [DOI] [PubMed] [Google Scholar]
- 83.Gorka S, Dietrich M, Mayerhofer W, Gabriel R, Wiesenbauer J, Martin V, Zheng Q, Imai B, Prommer J, Weidinger M, Schweiger P, Eichorst SA, Wagner M, Richter A, Schintlmeister A, Woebken D and Kaiser C, Frontiers in microbiology, 2019, 10, 168. [DOI] [PMC free article] [PubMed] [Google Scholar]
- 84.Pernice M, Meibom A, Van Den Heuvel A, Kopp C, Domart-Coulon I, Hoegh-Guldberg O and Dove S, The ISME journal, 2012, 6, 1314–1324. [DOI] [PMC free article] [PubMed] [Google Scholar]
- 85.Dekas AE, Chadwick GL, Bowles MW, Joye SB and Orphan VJ, Environmental microbiology, 2014, 16, 3012–3029. [DOI] [PubMed] [Google Scholar]
- 86.Misevic GN, Rasser B, Norris V, Derue C, Gibouin D, Lefebvre F, Verdus MC, Delaune A, Legent G and Ripoll C, Methods in molecular biology, 2009, 522, 163–173. [DOI] [PubMed] [Google Scholar]
- 87.Anderton CR, Lou K, Weber PK, Hutcheon ID and Kraft ML, Biochimica et biophysica acta, 2011, 1808, 307–315. [DOI] [PubMed] [Google Scholar]
- 88.Sheik AR, Brussaard CP, Lavik G, Foster RA, Musat N, Adam B and Kuypers MM, Environmental microbiology, 2013, 15, 1441–1451. [DOI] [PubMed] [Google Scholar]
- 89.Fike DA, Gammon CL, Ziebis W and Orphan VJ, The ISME journal, 2008, 2, 749–759. [DOI] [PubMed] [Google Scholar]
- 90.Saka SK, Vogts A, Krohnert K, Hillion F, Rizzoli SO and Wessels JT, Nature communications, 2014, 5, 3664. [DOI] [PMC free article] [PubMed] [Google Scholar]
- 91.Lovric J, Malmberg P, Johansson BR, Fletcher JS and Ewing AG, Analytical chemistry, 2016, 88, 8841–8848. [DOI] [PubMed] [Google Scholar]
- 92.Kopp C, Wisztorski M, Revel J, Mehiri M, Dani V, Capron L, Carette D, Fournier I, Massi L, Mouajjah D, Pagnotta S, Priouzeau F, Salzet M, Meibom A and Sabourault C, Zoology, 2015, 118, 125–131. [DOI] [PubMed] [Google Scholar]
- 93.Polerecky L, Adam B, Milucka J, Musat N, Vagner T and Kuypers MM, Environmental microbiology, 2012, 14, 1009–1023. [DOI] [PubMed] [Google Scholar]