Abstract
The effects of sulfation and calcium cations (Ca2+) on the atomic-resolution conformational properties of chondroitin carbohydrate polymers in aqueous solutions are not well studied owing to experimental challenges. Here, we compare all-atom explicit-solvent molecular dynamics simulations results for pairs of O-type (nonsulfated) and A-type (GlcNAc 4-O-sulfated) chondroitin 20-mers in 140 mM NaCl with and without Ca2+ and find that both sulfation and Ca2+ favor more compact polymer conformations. We also show that subtle differences in force-field parametrization can have dramatic effects on Ca2+ binding to chondroitin carboxylate and sulfate functional groups and thereby determine Ca2+-mediated intra- and interstrand association. In addition to providing an atomic-resolution picture of the interaction of Ca2+ with sulfated and nonsulfated chondroitin polymers, the molecular dynamics data emphasize the importance of careful force-field parametrization to balance ion–water and ion–chondroitin interactions and suggest additional parametrization efforts to tune interactions involving sulfate.
Introduction
The glycosaminoglycan chondroitin sulfate (CS) occurs in the context of its covalent attachment to extracellular protein–carbohydrate conjugates termed proteoglycans (PGs). These biomolecules may be more than 50% carbohydrate by mass, with CS contributing significantly to the carbohydrate portion and serving to interact with growth factors, cell surface receptors, and matrix proteins.1,2 To the extent that the function of biomolecules is tied to their three-dimensional (3D) structures and conformations, a significant gap exists in the understanding of CS PGs because of the difficulty in performing experimental atomic-resolution structural biology on CS. Two major reasons for this are that CS synthesis is not template-based, and CS is variably sulfated.2 Therefore, a biological sample of CS will be polydisperse with regard to both polymer length and sulfation. Toward addressing this difficulty, we and others have developed and applied computer modeling methods to describe the conformational properties of chondroitin and the tetrasaccharide that links it to PG core proteins.3−14
An additional complexity is the interactions of CS with cations. In solution, divalent calcium cations (Ca2+) significantly enhance interchain CS association while monovalent sodium cations (Na+) do not,15 which is consistent with studies demonstrating that CS preferentially binds Ca2+ over Na+.16,17 From proteoglycan calcium salt X-ray diffraction data, chondroitin 4-sulfate, also called A-type chondroitin (Figure 1), demonstrates −OSO3– ... Ca2+ ... –OOC– coordination across the β1–3 linkage,18 an interaction which has also been observed in molecular dynamics simulations of A-type disaccharide in solution.19 In the same X-ray experiments, adjacent parallel CS chains were observed to interact through −COO– ... Ca2+ ... –OOC– bridges. While this might suggest preferential Ca2+ binding by carboxylate over sulfate, it has been stated that CS sulfate binds Ca2+ more strongly than CS carboxylate.17 Also, the creation of CS calcium complex by cation exchange showed that both of these anionic functional groups were involved in the incorporation of Ca2+.20 Therefore, while it is not clear from these studies whether there is a strong preference for Ca2+ binding by carboxylate versus sulfate in CS, it is clear that both functional groups can contribute to binding. This becomes especially evident when considering other glycosaminoglycans (GAGs). For example, hyaluronan (HA), which is not sulfated and which otherwise differs from chondroitin only at the C4 chirality of the hexosamine (GlcNAc in HA vs GalNAc in CS), does bind Ca2+ through its carboxylate groups,21 as do the carboxylate groups in polyuronate.22 And, in a series of GAGs of increasing degree of sulfation, going from HA with no sulfation to CS to the highly sulfated heparin, Ca2+ binding increased with GAG anionic charge density (i.e., sulfation).23 The ability of CS to bind Ca2+ is biologically significant, as it plays a part in biomineralization24 and can serve as a reservoir of Ca2+ for the calcification of epiphyseal cartilage.23,25 That being said, it remains to be determined what individual contributions Ca2+ binding to chondroitin carboxylate groups, Ca2+ binding to chondroitin sulfate groups, and intra- and inter-chain bridging interactions of Ca2+ with chondroitin, as observed in biophysical and simulation studies, make to such biological processes.
Figure 1.
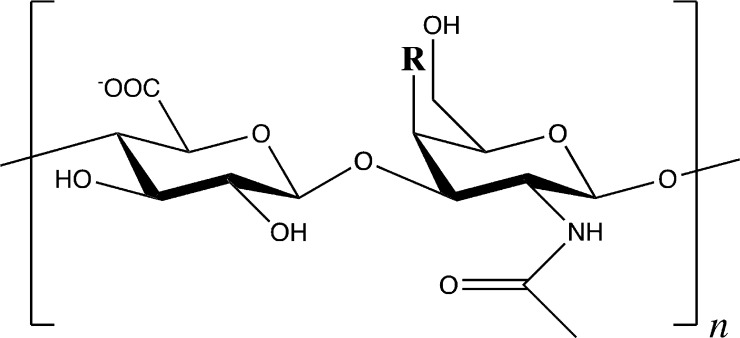
Structure of chondroitin polymer [−4GlcAβ1–3GalNAcβ1−]n. A-type chondroitin: R = −OSO3–; O-type chondroitin: R = −OH.
Thus, while chondroitin is known to bind Ca2+ and this binding property has biological relevance, atomic-resolution details of this binding under biological conditions are currently unclear. While our previous work using all-atom explicit-solvent molecular dynamics simulations of variably sulfated chondroitin disaccharides has demonstrated the effects of direct binding of Ca2+ to −COO– and −OSO3– functional groups,19 there are no such studies investigating Ca2+ in the context of proper chondroitin polymers or of multiple polymers. The current work aims at addressing this issue by considering pairs of chondroitin 20-mers in solutions of NaCl or NaCl + CaCl2. The goal is to better understand how Ca2+ can bind to chondroitin polymer and how Ca2+ may act to modulate chondroitin polymer conformation and interpolymer association.
In our analysis, we discuss not only the results but also the possible limitations to the approach and the model. For example, the need for a large system size (∼200,000 particles) to address even the limited problem of two chondroitin 20-mers (Figure 1, n = 10) in this study limits the timescale of the simulations. Additionally, proper modeling of ion-charge interactions in an aqueous environment using a molecular mechanics force field is a challenging task. Despite these possible limitations, the current approach offers a view of chondroitin interactions with Ca2+ not currently available through experimental means.
Materials and Methods
Choice of Ions and Ion Concentrations
In an attempt to best represent the extracellular environment, we ran simulations under two ion conditions: 140 mM NaCl, and 140 mM NaCl + 15 mM CaCl2. We note that the physiological Na+ concentration of 140 mM is nearly 30× the concentration of the other monovalent cation, K+, in the extracellular space.26 From our previous work19 and the survey of existing literature above, it seems that Na+ does not have significant direct interactions with chondroitin. Given the fact that K+ is also a monovalent ion and that its extracellular concentration is ∼1/30th that of Na+, we made a simplifying assumption to exclude K+. With regard to the divalent cations Ca2+ and Mg2+, while it has been demonstrated that CS binds divalent ions in general,17 biological studies focus on Ca2+, and existing available biophysical studies for use as reference for our simulations similarly focus on Ca2+.
The total extracellular calcium is in the range 2.2–2.6 mM, and the free amount is half that.27,28 For context, our simulation systems for chondroitin have ∼65,000 water molecules; 1 mM Ca2+ corresponds to a single Ca2+ cation mixed with this many water molecules. With the understanding that Ca2+ can directly bind to chondroitin, chondroitin can act as a sponge for Ca2+. However, it is impractical to maintain a 1 mM bath of Ca2+ through the addition/deletion of CaCl2 to the bulk solvent during a simulation as binding/unbinding events change the solution concentration of Ca2+. One estimate for the binding capacity of CS is one cation per disaccharide unit,29 while another study states that 1 μM CS disaccharide unit binds 0.757 μM Ca2+.30 To this end, we have added 16 Ca2+ cations per simulation system (i.e., two polymers per simulation system * 10 disaccharides per polymer * 0.757 Ca2+ per disaccharide = 15.14). This is approximately 15 mM, hence the choice of 15 mM CaCl2 for simulation conditions.
Force Field
The most current version of the CHARMM C36 additive force field for carbohydrates,31−34 available within “toppar_c36_jul20.tgz” at http://mackerell.umaryland.edu/charmm_ff.shtml (accessed November 15, 2020), was used. This version of C36 includes the addition of pair-specific nonbonded Lennard-Jones (LJ) parameters (“NBFIX”) for macromolecule–ion interactions introduced into the prior version, “toppar_c36_jul19.tgz.” NBFIX is a means of introducing custom LJ parameters on a specific pairwise basis, that is, not using the default combining rule to arrive at pairwise parameters from single-atom (atom-wise) LJ parameters. As a control, we also ran simulations involving calcium cation Ca2+ with “toppar_c36_jul17.tgz,” which does not include these additions. Relevant to the present work are the pairwise NBFIX values shown in Table 1, where OC2DP is the atom type for the three equivalent terminal oxygen atoms on sulfate groups, OC2D2 is the atom type for the two equivalent carboxylate oxygens, CAL is the atom type for Ca2+, and SOD is the atom type for sodium cation Na+. Per the CHARMM force-field definition, the LJ energy between two atoms i and j, VLJ,ij, separated at an interatomic distance of rij is computed as
 |
where εij is the force-field parameter that determines the minimum value for the function VLJ,ij, which occurs when the inter-atomic distance rij is equal to the force-field parameter rmin,ij.
Table 1. Force-Field Parameter Values for Interactions between Sulfate/Carboxylate Oxygen Atoms and Ca2+/Na+ in the c36_jul20 and c36_jul17 Versions of the CHARMM C36 Additive Force Field.
| i | j | c36_jul20 parameters | c36_jul17 parameters | ||||||||
|---|---|---|---|---|---|---|---|---|---|---|---|
| atom | atom type | charge q | atom | atom type | charge q | εij (kcal/mol) | rmin,ij (Å) | literature reference | εij (kcal/mol) | rmin,ij (Å) | literature reference |
| sulfate terminal oxygen | OC2DP | –0.650 | Ca2+ | CAL | +2 | 0.12 | 3.256 | (35) | 0.12a | 3.067a | (36) |
| carboxylate oxygen | OC2D2 | –0.760 | Ca2+ | CAL | +2 | 0.12 | 3.232 | (37) | 0.12a | 3.067a | (36) |
| sulfate terminal oxygen | OC2DP | –0.650 | Na+ | SOD | +1 | 0.07502 | 3.16 | (38) | 0.07502 | 3.16 | (38) |
| carboxylate oxygen | OC2D2 | –0.760 | Na+ | SOD | +1 | 0.07502 | 3.23 | (38) | 0.07502 | 3.23 | (38) |
No NBFIX entry for this pair. Value
shown is computed using default atom-wise LJ parameters εi and rmin,i and CHARMM force field combining rules,  and
and  .
.
We note that all SOD LJ parameters in Table 1 are the same for both c36_jul20 and c36_jul17, whereas the rmin,ij CAL parameters are shorter by 0.189 and 0.165 Å for sulfate and carboxylate interactions, respectively, in the older version of the force field, c36_jul17. As such, Ca2+ cations can more closely approach sulfate terminal oxygens and carboxylate oxygens under the older c36_jul17 force-field model. This closer approach will lead to a more favorable (more negative) Coulomb interaction energy, given the opposite signs of the charge parameters on the Ca2+ cations and the oxygen atoms. The charge parameters for all the atom types shown in Table 1 that appear in the systems considered here, as described below, are identical in c36_jul20 and c36_jul17. Water molecules were represented using the TIP3P model39 included with the CHARMM force field, and Na+/Ca2+–water interactions are identical between c36_jul20 and c36_jul17.
System Construction
Chondroitin 20-mers were built with the sequence [−4GlcAβ1–3GalNAcβ1-]10 and using default force-field internal coordinates except for glycosidic dihedrals, which were set based on favored conformations from all-atom explicit-solvent simulations of chondroitin disaccharides.19 Specifically, glycosidic dihedrals were ϕ = −83.75° and ψ = −156.25° in all GlcAβ1–3GalNAc linkages and ϕ = −63.75° and ψ = 118.75° in all GalNAcβ1-4GlcA linkages, where ϕ is defined by the atoms O5-C1-O-C3/4 and ψ by the atoms C1-O-C3/4-C2/3, and resulted in an extended polymer conformation with an end-to-end distance of 99.2 Å, as measured from C1 of the reducing-end GalNAc to C4 of the nonreducing-end GlcA. A-type chondroitin sulfate was created from this O-type (nonsulfated) polymer by the conversion of the axial C4 hydroxyl groups of all GalNAc residues to sulfate groups. The polymer was placed with its center of geometry at the center of a box with an edge length of 124.3 Å and was oriented such that its largest to smallest principal axes were aligned with the x, y, and z axes of the box, respectively. The polymer was duplicated, and one copy was translated 30.4 Å in the +z direction and the other 30.4 Å in the −z direction so that the two polymers were parallel in their longest dimension. The box was filled with water molecules at the experimental liquid water density, and water molecules overlapping with polymer atoms were deleted. Water molecules were randomly replaced with Na+ and Cl– ions to achieve 140 mM NaCl. Sixteen Ca2+ cations were added to some of the systems by randomly replacing sixteen water molecules. A total system net charge of zero was achieved by the random replacement of water molecules by either Na+ or Cl–, as appropriate. The total number of atoms in the system was approximately 190,000. Throughout the text, systems are labeled with names according to whether the polymer is A-type or O-type. The presence of sixteen Ca2+ cations is indicated by the subscript “Cal,” and the use of the older parameter set c36_jul17 instead of the most recent parameter set c36_jul20 is indicated by a single apostrophe. Table 2 summarizes the six systems.
Table 2. System Names and Differences for the Six Systems Studied.
| system name | chondroitin type | C36 parameters | contains Ca2+? |
|---|---|---|---|
| A | A | c36_jul20 | no |
| ACal | A | c36_jul20 | yes |
| A’Cal | A | c36_jul17 | yes |
| O | O | c36_jul20 | no |
| OCal | O | c36_jul20 | yes |
| O’Cal | O | c36_jul17 | yes |
Molecular Dynamics Simulations
Each of the six systems was simulated in quadruplicate, with different random initial atomic velocities to generate a unique trajectory for each simulation. Each simulation had a production stage of 300 ns, during which trajectory snapshots were taken every 0.1 ns, yielding 3000 snapshots per simulation for subsequent analysis. Production simulations were in the constant particle number, constant volume, constant temperature ensemble (NVT), and used periodic boundary conditions,40 the SHAKE algorithm41 to constrain bonds involving hydrogens and water geometries to equilibrium parameter values, and leapfrog Verlet integration42 to run Langevin dynamics43 at 310 K with a friction coefficient of 0.1 ps–1. Coulomb and LJ interactions employed a 10 Å spherical cutoff. The particle mesh Ewald (PME) method44 with a grid spacing of ∼1 Å was employed to account for Coulomb interactions beyond the cutoff. An isotropic correction was applied to account for LJ interactions beyond the cutoff40 and a switching function45 was used to smooth LJ interactions in the interval 8–10 Å. These simulations were run with the OpenMM46 module in the CHARMM v c41b2 software.47 Prior to production, each system was minimized for 1000 steps using the conjugate gradient algorithm48,49 and then heated to 310 K by velocity reassignment every 1000 steps over a total of 20,000 steps with harmonic positional restrains on non-hydrogen atoms of the polymers, all using the NAMD software v 2.13.50 Heating was followed by a 100 ps equilibration run with OpenMM/CHARMM. Simulation conditions for heating and equilibration were analogous to the production simulations. To determine the optimal edge length of the periodic box for NVT simulations, the NAMD software was used to perform constant particle number, constant pressure, constant temperature ensemble (NPT) heating and equilibration, with simulation conditions analogous to the production simulations. The target temperature for the NPT simulations was 310 K, and the target pressure was 1.01325 bar. NPT heating used the same protocol as that described for NVT heating, including initial minimization, and with the addition of a Langevin piston barostat.51 NPT equilibration, using the same barostat, was for 1 ns. The edge length for subsequent NVT simulation of the system was then computed as the average of the edge length values sampled every 200 fs from the last 0.5 ns of this 1-ns NPT simulation.
Methyl Sulfate Simulations
We used the same protocol described above for chondroitin to perform methyl sulfate (CH3OSO3–) simulations. Methyl sulfate was modeled using either the c36_jul20 (MeS) or the c36_jul17 (MeS’) version of the CHARMM General Force Field (CGenFF).52,53 The two CGenFF versions have the same sulfate terminal oxygen LJ and charge parameters as the corresponding versions of the carbohydrate force field used for the chondroitin simulations (Table 1; in CGenFF, the sulfate terminal oxygen atom type is OG2P1). The box edge length was 24.6 Å, and the system contained ∼1500 atoms, including 1 Ca2+, 2 Na+, and 3 Cl– ions. Because of the single instance of sulfate and the single Ca2+ in the system, trajectory snapshots were taken every 0.01 ns to obtain sufficient statistics for g(r) analysis, yielding 30,000 snapshots per simulation.
Data Analysis
Radial distribution functions g(r), minimum interpolymer distance, polymer–Ca2+ binding, polymer end-to-end distance, and polymer radius of gyration were computed from production simulation snapshots using utility functions in and scripting with the CHARMM software. Periodic boundary conditions were taken into account when computing g(r), minimum interpolymer distance, and polymer–Ca2+ binding. Each g(r) was scaled by 1/<g(r8–10)>, where <g(r8–10) > is the average value of that g(r) in the interval 8–10 Å to ensure the value of g(r) = ∼1 for r = 10 Å. The VMD software54 v 1.93 was used for visualization and the creation of molecular graphics. Plots were created with Gnuplot v 5.4.
Results and Discussion
Sulfate–Calcium Binding
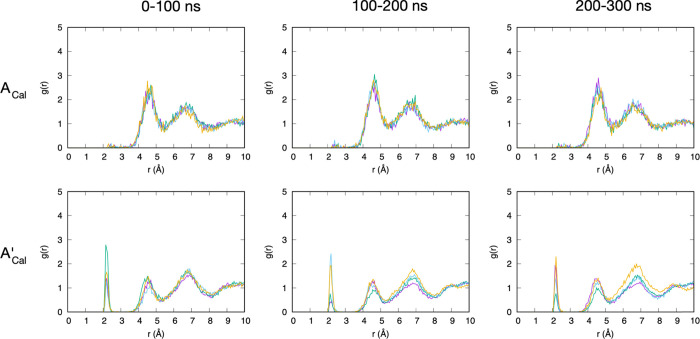
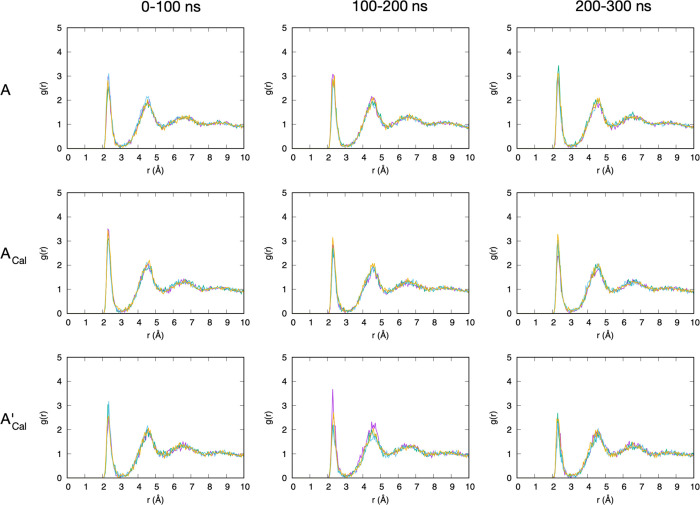
A-type chondroitin contains two functional groups per disaccharide that each carry a net −1 charge at physiological pH, a sulfate and a carboxylate (Figure 1). Radial distribution functions g(r) can show the relative propensity of Ca2+ and Na+ to partition out of bulk solution and associate with these functional groups. In the case of sulfate, we consider the three terminal oxygen atoms, which in the force-field representation have identical atom type and partial charges and are more solvent exposed and negatively charged than the oxygen atom that connects sulfur to GalNAc C4. As such, they are well suited to associate with positive ions from the solution. g(r) for sulfate terminal oxygens and Ca2+ in both force-field representations contains three distinct peaks between 2 and 8 Å, implying Ca2+ ordering in three separate shells around sulfate. While peak locations are essentially the same for both force fields, with a separation between peaks of ∼2.3 Å, there is a striking difference in the height of the first peak. In the most current force field, c36_jul20, the first peak is barely perceptible, implying that direct interaction (i.e., without bridging water molecules) is uncommon relative to water-bridged association (Figure 2, top row; Figure 3). In contrast, with the previous parameter set contained in c36_jul17, there is a distinct first peak (Figure 2, bottom row). This contrasting behavior correlates with a 0.189 Å increase in rmin,ij for this interaction from c36_jul17 to c36_jul20 (rmin,ij = 3.067 and 3.256 Å, respectively; see Table 1, first row for all charge and LJ parameters for this interaction). Because rmin,ij is larger in c36_jul20 than in c36_jul17, the interaction will be weaker in the former with all else being the same, and this emerges as a greatly reduced first peak in the former’s g(r).
Figure 2.
Sulfate terminal oxygen–Ca2+ radial distribution functions for A-type chondroitin. ACal = A-type chondroitin simulation with Ca2+ using the c36_jul20 force field. A’Cal = A-type chondroitin simulation with Ca2+ using c36_jul17 force field. In each panel, the four different-colored traces are from four independent simulations. Each 300 ns simulation has been analyzed in 100 ns blocks.
Figure 3.
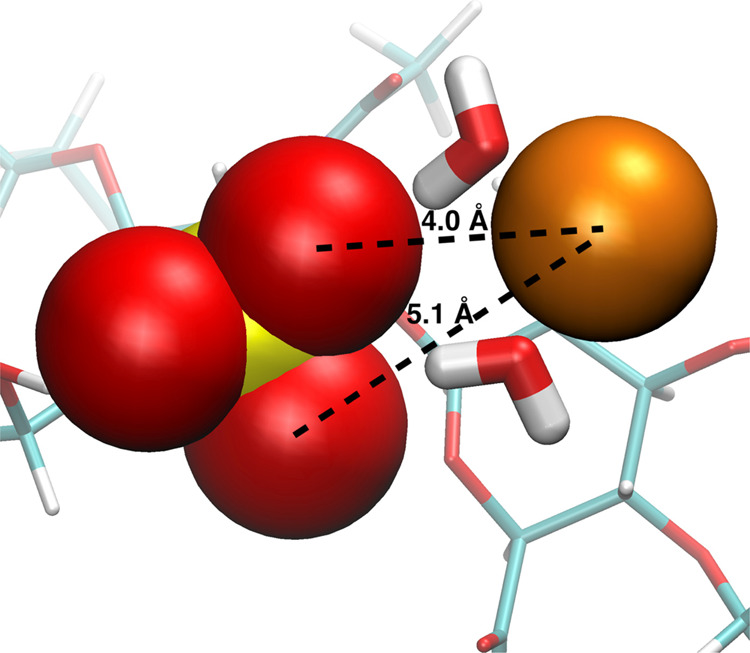
Water-bridged association between sulfate terminal oxygen atoms (red spheres) and Ca2+ (orange sphere) in A-type chondroitin. The snapshot is from a simulation with the c36_jul20 force field (ACal).
An alternative explanation for the very small first peak in the sulfate terminal oxygen–Ca2+g(r) for c36_jul20 is competition for the binding of Ca2+ with carboxylate oxygens; however, this is not the case for two reasons. The first is that carboxylate binding with Ca2+ is more favorable in c36_jul17 than in c36_jul20 (Table 1, rmin,ij values for OC2D2–CAL; see also results below), yet c36_jul17 has a much larger first peak in the sulfate terminal oxygen–Ca2+g(r) (Figure 2, top vs bottom rows). The second is that similar g(r) behavior is seen for methyl sulfate (CH3OSO3–) with Ca2+. As with chondroitin A, the sulfate group in methyl sulfate is deprotonated and therefore negatively charged at a physiological pH. Unlike chondroitin, methyl sulfate does not contain a carboxylate functional group, and this difference allows the separation of carboxylate binding effects from sulfate binding. The c36_jul20 sulfate terminal oxygen–Ca2+g(r) traces for A-type chondroitin and for methyl sulfate are practically identical (Figure 2, top row vs Figure 4, top). Therefore, the very small first peak for this g(r) with c36_jul20 is indeed due to the parametrization, and specifically the increase in rmin,ij compared to c36_jul17. While this change weakens the interaction of the sulfate with Ca2+, the interaction of Ca2+ with water is unaltered. Thus, the balance of forces in c36_jul20 is tilted toward keeping Ca2+ solvated as it approaches sulfate, but the distinct second and third peaks show that calcium–water clusters will nonetheless organize around the negatively charged sulfate.
Figure 4.

Sulfate terminal oxygen–Ca2+ radial distribution functions for methyl sulfate. MeS = methyl sulfate simulation with Ca2+ using c36_jul20 force field. MeS’ = methyl sulfate simulation with Ca2+ using c36_jul17 force field. In each panel, the four different colored traces are from four independent simulations.
Unlike the similarities in g(r) for sulfate terminal oxygen–Ca2+ interactions in A-type chondroitin and methyl sulfate when using the c36_jul20 parametrization, there are significant differences in this g(r) for the two types of systems when using c36_jul17. Specifically, the first and second peaks are much larger for methyl sulfate (Figure 4, bottom) than for A-type chondroitin (Figure 2, bottom row). This is best explained by the depletion of Ca2+ by chondroitin carboxylate moieties. Unlike in methyl sulfate where Ca2+ can either bind to sulfate or partition into solution, in A-type chondroitin, Ca2+ can bind to sulfate, can partition into solution, or can bind to carboxylate. As discussed in detail below, with c36_jul17, Ca2+ binding to carboxylate is essentially irreversible on the timescale of the present simulations, and therefore leaves little opportunity for binding to sulfate.
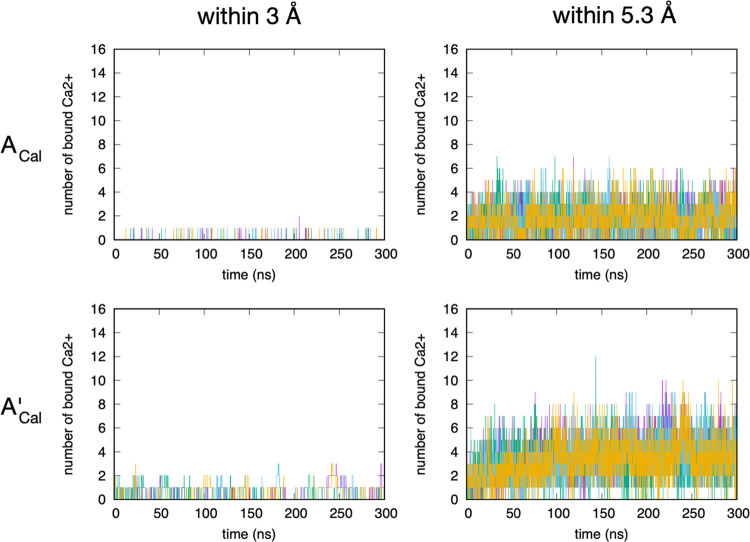
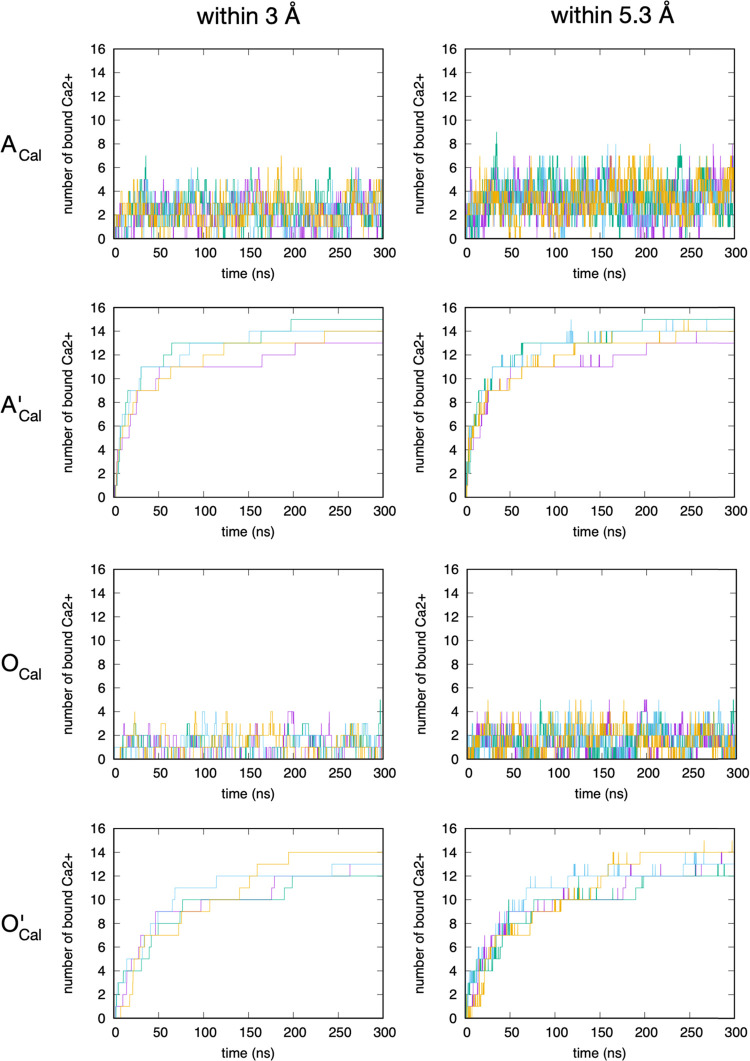
The kinetics of Ca2+ binding to sulfate on A-type chondroitin is consistent with the picture inferred from the g(r) data. For both the c36_jul20 and c36_jul17 parametrizations, only a small fraction of the 16 total Ca2+ ions in the system are located within the first interaction shell (Figure 5, left column), defined as being within 3 Å of sulfate terminal oxygen atoms as determined from the g(r) (Figure 2). Also, this number frequently fluctuates to 0, meaning that there is frequent dissociation. If both the first and second interaction shells (as defined by a sulfate terminal oxygen–Ca2+ distance within 5.3 Å as determined from the g(r); Figure 2) are considered, the number of bound Ca2+ is naturally larger. However, again, there are frequent fluctuations to 0 (Figure 5, right column), indicating dissociation of all Ca2+ from the first and second interaction shells of all 20 sulfate groups across the two A-type chondroitin 20-mers in each simulation. Therefore, the overall picture is that regardless of parametrization, Ca2+ binding to sulfate on A-type chondroitin is weak and prone to frequent dissociation. Additionally, per residue analysis of the binding data showed no dramatic differences in the likelihood of Ca2+ binding to one particular sulfate as compared to other sulfates in a 20-mer. As such, the observed binding of Ca2+ to sulfate moieties in A-type chondroitin is both weak and nonspecific.
Figure 5.
Kinetics of Ca2+ binding to sulfate terminal oxygen atoms on A-type chondroitin. ACal = A-type chondroitin simulation with Ca2+ using c36_jul20 force field. A’Cal = A-type chondroitin simulation with Ca2+ using c36_jul17 force field. “Within 3 Å” indicates binding is defined by a Ca2+–sulfate terminal oxygen distance within 3 Å, and “within 5.3 Å” indicates binding is defined by a Ca2+–sulfate terminal oxygen distance within 5.3 Å. In each panel, the four different colored traces are from four independent simulations.
Carboxylate–Calcium Binding
As is the case for sulfate terminal oxygens, carboxylate oxygen–Ca2+ interaction is weaker in the newer c36_jul20 than in c36_jul17 owing to an increase in rmin,ij for the carboxylate oxygen–Ca2+ with no change to εij or charge parameters (Table 1). Despite this weakening, this interaction in both A-type and O-type is overall very favorable. As such, the g(r) data for this interaction are unreliable because of poor equilibrium statistics owing to the strong tendency of Ca2+ to associate with carboxylate oxygen atoms combined with the limited number of Ca2+ cations in the system and the large system size.
The kinetics of Ca2+ binding to carboxylate on A-type and O-type chondroitin shows an extreme force-field dependence, as well as dependence on the presence/absence of sulfate functional groups (i.e., A-type vs O-type). With regard to the force field, the NBFIX addition to c36_jul20 (Table 1) has a dramatic effect: without this update and using the default combining rules for atom-wise LJ parameters for Ca2+ and carboxylate oxygen (Table 1, c36_jul17), Ca2+ binding to carboxylate is irreversible across all eight simulations (A’Cal and O’Cal quadruplicate simulations; Table 2 and Figure 6). By 300 ns, at least 75% of Ca2+ ions in every single one of these eight simulations are bound to chondroitin. Additionally, tracking the number of bound Ca2+ with time shows that this value only increases with time (Figure 6). This is in strong contrast to the newer parametrization, where an equilibrium number of bound Ca2+ is reached early in the simulations, and this number fluctuates between 0 and 6 for A-type chondroitin and 0 and 4 for O-type chondroitin when considering the first interaction shell (Figure 6, first column, rows ACal and OCal). These latter results indicate the influence of sulfate on Ca2+ binding: chondroitin carboxylate moieties can bind more Ca2+ when the polymer is sulfated. Not only does this demonstrate the importance of charge density on the polymer for Ca2+ binding, which is consistent with experimental findings,23 but it also shows that the increased charge density can increase binding without direct charge–charge interactions because neighboring sulfate, which very weakly directly binds Ca2+ itself (ACal in Figure 2 and Figure 5), substantially increases the average number of Ca2+ within the first interaction shell of carboxylate. Mean (standard deviation) values from the first interaction shell data shown in Figure 6 (“within 3 Å”) are 2.26 (2.12) for ACal and 1.10 (0.98) for OCal, which quantitatively demonstrate the influence of sulfate functional groups on Ca2+ direct binding to carboxylates.
Figure 6.
Kinetics of Ca2+ binding to carboxylate oxygen atoms on A- and O-type chondroitin. ACal = A-type chondroitin simulation with Ca2+ using c36_jul20 force field. A’Cal = A-type chondroitin simulation with Ca2+ using c36_jul17 force field. OCal = O-type chondroitin simulation with Ca2+ using c36_jul20 force field. O’Cal = O-type chondroitin simulation with Ca2+ using c36_jul17 force field. “Within 3 Å” indicates binding is defined by a Ca2+–sulfate terminal oxygen distance within 3 Å, and “within 5.3 Å” indicates binding is defined by a Ca2+–sulfate terminal oxygen distance within 5.3 Å. In each panel, the four different-colored traces are from four independent simulations.
We note that all Ca2+-containing simulations started with 16 Ca2+ ions in bulk solution, which corresponds to ∼15 mM and is well above the physiological concentration of 1–2 mM. As described in the Materials and Methods section, the reasoning behind this was that despite the large system size (∼200,000 atoms), 1–2 mM is equivalent to having 1–2 Ca2+ ions in the entire bulk aqueous solvent of this system, and chondroitin is expected to act as a sponge for Ca2+. Thus, at a starting concentration of 1–2 mM, there would not be enough Ca2+ ions in bulk to properly act as a reservoir source for the anticipated Ca2+ binding to chondroitin; therefore, a starting concentration of ∼15 mM Ca2+ in the bulk solvent was used based on the literature estimates of chondroitin binding. Using the older force-field representation, c36_jul17, by t = 300 ns, chondroitin binding to Ca2+ leaves as few as 1 or 2 Ca2+ ions unbound out of the 16 total Ca2+ ions (Figure 6, A’Cal and O’Cal), which corresponds to 1–2 mM free Ca2+, which is in line with physiological concentrations. With the newer force field representation, c36_jul20, at most five Ca2+ ions are bound (Figure 6, ACal), leaving 11 ions free, which corresponds to ∼10 mM free Ca2+. While this is ∼10× the physiological concentration, using a significantly lower concentration of Ca2+ would risk very poor sampling owing to the small number of Ca2+ ions in such a large system, with the additional limit of 300 ns of simulation time, which took several weeks of real-world continuous computing to achieve.
Sodium Binding
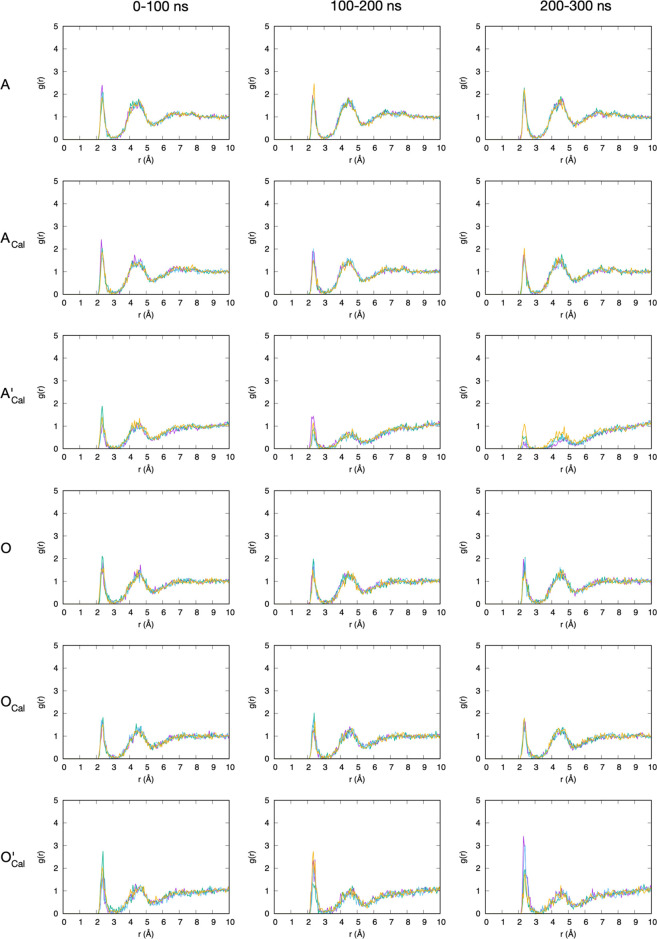
g(r) data for Na+ binding to sulfate (Figure 7) and carboxylate (Figure 8) are unremarkable. In all cases, a distinct first peak is followed by a less distinct second peak and a barely distinguishable third peak, with each peak getting successively wider and shorter. Equilibrium statistics are achieved within the first 100 ns block, as the g(r) profiles are the same for this block as well as the second and third 100 ns blocks. g(r) data are independent of whether c36_jul20 or c36_jul17 was used. This serves as a useful control because parameters involving Na+ are identical across the two force-field versions (Table 1). There is a subtle exception to these general findings in the case of carboxylate oxygen–Na+g(r) with c36_jul17 (Figure 8, A’Cal and O’Cal), where there is more variability in the data. In particular, the peak heights for this interaction diminish with time for A’Cal. A possible explanation for this is that the number of available carboxylate oxygen sites for Na+ binding diminishes with time because of increasing saturation with Ca2+ (Figure 6, A’Cal).
Figure 7.
Sulfate terminal oxygen–Na+ radial distribution functions in chondroitin. ACal = A-type chondroitin simulation with Ca2+ using c36_jul20 force field. A’Cal = A-type chondroitin simulation with Ca2+ using c36_jul17 force field. In each panel, the four different colored traces are from four independent simulations. Each 300 ns simulation has been analyzed in 100 ns blocks.
Figure 8.
Carboxylate oxygen–Na+ radial distribution functions for chondroitin. A = A-type chondroitin simulation (no Ca2+) using c36_jul20 force field. ACal = A-type chondroitin simulation with Ca2+ using c36_jul20 force field. A’Cal = A-type chondroitin simulation with Ca2+ using c36_jul17 force field. O = O-type chondroitin simulation (no Ca2+) using c36_jul20 force field. OCal = O-type chondroitin simulation with Ca2+ using c36_jul20 force field. O’Cal = O-type chondroitin simulation with Ca2+ using c36_jul17 force field. In each panel, the four different colored traces are from four independent simulations. Each 300 ns simulation has been analyzed in 100 ns blocks.
Association between Chondroitin Strands
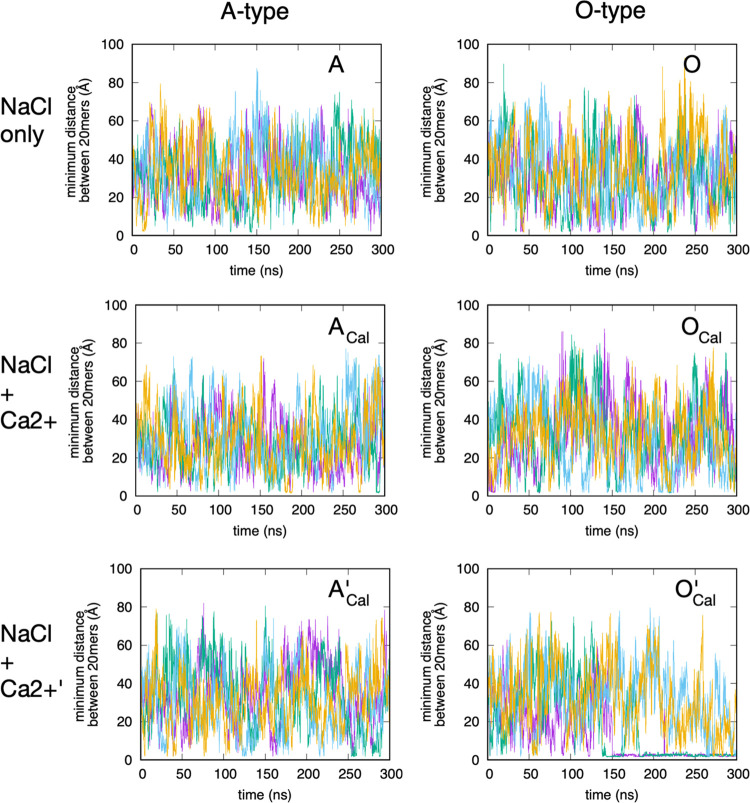
The interpolymer minimum distance gives an indication of whether or not there is association between the two chondroitin polymer strands at any given time during the simulations. The two polymers largely stay dissociated regardless of the force field version or the presence of Ca2+, with one notable exception: for O-type chondroitin with Ca2+ using the c36_jul17 force field (Figure 9, O’Cal), in the second half of two of the quadruplicate simulations, there is continuing association as indicated by a continual very low interpolymer minimum distance. Further analysis of these two trajectories revealed that they both contain a bound Ca2+ that directly bridges between a carboxylate moiety on one polymer and a carboxylate moiety on the second polymer throughout this time. That is, this Ca2+ cation is simultaneously within the first interaction shell of carboxylate oxygen on both the polymers in the system (Figure 10). On the one hand, this is not especially surprising, given the very strong binding interaction between these atom types in c36_jul17. On the other hand, such behavior is not seen for A-type chondroitin using this force field version (Figure 9, A’Cal). We note that it would be helpful to extend the simulation lengths and also to add simulations with more and fewer numbers of Ca2+ cations to better quantitate the effect of Ca2+ on chondroitin polymer association. However, this is not currently feasible, given the computationally demanding nature of the simulations arising from the large system sizes (∼190,000 atoms). With this limitation in mind, additional analysis of the behavior of the individual polymers (described below) provides some insights into this observation.
Figure 9.
Interpolymer minimum distances. A = A-type chondroitin simulation (no Ca2+) using c36_jul20 force field. ACal = A-type chondroitin simulation with Ca2+ using c36_jul20 force field. A’Cal = A-type chondroitin simulation with Ca2+ using c36_jul17 force field. O = O-type chondroitin simulation (no Ca2+) using c36_jul20 force field. OCal = O-type chondroitin simulation with Ca2+ using c36_jul20 force field. O’Cal = O-type chondroitin simulation with Ca2+ using c36_jul17 force field. In each panel, the four different colored traces are from four independent simulations.
Figure 10.
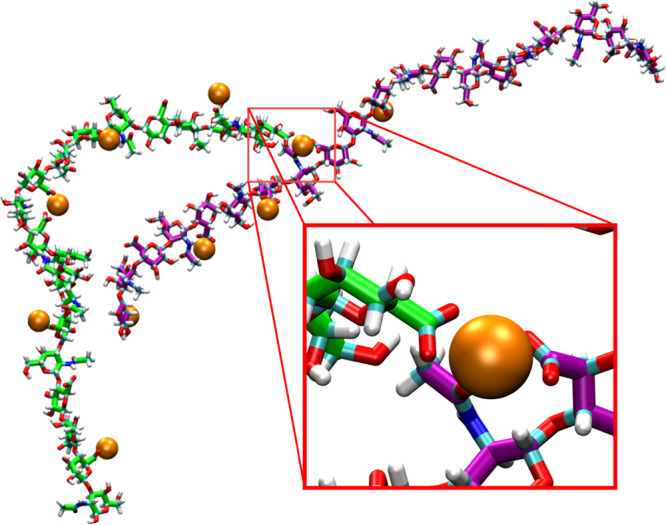
Intermolecular association between O-type chondroitin polymer strands bridged by Ca2+. The two chondroitin polymer strands are colored green and purple, respectively, and bound Ca2+ cations are shown as orange spheres. The conformation is from a simulation with the c36_jul17 force field (i.e., O’Cal).
Polymer Compaction
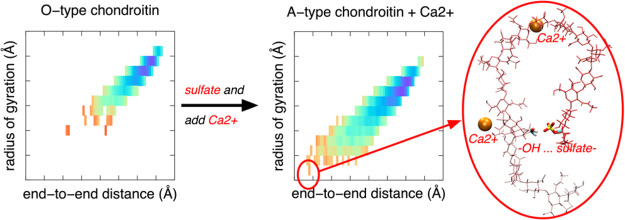
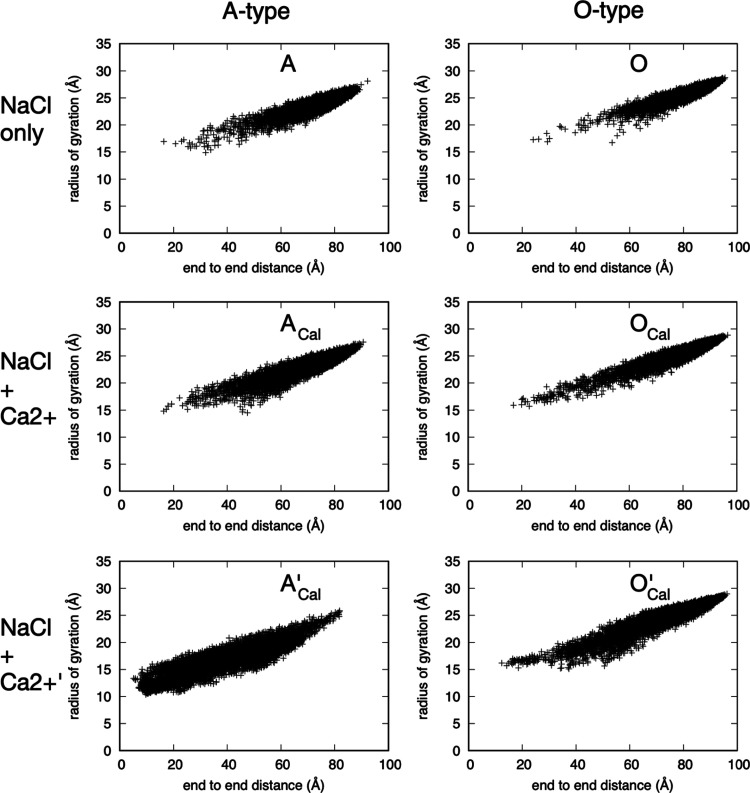
End-to-end distance and the radius of gyration provide simple measures of the compactness of the linear chondroitin polymers. Both sulfation and the addition of Ca2+ favor more compact conformations (Figure 11). The effect of Ca2+ is especially dramatic in the case of c36_jul17, where A-type (i.e., sulfated) chondroitin strongly favors more compact conformations than chondroitin in the other five types of simulations (Figure 11, A’Cal). Driving this behavior is the tight binding of Ca2+ observed in the c36_jul17 parametrization. As discussed above, in the case of O-type chondroitin, this association drove interstrand association (Figure 9, O’Cal). In the case of A-type chondroitin, Ca2+ binding drives intramolecular association instead such that instead of forming a bridging interaction between the two polymers in the system, bound Ca2+ forms a bridging interaction between functional groups in the same polymer, which manifests as bends and kinks, and therefore a reduced end-to-end distance and radius of gyration (Figure 12). While this effect is less dramatic with the NBFIX additions present in c36_jul20, it is nonetheless present such that the addition of Ca2+ favors more compact conformations (Figure 11, A vs ACal and O vs OCal) and sulfated chondroitin samples more compact conformations in the presence of Ca2+ than does nonsulfated chondroitin (Figure 11, ACal vs OCal). These effects can be attributed to a combination of compact conformations stabilized by both the binding of Ca2+ and by intramolecular hydrogen bonding involving sulfate (Figure 13).
Figure 11.
Polymer radius of gyration vs end-to-end distance for the 200–300 ns interval. A = A-type chondroitin simulation (no Ca2+) using c36_jul20 force field. ACal = A-type chondroitin simulation with Ca2+ using c36_jul20 force field. A’Cal = A-type chondroitin simulation with Ca2+ using c36_jul17 force field. O = O-type chondroitin simulation (no Ca2+) using c36_jul20 force field. OCal = O-type chondroitin simulation with Ca2+ using c36_jul20 force field. O’Cal = O-type chondroitin simulation with Ca2+ using c36_jul17 force field.
Figure 12.
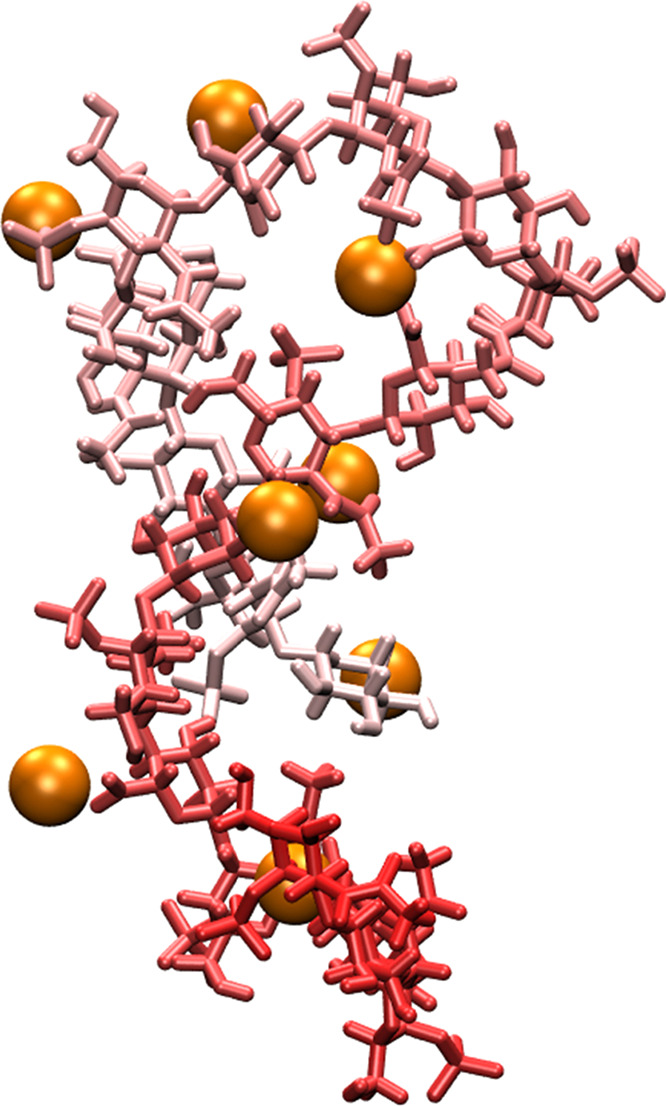
Intramolecular association bridged by Ca2+ in A-type chondroitin. The chondroitin polymer strand is colored as a gradient based on the sequence position, and bound Ca2+ cations are shown as orange spheres. The conformation is from a simulation with the c36_jul17 force field (i.e., A’Cal).
Figure 13.
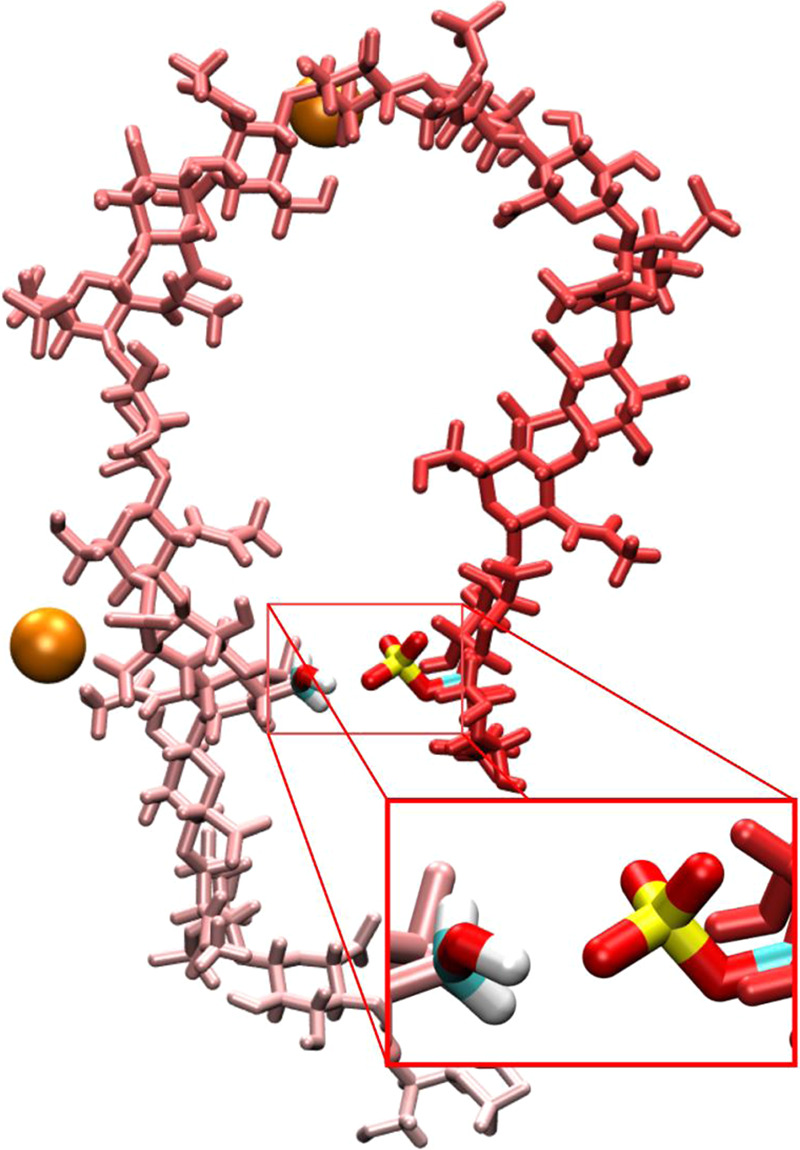
Compact A-type chondroitin conformation stabilized by Ca2+ binding and by intramolecular hydrogen bonding involving sulfate. The chondroitin polymer strand is colored as a gradient based on the sequence position, and bound Ca2+ cations are shown as orange spheres. The conformation is from a simulation with the c36_jul20 force field (i.e., ACal).
As far as sulfation favoring compact conformations is concerned, this is not necessarily an intuitive result in the context of the simulations without calcium. In these simulations having 140 mM NaCl only, the ensemble of A-type chondroitin conformations is more compact than that of O-type (Figure 11, top row). A-type chondroitin has twice the negative charge density as O-type, and the association of Na+ with sulfate and carboxylate is not especially strong based on the radial distribution function data. Thus, one might reasonably expect A-type to prefer more extended conformations relative to O-type because of intramolecular charge–charge repulsion and the drive to maximally solvate carboxylate and sulfate functional groups. However, this is not the case. Rather, the presence of sulfate groups enables intramolecular hydrogen bonds involving sulfate, similar to that depicted in Figure 13, which is an effect independent of Ca2+.
Conclusions
Based on the present simulations of A-type and O-type chondroitin, both sulfation and Ca2+ favor more compact chondroitin 20-mer conformations. While existing experimental data demonstrate the possibility for Ca2+ to form bridging interactions between strands of chondroitin sulfate,15,18 we find that such association between 20-mers of A-type chondroitin is sensitive to the details of force-field parametrization (Table 1): an increase in the rmin force-field parameter from 3.067 Å36 (c36_jul17) to 3.232 Å37 (c36_jul20) for the interactions between carboxylate oxygens and Ca2+ dramatically decreases Ca2+ binding to chondroitin. This in turn prevents Ca2+-mediated intra- and interchain bridging interactions between carboxylate groups.
Force-field parametrization is a balance between generalizability/simplicity and accuracy/complexity. For example, the need for carefully balancing nonbonded interactions involving Ca2+ with carboxylate has been well documented.37,55−60 With regard to phosphate and sulfate, in both c36_jul17 and c36_jul20, the same atom type is used for the terminal oxygen atoms on both of these types of functional groups. This means that the only parameter available for distinguishing nonbonded interactions between another atom and either a sulfate or phosphate terminal oxygen is the partial charge for that oxygen. The present results suggest a closer study of whether additional complexity needs to be introduced into the force field in the form of a new atom type for such sulfate oxygen atoms in order to achieve modeling accuracy on the same level as that for the corresponding phosphate atoms;35 indeed, the application of NBFIX parameters has been shown to have a marked effect on bacterial membrane properties in simulations where Ca2+ associates with phosphate oxygen atoms in membrane molecules.61 If a new separate atom type is ultimately deemed necessary, it will additionally need to be determined whether combining rules using atom-wise LJ parameters are sufficient to balance water–sulfate vs ion–sulfate interactions, or whether NBFIX parameters will be required to properly capture the latter after parametrizing atom-wise parameters targeting the former.
From the data presented here, the c36_jul20 parametrization currently favors Ca2+ retaining its first solvation shell as opposed to directly interacting with sulfate. This is reminiscent of the finding that in simulations of calbindin protein, Ca2+ exhibited such behavior relative to carboxylate when using the GROMOS96 and CHARMM22 force fields versus exhibiting ready loss of this shell and tight direct binding to carboxylate when using the OPLS-AA force field,55 which demonstrates the strong force-field dependence of Ca2+ solvation.
We note that in addition to uncertainties arising from the sensitivity of the results to force-field parametrization, a further limitation to the present approach for understanding the atomic-resolution behavior of chondroitin polymers with Ca2+ in solution is the practical limitation on the system size and simulation timescale imposed by computing software and hardware for molecular dynamics. In contrast to the 20-mers studied here, biological CS chains may exceed ten times this length.2 The direct simulation of such large CS polymers would therefore require a simulation system with 103 times as many particles as the ones in this study, which puts the required particle count on the order of 300 million. Barring breakthrough advances in software and/or hardware, the routine performance of such simulations is out of the question for the foreseeable future. This leaves the multiscale modeling approach3 as the best option for attempting to understand the conformational properties of CS and CS PGs, with all-atom explicit-solvent simulations, like those presently described and using carefully parametrized force fields, informing the development, validation, and interpretation of less-detailed but more computationally efficient modeling methods.4,14
Acknowledgments
We gratefully acknowledge funding support for this work from the National Science Foundation, grant number MCB-1453529 to O.G.
Glossary
Abbreviations
- CS
chondroitin sulfate
- PG
proteoglycan;
- GAG
glycosaminoglycan
- HA
hyaluronan
- GlcNAc
N-acetylglucosamine
- GalNAc
N-acetylgalactosamine
- LJ
Lennard-Jones.
Author Present Address
§ Early Charm Ventures, 1100 Wicomico Street, Suite 323, Baltimore, Maryland 21230, United States
Author Contributions
The manuscript was written through contributions of all authors. All authors have given approval to the final version of the manuscript.
National Science Foundation, grant number MCB-1453529 to O.G.
The authors declare no competing financial interest.
References
- Mizumoto S.; Yamada S.; Sugahara K. Molecular interactions between chondroitin-dermatan sulfate and growth factors/receptors/matrix proteins. Curr. Opin. Struct. Biol. 2015, 34, 35–42. 10.1016/j.sbi.2015.06.004. [DOI] [PubMed] [Google Scholar]
- Sugahara K.; Mikami T.; Uyama T.; Mizuguchi S.; Nomura K.; Kitagawa H. Recent advances in the structural biology of chondroitin sulfate and dermatan sulfate. Curr. Opin. Struct. Biol. 2003, 13, 612–620. 10.1016/j.sbi.2003.09.011. [DOI] [PubMed] [Google Scholar]
- Almond A. Multiscale modeling of glycosaminoglycan structure and dynamics: current methods and challenges. Curr. Opin. Struct. Biol. 2018, 50, 58–64. 10.1016/j.sbi.2017.11.008. [DOI] [PubMed] [Google Scholar]
- Sattelle B. M.; Shakeri J.; Cliff M. J.; Almond A. Proteoglycans and their heterogeneous glycosaminoglycans at the atomic scale. Biomacromolecules 2015, 16, 951–961. 10.1021/bm5018386. [DOI] [PMC free article] [PubMed] [Google Scholar]
- Whitmore E. K.; Vesenka G.; Sihler H.; Guvench O. Efficient Construction of Atomic-Resolution Models of Non-Sulfated Chondroitin Glycosaminoglycan Using Molecular Dynamics Data. Biomolecules 2020, 10, 537. 10.3390/biom10040537. [DOI] [PMC free article] [PubMed] [Google Scholar]
- Ng C.; Nandha Premnath P.; Guvench O. Rigidity and flexibility in the tetrasaccharide linker of proteoglycans from atomic-resolution molecular simulation. J. Comput. Chem. 2017, 38, 1438–1446. 10.1002/jcc.24738. [DOI] [PubMed] [Google Scholar]
- Singh A.; Montgomery D.; Xue X.; Foley B. L.; Woods R. J. GAG Builder: a web-tool for modeling 3D structures of glycosaminoglycans. Glycobiology 2019, 29, 515–518. 10.1093/glycob/cwz027. [DOI] [PMC free article] [PubMed] [Google Scholar]
- Engelsen S. B.; Hansen P. I.; Perez S. POLYS 2.0: An open source software package for building three-dimensional structures of polysaccharides. Biopolymers 2014, 101, 733–743. 10.1002/bip.22449. [DOI] [PubMed] [Google Scholar]
- Kuttel M. M.; Stahle J.; Widmalm G. CarbBuilder: Software for building molecular models of complex oligo- and polysaccharide structures. J. Comput. Chem. 2016, 37, 2098–2105. 10.1002/jcc.24428. [DOI] [PubMed] [Google Scholar]
- Clerc O.; Deniaud M.; Vallet S. D.; Naba A.; Rivet A.; Perez S.; Thierry-Mieg N.; Ricard-Blum S. MatrixDB: integration of new data with a focus on glycosaminoglycan interactions. Nucleic Acids Res. 2019, 47, D376–D381. 10.1093/nar/gky1035. [DOI] [PMC free article] [PubMed] [Google Scholar]
- Clerc O.; Mariethoz J.; Rivet A.; Lisacek F.; Perez S.; Ricard-Blum S. A pipeline to translate glycosaminoglycan sequences into 3D models. Application to the exploration of glycosaminoglycan conformational space. Glycobiology 2019, 29, 36–44. 10.1093/glycob/cwy084. [DOI] [PubMed] [Google Scholar]
- Park S. J.; Lee J.; Qi Y.; Kern N. R.; Lee H. S.; Jo S.; Joung I.; Joo K.; Lee J.; Im W. CHARMM-GUI Glycan Modeler for modeling and simulation of carbohydrates and glycoconjugates. Glycobiology 2019, 29, 320–331. 10.1093/glycob/cwz003. [DOI] [PMC free article] [PubMed] [Google Scholar]
- Perez S.; Bonnardel F.; Lisacek F.; Imberty A.; Ricard Blum S.; Makshakova O. GAG-DB, the New Interface of the Three-Dimensional Landscape of Glycosaminoglycans. Biomolecules 2020, 10, 1660. 10.3390/biom10121660. [DOI] [PMC free article] [PubMed] [Google Scholar]
- Bathe M.; Rutledge G. C.; Grodzinsky A. J.; Tidor B. A coarse-grained molecular model for glycosaminoglycans: application to chondroitin, chondroitin sulfate, and hyaluronic acid. Biophys. J. 2005, 88, 3870–3887. 10.1529/biophysj.104.058800. [DOI] [PMC free article] [PubMed] [Google Scholar]
- Horkay F.; Basser P. J.; Hecht A. M.; Geissler E. Chondroitin Sulfate in Solution: Effects of Mono- and Divalent Salts. Macromolecules 2012, 45, 2882–2890. 10.1021/ma202693s. [DOI] [PMC free article] [PubMed] [Google Scholar]
- Tanaka K. Physicochemical properties of chondroitin sulfate. I. Ion binding and secondary structure. J. Biochem. (Tokyo) 1978, 83, 647–653. 10.1093/oxfordjournals.jbchem.a131955. [DOI] [PubMed] [Google Scholar]
- Uchisawa H.; Okuzaki B.-i.; Ichita J.; Matsue H. Binding between calcium ions and chondroitin sulfate chains of salmon nasal cartilage glycosaminoglycan. Int. Congr. Ser. 2001, 1223, 205–220. 10.1016/S0531-5131(01)00458-7. [DOI] [Google Scholar]
- Cael J. J.; Winter W. T.; Arnott S. Calcium chondroitin 4-sulfate: molecular conformation and organization of polysaccharide chains in a proteoglycan. J. Mol. Biol. 1978, 125, 21–42. 10.1016/0022-2836(78)90252-8. [DOI] [PubMed] [Google Scholar]
- Faller C. E.; Guvench O. Sulfation and cation effects on the conformational properties of the glycan backbone of chondroitin sulfate disaccharides. J. Phys. Chem. B 2015, 119, 6063–6073. 10.1021/jp511431q. [DOI] [PMC free article] [PubMed] [Google Scholar]
- Shen Q.; Zhang C.; Mo H.; Zhang H.; Qin X.; Li J.; Zhang Z.; Richel A. Fabrication of chondroitin sulfate calcium complex and its chondrocyte proliferation in vitro. Carbohydr. Polym. 2021, 254, 117282. 10.1016/j.carbpol.2020.117282. [DOI] [PubMed] [Google Scholar]
- Giubertoni G.; Pérez de Alba Ortíz A.; Bano F.; Zhang X.; Linhardt R. J.; Green D. E.; DeAngelis P. L.; Koenderink G. H.; Richter R. P.; Ensing B.; Bakker H. J. Strong Reduction of the Chain Rigidity of Hyaluronan by Selective Binding of Ca(2+) Ions. Macromolecules 2021, 54, 1137–1146. 10.1021/acs.macromol.0c02242. [DOI] [PMC free article] [PubMed] [Google Scholar]
- Plazinski W.; Drach M. The dynamics of the calcium-induced chain-chain association in the polyuronate systems. J. Comput. Chem. 2012, 33, 1709–1715. 10.1002/jcc.23001. [DOI] [PubMed] [Google Scholar]
- Hunter G. K.; Wong K. S.; Kim J. J. Binding of calcium to glycosaminoglycans: an equilibrium dialysis study. Arch. Biochem. Biophys. 1988, 260, 161–167. 0003-9861(88)90437-7 [pii] 10.1016/0003-9861(88)90437-7. [DOI] [PubMed] [Google Scholar]
- He H.; Shao C.; Mu Z.; Mao C.; Sun J.; Chen C.; Tang R.; Gu X. Promotion effect of immobilized chondroitin sulfate on intrafibrillar mineralization of collagen. Carbohydr. Polym. 2020, 229, 115547 10.1016/j.carbpol.2019.115547. [DOI] [PubMed] [Google Scholar]
- Hunter G. K.; Bader S. M. A mathematical modelling study of epiphyseal cartilage calcification. J. Theor. Biol. 1989, 138, 195–211. 10.1016/s0022-5193(89)80139-0. [DOI] [PubMed] [Google Scholar]
- https://www.merckmanuals.com/professional/endocrine-and-metabolic-disorders/fluid-metabolism/water-and-sodium-balance
- Chaigne-Delalande B.; Lenardo M. J. Divalent cation signaling in immune cells. Trends Immunol. 2014, 35, 332–344. 10.1016/j.it.2014.05.001. [DOI] [PMC free article] [PubMed] [Google Scholar]
- Atchison D. K.; Beierwaltes W. H. The influence of extracellular and intracellular calcium on the secretion of renin. Pflugers Arch. 2013, 465, 59–69. 10.1007/s00424-012-1107-x. [DOI] [PMC free article] [PubMed] [Google Scholar]
- MacGregor E. A.; Bowness J. M. Interaction of proteoglycans and chondroitin sulfates with calcium or phosphate ions. Can. J. Biochem. 1971, 49, 417–425. 10.1139/o71-061. [DOI] [PubMed] [Google Scholar]
- Hesse A.; Wurzel H.; Krampitz G.; Vahlensieck W. Experimental determination of the kinetics of calcium-binding with chondroitin sulphate and the effects of uric acid on this process. Urol. Res. 1987, 15, 93–97. 10.1007/BF00260940. [DOI] [PubMed] [Google Scholar]
- Guvench O.; Greene S. N.; Kamath G.; Brady J. W.; Venable R. M.; Pastor R. W.; Mackerell A. D. Jr. Additive empirical force field for hexopyranose monosaccharides. J. Comput. Chem. 2008, 29, 2543–2564. 10.1002/jcc.21004. [DOI] [PMC free article] [PubMed] [Google Scholar]
- Guvench O.; Hatcher E. R.; Venable R. M.; Pastor R. W.; MacKerell A. D. Jr. CHARMM Additive All-Atom Force Field for Glycosidic Linkages between Hexopyranoses. J. Chem. Theory Comput. 2009, 5, 2353–2370. 10.1021/ct900242e. [DOI] [PMC free article] [PubMed] [Google Scholar]
- Guvench O.; Mallajosyula S. S.; Raman E. P.; Hatcher E.; Vanommeslaeghe K.; Foster T. J.; Jamison F. W. 2nd; Mackerell A. D. Jr. CHARMM additive all-atom force field for carbohydrate derivatives and its utility in polysaccharide and carbohydrate-protein modeling. J. Chem. Theory Comput. 2011, 7, 3162–3180. 10.1021/ct200328p. [DOI] [PMC free article] [PubMed] [Google Scholar]
- Mallajosyula S. S.; Guvench O.; Hatcher E.; MacKerell A. D. Jr. CHARMM Additive All-Atom Force Field for Phosphate and Sulfate Linked to Carbohydrates. J. Chem. Theory Comput. 2012, 8, 759–776. 10.1021/ct200792v. [DOI] [PMC free article] [PubMed] [Google Scholar]
- Han K.; Venable R. M.; Bryant A. M.; Legacy C. J.; Shen R.; Li H.; Roux B.; Gericke A.; Pastor R. W. Graph-Theoretic Analysis of Monomethyl Phosphate Clustering in Ionic Solutions. J. Phys. Chem. B 2018, 122, 1484–1494. 10.1021/acs.jpcb.7b10730. [DOI] [PMC free article] [PubMed] [Google Scholar]
- Marchand S.; Roux B. Molecular dynamics study of calbindin D9k in the apo and singly and doubly calcium-loaded states. Proteins: Struct., Funct., Bioinf. 1998, 33, 265–284. . [DOI] [PubMed] [Google Scholar]
- Liao J.; Marinelli F.; Lee C.; Huang Y.; Faraldo-Gomez J. D.; Jiang Y. Mechanism of extracellular ion exchange and binding-site occlusion in a sodium/calcium exchanger. Nat. Struct. Mol. Biol. 2016, 23, 590–599. 10.1038/nsmb.3230. [DOI] [PMC free article] [PubMed] [Google Scholar]
- Venable R. M.; Luo Y.; Gawrisch K.; Roux B.; Pastor R. W. Simulations of anionic lipid membranes: development of interaction-specific ion parameters and validation using NMR data. J. Phys. Chem. B 2013, 117, 10183–10192. 10.1021/jp401512z. [DOI] [PMC free article] [PubMed] [Google Scholar]
- Jorgensen W. L.; Chandrasekhar J.; Madura J. D.; Impey R. W.; Klein M. L. Comparison of simple potential functions for simulating liquid water. J. Chem. Phys. 1983, 79, 926–935. 10.1063/1.445869. [DOI] [Google Scholar]
- Allen M. P.; Tildesley D. J., Computer Simulation of Liquids; Second Edition, Oxford University Press: Oxford, 2017; 640. [Google Scholar]
- Ryckaert J. P.; Ciccotti G.; Berendsen H. J. C. Numerical integration of Cartesian equations of motion of a system with constraints: molecular dynamics of n-alkanes. J. Comput. Phys. 1977, 23, 327–341. 10.1016/0021-9991(77)90098-5. [DOI] [Google Scholar]
- Verlet L. Computer experiments on classical fluids. I. Thermodynamical properties of Lennard-Jones molecules. Phys. Rev. 1967, 159, 98–103. 10.1103/PhysRev.159.98. [DOI] [Google Scholar]
- Kubo R.; Toda M.; Hashitume N., Statistical Physics II: Nonequilibrium Statistical Mechanics. 2nd ed.; Springer: New York, 1991. [Google Scholar]
- Darden T.; York D.; Pedersen L. Particle mesh Ewald: an N•log(N) method for Ewald sums in large systems. J. Chem. Phys. 1993, 98, 10089–10092. 10.1063/1.464397. [DOI] [Google Scholar]
- Steinbach P. J.; Brooks B. R. New spherical-cutoff methods for long-range forces in macromolecular simulation. J. Comput. Chem. 1994, 15, 667–683. 10.1002/jcc.540150702. [DOI] [Google Scholar]
- Eastman P.; Swails J.; Chodera J. D.; McGibbon R. T.; Zhao Y.; Beauchamp K. A.; Wang L. P.; Simmonett A. C.; Harrigan M. P.; Stern C. D.; Wiewiora R. P.; Brooks B. R.; Pande V. S. OpenMM 7: Rapid development of high performance algorithms for molecular dynamics. PLoS Comput. Biol. 2017, 13, e1005659 10.1371/journal.pcbi.1005659. [DOI] [PMC free article] [PubMed] [Google Scholar]
- Brooks B. R.; Brooks C. L. 3rd; MacKerell A. D. Jr.; Nilsson L.; Petrella R. J.; Roux B.; Won Y.; Archontis G.; Bartels C.; Boresch S.; Caflisch A.; Caves L.; Cui Q.; Dinner A. R.; Feig M.; Fischer S.; Gao J.; Hodoscek M.; Im W.; Kuczera K.; Lazaridis T.; Ma J.; Ovchinnikov V.; Paci E.; Pastor R. W.; Post C. B.; Pu J. Z.; Schaefer M.; Tidor B.; Venable R. M.; Woodcock H. L.; Wu X.; Yang W.; York D. M.; Karplus M. CHARMM: the biomolecular simulation program. J. Comput. Chem. 2009, 30, 1545–1614. 10.1002/jcc.21287. [DOI] [PMC free article] [PubMed] [Google Scholar]
- Fletcher R.; Reeves C. Function minimization by conjugate gradients. Comput. J. 1964, 7, 149–154. 10.1093/comjnl/7.2.149. [DOI] [Google Scholar]
- Hestenes M. R.; Stiefel E. Methods of conjugate gradients for solving linear systems. J. Res. Natl. Bur. Stand. 1952, 49, 409–436. 10.6028/jres.049.044. [DOI] [Google Scholar]
- Phillips J. C.; Braun R.; Wang W.; Gumbart J.; Tajkhorshid E.; Villa E.; Chipot C.; Skeel R. D.; Kale L.; Schulten K. Scalable molecular dynamics with NAMD. J. Comput. Chem. 2005, 26, 1781–1802. 10.1002/jcc.20289. [DOI] [PMC free article] [PubMed] [Google Scholar]
- Feller S. E.; Zhang Y. H.; Pastor R. W.; Brooks B. R. Constant pressure molecular dynamics simulation: the Langevin piston method. J. Chem. Phys. 1995, 103, 4613–4621. 10.1063/1.470648. [DOI] [Google Scholar]
- Vanommeslaeghe K.; Hatcher E.; Acharya C.; Kundu S.; Zhong S.; Shim J.; Darian E.; Guvench O.; Lopes P.; Vorobyov I.; Mackerell A. D. Jr. CHARMM general force field: A force field for drug-like molecules compatible with the CHARMM all-atom additive biological force fields. J. Comput. Chem. 2009, 31, 671–690. 10.1002/jcc.21367. [DOI] [PMC free article] [PubMed] [Google Scholar]
- Yu W.; He X.; Vanommeslaeghe K.; MacKerell A. D. Jr. Extension of the CHARMM general force field to sulfonyl-containing compounds and its utility in biomolecular simulations. J. Comput. Chem. 2012, 33, 2451–2468. 10.1002/jcc.23067. [DOI] [PMC free article] [PubMed] [Google Scholar]
- Humphrey W.; Dalke A.; Schulten K. VMD: Visual molecular dynamics. J. Mol. Graph. 1996, 14, 33–38. 10.1016/0263-7855(96)00018-5. [DOI] [PubMed] [Google Scholar]
- Project E.; Nachliel E.; Gutman M. Parameterization of Ca+2-protein interactions for molecular dynamics simulations. J. Comput. Chem. 2008, 29, 1163–1169. 10.1002/jcc.20876. [DOI] [PubMed] [Google Scholar]
- Kahlen J.; Salimi L.; Sulpizi M.; Peter C.; Donadio D. Interaction of charged amino-acid side chains with ions: an optimization strategy for classical force fields. J. Phys. Chem. B 2014, 118, 3960–3972. 10.1021/jp412490c. [DOI] [PubMed] [Google Scholar]
- Church A. T.; Hughes Z. E.; Walsh T. R. Improving the description of interactions between Ca2+ and protein carboxylate groups, including γ-carboxyglutamic acid: revised CHARMM22* parameters. RSC Adv. 2015, 5, 67820–67828. 10.1039/C5RA11268K. [DOI] [Google Scholar]
- Yoo J.; Wilson J.; Aksimentiev A. Improved model of hydrated calcium ion for molecular dynamics simulations using classical biomolecular force fields. Biopolymers 2016, 105, 752–763. 10.1002/bip.22868. [DOI] [PMC free article] [PubMed] [Google Scholar]
- Yoo J.; Aksimentiev A. New tricks for old dogs: improving the accuracy of biomolecular force fields by pair-specific corrections to non-bonded interactions. Phys. Chem. Chem. Phys. 2018, 20, 8432–8449. 10.1039/C7CP08185E. [DOI] [PMC free article] [PubMed] [Google Scholar]
- Melcr J.; Martinez-Seara H.; Nencini R.; Kolafa J.; Jungwirth P.; Ollila O. H. S. Accurate Binding of Sodium and Calcium to a POPC Bilayer by Effective Inclusion of Electronic Polarization. J. Phys. Chem. B 2018, 122, 4546–4557. 10.1021/acs.jpcb.7b12510. [DOI] [PubMed] [Google Scholar]
- Kim S.; Patel D. S.; Park S.; Slusky J.; Klauda J. B.; Widmalm G.; Im W. Bilayer Properties of Lipid A from Various Gram-Negative Bacteria. Biophys. J. 2016, 111, 1750–1760. 10.1016/j.bpj.2016.09.001. [DOI] [PMC free article] [PubMed] [Google Scholar]


