

Abstract

The coal and gas outbursts are recognized as a worldwide difficulty, and there is still ample research space in this field, especially on the mechanical mechanism of outbursts. The main purpose of this paper is to attempt to reveal the outburst mechanism as fully as possible from the point of view of mechanics. In this paper, a mechanical model on coal and gas outbursts including the governing equations of gas desorption–seepage, the stress state in the coal sample, and the criteria of coal sample failure and outburst evolution is put forward according to the porous media seepage theory and elastic theory. Based on the proposed model, the variation and distribution of the gas state and stress state in the coal sample in the outburst are analyzed quantitatively and a series of detailed discussions are conducted in terms of the in-situ stress, gas pressure, and the physical characteristics of coal in outbursts. The results of theoretical analysis and numerical simulation show that the stress concentration in the front of the outburst cavity is the main reason for the failure of the coal sample in this area, and then, the drag force caused by gas flow provides energy for the movement of the crushed coal sample, which leads to the outburst cavity expansion and the increase of stress concentration factor. The end of the outburst is because the gas velocity is less than the threshold friction velocity of the crushed coal sample. Additionally, the outburst strength increases with the increase of the vertical in-situ stress and initial gas pressure and decreases with the increase of the internal friction angle and cohesion of coal.
1. Introduction
The coal and gas outburst, which is influenced by many factors, such as in situ stress, gas pressure, and coal’s physical characteristics, is a very complex dynamic phenomenon occurring in coal mining.1−3 Once a coal and gas outburst occurs, a large amount of coal with gas is rapidly ejected to the working tunnel, resulting in mining equipment damage and casualties.4−7 Up to now, coal and gas outbursts still happen sometimes in coal mining, which pose a great challenge and threat to the coal safety mining. The mechanism research on coal and gas outbursts is generally regarded as a vital part of outburst prevention and control. However, there is still a lack of a clear understanding of the outburst mechanism because of its complexity.8,9
Due to the disastrous and accidental nature of coal and gas outbursts, it is challenging to observe outbursts in the field. Therefore, the experimental and numerical simulations had become the effective means to research the coal and gas outbursts and the mechanical mechanism. To analyze the outburst mechanism and the effect of some factors on outbursts, many experimental tests on coal and gas outbursts were carried out in the past few decades. Alexeev et al. developed a triaxial loading apparatus and applied it to predict the initiation of coal and gas outbursts.10 Du et al. carried out physical experiments under different conditions of the coal–rock combination structure and gas adsorptivity by using a true triaxial coal–gas outburst experimental system.11 Xu et al. developed a multi-field coupling testing system for dynamic disaster in coal mine, which can be utilized to simulate coal and gas outbursts under different conditions.12−14 Ding and Yue studied experimentally the outburst process and found that an outburst depends on gas pressure, water content, and gas decompression rate.15 Lu et al. investigated the disturbed compound dynamic disaster using a true triaxial apparatus.16 Nie and Li researched experimentally the influence of vibration on the gas desorption and coal structure and concluded that vibration is a major and important reason for an outburst initiation.17 Yin et al. researched the deformation and failure of coal under triaxial loading and the effect of the unloading rate on the physical characteristics of coal.18 Some experimental tests on the effect of gas on coal and gas outbursts had been carried out, and the corresponding results had indicated that the sudden decrement of gas pressure in the coal sample and differential pressure between the gas inside and outside the coal sample are essential to the outburst initiation.19−22 Sobczyk performed experiments to study the effect of different adsorbed gases on the outburst initiation.23 Zhou et al. carried out experiments to research the movement law of pulverized coal in the tunnel and proposed a flow model based on the research results.24 These experimental tests can intuitively reproduce some outburst phenomena and study the influence of some factors on outbursts, but it is difficult or even impossible to capture the distribution of some field variables in experiments. Additionally, the test results are affected by the test equipment and environment. These shortcomings make the experimental test not fully reveal the mechanical mechanism of outburst. Hence, some theoretical and numerical research studies had been conducted to study coal and gas outbursts. Clarkson and Bustin investigated the effect of coal composition on gas transport and developed a numerical model for the matrix gas diffusion and adsorption.25 Jin et al. examined some influencing factors of outburst initiation.26 Xu et al. and Xue et al. carried out the numerical investigation of coal and gas outbursts.27,28 Chen proposed a model for predicting the outburst initiation and identified a critical condition for the occurrence of an outburst.29 Shu et al. established a key structural body model on coal and gas outbursts by combining the outburst mechanism with the engineering structure.30 Xin et al. established the damage model of coal containing gas and deduced the permeability evolution model with damage factor.31 These theoretical and numerical studies are significant to explain the outburst mechanism; however, there is still a lack of a complete mechanical model to describe the whole outburst process, and the theoretical research on coal and gas outbursts is far less than experimental tests. Hence, further theoretical research on outbursts is required to reveal the outburst mechanism.
In this study, the governing equations of gas seepage–desorption and stress state distribution in the coal sample in outbursts are established according to the porous media seepage theory and elastic theory, and the criterion of outburst initiation, evolution, and termination is proposed according to the sand mechanics. Furthermore, the finite volume method and the finite element method are used to discretize the corresponding governing equations. Based on this mechanical model, the variation and distribution of the gas state and effective stress state in the coal sample were calculated quantitatively in outbursts. Additionally, the coal and gas outbursts under some different cases of in situ stress, initial gas pressure, and the physical characteristics of coal were studied. The work done in this paper may help reveal the outburst mechanism and provide guidance for the experimental tests and outburst prevention.
2. Theoretical Model
2.1. Gas Seepage and Desorption in the Coal Sample
The gas in the coal sample mainly exists in the adsorbed state and free state, in which the adsorbed gas accounts for more than 80% of the total gas content. The free gas in the coal sample flows into the air quickly as the orifice is suddenly opened at the beginning of the test because the initial gas pressure is much greater than the atmospheric pressure, which causes the variation of gas density in the coal sample. Also, the variation of gas density satisfies the mass conservation equation32
| 1 |
where ux and uy are the gas seepage velocity components in the x- and y-directions, respectively, ρ is the gas density, and φ is the porosity of the coal sample. According to Darcy’s law, the gas seepage velocity is proportional to the gas pressure gradient as the flow of gas is not fast, that is,32
| 2 |
where p is the gas pressure, k is the permeability of the coal sample, and μ is the dynamic viscosity of the gas. The relationship between gas density and gas pressure can be described by the gas state equation
| 3 |
Here, n(1 ≤ n ≤ γ) is the polytropic index, γ is the specific heat ratio of gas, p0 and ρ0 are the initial gas pressure and density, respectively, and z(ρ) is a correction function proposed in this paper, the format of which is assumed as z(ρ) = aρb. The parameters a and b in this function can be determined by the known conditions of the gas. Equation 3 is the ideal gas state equation when z(ρ) = 1. According to eq 3, the first derivatives of gas pressure to x and y are
| 4 |
Substituting eq 4 into eq 2, the gas seepage velocity components can be written as
| 5 |
Substituting eq 5 into eq 1 and neglecting the change of the coal sample porosity, eq 1 can be written as
| 6 |
Setting  , eq 6 can be written as
| 7 |
Equation 7 is the mass conservation equation expressed by gas density, and the variation of the gas density caused by the gas seepage in the coal sample in outbursts can be obtained by it.
The total gas content in the coal sample can be estimated by the empirical formula27
| 8 |
where A̅ is an empirical constant, which can be approximately taken as 2 in the calculation, and Q is the total gas content in the coal sample (m3/m3). The decrease of gas pressure leads to the desorption of adsorbed gas in the coal sample, and the gas desorption can complete instantaneously. Because the gas adsorption and desorption can be approximately regarded as two reversible processes, the gas desorption amount caused by gas pressure drop is
| 9 |
where subscripts 0 and 1 represent the gas states before and after desorption, respectively, and per is the proportion coefficient of the adsorbed gas, which can be approximately taken as 85% in the calculation. After desorption, the gas density is updated to
| 10 |
where v is the volume of the coal sample. Then, the gas pressure can be updated by eq 3. This process is cycled in each time step until the gas adsorption reaches equilibrium again.
2.2. Internal Force in the Coal Sample
Assuming that the coal sample is elastic and its deformation is small, the stress state in the coal sample satisfies the stress equilibrium differential equation
| 11 |
where L is the differential operator, σ is the total column vector, and f is the body column vector. For elastic isotropic materials, the constitutive relation can be expressed as
| 12 |
where σe is the effective stress column vector, ε is the strain column vector, and D is the constitutive matrix, which is only determined by Young’s modulus and Poisson’s ratio of the coal sample. The relationship between the displacement and strain can be written as
| 13 |
where u is the displacement column vector. For the details of eqs 11–13 and parameters such as L and D, one can refer to ref (33). According to Terzaghi’s law, the relationship among the total stress, effective stress, swelling stress, and gas pressure can be described as34
| 14 |
| 15 |
where σs is the swelling stress, A and B are two gas adsorption constants, R0 is the molar gas constant, ρs is the coal sample density, T is the temperature, ν is Poisson’s ratio of the coal sample, Vm is the molar volume, and p is the gas pressure. α can be approximately taken as the porosity of the coal sample in the calculation. Since the gas pressure and swelling stress only affect the normal stress in the coal sample, the vector I is
| 16 |
2.3. Failure of the Coal Sample and Activation of the Crushed Coal Sample
The coal sample is a typical brittle material, and the uniform forces q1 and q2 acting on the coal sample are compression forces. Hence, the Mohr–Coulomb criterion is chosen as the strength criterion to determine whether the coal sample yields. Because the coal sample is a porous medium containing gas, the effective principal stresses are used in the Mohr–Coulomb criterion33
| 17 |
where ψ and C are the internal friction angle and cohesion of the coal sample, respectively. For F ≥ 0, the coal sample is yielding.
The threshold friction velocity, which is defined as the wind speed required for some sand particles to get started in the sand mechanics, is introduced as the criterion to determine whether the crushed coal sample can be pushed into the air by gas. Shao and Lu introduced the aerodynamic drag, gravity force, aerodynamic lift, and inter-particle cohesive force in a three-dimensional model and derived an expression on the threshold friction velocity.35 The coal sample model is two-dimensional in this paper. Hence, it is necessary to provide the corresponding two-dimensional form of each force according to the three-dimensional form.
Figure 1 shows a two-dimensional coal particle starting model, and all forces acting on the coal particle are as follows:
| 18 |
| 19 |
| 20 |
| 21 |
where Fd is the gas drag, Fg is the gravity force, Fl is the gas lift, and Fi is the cohesive force. d is the diameter of the coal particle, s is the thickness of the coal particles (0.1 m), ρ is the gas density, ρs is the coal sample density, g is the gravitational acceleration, and u* is the threshold friction velocity. Kd and β are two constants, the magnitudes of which are around 5.1 and 10–5, respectively. Summing moments about pivot point p of the forces acting on the particle in Figure 1 and providing that the moment is positive if the force makes the coal particle rotate clockwise around the pivot point,
| 22 |
Figure 1.

Two-dimensional coal particle starting model.
As shown in Figure 1, the force arms in eq 22 are
| 23 |
Substituting eqs 18–21 and 23 into eq 22 and setting Mp equal to 0,
| 24 |
According to eq 24, the threshold friction velocity is
| 25 |
Based on this, a new function is defined to determine whether the crushed coal sample can be pushed into the air by gas, that is,
| 26 |
where U is the gas velocity. According to eq 26, the crushed coal sample can be pushed into the air by gas if G ≥ 0.
3. Results
3.1. Overview of the Numerical Calculation Process
In the calculation of gas seepage in the coal sample, the finite volume method is used to discretize the governing equation, and the gas solution region is divided with a non-uniform mesh. In the calculation of the stress state in the coal sample, the finite element method is used to discretize the governing equation and the solid solution region is divided with a uniform mesh (5 mm × 5 mm). The gas pressure and swelling stress are introduced as external forces acting on the coal sample elements by eqs 14 and 15. The gas pressure and gas velocity are re-interpolated according to the mesh size of the solid solution region to deal with the mesh difference between these two solution regions. The effective stress and Mohr–Coulomb criterion are used to determine whether the coal sample elements are yielding, and then, the gas velocity is compared with the threshold friction velocity of the failure coal sample elements to determine whether the failure coal sample elements are deleted. The parameters used in the calculation are shown in Table 1. Most of the parameters come from the State Key Laboratory of Coal Mine Disaster Dynamics and Control.
Table 1. Parameters for Calculation.
| parameter | symbol | value |
|---|---|---|
| initial gas pressure | p0 | 1.0 × 10⁶ Pa |
| initial gas density | ρ0 | 18.87 kg/m3 |
| atmospheric pressure | pa | 0.1 × 10⁶ Pa |
| gas density (standard atmospheric pressure) | ρa | 1.977 kg/m3 |
| vertical in situ stress | q1 | 2.5 MPa |
| horizontal in situ stress | q2 | 2.0 MPa |
| permeability of the coal sample | K | 6.243 × 10⁻¹² m2 |
| porosity of the coal sample | φ | 10% |
| dynamic viscosity of the gas | μ | 1.35 × 10⁻⁵ Pa·s |
| specific heat ratio of the gas | γ | 1.29 |
| width of the orifice | D | 30 mm |
| length of the model | l | 1050 mm |
| half the height of the model | h | 205 mm |
| elastic modulus of the coal sample | E | 300 MPa |
| Poisson’s ratio of the coal sample | υ | 0.3 |
| cohesion of the coal sample | C | 0.73 MPa |
| internal friction angle of the coal sample | ψ | 35° |
| density of the coal sample | ρs | 1380 kg/m3 |
| diameter of the coal particle | d | 5 mm |
| gas adsorption constant | A | 0.024 m3/kg |
| gas adsorption constant | B | 0.96 MPa–1 |
| temperature | T | 298.15 K |
| molar gas constant | R0 | 8.3143 J/(mol·K) |
| molar volume | Vm | 22.4 × 10⁻³ m3/mol |
3.2. Numerical Example
Figure 2 shows a two-dimensional coal sample model. The coal sample of l in length and 2h in height is placed in a closed container and filled with saturated gas. The black solid lines represent the impermeable boundaries, and the red dotted line at the center of the right boundary represents the orifice, which is closed before the test. The uniform forces q1 and q2 represent the vertical and horizontal in situ stresses, respectively. The bottom and right boundaries are fixed except for the orifice. It should be declared that this two-dimensional model is derived from the coal briquette used in experiments. The detailed test procedure, model similarity conditions, and engineering background are given in refs (12) and (14).
Figure 2.

Two-dimensional coal sample model.
The initial and boundary conditions are essential to obtain the gas state variation law in the coal sample. The gas in the coal sample is uniform, and its initial density is known before the test
| 27 |
Additionally, the free gas in the coal sample can only flow into the air rapidly from the orifice in the whole outburst process because the other boundaries are impermeable (see Figure 2). Hence, the boundary conditions can be expressed as
 |
28 |
where S represents the orifice and S̅ represents the rest of the right boundary.
Similarly, the stress and displacement boundary conditions, which are essential to obtain the stress state in the coal sample, are of the forms
| 29 |
where T̅ is the known surface force and u̅ is the known displacement. The details of the stress and displacement boundary conditions are shown in Figure 2.
3.2.1. Variation and Distribution of the Gas State in the Coal Sample
As mentioned before, some researchers have proved that gas seepage caused by a high gas pressure gradient is a key factor causing the outburst initiation. To analyze the relationship between the gas state and coal and gas outbursts, the variation and distribution of the gas state, such as gas pressure, the gas pressure gradient, and gas velocity, in the coal sample in outbursts are studied. Because the duration of coal and gas outbursts is only a few seconds, the change of the gas state is considered as the adiabatic state, so the value of n in eq 3 is γ. The results are shown in Figures 3–5.
Figure 3.

Distribution of gas pressure (MPa) isolines at different times in the coal sample.
Figure 5.

Distribution of gas velocity (m/s) isolines at different times in the coal sample.
As shown in Figure 3, the gas pressure isolines are approximately semicircular
near the orifice and tend to be straight lines parallel to the y-axis with the decrease of the x-position.
As shown in Figures 4 and 5, the distributions of the gas pressure
gradient and gas velocity in the coal sample are similar to that of
gas pressure, but the shape of isolines is slightly different near
the orifice. Also, another obvious difference between the gas pressure,
gas pressure gradient, and gas velocity is that the gas pressure is
the smallest, but the gas pressure gradient and gas velocity are the
largest near the orifice in the coal sample. Additionally, the gas
pressure, gas pressure gradient, and gas velocity drop rapidly upon
the gradual increase of time. For example, the maximum gas pressures
are 0.60, 0.39, and 0.12 MPa at t = 0.5, 1.0, and
5.0 s, respectively; the maximum gas pressure gradients are 7.94,
4.34, and 0.20 MPa/m at t = 0.5, 1.0, and 5.0 s,
respectively; and the maximum gas velocities are 36.70, 20.06, and
0.91 m/s at t = 0.5, 1.0, and 5.0 s, respectively.
Finally, the gas pressure tends to atmospheric pressure (0.1 MPa),
and the gas flow tends to be static with the time increase. To the
point, the gas velocity shown in Figure 5 is the total velocity, which is equal to  , where Ux and Uy are the ratios of gas seepage velocities ux and uy to the porosity of the coal sample, respectively.
Figure 4.

Distribution of gas pressure gradient (MPa/m) isolines at different times in the coal sample.
3.2.2. Coal Sample Failure and Outburst Evolution
The prominent phenomenon of coal and gas outbursts is that part of the coal is thrown into the roadway from the coal seam, and an outburst cavity is formed in the coal seam finally. To reveal the mechanisms of the coal sample failure and outburst evolution, the effective stress state in the coal sample is calculated and the outburst evolution is simulated. It should be noted that all stresses mentioned later are the effective stresses symboled by σ.
As shown in Figures 6 and 7, the stress σx in front of the outburst cavity called the failure area in this paper is smaller than the maximum stress σx at the upper right corner of the coal sample. On the contrary, the maximum stress σy appears in the failure area, and the stress concentration is remarkable in this area. As shown in Figure 8, the stress state is stable at three locations (see Figure 2) in the non-failure area and there is little change in the values of stress σx and σy in outbursts. Additionally, the maximum stress σy always occurs in the failure area and increases with the outburst evolution until the outburst ends, but the variation of the corresponding stress σx has no apparent law (see Figure 9). Finally, the stress state is stable in the coal sample when the outburst is over at t = 2.5 s, although there is a slight increase in stress because of the decrease in gas pressure. It should be noted that the variations of stress σx and σy shown in Figure 9 are not at a fixed position because the maximum stress σy always appears in the failure area, which gradually expands until the outburst ends.
Figure 6.

Distribution of the stress σx (MPa) at different times in the coal sample.
Figure 7.

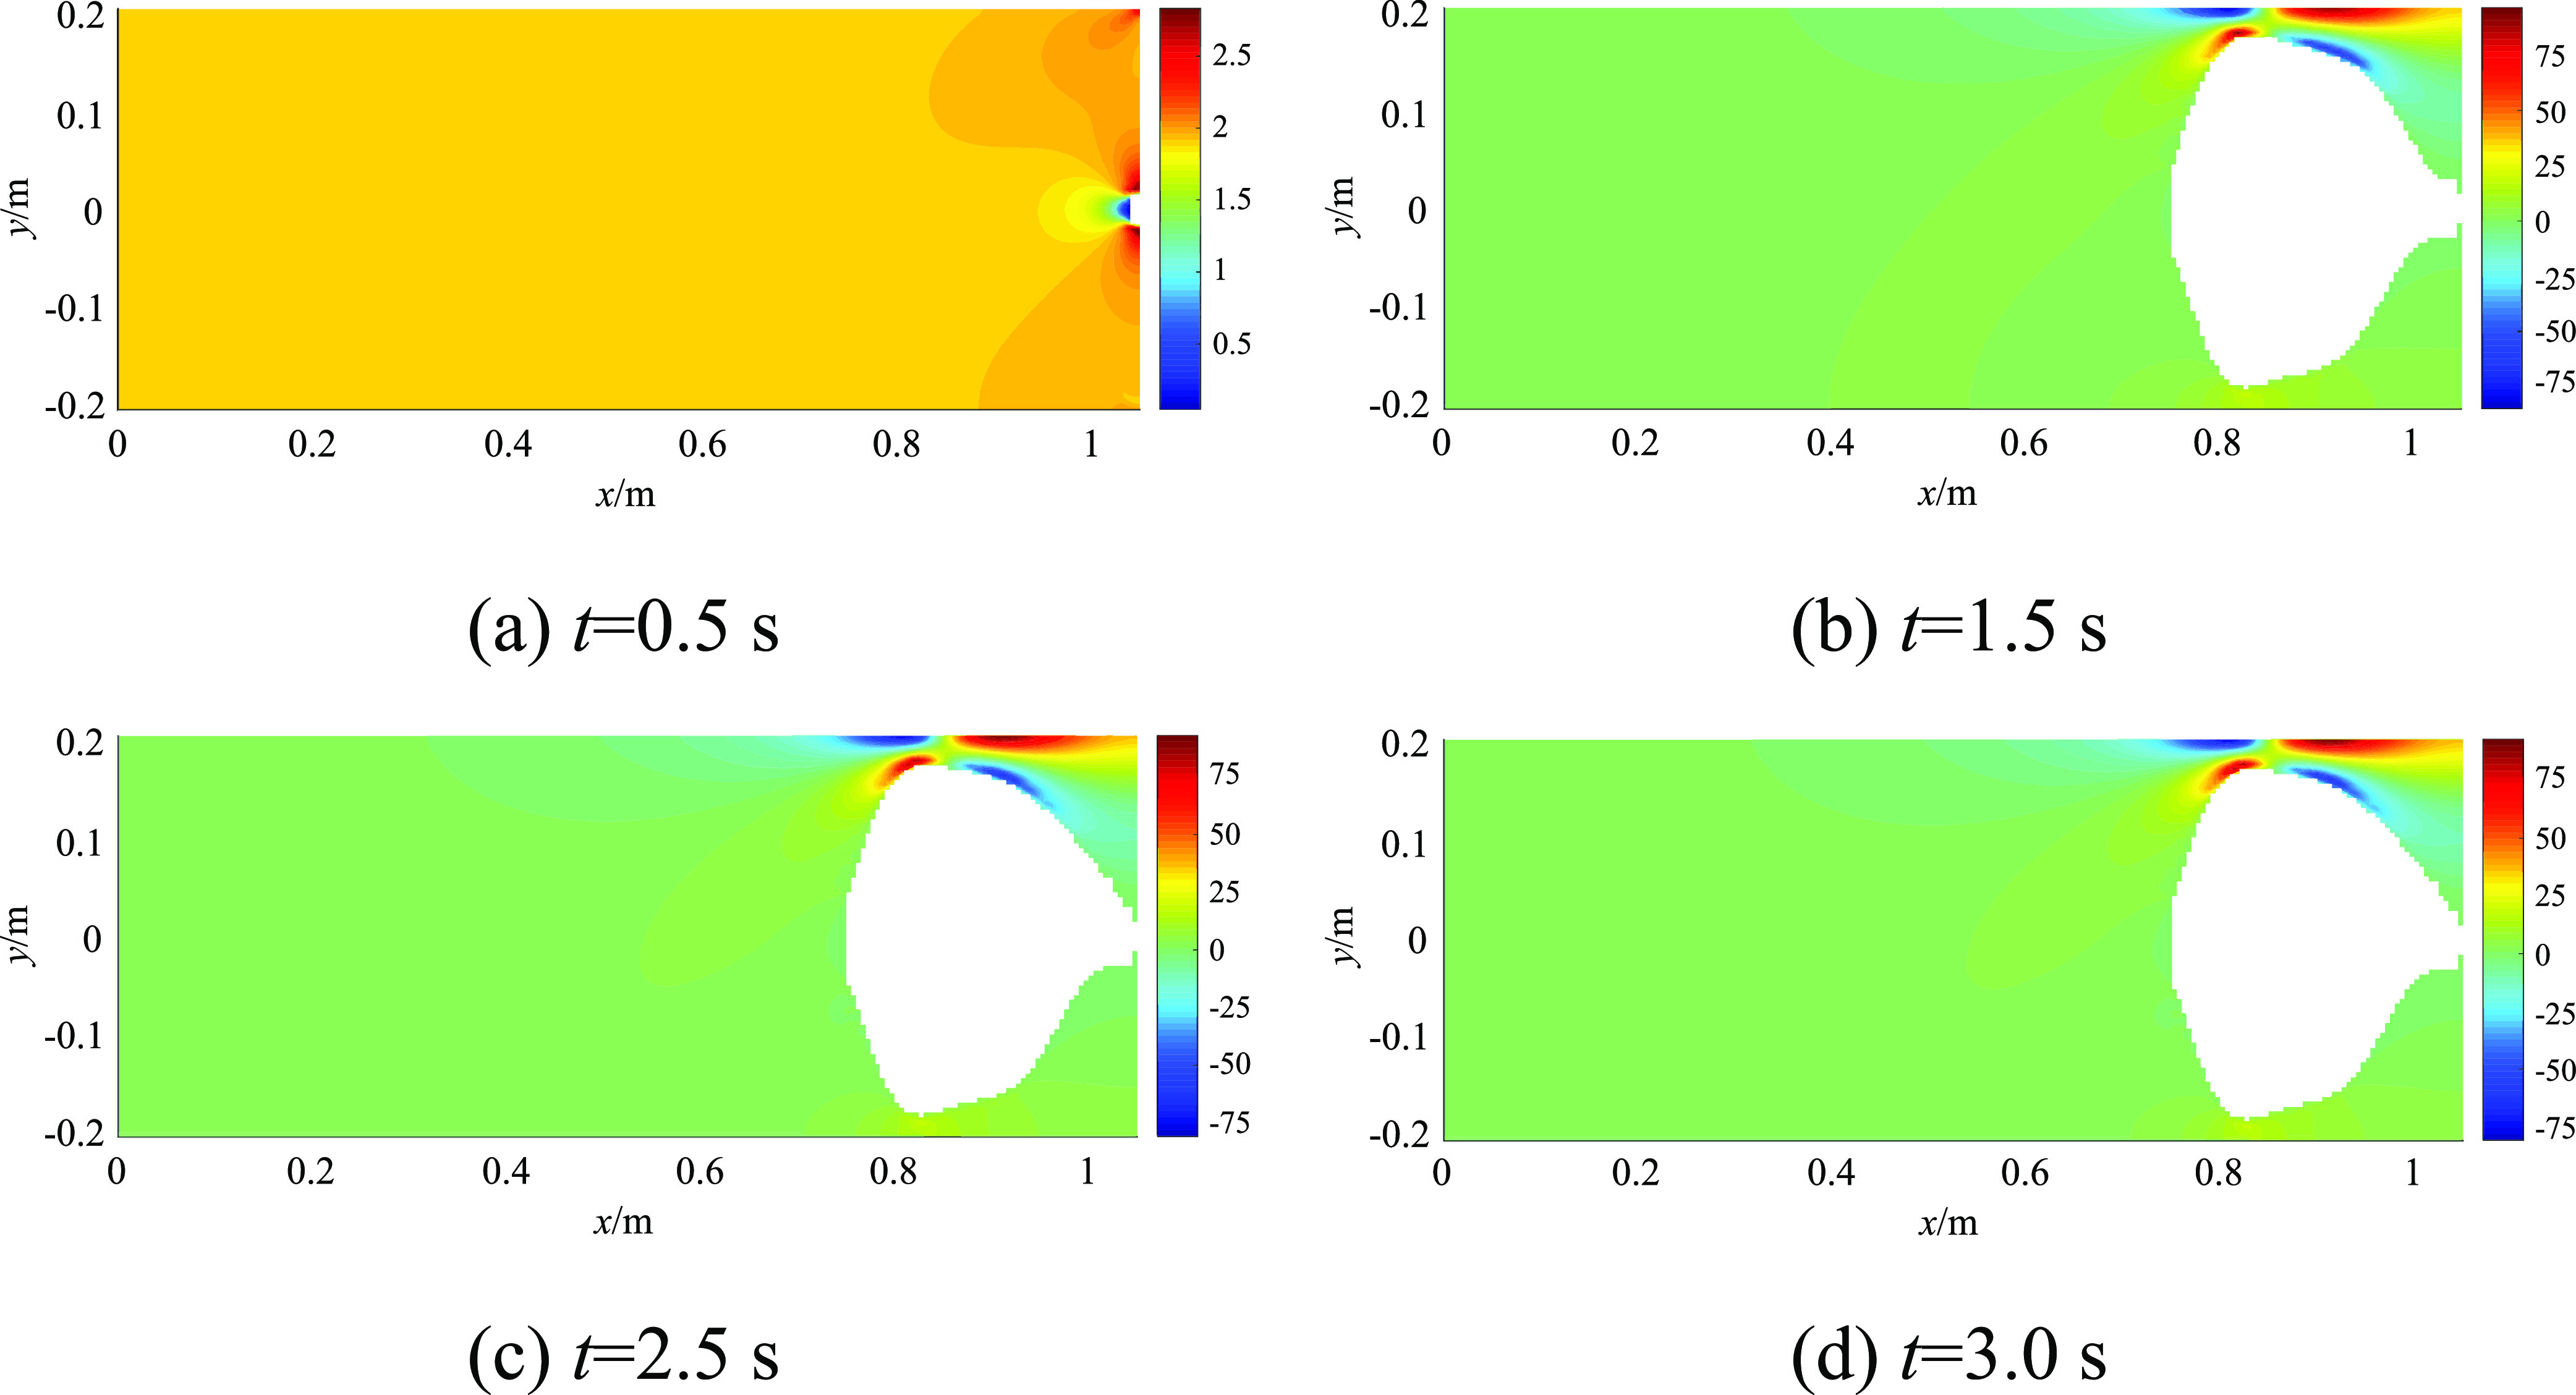
Distribution of the stress σy (MPa) at different times in the coal sample.
Figure 8.

Variation of the stress at three fixed locations in the non-failure area.
Figure 9.

Variations of the maximum stress σy and the corresponding stress σx in the failure area.
The results shown in this section indicate that the coal sample failure is the comprehensive result of in situ stress and gas (gas pressure and swelling stress), and then, the crushed coal sample is pushed into the air by gas, leading to the expansion of the outburst cavity and an increase in the stress in the failure area. This process is cycled until the gas velocity is less than the threshold friction velocity of the crushed coal sample. In other words, gas is the key factor to determine the initiation, evolution, and termination of coal and gas outbursts, and a high gas pressure gradient is essential to the outburst initiation. Additionally, the distribution and variation of the stress state and gas velocity in the coal sample are closely related to the shape of the outburst cavity.
4. Discussion
In Section 3, the coal and gas outburst process is analyzed, and the outburst mechanism is explained based on the mechanical model and simulation of the outburst evolution. The outburst mechanism obtained in this paper is consistent with the view generally accepted by scholars, that is, coal and gas outbursts are the comprehensive results of in situ stress, gas pressure, and the physical characteristics of coal. Although the outburst mechanism is analyzed, the effects of in situ stress, gas pressure, and the physical characteristics of coal on coal and gas outbursts are still unclear.
4.1. Effect of In Situ Stress on Coal and Gas Outbursts
In situ stress is an important factor leading to the outburst initiation. To research the effect of in situ stress on coal and gas outbursts, three different cases of uniform forces (q1 = 2.5 MPa, q2 = 2.0 MPa; q1 = 2.8 MPa, q2 = 2.0 MPa; and q1 = 2.5 MPa, q2 = 1.5 MPa) acting on the coal sample are considered. Case 1 is discussed in detail in Section 3.
As shown in Figures 6, 7, 10, and 11, the failure degree of the coal sample and the outburst strength, which is the ratio of the outburst coal amount to the total coal amount, increase significantly with the uniform force q1 (vertical in situ stress) under the same initial gas pressure and horizontal in situ stress conditions. The outburst strength increases from 2.8 to 17.1% as q1 increases from 2.5 MPa to 2.8 MPa. As shown in Figure 12, the maximum stress σy and the corresponding σx are sensitive to the change of q1 and their values increase from 8.6 MPa to 43.2 MPa and from 1.3 MPa to 32.8 MPa, respectively, as q1 increases by 0.3 MPa at t = 3 s. Additionally, the maximum stress σy increases rapidly under the condition of a higher vertical in situ stress level (2.8 MPa). For example, the maximum stresses σy are 4.1, 9.7, and 42.6 MPa at t = 0.5, 1.0, and 1.5 s, respectively, which are closely related to the evolution of the outburst cavity.
Figure 10.
Distribution of the stress σx (MPa) at different times in the coal sample (q1 = 2.8 MPa).
Figure 11.

Distribution of the stress σy (MPa) at different times in the coal sample (q1 = 2.8 MPa).
Figure 12.

Variations of the maximum stress σy and the corresponding stress σx in the failure area under different vertical in situ stresses.
On the other hand, it can be seen from the results shown in Figures 6, 7, 13, and 14 that the effect of the change of q2 (horizontal in situ stress) on the outburst strength is not remarkable. As shown in Figure 15, the effects of the change of q2 on the changes of the maximum stress σy and the corresponding σx in the failure area are not significant and irregular. Also, the maximum stress σy and the corresponding stress σx reduced by about 0.5 MPa and 0.02 MPa, respectively, as q1 increased from 1.5 MPa to 2.0 MPa at t = 3 s. The effect of the change of q1 on coal and gas outbursts is far more significant than that of the change of q2. That is, the outburst strength and failure degree are more sensitive to the change of the vertical in situ stress than to the change of the horizontal in situ stress.
Figure 13.

Distribution of the stress σx (MPa) at different times in the coal sample (q2 = 1.5 MPa).
Figure 14.

Distribution of the stress σy (MPa) at different times in the coal sample (q2 = 1.5 MPa).
Figure 15.

Variations of the maximum stress σy and the corresponding stress σx in the failure area under different horizontal in situ stresses.
The vertical and horizontal in situ stresses increase with the mining depth, which leads to the increase of the outburst frequency and strength. Obviously, the main reason for this phenomenon is the change of the vertical in situ stress rather than the horizontal in situ stress.
4.2. Effect of the Initial Gas Pressure on Coal and Gas Outbursts
Gas is another key factor affecting coal and gas outbursts. Two different cases of the initial gas pressure (1.0 and 1.5 MPa) are considered to research the effect of gas pressure on coal and gas outbursts. Case 1 is discussed in detail in Section 3.
As shown in Figure 17, the maximum stress σy always appears in the front of the failure area, and its value increases gradually with the expansion of the outburst cavity. For example, the maximum stresses σy are 3.6, 5.3, and 6.8 MPa at t = 0.5, 1.0, and 1.5 s, respectively. Additionally, the maximum stress σy still increases slightly due to the decrease of gas pressure after the outburst termination. For example, the maximum stresses σy are 11.76 and 11.77 MPa at t = 2.5 and 3 s, respectively (see Figure 18).
Figure 17.

Distribution of the stress σy (MPa) at different times in the coal sample (p0 = 1.5 MPa).
Figure 18.

Variations of the maximum stress σy and the corresponding stress σx in the failure area under different initial gas pressures.
Comparing the results shown in Figures 6, 7, 16, and 17, it can be seen that the failure degree of the coal sample and the violence of the outburst increase with the initial gas pressure. The outburst strength increases from 2.8 to 5.2% as the initial gas pressure increases from 1.0 MPa to 1.5 MPa. As shown in Figure 18, the maximum stress σy and the corresponding stress σx increase from 8.6 to 11.8 MPa and from 1.3 to 1.8 MPa, respectively, as the initial gas pressure increases by 0.5 MPa at t = 3 s. Obviously, the increase of initial gas pressure leads to a greater gas velocity, which can provide tremendous kinetic energy to push the crushed coal sample into the air. Hence, the outburst strength increases with the initial gas pressure.
Figure 16.

Distribution of the stress σx (MPa) at different times in the coal sample (p0 = 1.5 MPa).
4.3. Effect of the Physical Characteristics of Coal on Coal and Gas Outbursts
4.3.1. Cohesion
Cohesion, which is an important index to measure the strength of coal and rocks, reflects the ability of coal and rocks to resist failure. The stress state and outburst strength of two coal samples with the cohesions of 0.67 and 0.73 MPa under the same initial gas pressure and in situ stress are compared to research the effect of the coal sample cohesion on coal and gas outbursts. The coal sample with the cohesion of 0.73 MPa is discussed in detail in section 3.
As shown in Figures 19 and 20, the maximum stress σy always appears in the failure area, with an evident stress concentration. Also, the maximum stress σx appears in the upper right corner of the coal sample. Additionally, the maximum stress σy in the failure area increases with the expansion of the outburst cavity. For example, the maximum stresses σy are 3.7, 7.7, and 20.4 MPa at t = 0.5, 1.0, and 1.5 s, respectively. However, the change of the corresponding stress σx has no obvious law. For example, the stresses σx are 2.6, 2.3, and 17.5 MPa at t = 0.5, 1.0, and 1.5 s, respectively (see Figure 21).
Figure 19.

Distribution of the stress σx (MPa) at different times in the coal sample (C = 0.67 MPa).
Figure 20.

Distribution of the stress σy (MPa) at different times in the coal sample (C = 0.67 MPa).
Figure 21.

Variations of the maximum stress σy and the corresponding stress σx in the failure area under different cohesions.
Additionally, comparing the results shown in Figures 7 and 20, it can be seen that the effect of the coal sample cohesion on the outburst strength is significant and the outburst strength increases with the decrease of the coal sample cohesion. The outburst strength increases from 2.8 to 15% and the outburst duration reduces from about 2.5 s to about 1.5 s as the cohesion of the coal sample decreases from 0.73 to 0.67 MPa. As shown in Figure 21, the maximum stress σy and the corresponding stress σx increase from 8.6 to 20.5 MPa and from 1.3 to 17.6 MPa, respectively, as the coal sample cohesion decreases from 0.73 to 0.67 MPa at t = 3 s.
4.3.2. Internal Friction Angle
The internal friction angle is another important index to measure the strength of coal and rocks. To research the effect of the coal sample internal friction angle on coal and gas outbursts, two cases of internal friction angle (30 and 35°) are considered. The coal sample with the internal friction angle of 35° is discussed in detail in Section 3.
As shown in Figure 23, the maximum stress σy always appears in the failure area, where there is an apparent stress concentration. Additionally, the maximum stress σy in the failure area increases with the expansion of the outburst cavity. For example, the maximum stresses σy are 3.7, 7.8, and 24.2 MPa at t = 0.5, 1.0, and 1.5 s, respectively. However, the change of the corresponding stress σx has no obvious law. For example, the stresses σx are 2.6, 1.3, and 43.0 MPa at t = 0.5, 1.0, and 1.5 s, respectively (see Figure 24). The stress state tends to be stable, although the decrease of gas pressure causes a small increase in stress when the outburst ends.
Figure 23.

Distribution of the stress σy (MPa) at different times in the coal sample (ψ = 30°).
Figure 24.

Variations of the maximum stress σy and the corresponding stress σx in the failure area under different internal friction angles.
Additionally, comparing the results shown in Figures 6, 7, 22, and 23, it can be seen that the size and violence of the outburst increase significantly with the decrease of the coal sample internal friction angle. The outburst strength increases from 2.8 to 17% and the outburst duration reduces from about 2.5 s to about 1.5 s as the internal friction angle of the coal sample decreases from 35 to 30°. As shown in Figure 24, the maximum stress σy and the corresponding stress σx increase from 8.6 to 24.2 MPa and from 1.3 to 43.0 MPa, respectively, as the coal sample internal friction angle decreases from 35 to 30° at t = 3 s.
Figure 22.

Distribution of the stress σx (MPa) at different times in the coal sample (ψ = 30°).
5. Conclusions
In this paper, a mechanical model on coal and gas outbursts is established, and a criterion of outburst initiation, evolution, and termination is proposed. Based on this mechanical model, the variation and distribution of the gas state and stress state in the coal sample in outbursts are analyzed quantitatively, and the outburst mechanism is researched. Furthermore, the roles of in situ stress, gas pressure, and the physical characteristics of coal in outbursts are revealed, and the effects of these factors on outbursts are investigated. According to this study, the main findings on the outburst mechanism are concluded as follows:
-
(1)
In situ stress and gas pressure are the main factors causing the coal sample failure. There is apparent stress concentration in the failure area, and the stress concentration factor increases gradually until the outburst ends. Additionally, the greater the vertical in situ stress and initial gas pressure are, the greater the outburst strength is, and the outburst strength is more sensitive to the change of the vertical in situ stress than to the change of the initial gas pressure.
-
(2)
The distribution and variation of gas velocity in the coal sample are closely related to the shape of the outburst cavity. The drag force caused by gas flow provides enough energy for the crushed coal sample movement, leading to the outburst initiation and expansion of the outburst cavity until the gas velocity is less than the threshold friction velocity of the crushed coal sample. Hence, gas is the key factor to determining the outburst initiation, evolution, and termination, and a high gas velocity is essential to the outburst initiation and evolution.
-
(3)
The coal sample with the relatively large internal friction angle and cohesion has a stronger ability to resist failure. Hence, the outburst strength is relatively small. Young’s modulus and Poisson’s ratio of the coal sample do not affect the effective stress in the coal sample and the outburst strength.
A three-dimensional model can simulate coal and gas outbursts and reveal the outburst mechanism more accurately. Hence, this aspect can be taken into account in future research to conduct a more complete study on coal and gas outbursts.
Acknowledgments
We gratefully acknowledge the support provided by the State Key Laboratory of Coal Mine Disaster Dynamics and Control (no. 2011DA105287-ZD201603), the Basic and Frontier Research Projects of Chongqing (no. cstc2016jcyjA0117), and the Fundamental Research Funds for the Central Universities (no. 106112017CDJQJ248825).
The authors declare no competing financial interest.
References
- Farmer I. W.; Pooley F. D. A Hypothesis to Explain the Occurrence of Outbursts in Coal, Based on a Study of West Wales Outburst Coal. Int. J. Rock Mech. Min. Sci. Geomech. Abstr. 1967, 4, 189–193. 10.1016/0148-9062(67)90043-5. [DOI] [Google Scholar]
- Li Z.; Wang E.; Ou J.; Liu Z. Hazard Evaluation of Coal and Gas Outbursts in a Coal-Mine Roadway Based on Logistic Regression Model. Int. J. Rock Mech. Min. Sci. 2015, 80, 185–195. 10.1016/j.ijrmms.2015.07.006. [DOI] [Google Scholar]
- Liu S.; Li X.; Wang D.; Wu M.; Yin G.; Li M. Mechanical and Acoustic Emission Characteristics of Coal at Temperature Impact. Nat. Resour. Res. 2020, 29, 1755–1772. 10.1007/s11053-019-09562-w. [DOI] [Google Scholar]
- Lama R. D.; Bodziony J. Management of Outburst in Underground Coal Mines. Int. J. Coal Geol. 1998, 35, 83–115. 10.1016/S0166-5162(97)00037-2. [DOI] [Google Scholar]
- Wang J.-c.; Jiang F.-x.; Meng X.-j.; Wang X.-y.; Zhu S.-t.; Feng Y. Mechanism of Rock Burst Occurrence in Specially Thick Coal Seam with Rock Parting. Rock Mech. Rock Eng. 2016, 49, 1953–1965. 10.1007/s00603-015-0894-8. [DOI] [Google Scholar]
- Tang J.; Wang C.; Chen Y.; Li X.; Yang D.; Liu J. Determination of Critical Value of an Outburst Risk Prediction Index of Working Face in a Coal Roadway Based on Initial Gas Emission from a Borehole and Its Application: A Case Study. Fuel 2020, 267, 117229. 10.1016/j.fuel.2020.117229. [DOI] [Google Scholar]
- Wang K.; Du F. Coal-Gas Compound Dynamic Disasters in China: A Review. Process Saf. Environ. Prot. 2020, 133, 1–17. 10.1016/j.psep.2019.10.006. [DOI] [Google Scholar]
- Fernandez-Diaz J. J.; Gonzalez-Nicieza C.; Alvarez-Fernandez M. I.; Lopez-Gayarre F. Analysis of Gas-Dynamic Phenomenon in Underground Coal Mines in the Central Basin of Asturias (Spain). Eng. Fail. Anal. 2013, 34, 464–477. 10.1016/j.engfailanal.2013.07.027. [DOI] [Google Scholar]
- Wang G.; Guo Y.; Wang P.; Li W.; Wu M.; Sun L.; Cao J.; Du C. A New Experimental Apparatus for Sudden Unloading of Gas-Bearing Coal. Bull. Eng. Geol. Environ. 2020, 79, 857–868. 10.1007/s10064-019-01601-3. [DOI] [Google Scholar]
- Alexeev A. D.; Revva V. N.; Alyshev N. A.; Zhitlyonok D. M. True Triaxial Loading Apparatus and Its Application to Coal Outburst Prediction. Int. J. Coal Geol. 2004, 58, 245–250. 10.1016/j.coal.2003.09.007. [DOI] [Google Scholar]
- Du F.; Wang K.; Zhang X.; Xin C.; Shu L.; Wang G. Experimental Study of Coal-Gas Outburst: Insights from Coal-Rock Structure, Gas Pressure and Adsorptivity. Nat. Resour. Res. 2020, 29, 2481–2493. 10.1007/s11053-020-09621-7. [DOI] [Google Scholar]
- Liu D.; Xu J.; Yin G.; Wang W.; Liang Y.; Peng S. Development and Application of Multifield Coupling Testing System for Dynamic Disaster in Coal Mine. Chin. J. Rock Mech. Eng. 2013, 32, 966–975. [Google Scholar]
- Yin G.; Jiang C.; Wang J. G.; Xu J.; Zhang D.; Huang G. A New Experimental Apparatus for Coal and Gas Outburst Simulation. Rock Mech. Rock Eng. 2016, 49, 2005–2013. 10.1007/s00603-015-0818-7. [DOI] [Google Scholar]
- Zhang C.; Peng S.; Xu J.; Geng J.; Yang H.; Luo X. Temporospatial Evolution of Gas Pressure during Coal and Gas Outburst. Rock Soil Mech. 2017, 38, 81–90. 10.16285/j.rsm.2017.01.011. [DOI] [Google Scholar]
- Ding Y.; Yue Z. Q. An Experimental Investigation of the Roles of Water Content and Gas Decompression Rate for Outburst in Coal Briquettes. Fuel 2018, 234, 1221–1228. 10.1016/j.fuel.2018.07.143. [DOI] [Google Scholar]
- Lu J.; Yin G.; Gao H.; Li X.; Zhang D.; Deng B.; Wu M.; Li M. True Triaxial Experimental Study of Disturbed Compound Dynamic Disaster in Deep Underground Coal Mine. Rock Mech. Rock Eng. 2020, 53, 2347–2364. 10.1007/s00603-019-02041-x. [DOI] [Google Scholar]
- Nie B.; Li X. Mechanism Research on Coal and Gas Outburst during Vibration Blasting. Saf. Sci. 2012, 50, 741–744. 10.1016/j.ssci.2011.08.041. [DOI] [Google Scholar]
- Yin G.; Jiang C.; Wang J. G.; Xu J. Geomechanical and Flow Properties of Coal from Loading Axial Stress and Unloading Confining Pressure Tests. Int. J. Rock Mech. Min. Sci. 2015, 76, 155–161. 10.1016/j.ijrmms.2015.03.019. [DOI] [Google Scholar]
- Guo B.; Li Y.; Jiao F.; Luo T.; Ma Q. Experimental Study on Coal and Gas Outburst and the Variation Characteristics of Gas Pressure. Geomech. Geophys. Geo-Energy Geo-Resour. 2018, 4, 355–368. 10.1007/s40948-018-0092-8. [DOI] [Google Scholar]
- Skoczylas N. Laboratory Study of the Phenomenon of Methane and Coal Outburst. Int. J. Rock Mech. Min. Sci. 2012, 55, 102–107. 10.1016/j.ijrmms.2012.07.005. [DOI] [Google Scholar]
- Peng S. J.; Xu J.; Yang H. W.; Liu D. Experimental Study on the Influence Mechanism of Gas Seepage on Coal and Gas Outburst Disaster. Saf. Sci. 2012, 50, 816–821. 10.1016/j.ssci.2011.08.027. [DOI] [Google Scholar]
- Sobczyk J. The Influence of Sorption Processes on Gas Stresses Leading to the Coal and Gas Outburst in the Laboratory Conditions. Fuel 2011, 90, 1018–1023. 10.1016/j.fuel.2010.11.004. [DOI] [Google Scholar]
- Sobczyk J. A comparison of the influence of adsorbed gases on gas stresses leading to coal and gas outburst. Fuel 2014, 115, 288–294. 10.1016/j.fuel.2013.07.016. [DOI] [Google Scholar]
- Zhou B.; Xu J.; Peng S.; Yan F.; Yang W.; Cheng L.; Ni G. Experimental Analysis of the Dynamic Effects of Coal-Gas Outburst and a Protean Contraction and Expansion Flow Model. Nat. Resour. Res. 2020, 29, 1617–1637. 10.1007/s11053-019-09552-y. [DOI] [Google Scholar]
- Clarkson C. R.; Bustin R. M. The Effect of Pore Structure and Gas Pressure upon the Transport Properties of Coal: A Laboratory and Modeling Study. 1. Isotherms and Pore Volume Distributions. Fuel 1999, 78, 1333–1344. 10.1016/S0016-2361(99)00055-1. [DOI] [Google Scholar]
- Jin H.; Hu Q.; Liu Y. Failure Mechanism of Coal and Gas Outburst Initiation. Procedia Eng. 2011, 26, 1352–1360. 10.1016/j.proeng.2011.11.2311. [DOI] [Google Scholar]
- Xu T.; Tang C. A.; Yang T. H.; Zhu W. C.; Liu J. Numerical Investigation of Coal and Gas Outbursts in Underground Collieries. Int. J. Rock Mech. Min. Sci. 2006, 43, 905–919. 10.1016/j.ijrmms.2006.01.001. [DOI] [Google Scholar]
- Xue S.; Wang Y.; Xie J.; Wang G. A Coupled Approach to Simulate Initiation of Outbursts of Coal and Gas - Model Development. Int. J. Coal Geol. 2011, 86, 222–230. 10.1016/j.coal.2011.02.006. [DOI] [Google Scholar]
- Chen K. P. A new mechanistic model for prediction of instantaneous coal outbursts - Dedicated to the memory of Prof. Daniel D. Joseph. Int. J. Coal Geol. 2011, 87, 72–79. 10.1016/j.coal.2011.04.012. [DOI] [Google Scholar]
- Shu L.; Wang K.; Qi Q.; Fan S.; Zhang L.; Fan X. Key Structural Body Theory of Coal and Gas Outburst. Chin. J. Rock Mech. Eng. 2017, 36, 347–356. 10.13722/j.cnki.jrme.2016.0598. [DOI] [Google Scholar]
- Xin C.; Du F.; Wang K.; Xu C.; Huang S.; Shen J. Damage evolution analysis and gas-solid coupling model for coal containing gas. Geomech. Geophys. Geo-Energy Geo-Resour. 2021, 7, 1–15. 10.1007/s40948-020-00205-6. [DOI] [Google Scholar]
- Bear J.Dynamics of Fluids in Porous Media; Dover Publ. INC.: New York, 1988, pp 122–123. [Google Scholar]
- Smith I. M.; Griffiths D. V.; Margetts L.. Programming the Finite Element Method; John Wiley & Sons Ltd: United Kingdom, 2014. [Google Scholar]
- Wu S.; Zhao W. Analysis of Effective Stress in Adsorbed Methane-Coal System. Chin. J. Rock Mech. Eng. 2005, 24, 1674–1678. [Google Scholar]
- Shao Y.; Lu H. A Simple Expression for Wind Erosion Threshold Friction Velocity. J. Geophys. Res. 2000, 105, 22437–22443. 10.1029/2000jd900304. [DOI] [Google Scholar]