

Abstract
Heparan sulfate (HS) proteoglycans bind extracellular proteins that participate in cell signaling, attachment, and endocytosis. These interactions depend on the arrangement of sulfated sugars in the HS chains generated by well-characterized biosynthetic enzymes; however the regulation of these enzymes is largely unknown. We conducted genome-wide CRISPR/Cas9 screens with a small molecule ligand that binds to HS. Screening of A375 melanoma cells uncovered additional genes and pathways impacting heparan sulfate formation. The top hit was the epigenetic factor KDM2B, a histone demethylase. KDM2B inactivation suppressed multiple HS sulfotransferases and upregulated the sulfatase SULF1. These changes differentially affected the interaction of heparan sulfate-binding proteins. KDM2B-deficient cells displayed decreased growth rates, which was rescued by SULF1 inactivation. In addition, KDM2B deficiency altered the expression of many extracellular matrix genes. Thus, KDM2B controls proliferation of A375 cells through the regulation of HS structure, and serves as a master regulator of the extracellular matrix.
INTRODUCTION
All animal cells express one or more heparan sulfate proteoglycans (HSPGs). The HSPGs are comprised of a small set of proteins with the common feature of containing one or more covalently linked heparan sulfate (HS) chains. HS is a linear polysaccharide assembled in the Golgi by the copolymerization of alternating residues of N-acetyl-d-glucosamine (GlcNAc) and d-glucuronic acid (GlcA) on a tetrasaccharide primer linked to the proteoglycan core protein. As the chains assemble, they undergo a series of modification reactions that include N-deacetylation and N-sulfation of a subset of GlcNAc residues, epimerization of adjacent d-GlcA residues to l-iduronic acid (IdoA), 2-O-sulfation of IdoA and GlcA residues, and 6-O-sulfation and occasional 3-O-sulfation of glucosamine units (Fig. 1a). There is great structural heterogeneity both in chain length, size and spacing of the modified tracts, and the extent of sulfation and epimerization within the modified segments. The arrangement of sulfate groups and uronic acid epimers varies temporally and spatially during development and in different tissues in the adult. The modified regions of the chains make up binding sites for various protein ligands, which are known collectively as the heparan sulfate-interactome1. Binding can result in tethering and presentation of protein ligands at the cell surface, protein oligomerization, and allosteric regulation. In this way, HSPGs regulate important biological processes including cell proliferation, motility, development, and various physiological phenomena2.
Fig. 1. Finding novel regulators of heparan sulfate biosynthesis through genome-wide screens.
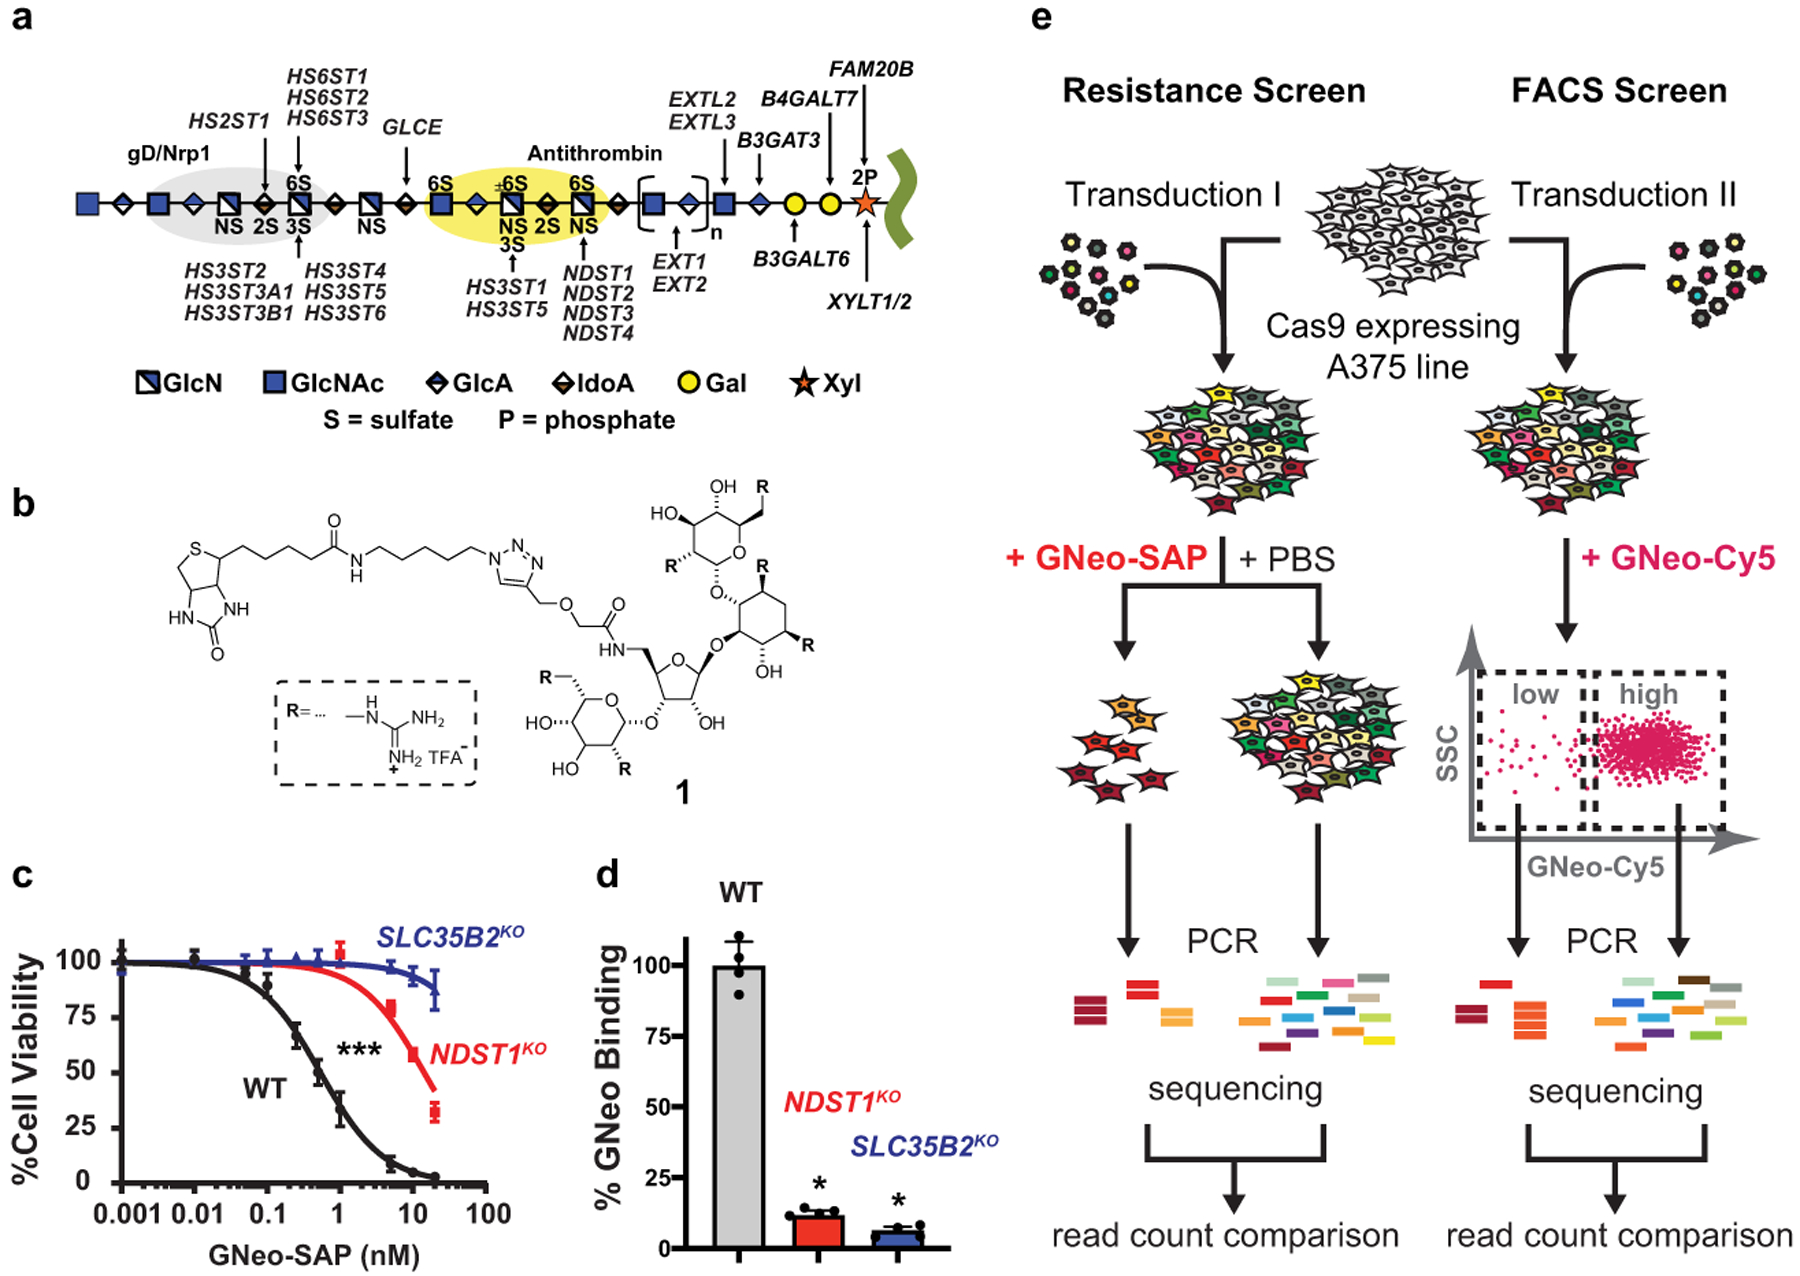
(a) Heparan sulfate (HS) assembles while attached via a tetrasaccharide to a core proteoglycan protein. NDSTs, HS2ST, HS3STs and HS6STs install sulfate groups at specific sites along the HS chain and an epimerase (GLCE) converts d-glucuronic acid to l-iduronic acid. The chain is rendered according the Symbol Nomenclature for Glycans. (b) Guanidinylated neomycin (GNeo) is as a highly selective ligand for HS. (c) Treatment of A375 WT, NDST1 mutant, and SLC35B2 mutant cell lines with increasing concentrations of GNeo-Saporin. NDST1 N-deacetylates subsets of N-acetylglucosamine units and adds N-sulfate to the glucosamine residues, which is required for GNeo binding9. SLC35B2 is a Golgi transporter for 3′-phosphoadenosine-5′-phosphosulfate (PAPS), which is the high energy sulfate donor for sulfation of HS and other GAGs3 (Kruskal-Wallis-test on combined dataset, n=4). (d) Flow cytometry analysis of WT, NDST1 mutant, and SLC35B2 mutant cell lines after incubation with GNeo-biotin conjugated to streptavidin-Cy5 (Mann-Whitney test, n=4). (e) A375 cells, stably expressing Cas9, were transduced with the genome-wide GeCKO sgRNA library and subjected to a screen for resistance against GNeo-saporin (left) and a screen for low GNeo-Cy5 binding (right). For details see Online Methods.
The enzymes involved in HS biosynthesis have been identified, cloned, biochemically characterized, and mutated in cells and model organisms3. Although much is known about the biosynthetic enzymes and HS composition, little is known about the mechanisms that dictate tissue-specific patterning of the HS chains. The organization of sulfated residues along the chains, in part, reflects the substrate specificity of the enzymes, sequential mode of action, and possibly their physical association into complexes3,4. However, other non-enzymatic factors can regulate patterning of the chains as well as expression of the proteoglycan core proteins. Such factors include transcriptional regulatory elements, 5’UTR and 3’UTR sequences present in mRNAs, microRNAs, and molecular chaperones (5,6 and references therein). Thus, the composition of the chains, their binding properties and ultimately their biological activity depend on diverse factors in addition to the catalytic properties of the biosynthetic enzymes.
The development of CRISPR/Cas9 as a genetic tool has enabled genome-wide loss-of-function screens. Here, a genome-wide CRISPR/Cas9-mediated screen was developed to uncover and characterize novel regulators of HS assembly. High-throughput screening assays were adapted using a low molecular weight HS-dependent ligand, guanidinylated neomycin (GNeo), to identify lentiviral-encoded sgRNAs that induce resistance to a GNeo-toxin conjugate or reduce binding of a fluorescent GNeo derivative to HS on the cell surface. Enrichment analysis of the sequencing data recovered known HS biosynthetic enzymes as well as many genes with previously unrecognized links to HS assembly. One of the top-scoring genes, KDM2B, is a histone lysine demethylase. Subsequent gene inactivation, RNA sequencing, ChIP-Seq, and biochemical analysis revealed KDM2B to be a regulator of HS structure, HS binding to protein ligands, and growth of cells in monolayer culture and soft agar. Moreover, our findings suggest that KDM2B regulates several components of the matrisome7, a set of gene products and interactions that make up the extracellular matrix, including proteoglycans.
RESULTS
CRISPR screens identify regulators of HS biosynthesis
A375 human melanoma cells express cell surface HS and have been used for genome-wide CRISPR screens8; thus, they were chosen as a model to conduct pooled genome-wide CRISPR/Cas9 knock-out screens to find genes that altered HS on the cell surface. In previous work, we described guanidinylated neomycin (GNeo; Fig 1b), a highly specific ligand for HS with minimal affinity to other types of cell surface glycans9. To interrogate GNeo-HS interactions, biotinylated GNeo with a modified linker (GNeo-biotin; See Supplementary Information: Synthetic Procedures, compound 1) was synthesized and conjugated to streptavidin-saporin. Saporin, a type-1 ribosome inactivating protein from the plant Saponaria officinalis, does not penetrate the cell membrane on its own, but when conjugated to GNeo, it becomes a potent HS-dependent cytotoxic compound (GNeo-SAP; Fig. 1c)9. GNeo-biotin also was conjugated to streptavidin-Cy5 to generate a fluorescent conjugate (GNeo-Cy5) that binds to HS on the cell surface and can be quantitated using flow cytometry (Fig. 1d). These agents allow parallel, partially orthogonal screens for sgRNAs that render cells either resistant to GNeo-SAP or that bind less GNeo-Cy5. The agents were tested in A375 cells mutated by CRISPR/Cas9 gene targeting of SLC35B2 or NDST1, factors involved in transport of the active sulfate donor, 3’-phospho-adenyl-5’-phosphosulfate, and N-sulfation of glucosamine residues in HS, respectively3. Mutations in these genes rendered cells resistant to GNeo-SAP and reduced binding of GNeo-Cy5 (Fig. 1c–d).
To identify novel genes that regulate HS assembly, a genome-wide library of single-gene mutants of A375 cells was generated. A large population (1 × 10⁸) of cells that stably express the Cas9 nuclease were transduced at a low MOI (~0.3) with a pool of lentiviruses representing the GeCKO v2 sgRNA library10. We then employed a dual screening strategy to select for mutants deficient in HS assembly. In the toxin-based resistance screen, a population of GeCKO-transduced cells was treated with GNeo-SAP to enrich for resistant mutants (Fig. 1e). In a parallel screen, cells were sorted by flow cytometry by incubating cells with GNeo-Cy5 and the cells that showed decreased binding to the fluorescent probe were collected. In the resistance screen, cells were cultured in GNeo-SAP at LD99 for four days after which the toxin was removed, and surviving cells were expanded for another 8 days to generate sufficient material for genomic DNA extraction. PBS-treated control populations were cultivated in parallel over the same time span and passaged every other day while maintaining ~100X coverage of the sgRNA library. For the FACS screen, GeCKO-transduced A375 cells were harvested after 2 days, incubated with 50 nM GNeo-Cy5 on ice, and subjected to cell sorting to separate the GNeo-negative (“low”) sub-population from the GNeo-Cy5 positive (“high”) cells (Fig. 1e). In both screens, cells were harvested, genomic DNA was extracted, and the sgRNA loci were amplified using nested PCR8 to find sgRNAs with high fold-enrichment over the controls. Sequencing data were processed using the open-source analysis platform PinAPL-Py11. Briefly, sgRNA counts were compared between the GNeo-SAP treated and PBS-treated population, and the GNeo-Cy5 low and GNeo-Cy5 high population, respectively. The fold-enrichment data of individual sgRNAs (Supplementary Data Set 1–2) targeting the same gene was combined into a single enrichment score for each gene (see Methods), thus yielding a ranking of genes based on their degree of positive selection under the screening conditions (Supplementary Data Set 3–4). We validated the library construction and screening protocol by conducting a resistance screen using diphtheria toxin (DTX) (Extended Data Fig. 1)12. The primary hits in the DTX screen included the membrane-bound precursor of heparin-binding epidermal growth factor receptor (HBEGF), part of the receptor complex for DTX required to elicit its cytotoxic function13, and genes involved in diphthamide formation (DPH1 and DPH2), the intracellular target of DTX14.
Analysis of recovered sgRNA sequences from the GNeo-SAP and GNeo-Cy5 screens showed distinct shifts in the read count distribution, with read count abundance concentrating on few sgRNAs and genes (Fig. 2a–b), indicating successful enrichment of positively selected mutants. Enrichment analysis of the screens recovered several known key enzymes of HS biosynthesis, in concordance with the requirement of HS for GNeo binding (Fig. 2c–d). To prioritize genes for further study, we identified 187 overlapping high-ranking genes from both screens that by gene association analysis as implemented in STRING15 revealed clusters related to HS biosynthesis, ubiquitination, vesicle transport, microtubules, and signaling pathways Supplementary Data Set 5; Figs. 2e). We were particularly interested in transcriptional regulators of HS assembly6 and focused on one cluster comprised of transcription factors and genes involved in chromatin modification (Fig. 2e). This cluster included KDM2B, a histone demethylase that represses cell differentiation pathways and can promote oncogenic proliferation16 with no known ties to HS biosynthesis. Interestingly, analysis of the sequencing data with more restrictive significance thresholds (Supplementary Data Set 6–7) resulted in KDM2B as the only gene shared between the top-scoring hits from the GNeo-SAP and GNeo-Cy5 screen. Thus, KDM2B was chosen for further study.
Fig. 2. Sequencing data analysis of CRISPR/Cas9 screens selecting for regulators of HS biosynthesis.
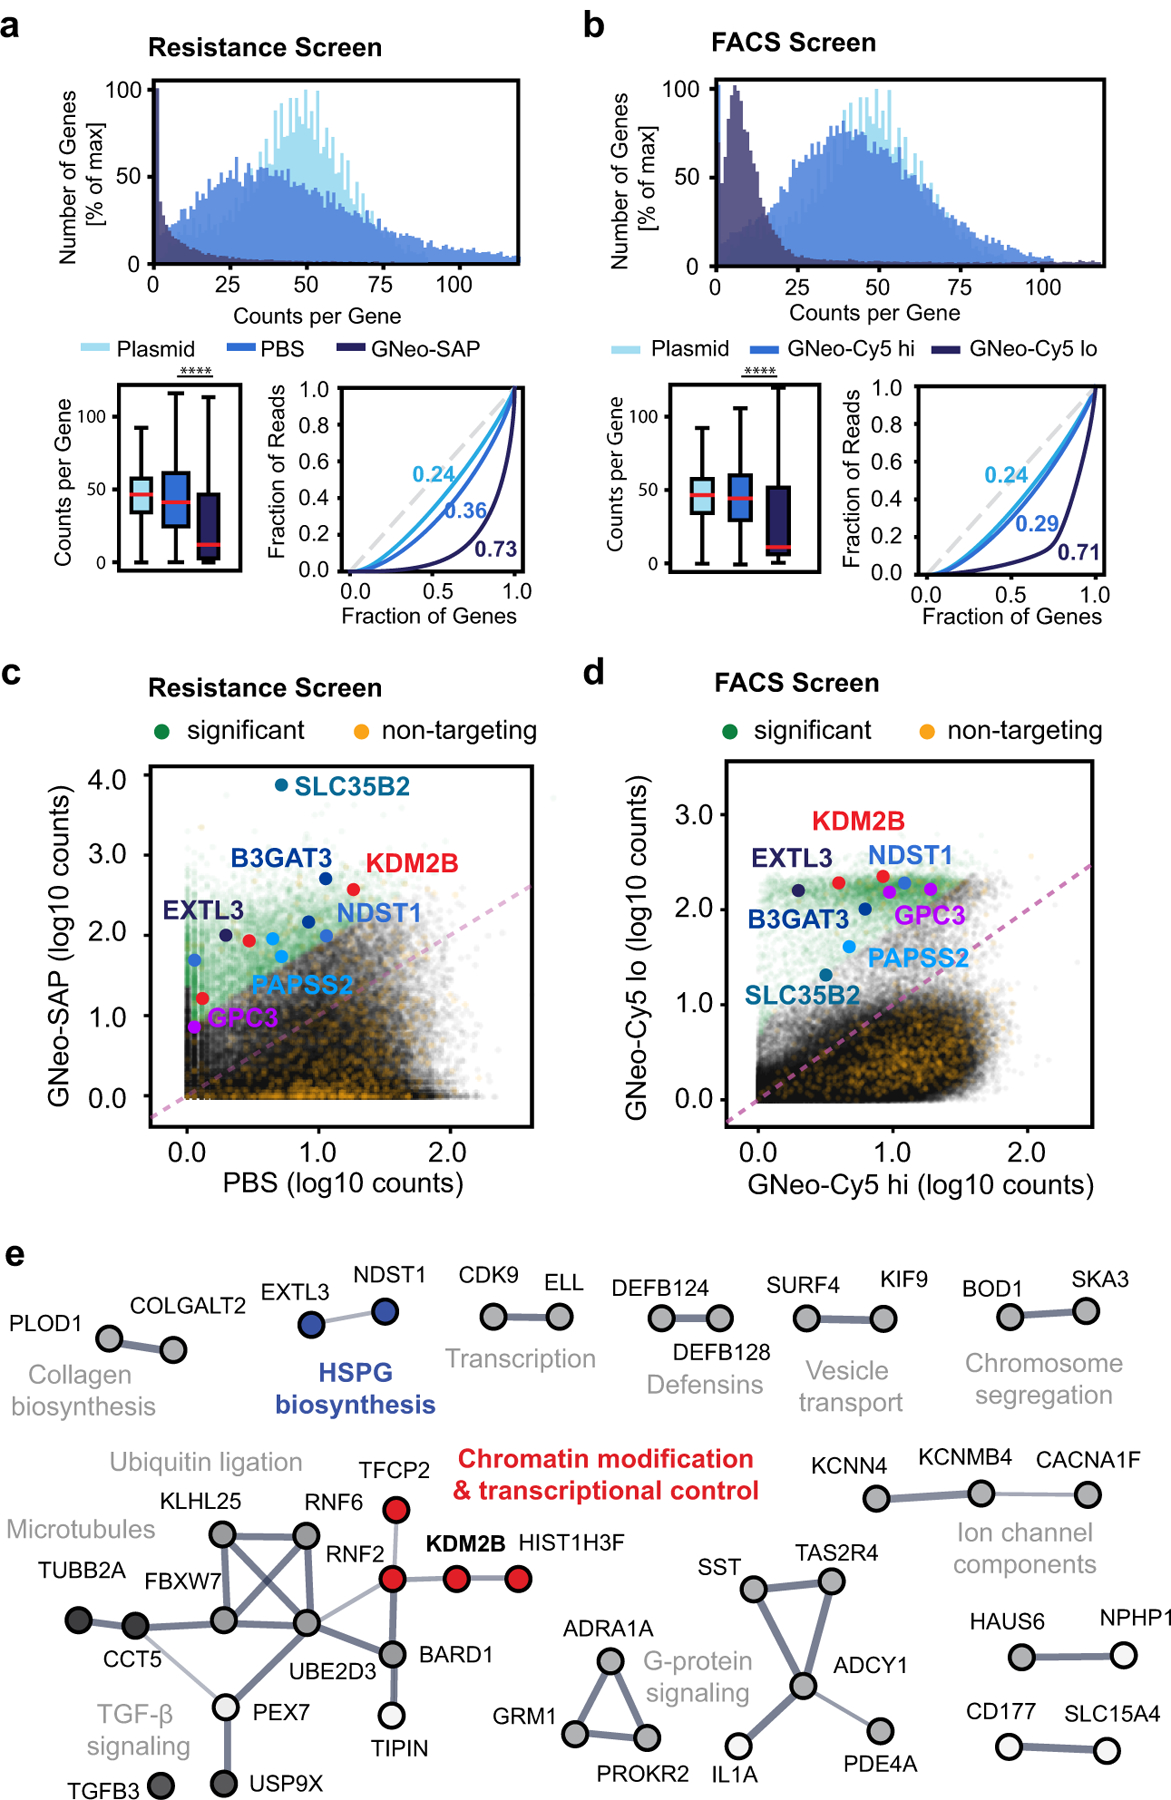
(a) Top: Frequency distribution of gene counts after treatment with either 10 nM GNeo-Saporin or PBS (Plasmid = GeCKO v2 plasmid library). Bottom left: Boxplots showing the gene count distribution for each sample (Kolmogorov-Smirnov-Test; n=21,915; Boxplot whiskers showing 5% and 95% percentiles, outliers omitted for clarity). Bottom right: Lorenz curves showing the distribution of sequencing reads over the gene library. Numbers represent Gini coefficients (0: reads cover gene library evenly, 1: reads cover only a single gene). (b) Left: Frequency distribution of gene counts after incubation with GNeo-Cy5 and collecting both the low and the high binding cell fractions (Plasmid = GeCKO v2 plasmid library). Bottom left: Boxplots showing the gene count distribution for each sample (Kolmogorov-Smirnov-Test; n=21,915; Boxplot whiskers showing 5% and 95% percentiles, outliers omitted for clarity). Bottom right: Lorenz curves showing the distribution of sequencing reads over the gene library. Numbers represent Gini coefficients. (c) Scatterplot of sgRNA counts (log10, normalized) in samples recovered after GNeo-Saporin treatment versus PBS treatment. (d) Scatterplot of sgRNA counts (log10, normalized) in the low binding versus the high binding cell fraction after incubation with GNeo-Cy5. In (c) and (d), the sgRNA fraction with significant fold-change is shown in green, and the sgRNA fraction representing non-targeting controls is shown in orange. The most significantly enriched sgRNAs targeting HS enzymes or solute carriers required for HS biosynthesis are captioned. (e) Protein-protein interaction network of top enriched targets in the GNeo-Saporin and the GNeo-Cy5 screens. Line width indicates the confidence level of the interaction. Proteins without direct interactions with other proteins from the list were omitted for clarity. See Supplementary Data Set 5 for full list.
KDM2B inactivation reduces binding of GNeo
KDM2B, a Jumonji (JmjC) domain histone demethylase, is a chromatin remodeling protein with many roles in the regulation of gene expression17. It recruits the polycomb repressor complex 1 (PRC1)18 and demethylates H3K36me219 and H3K4me320 histone marks, leading to altered gene expression. To validate and investigate KDM2B as a potential regulator of HS assembly, we generated a KDM2B mutant cell line in A375 cells (hereafter referred to as KDM2BC5) using CRISPR/Cas9 (Fig. 3a; Extended Data Fig. 2a, Source Data Fig. 3). KDM2BC5 cells showed a >3-fold increase in resistance to GNeo-SAP killing (IC50 = 1.3 nM) compared to A375-Cas9 wild-type cells (IC50 = 0.4 nM) (Fig. 3b). Additionally, KDM2BC5 cells showed a ~2-fold decrease in GNeo-Cy5 binding to HS on the cell surface (Fig. 3c).
Fig. 3. Structural analysis of cell surface heparan sulfate in KDM2B mutant cells.
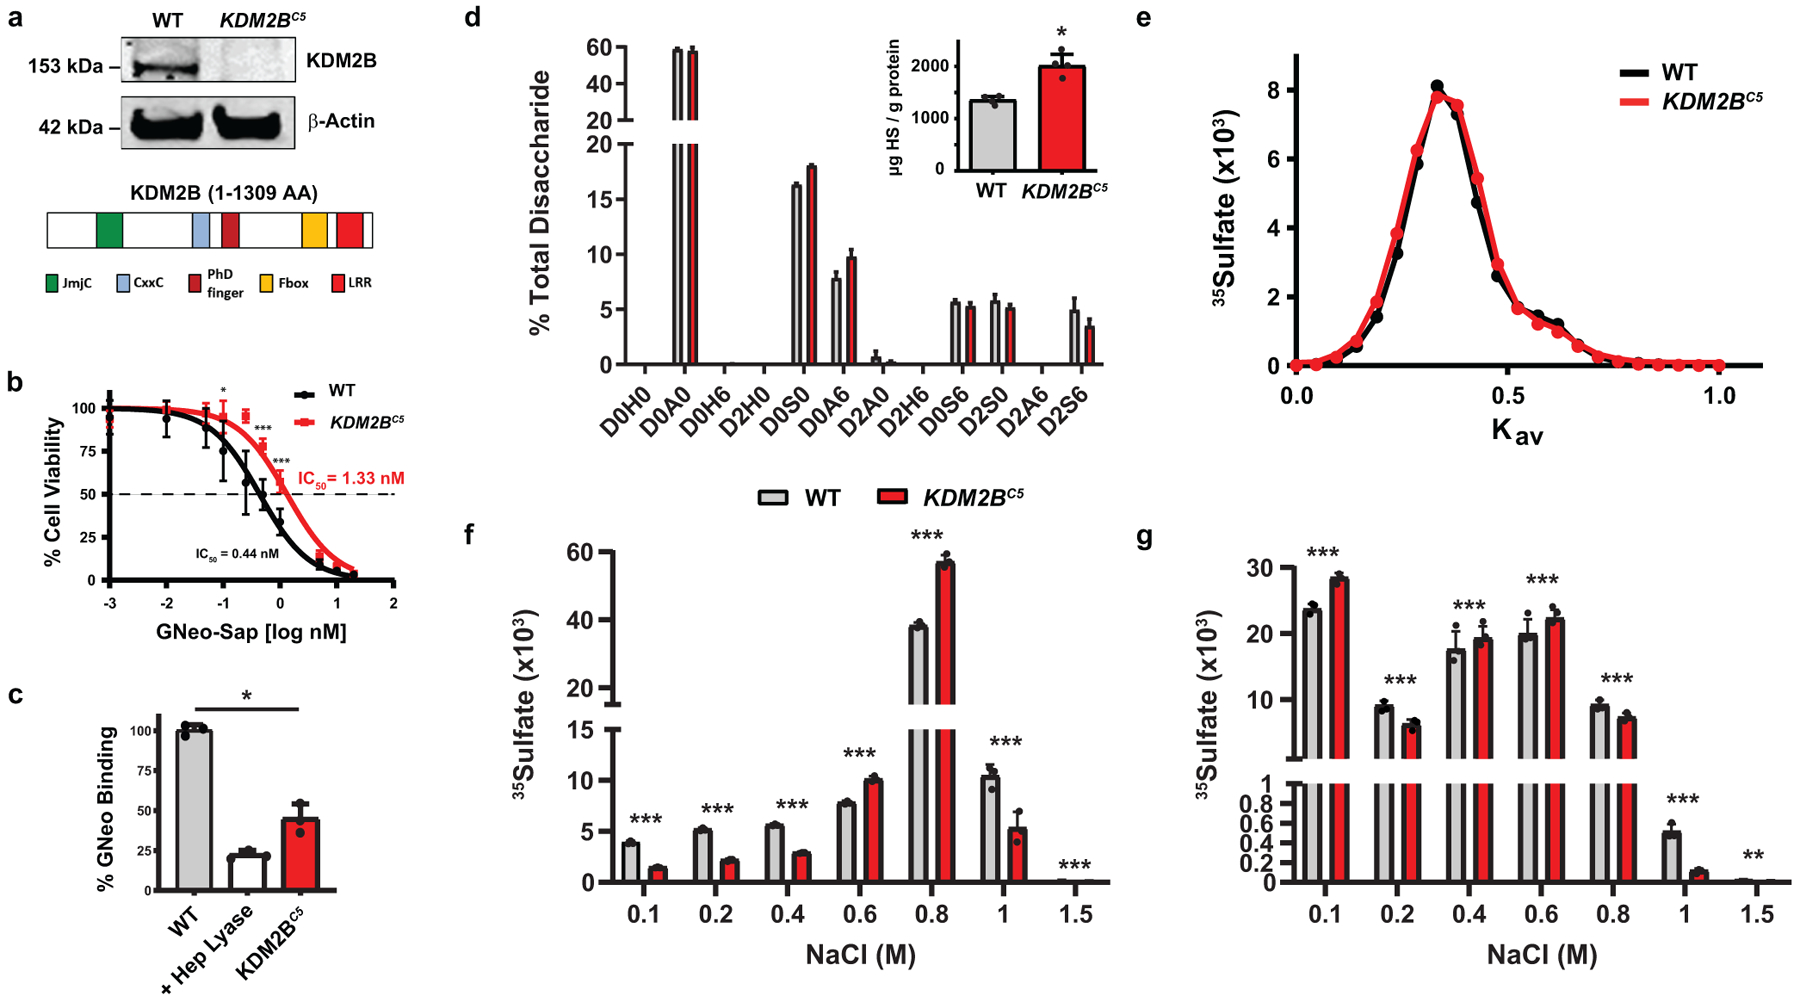
(a) Western blot of CRISPR-mediated inactivation of KDM2B in A375 cells and protein domains of human KDM2B. (b) Cell Titer Blue assay showing increased resistance to GNeo-Saporin (GNeo-SAP) conjugate over a wide concentration range (0–20 nM) (Mann-Whitney test, n=8). (c) Decreased cell surface binding of GNeo-biotin-streptavidin-Cy5 to KDM2BC5 cells compared to wild-type cells. A375 cells pre-treated with heparin lyases (I-III) were used as a positive control (t-test on log10 fluorescence data, n=3). (d) LC-MS quantification of disaccharides from HS in wild-type and KDM2BC5 cells (z-test with absolute quantities in pmol; n=3). The absolute values for the disaccharides and the different classes of disaccharides are shown in Supplementary Table 1. The disaccharide structure code is described in Supplementary Table 1 and49. (inset) LC-MS quantification of total HS in wild-type and KDM2BC5 cells (Mann-Whitney test, n=3). (e) Gel filtration chromatography (Sepharose CL-6B) of [35S]HS from wild-type and KDM2BC5 cells. (f) [35S]HS was fractionated over a GNeo affinity column (0.1–1.5 M NaCl) (Poisson C-test, n=3). (g) [35S]HS was digested with heparin lyase III (10 mU) overnight at 37°C prior to fractionation over a GNeo affinity column (Poisson C-test, n=3).
KDM2B inactivation leads to alterations in HS structure
The reduced binding and uptake of GNeo conjugates to cells suggested that KDM2B might alter the amount or structure of HS. To determine this possibility, we isolated cell surface HS from wild-type and KDM2BC5 cells by trypsin-digestion and anion-exchange chromatography. The samples were subsequently depolymerized into disaccharides using mixed heparin lyases. The depolymerization products were then aniline-tagged by reductive amination and analyzed by ion-pairing reverse-phase chromatography and quantitative high-resolution mass spectrometry with mass standards. Analysis of the various disaccharides did not reveal significant change in disaccharide composition, although there was a trend in reduction of the trisulfated disaccharide D2S6 (Fig. 3d; Supplementary Table 1). The overall degree of sulfation also did not differ between mutant and wild type (Supplementary Table 2), and contrary to expectations based on GNeo binding, the overall amount of cell surface HS increased somewhat in KDM2BC5 cells (Fig. 3d, inset).
To examine HS structure in greater detail, wild-type and KDM2BC5 cells were radiolabeled with 35SO4 for 24 hours at 37°C, and the [35S]HS was purified by anion exchange chromatography. Size exclusion chromatography of [35S]HS from wild-type and KDM2BC5 cells showed no significant difference in overall molecular mass, with an average value of ~36 kDa (Fig. 3e). Fractionation of [35S]HS from wild-type or KMD2BC5 cells over a GNeo-Sepharose affinity column (Methods) using step-wise elution with buffers containing 0.1–1.5 M NaCl showed that KDM2BC5 HS exhibited an altered profile, with a significant decrease in binding at the highest (1–1.5 M) and lowest (0.1–0.4 M) salt concentrations compared to wild-type HS (Fig. 3f). [35S]HS was also treated with heparin lyase III, which cleaves the chains in regions devoid of sulfation and IdoA. Fractionation of the liberated sulfated domains over the GNeo-affinity column revealed a significant increase in recovery of [35S]HS fragments from KDM2BC5 cells in the flow through fraction (0.1 M) and a significant decrease of domains that required high salt to elute (0.8–1 M) (Fig. 3g). These findings indicate that inactivation of KDM2B results in changes in the overall domain structure of HS.
KDM2B regulates growth factor binding to heparan sulfate
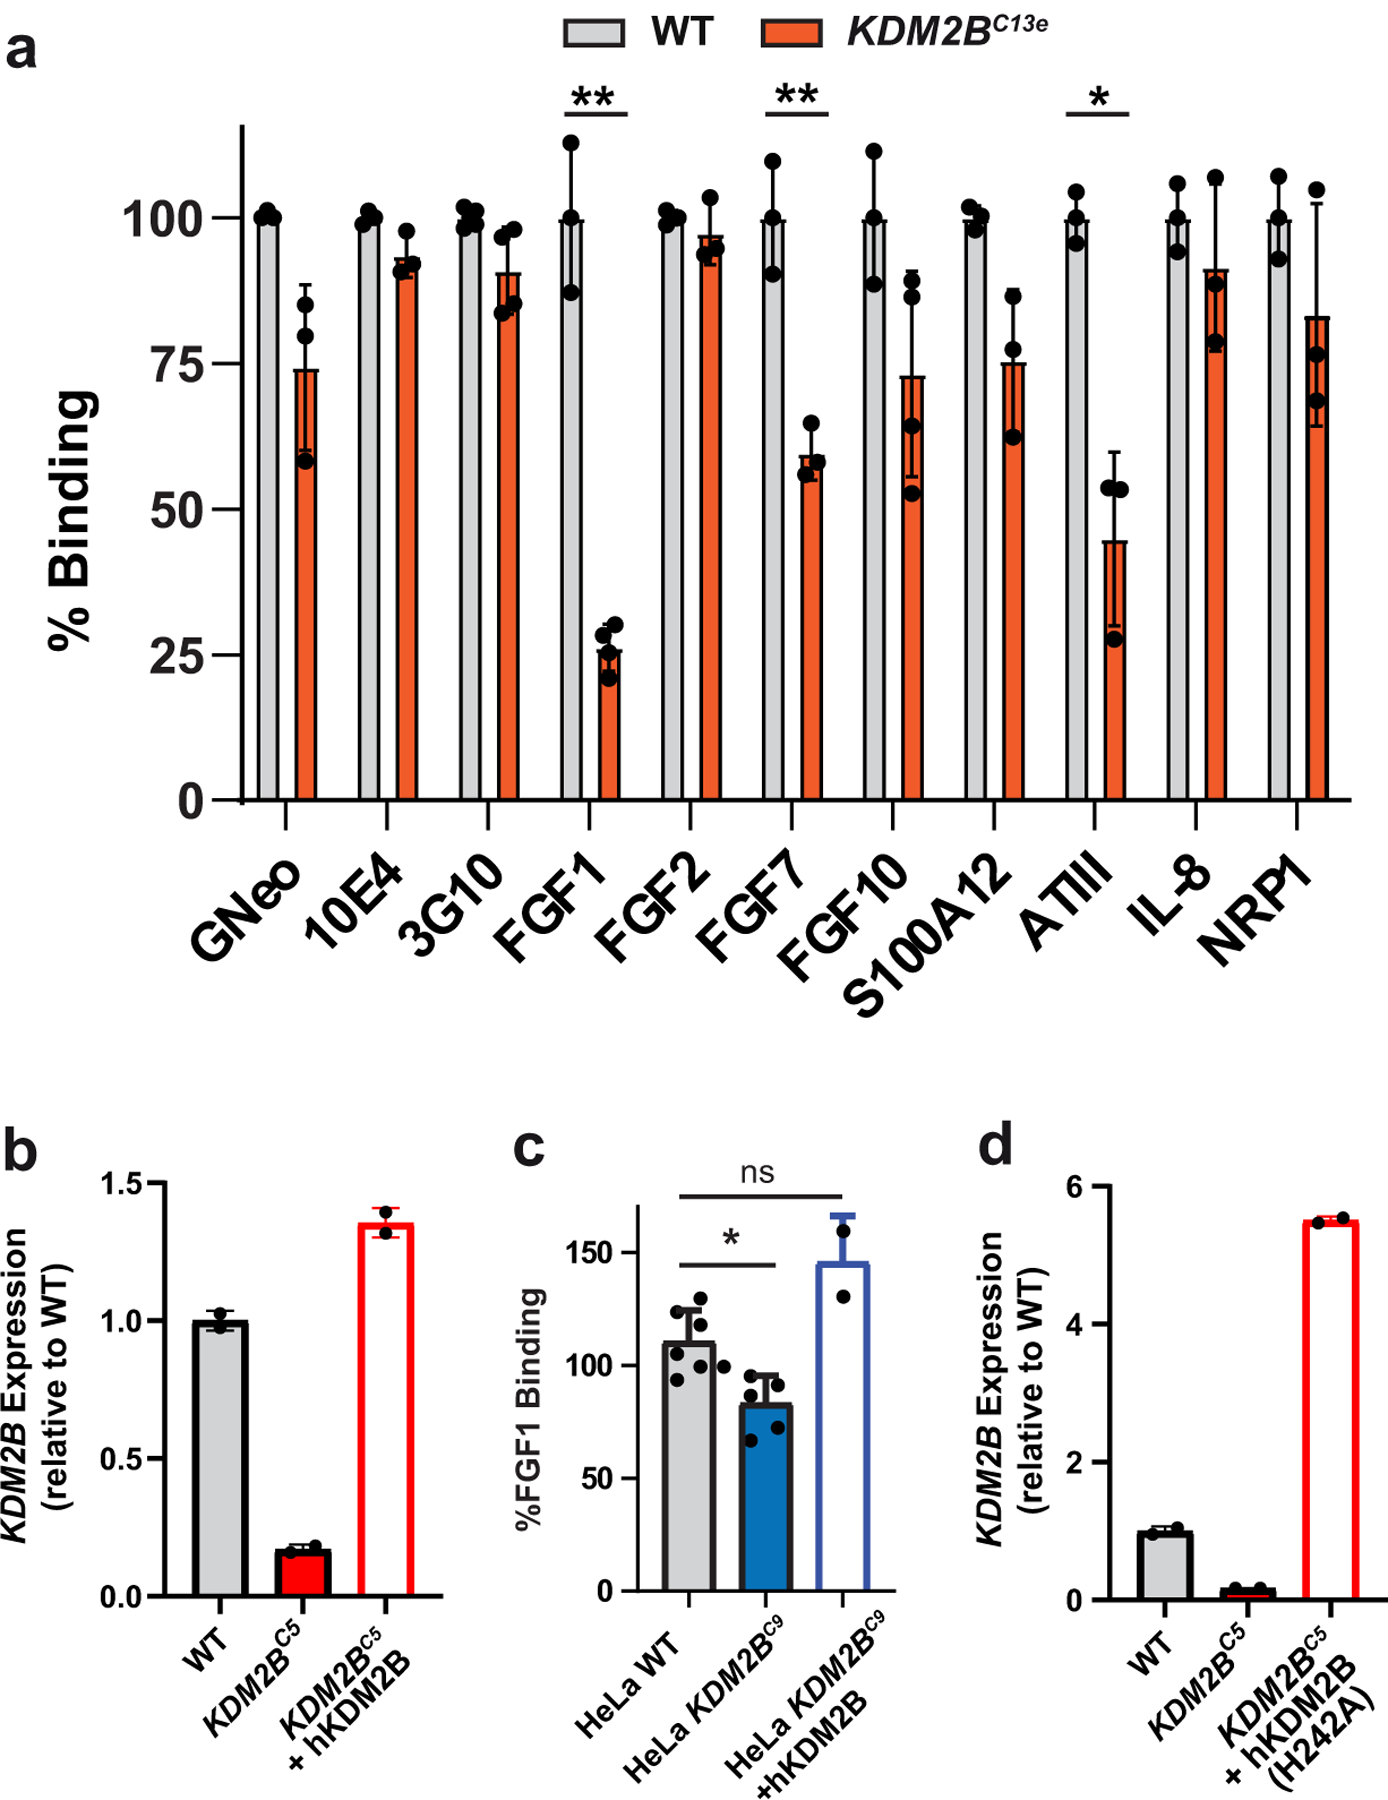
To investigate whether the structural changes in HS derived from KDM2BC5 cells could affect HS-protein interactions, we quantified binding of a library of known HS-interacting ligands to wild-type and KDM2BC5 cells using flow cytometry. Dramatically altered binding of a subset of proteins was noted. For example, binding of human fibroblast growth factor 1 (FGF1), FGF7, FGF10, S100 calcium-binding protein A12 (S100A12)21, and antithrombin was reduced to differing extents, whereas binding of FGF2, interleukin-8 (IL-8) and neuropilin-1 (NRP1) did not exhibit any differences in binding to the wild type and mutant (Fig. 4a). No difference was detected in binding of an antibody recognizing N-sulfated regions of HS (10E4), consistent with the lack of any change in N-sulfated disaccharides (Fig. 4a). Binding of an antibody that detects an HS neoepitope generated by heparin lyase digestion (3G10) was unaltered (Fig. 4a), indicating no change in the number of HS chains expressed on the cell surface. To corroborate these findings, we identified a second clone, bearing different mutant alleles, which gave a similar binding profile (Extended Data Fig. 2a; Extended Data Fig. 3a).
Fig. 4. Binding of growth factors and other heparan sulfate binding proteins to KDM2B mutant cells.
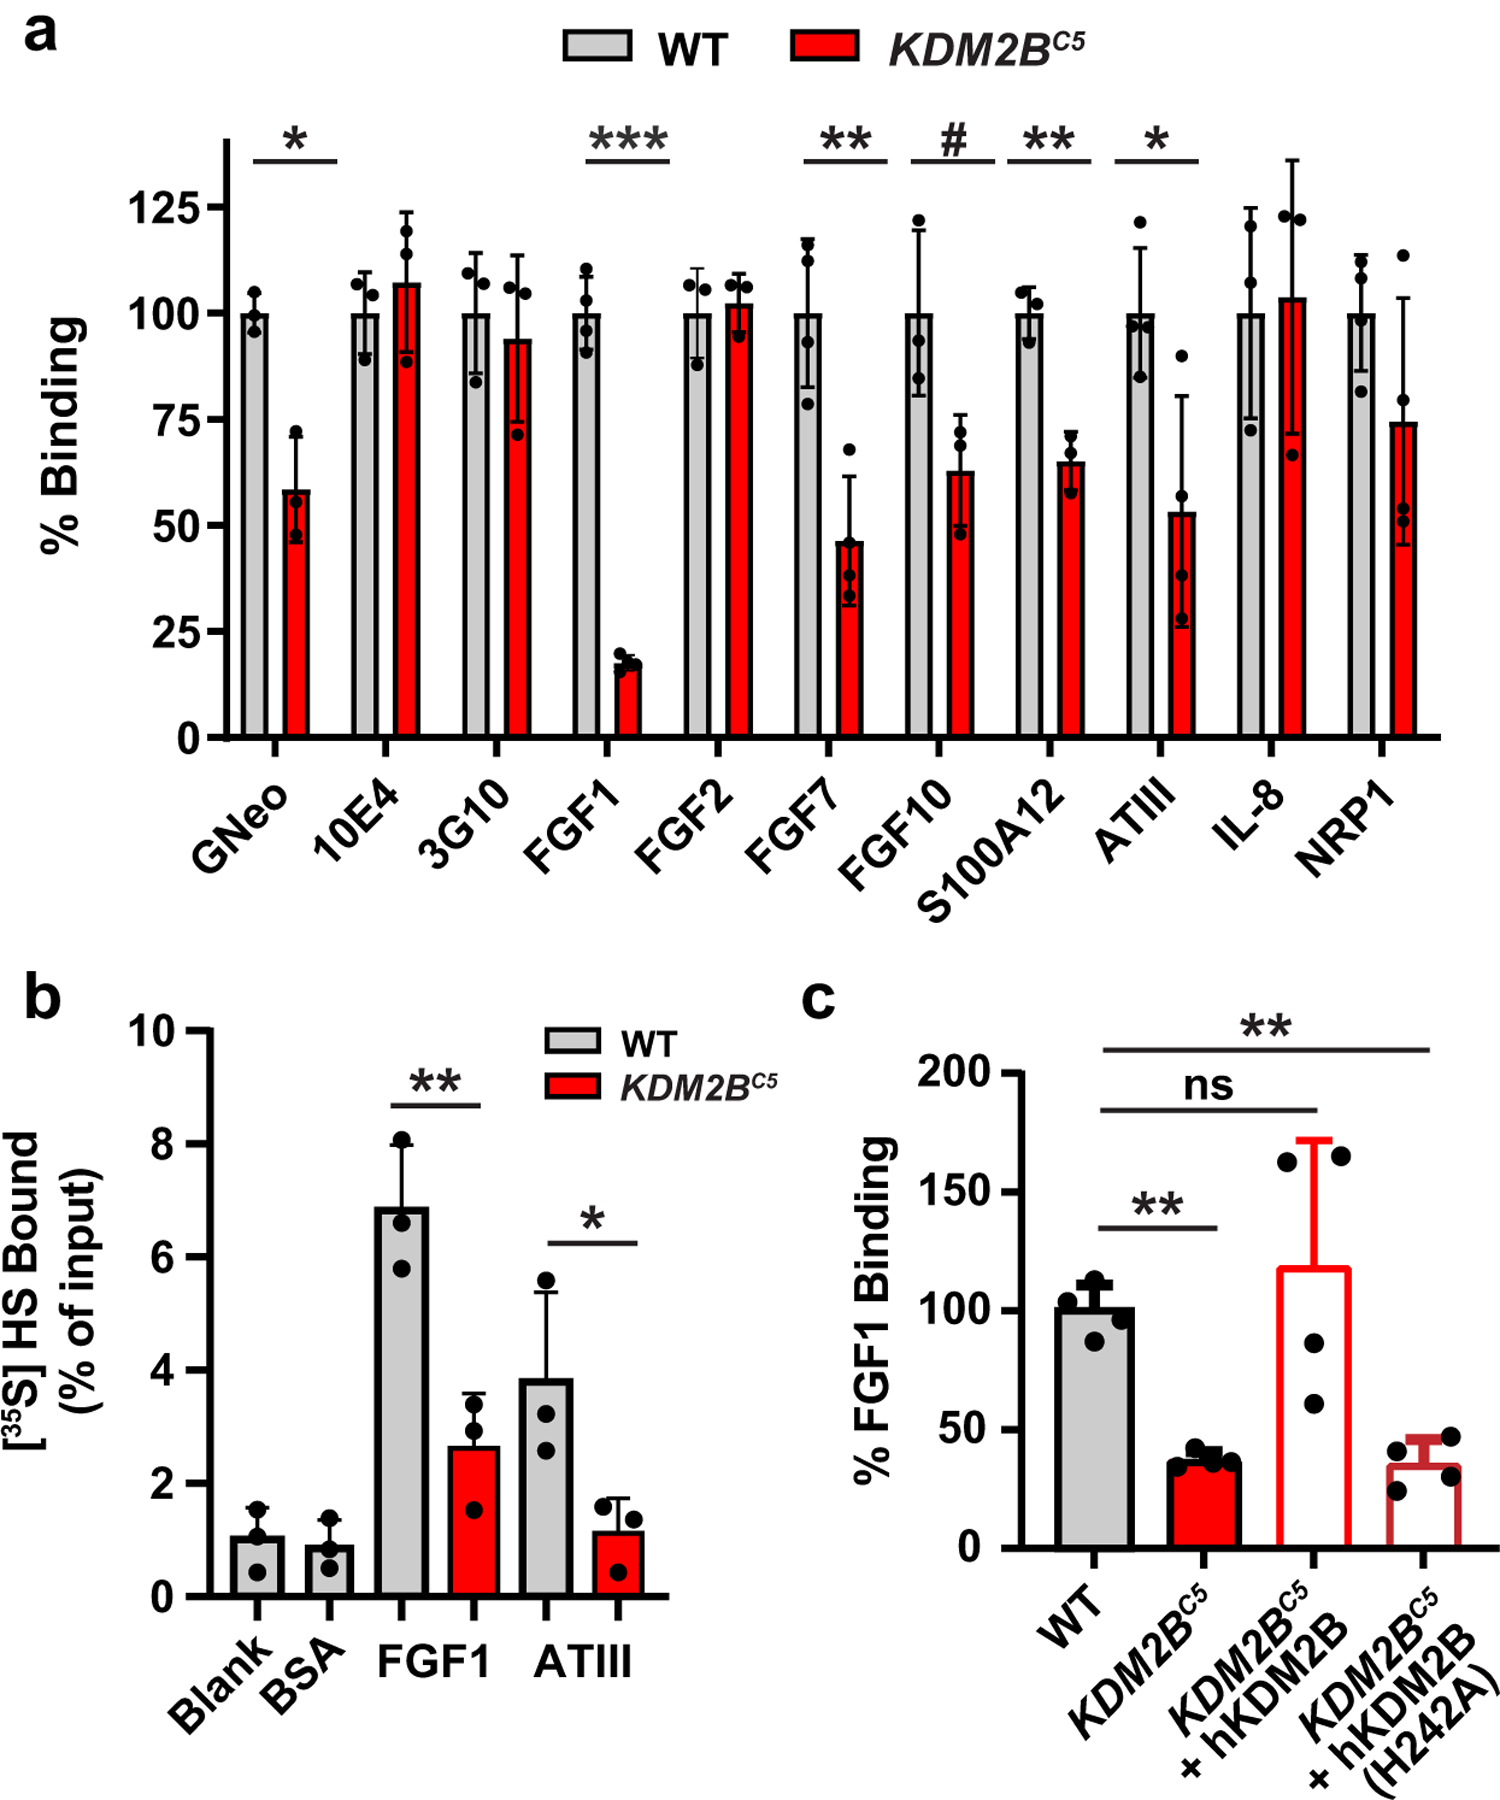
(a) KDM2BC5 cells show a significant decrease in binding of a subset of protein ligands (t-test on log10 fluorescence data, n=3). (b) Filter binding assays show decreased binding of FGF1 and antithrombin (ATIII) to [35S]HS from KDM2BC5 cells (t-test, n=3). (c) Re-introduction of wild-type KDM2B cDNA, but not a KDM2B catalytic mutant (H242A), restored binding of FGF1 in A375 (t-test on log10 fluorescence data, n=4).
To investigate more directly the interaction of HS with FGF1 and antithrombin, we mixed [35S]HS from KDM2BC5 mutant and wild-type cells with these proteins and rapidly filtered the mixture through a nitrocellulose membrane. Unbound [35S]HS flows through the filter, whereas [35S]HS bound to FGF1 or antithrombin is trapped. Quantitation of bound [35S]HS showed that material derived from the mutant bound to a lesser extent (Fig. 4b).
Finally, to rule out off-target effects of gene targeting in KDM2BC5 cells, we transfected full-length human KDM2B cDNA back into the mutant clone and showed restoration of cell surface binding of FGF1 (Fig. 4c; Extended Data Fig. 3b). Similarly, CRISPR-mediated inactivation of KDM2B in HeLa cells showed a significant decrease in FGF1 binding and restoration of binding upon transduction of full length human KDM2B (Extended Data Fig. 2b; Extended Data Fig. 3c). We generated a mutant construct with the demethylase domain inactivated (H242A) and transfected A375 KDM2BC5 cells. The mutant cDNA was expressed (Extended Data Fig. 3d) but did not rescue FGF1 binding (Fig. 4c). In summary, KDM2B plays an important role in controlling the binding affinities of HS-dependent ligands, which is likely conserved across human cell lines.
KDM2B controls heparan sulfate enzyme expression
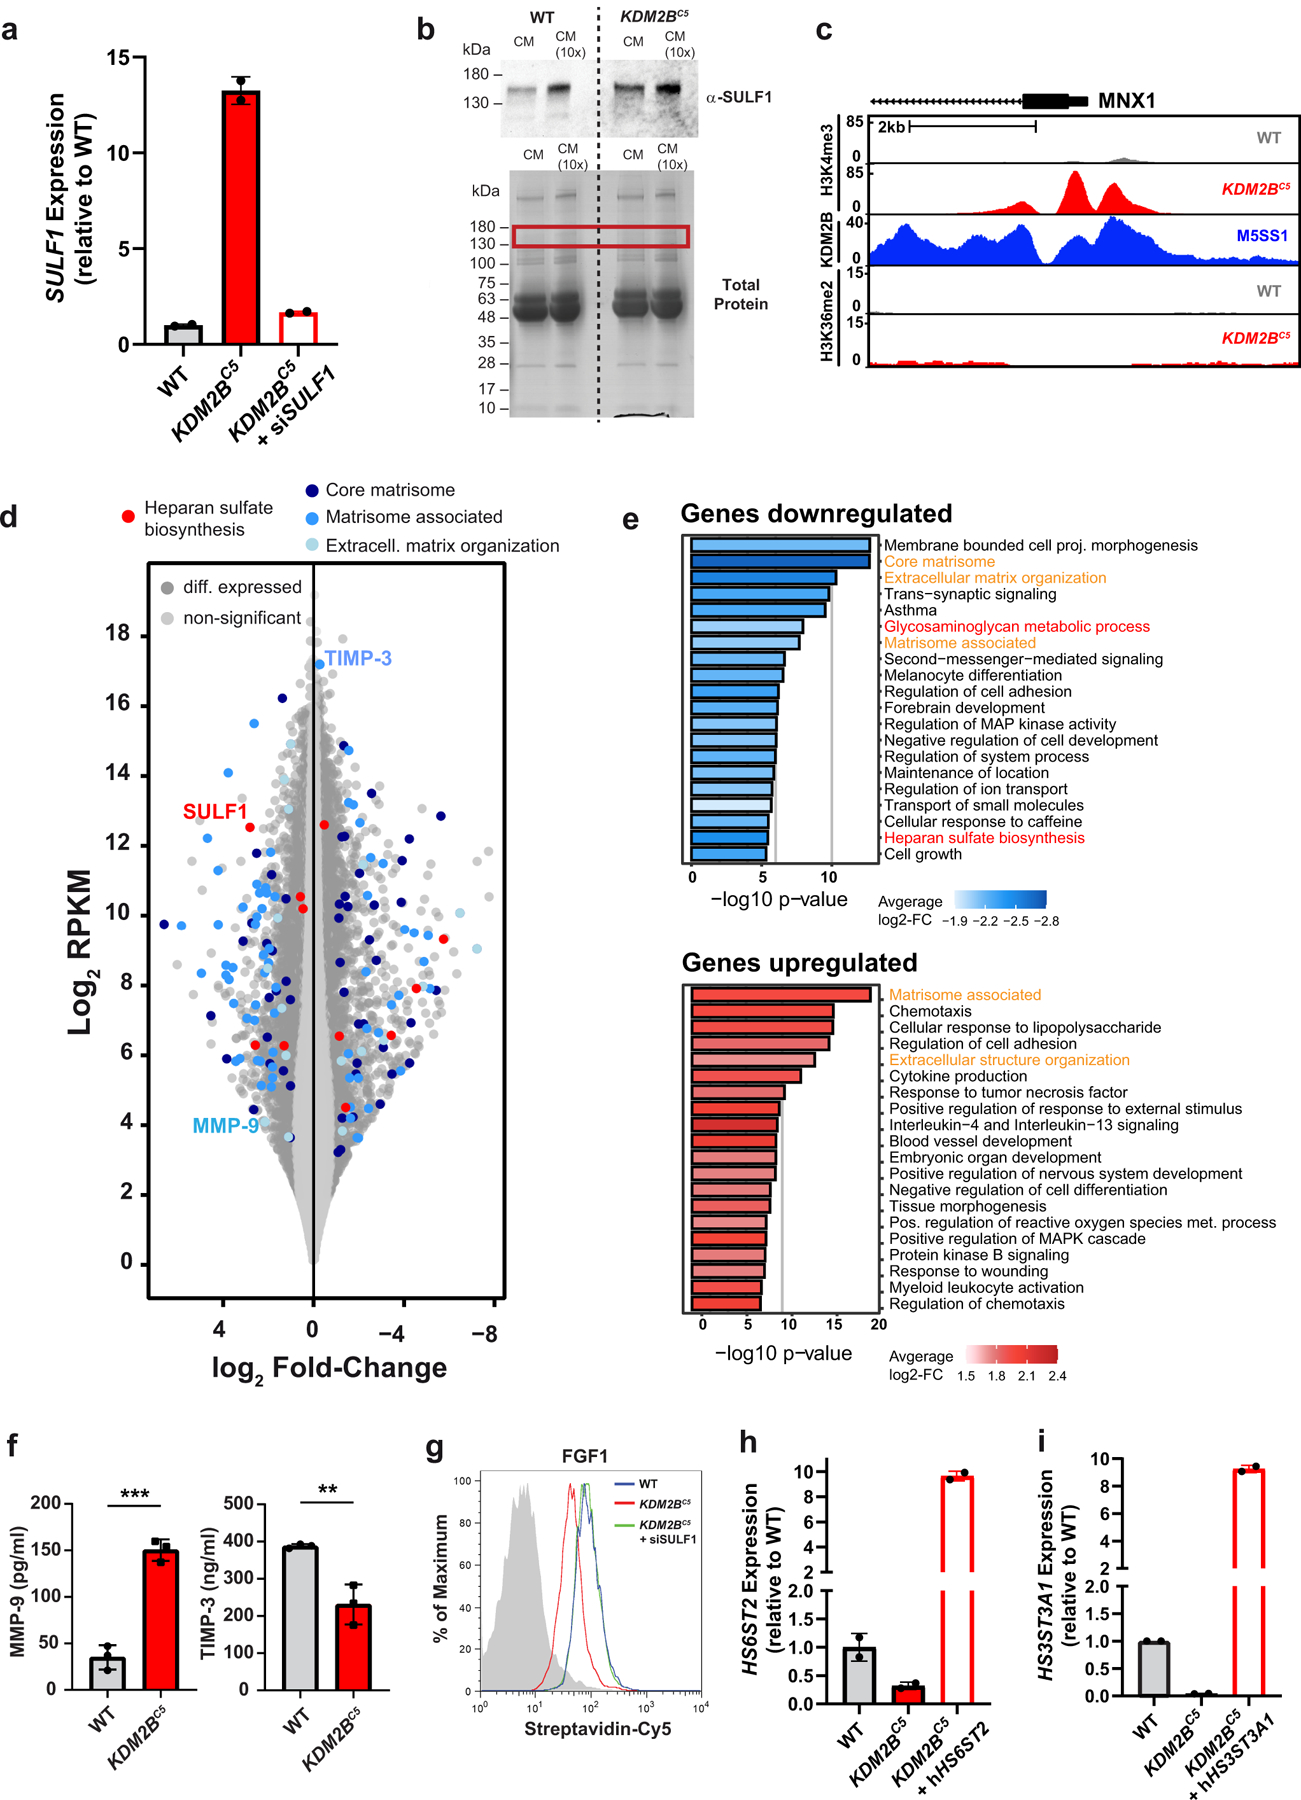
Considering the significant changes in HS-protein binding and alteration in HS structure, the expression level of the various enzymes was analyzed by RNA-Seq. While two HS 6-O-sulfotransferases showed an increase in expression (HS6ST1, HS6ST3), four sulfotransferases showed reduced expression upon depletion of KDM2B (HS3ST1, HS3ST3A1, HS3ST3B1, HS6ST2). Additionally, the expression of both HS sulfatases SULF1 and SULF2 was increased (Fig. 5a). Thus, most transcriptional changes among HS enzymes pointed to a potential decrease in 3-O- and 6-O-sulfation levels in KDM2BC5 cells. SULF1 expression, in particular, was dramatically elevated both at the mRNA and protein level (Extended Data Fig. 4a–b, Source Extended Data Fig. 4).
Fig. 5. Transcriptome and ChIP Analysis of KDM2B mutant cells.
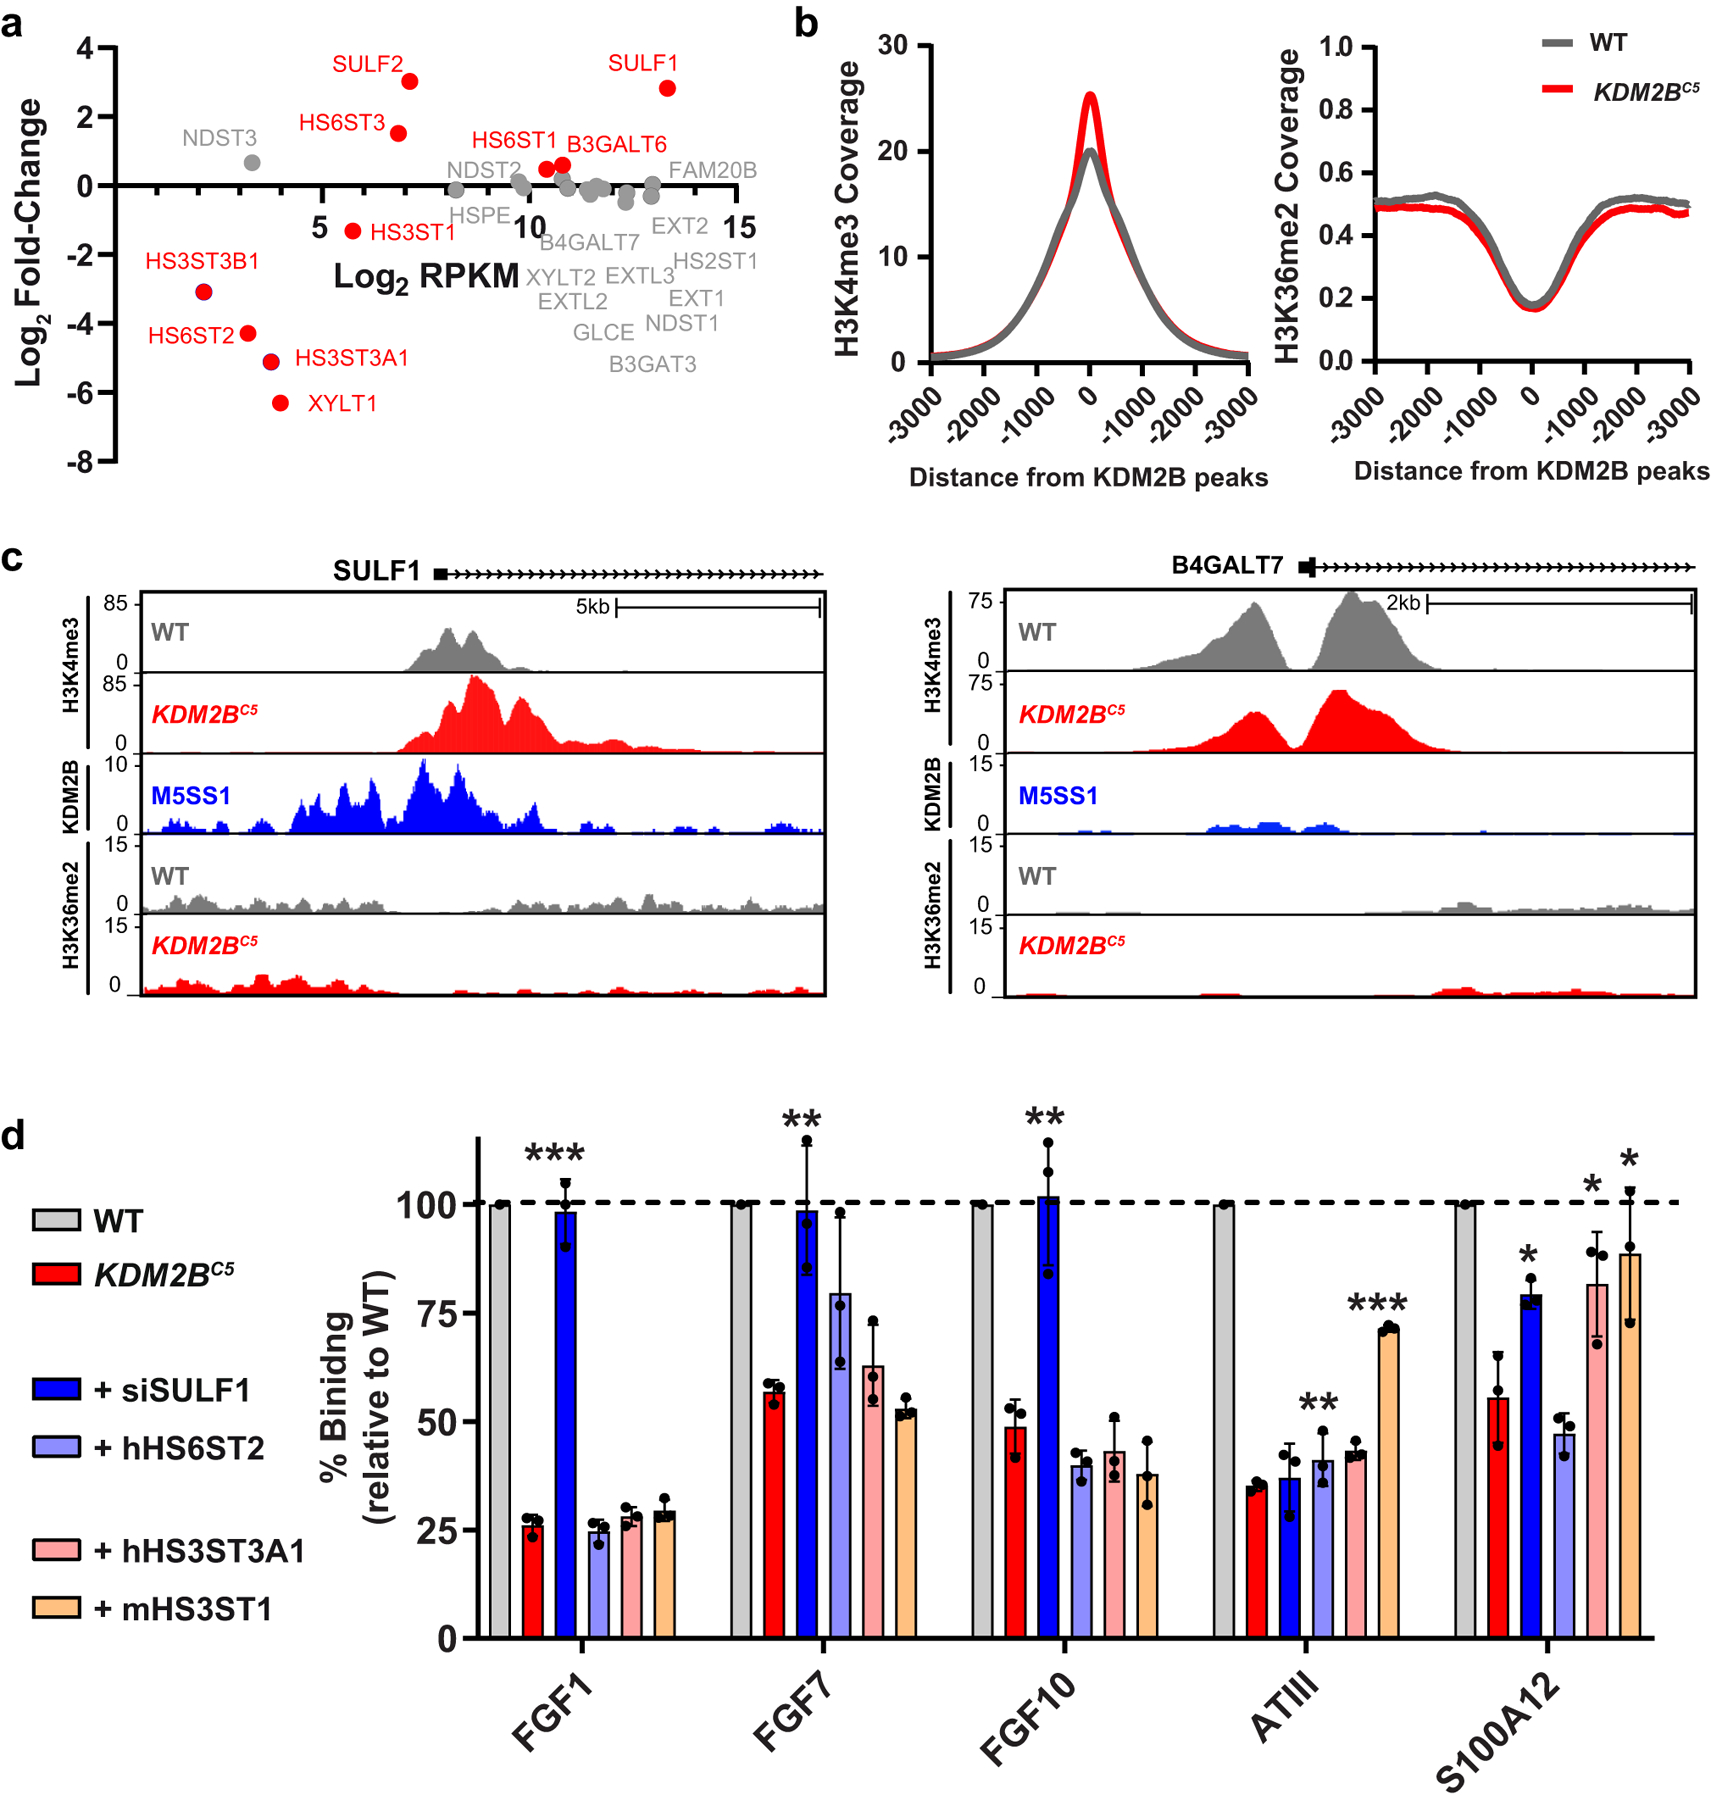
(a) mRNA expression of HS biosynthetic enzymes and HS modifying enzymes from RNA-seq (differentially expressed genes shown in red). RPKM is “Reads Per Kilobase of transcript per Million mapped reads”. (b) H3K4me3 and H3K36me2 ChIP-Seq signals normalized by input sample in WT and KDM2BC5 cells at KDM2B-occupied genomic regions (GSE108929). (c) Gene track for H3K4me3, KDM2B, and H3K36me2 ChIP-Seq at the SULF1 and B4GALT7 loci. (d) Ligand binding of KDM2BC5 cells transfected with indicated expression plasmids (hHS6ST2/hHS3ST3A1/mHS3ST1) or an siRNA targeting SULF1 relative to mock-transfected wild-type cells (t-test, n=3).
To explore if KDM2B regulates the methylation of these genes, we performed ChIP- Seq on mutant and wild-type cells using antibodies to two known KDM2B histone methylation targets, H3K4me3 and H3K36me219,20. The level of overall H3K4me3 was increased at KDM2B occupied sites in the mutant; however, the level of H3K36me2 was not affected by loss of KDM2B (Fig. 5b). Additionally, we found that H3K4me3 methylation at the promoter of MXN1, a known target of KDM2B22, was significantly elevated in KDM2BC5 cells compared to wild type (Extended Data Fig. 4c). Interestingly, ChIP-Seq for H3K4me3 showed an increase in methylation extending from the promoter in SULF1 into the gene body, but not in the B4GALT7 gene (Fig. 5c). ChIP-Seq analysis of H3K36me2 did not reveal alterations in methylation in the SULF1 gene. These findings indicate that KDM2B normally represses SULF1 expression through the removal of activating H3K4me3 methylation marks.
In addition to transcript level changes of HS biosynthesis enzymes, we found differential expression of several additional gene groups in the transcriptome of KDM2B mutant cells. Gene set enrichment analysis identified ontology classes related to the extracellular matrix (ontology classes Core Matrisome, Matrisome-associated, Extracellular Matrix Organization) (Extended Data Fig. 4d–e, Supplementary Data Set 8). For example, we detected elevated protein levels of MMP-9, a secreted metalloproteinase that degrades multiple extracellular matrix components, as well as decreased levels of TIMP-3, a matrix metalloprotease inhibitor in the growth medium of KDM2BC5 cells (Extended Data Fig. 4f). These results indicate that, beyond its novel role as a transcriptional regulator of HS assembly, KDM2B may represent a principal factor controlling many components of the extracellular matrix.
Rescue of SULF1 restores ligand binding in KDM2BC5 cells
To investigate whether transcriptional changes in these HS biosynthetic genes were responsible for the differential changes in binding of multiple proteins to cell surface HS, we examined if targeted rescue experiments in KDM2BC5 cells restored binding of FGF1, FGF7, FGF10, S100A12, and antithrombin. We focused specifically on SULF1 and HS6ST2, due to previous reports that FGF1, FGF7, and FGF10 binding to HS requires 6-O sulfation23–25, and on HS3ST1 and HS3ST3A1 because antithrombin has been shown to bind 3-O-sulfated sequences of HS26. SULF1 is an endo-6-O-sulfatase that modulates HS-protein interactions in the extracellular space by removing a subset of 6-O-sulfate groups from HS27, and HS6ST2 is a member of a family of sulfotransferases that catalyze 6-O-sulfation of N-acetylated and N-sulfoglucosamine residues of HS28. HS3ST1 and HS3ST3A1 are two of seven isozymes that catalyze 3-O-sulfation of glucosamine residues of HS and create binding sites for antithrombin and a small subset of proteins29. Indeed, siRNA knockdown of SULF1 in KDM2BC5 cells restored binding of FGF1, FGF7 and FGF10 (Fig. 5d; Extended Data Fig. 4a,g), corroborating that KDM2B affects binding of these ligands through its regulation of 6-O-sulfation of HS. Overexpression of HS6ST2, however, did not rescue binding of any ligands (Fig. 5d; Extended Data Fig. 4h), likely because elevated expression levels of SULF1 in KDM2BC5 cells antagonize its sulfotransferase action, prohibiting a net increase in 6-O sulfation of HS at the cell surface. Interestingly, HS3ST3A1 and HS3ST1 overexpression rescued S100A12 binding, a calcium binding protein that binds strongly to highly sulfated HS chains21. Additionally, antithrombin binding in KDM2BC5 cells was also rescued by overexpression of 3-O-sulfotransferases (Fig. 5d; Extended Data Fig. 4i), in accordance with its requirement for specific 3-O-sulfated binding sequences26.
KDM2B inactivation impedes SULF1-dependent growth
HS plays a key role as a co-receptor for several growth factors that activate mitogenic signaling pathways, including members of the FGF signaling pathway that exhibit altered binding in the KDM2B mutant cells (Fig. 4a). To test if altered HS fine structure might impair cellular proliferation, we examined the growth properties of KDM2BC5 cells. In monolayer culture, KDM2BC5 cells divided more slowly than wild-type cells in growth medium with 10% fetal bovine serum, with a doubling time of 30 hrs vs. 18 hrs, respectively (Fig. 6a). Under starvation condition (2% fetal bovine serum) KDM2BC5 cells essentially ceased to grow, whereas wild-type A375 cells continued to divide, albeit with a reduced doubling time (~27 hr) (Fig. 6a). Guided by the observation that silencing of SULF1 restored the binding of several growth factors in KDM2BC5 cells (Fig. 5d), we inactivated SULF1 in KDM2BC5 cells through CRISPR/Cas9-mediated gene targeting (Extended Data Fig. 5a). Interestingly, inactivation of SULF1 restored growth in 2% serum and enhanced growth under standard conditions (doubling time 21.8 hr) (Fig. 6a). We also saw reduced colony formation both in monolayer culture (Extended Data Fig. 5b) and in anchorage-independent growth of KDM2BC5 cells in soft agar (Fig. 6b). In concordance with the observed restoration of growth rates, inactivation of SULF1 in KDM2BC5 cells increased colony number and colony size (Fig. 6b). These findings indicate that KDM2B regulates proliferation of A375 cells and that this regulation is partially mediated through repression of SULF1. In conclusion, we identified KDM2B as a novel transcriptional regulator of HS assembly and showed that KDM2B constitutes a critical genetic component to maintain proliferation of melanoma cells by controlling HS fine structure.
Fig. 6. KDM2B inactivation results in a SULF1-dependent decrease in cell growth.
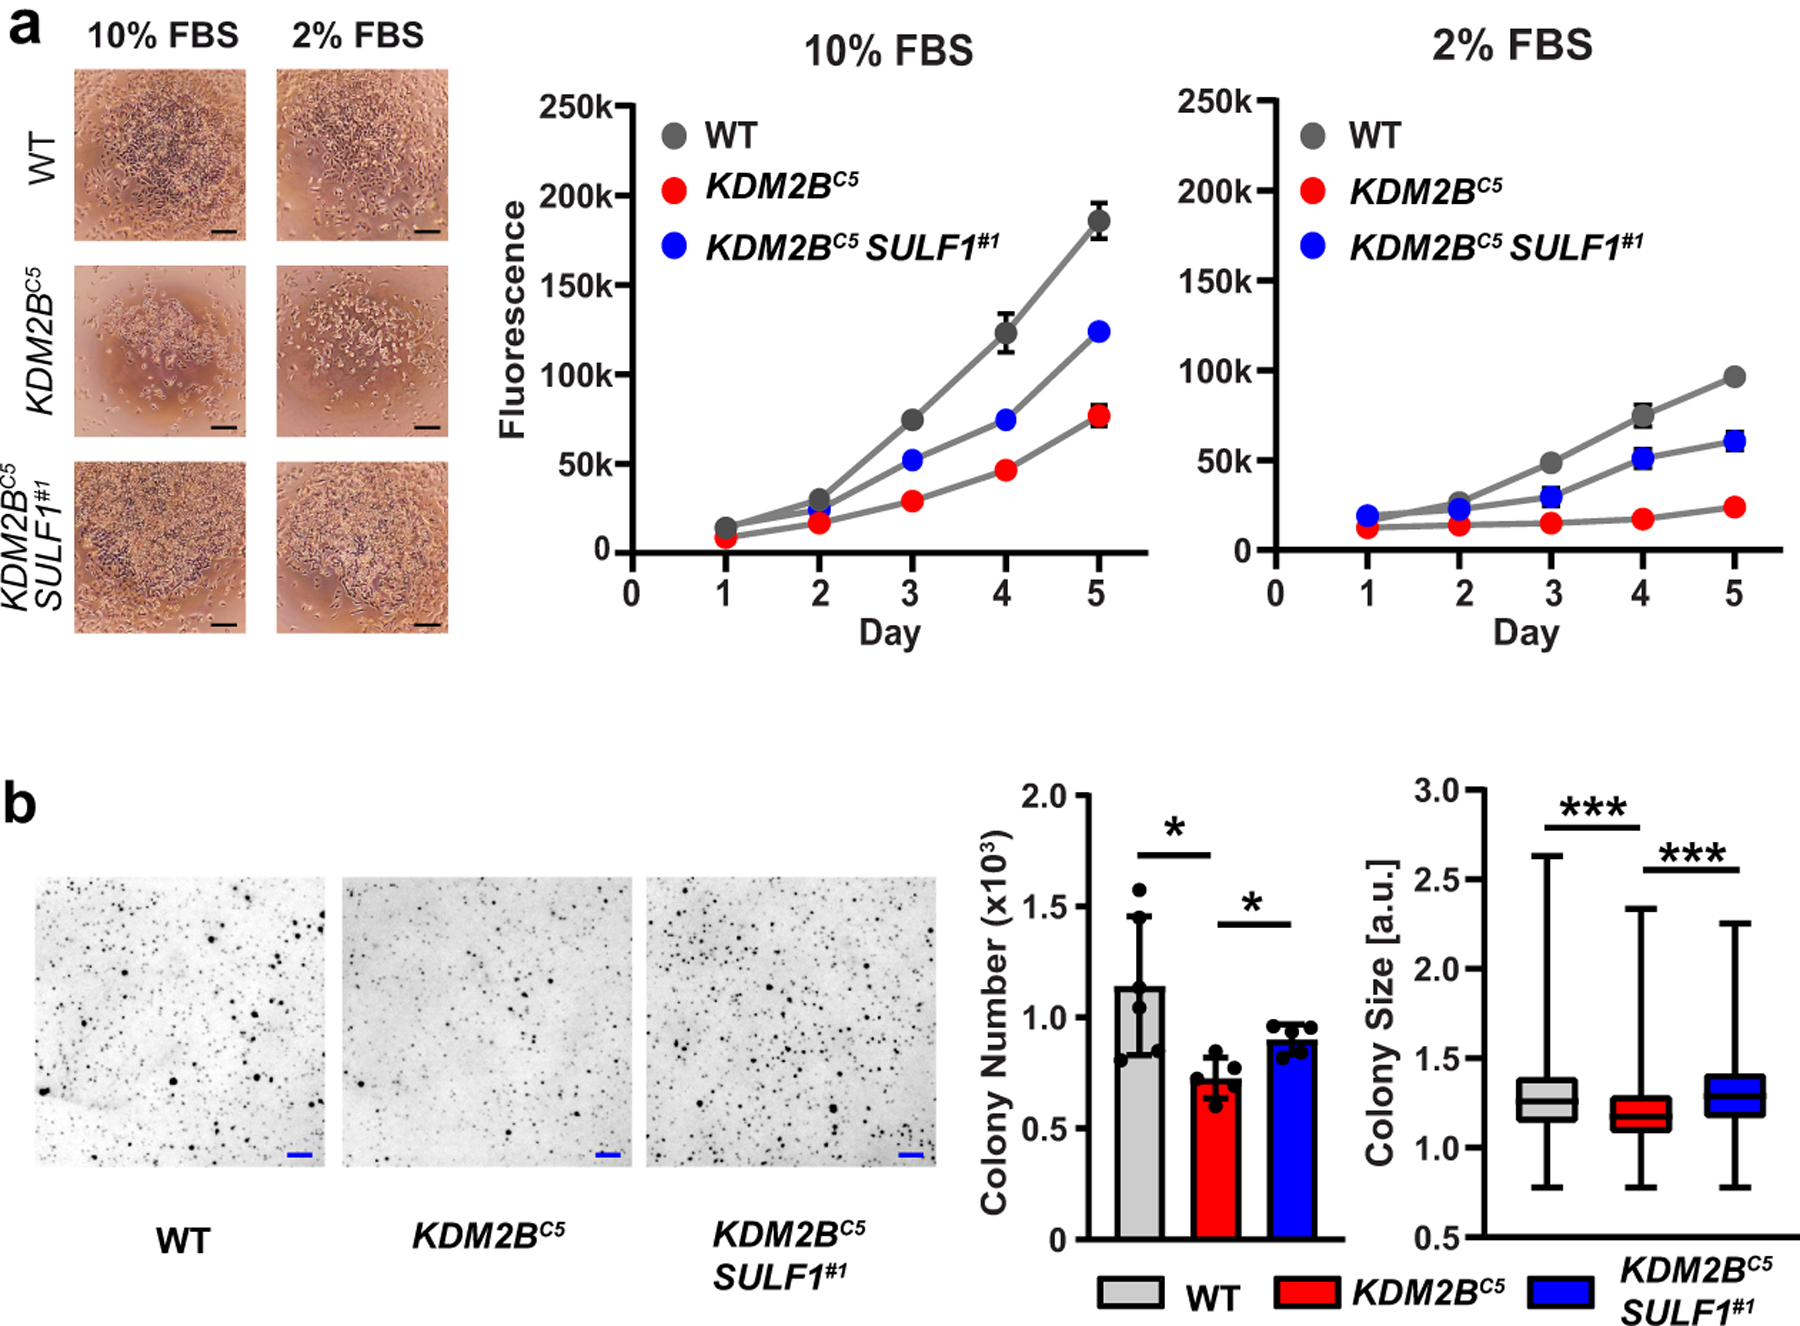
(a) Viable cell density was monitored by Cell Titer Blue over five days under normal (10% FBS) and low serum (2% FBS) conditions (p<0.001. Two-way ANOVA; n=3). Images taken 48h after seeding. Scale bar = 100 μm. (b) Anchorage-independent growth was analyzed by soft agar assays. Colony number and size were measured after 11 days incubation (colony number: t-test, n=5; colony size: t-test on pooled dataset, n=3,000). Scale bar = 1 mm.
DISCUSSION
CRISPR/Cas9 screens have become an invaluable discovery tool to unravel metabolic and signaling pathways. Most screens involve direct selection of mutants resistant to a toxin30 or viral infection31, or through enrichment by cell sorting32. An innovative feature of this study is the application of two orthogonal screens to identify factors involved in HS composition: flow cytometry with GNeo-Cy5 as a ligand and resistance to GNeo-SAP. Prior studies have shown that GNeo binds selectively to HS on the cell surface9 and thus each screen was expected to enrich for mutations in genes that affected the presentation and composition of HS on the cell surface. Both screens recovered unique mutations as well as shared mutations. Thus both screening methods likely select for mutants in screen-specific pathways (e.g. mutants conferring metabolic resistance to saporin), but also shared pathways (e.g. HS biosynthesis), which we enriched for by matching the targets obtained from the two screens. To date, very little is known about genetic regulation of the enzymes responsible for biosynthesis of HS6. The dual screening method recovered expected hits, such as HS biosynthetic enzymes (NDST1, EXTL3), but also several unexpected pathways indicating that the presence of HS on the cell surface depends on the regulation of other cellular processes (e.g. signaling and chromatin remodeling). Importantly, our gene ranking method is restrictive in that it grants higher scores to genes for which more sgRNAs were enriched. This can lead to genes receiving lower scores if they had only one or two sgRNAs enriched due to imperfect targeting by the CRISPR library, which could explain why we did not recover all HS biosynthetic enzymes in the top tier of the target list.
The discovery of KDM2B as a regulator of HS assembly is novel. KDM2B binds DNA through a zinc-finger domain and executes its gene-regulatory function in two ways: it can act as a JmjC-demethylase, targeting H3 methyl groups, and it can act as a recruiter of the polycomb repressive complex 1 (PRC1) to non-methylated CpG islands in promoter regions18. Both processes typically lead to gene silencing16, although JmjC-domain containing demethylases also target inactivating methylation marks leading to gene activation33. The inability of a transfected catalytic mutant (H242A) to rescue FGF1 binding in KDM2BC5 cells and the increase in H3K4me3 methylation at the SULF1 promoter suggest that KDM2B regulates HS biosynthesis through its demethylase activity. Interestingly, RNF2, another key component of PRC1, was highly enriched in both screens (Supplementary Data Set 5), strongly suggesting that the HS biosynthetic genes could be regulated through the PRC1.
The formation of binding sites in HS depends on the activity of multiple enzymes that determine the arrangement of sulfate groups and iduronic acid residues along the chain. KDM2B modulates the expression of several of these enzymes. A common feature of some growth factors whose binding was altered (FGF1, FGF7, FGF10) is a requirement for 6-O-sulfate groups on specific glucosamine residues in HS. Interestingly, bottom-up compositional studies did not reveal an overall change in composition, most likely because SULF1 removes a minor, but critical subset of 6-O-sulfate groups. Previous studies have shown that SULF1 causes differential impact on the extent of 6-O-sulfation depending on the tissue34,35. Other methods are needed to examine the domain structure and sequence36–38.
Loss of function of KDM2B has been noted in other cell lines and correlated with reduced cell growth and viability in glioma cells39, triple negative breast cancer cells40, and others40. The cause of reduced cell growth has been attributed to alterations in the cell cycle41, ribosome biogenesis42, expression of other epigenetic factors43, autophagy44, and growth factor signaling45. Our findings indicate that in melanoma cells, the regulation of cell growth by KDM2B is at least partially mediated by its regulation of HS structure. Our transcriptomic analysis also indicates that additional effects on growth could be mediated by changes in extracellular matrix composition. Other phenotypes ascribed to KDM2B based on inactivation of the gene in mice, such as stem cell proliferation and lineage commitment, should be reevaluated in light that they be related to changes in HS proteoglycan or extracellular matrix composition46,47.
Intriguingly, KDM2B regulates not only HS biosynthesis but also a significant number of genes encoding components of the ECM or ECM remodeling, including two key regulators of ECM turnover, MMP-9 and TIMP-3. In accordance with these findings, a recent study reported that KDM2B inhibition results in increased expression of several extracellular matrix proteins in synovial sarcoma cells22. Interestingly, several genes in the matrisome have been previously recognized as PRC1 targets48. We cannot exclude the possibility that some of the changes in expression of matrisome proteins could be indirectly linked to KDM2B through changes in HS. Nevertheless, our observations suggest that the genes involved in determining the fine structure of HS are part of a larger genetic network that determines the composition and architecture of the ECM, and that changes in ECM composition may underlie the alterations in cell division caused by KDM2B inactivation.
ONLINE METHODS
Cell culture
HEK293T cells (ATCC® CRL-3216™) and A375 cells (ATCC® CRL-1619™) were grown in Dulbecco’s Modified Eagles Medium (DMEM, Gibco) supplemented with 10% (v/v) fetal bovine serum (FBS, Gibco) and 1% (v/v) penicillin/streptomycin (Gibco) at 37°C under an atmosphere of 5% CO2/95% air. HeLa cells (ATCC® CCL-2™) were grown in Minimal Essential Medium (MEM) supplemented with 10% (v/v) fetal bovine serum (FBS, Gibco) and 1% (v/v) penicillin/streptomycin (Gibco). Cells were passaged every 3–4 days and revived from liquid nitrogen after ≤10 passages. All transfected cell lines were cloned and stored under liquid nitrogen.
Lentivirus library generation
The pooled human GeCKO v2 plasmid collection (sub-libraries A+B) was obtained from Addgene (#1000000049), transferred into Lucigen Endura E. coli cells (cat # 60242) using electroporation (Electroporator 2510, Eppendorf), and amplified using maxi plasmid preparation (Zymo Research). Deep sequencing confirmed that the plasmid collection covered over 93% of sgRNAs and genes in the GeCKO library. A total of 12 flasks (175 cm2, Corning) with 1.75 × 10⁶ HEK293T cells each were grown to 70% confluence. The media was replaced with 10 mL OptiMEM (Gibco) one hour prior to transfection. For each flask, a total of 14 μg GeCKO v2 plasmid collection (7 μg per sub-library), 7 μg lentiviral envelope plasmid (pMD2.g, Addgene #12259), and 11 μg lentiviral packaging plasmid (psPAX2, Addgene #12260) were diluted in 2.8 mL OptiMEM and supplemented with 142 μL Plus reagent (Invitrogen). In parallel, 71 μL Lipofectamine LTX (Invitrogen) was diluted in 2.8 mL OptiMEM and incubated at room temperature for 5 min after which plasmids and Lipofectamine were added and the mixture was incubated for another 20 min before being added to the flasks. After 6 hr, the transfection mix was replaced with DMEM (+10% FBS, 1% BSA). After two days, the virus containing media was collected and centrifuged for 10 min at 3,000 × g (4°C) to sediment cell debris. Supernates were filtered through 0.45 μm protein binding membranes (Millipore) and centrifuged for 2 hr at 24,000 × g at 4°C. Concentrated virus was resuspended in DMEM (+10% FBS, 1% BSA) at 4°C overnight then stored in aliquots at −80°C. The MOI was determined via spinfection with various viral dilutions on A375 cells in 12-well plates (3 × 10⁶ per well) followed by transferring one half of each well into two wells for subsequent treatment with 1 μg/mL puromycin (Invitrogen). After 3 days, cells were counted, and the MOI (μ) was computed from the fraction of surviving cells (q) using the formula: μ = −log(1-q).
Library transduction
To maintain ~100-fold coverage of the genome, a total of 1 × 10⁸ A375 cells were distributed across three 12-well plates (Corning) in DMEM/FBS medium containing 8 μg/mL polybrene (Sigma) and the virus suspension required to achieve a MOI of ~0.3. Plates were centrifuged at 2,000 × g for 2 hr (37°C) and incubated overnight. After transfer of the cells into 175 cm2 plates (Corning), they were incubated in medium containing puromycin (1 μg/mL) for 7 days. Aliquots of the cell library were stored in liquid nitrogen.
Screening assays
For the resistance screen, two replicates of 1 × 10⁷ GeCKO-library transduced A375 cells were seeded in 175 cm2 plates (Corning) and treated with 10 nM guanidinoneomycin (GNeo-Saporin) or 5 nM diphtheria toxin (List Labs) (see Supplementary Information: Synthetic Procedures). Cells were kept in GNeo for 4 days, after which the media was replaced with toxin-free DMEM/FBS medium, and cells were grown for another 8 days. Two control plates were grown in parallel, treated with PBS (Gibco), and passaged every two days before harvesting after 8 days. For the FACS screen, two replicates of 1 × 10⁷ GeCKO-library transduced A375 cells were grown on 175 cm2 plates for two days, harvested, washed in PBS, stained with GNeo-Cy5 and subjected to FACS (BD Influx sorter).
Sample preparation and sequencing
Genomic DNA was extracted using the DNeasy Blood & Tissue Kit (Qiagen), and crRNA barcodes were amplified through nested PCR. Genomic DNA extracts (2 μg) were diluted with ddH2O to a volume of 67 μL, and mixed with 33 μL of PCR1 reaction master mix (20 μL Q5-reaction buffer (NEB), 2 μL 10 mM dNTPs (NEB), 5 μL 10 μM primer F1, 5 μL 10 μM primer R1, 1 μL Q5 (NEB)). PCR products were generated using the recommended conditions (NEB) using 70°C annealing temperature for 18 cycles. After completion, all reactions were pooled, and 5 μL of the PCR products were diluted with 62 μL ddH2O, and mixed with 33 μL PCR reaction 2 master mix (20 μL Q5-reaction buffer, 2 μL 10 mM dNTPs, 5 μL 10 μM primer F0x, 5 μL 10 μM primer R0y, 1 μL Q5. PCR products were generated using the recommended conditions using 70°C annealing temperature for 24 cycles. PCR products were gel-purified (QIAquick Gel Extraction kit, Qiagen) and submitted for sequencing on a HiSeq 4000 (Illumina).
Amplicon sequencing analysis
Analysis of the raw amplicon sequencing data, including quality control, sequence alignment, read counting, sgRNA enrichment analysis, and gene ranking, was carried out using PinAPL-Py v2.950. Briefly, a ranking score for each gene g was computed based on the read counts in the treatment condition nx(i) and in the control condition n0(i) of each sgRNA i in the GeCKO library, according to:
where I is the set of sgRNAs i targeting gene g that yield significant enrichment nx(i)/n0(i) according to the negative binomial model implemented in PinAPL-Py. q is a scaling function to grant additional weight to genes that receive support from multiple crRNAs. q(I) = |I| was used in this study. Statistical significance of high Πg scores was estimated by calculating Πg for 10,000 permutations in which sgRNAs were assigned to genes randomly. In a restrictive setting, a p-value threshold of 0.01 was used after Sidak-correction for multiple tests to assess sgRNA enrichment and gene scores. In a permissive setting, a false discovery rate of 0.1 was used instead, and a minimal read count of 5 counts per million reads was applied to decrease noise (See Supplementary Data Sets 1–7 for full list of parameters used). Additional analytical runs were carried out with different parameter settings, but KDM2B was consistently recovered among the top-ranked genes. Genes reaching significant enrichment in both screens were analyzed with STRING to find association clusters (www.string-db.org).
RNA-Seq quantification and differential expression analysis
RNA-Seq quality was assessed using FastQC. Adapter sequences and low-quality bases were trimmed using Trimmomatic51. Sequence alignment was performed using STAR52 against the Human genome (GRCH.38; GCF_000001405.38) with the default parameters. The expression of each gene was quantified using HTSeq53. Differential gene expression analysis was accomplished using DESeq2. After Benjamini-Hochberg FDR correction, genes with adjusted p-values less than 0.05 and fold change greater than 1.5 were considered as differentially expressed genes (DEGs). Raw data is deposited at the Gene Expression Omnibus and Short Read Archive (accession numbers: GSE145789). Functional annotation and gene set enrichment analysis of the top 200 differentially expressed genes was carried out using Metascape (http://metascape.org/).
Chromatin immunoprecipitation (ChIP) sequencing
A375 wild-type or KDM2BC5 cells (3 × 10⁶) were fixed with 1% formaldehyde for 10 min and the cross-linking reaction was quenched by adding 1.3 M glycine (1:10). Snap-frozen cell pellets were resuspended in 130 μL RIPA lysis buffer (20 mM Tris/HCl pH7.5, 1 mM EDTA, 0.5 mM EGTA, 0.1% SDS, 0.4% sodium deoxycholate, 1% NP-40 alternative, 0.5 mM DTT) supplemented with protease inhibitors. Sonicated lysates were centrifuged and incubated overnight at 4°C with 2 μg of antibodies directed against H3K4me3 (04–745, Millipore) or H3K36me2 (ab9049, Abcam) and 20 μL protein A magnetic beads (Thermo Fisher). The beads were collected using a magnet and washed. DNA was amplified by PCR for 14 cycles in a 25 μl reaction volume using NEBNext Ultra II PCR master mix and 0.5 μM each Solexa 1GA and Solexa 1GB primers. Sample concentrations were quantified by Qubit dsDNA HS Assay Kit (Thermo Fisher) and 75bp single-end sequenced on a HiSeq 4000 (Illumina). ChIP-Seq data was mapped to the hg38 genome using bowtie2 v2.2.954 and tag directories were made using HOMER v4.11.55 KDM2B ChIP-Seq data was downloaded from GEO: GSE108929. The binding sites of KDM2B were identified using HOMER ‘findPeaks -style factor’ and overlayed with H3K4me3 and H3K36me2 signal in A375 wild-type or KDM2BC5 cells using HOMER annotatePeaks.pl with parameters “-norm 1e7 -size 6000 -hist 25” to help compute the histograms of 25-bp bins within +/− 3000 bp of KDM2B peaks. All sequencing data have been made available by deposition in the GEO database: GSE163162. The UCSC genome browser was used to visualize sequencing data. For KDM2B, three available antibodies were tested, but none of them enriched KDM2B-bound targets. Since Banito et al. reported successful KDM2B ChIP, this data was downloaded from GEO: GSE108929 (M5SS1) and is shown in Fig. 5c for SULF1 along with a negative control gene B4GALT7.56
ELISA Experiments
The MMP-9 and TIMP-3 concentrations in the supernatants after cell cultivation for 96 h were determined by sandwich ELISAs according to the manufacturer’s protocols (R&D Systems). In brief, high binding 96-well ELISA plates were coated overnight with capture antibodies for MMP-9 (1 μg/ml) or TIMP-3 (2 μg/ml) diluted in PBS. Then, the plate was incubated for 2 h after adding the supernatants (100 μL media/well). MMP-9 and TIMP-3 were quantified using detection antibodies for MMP-9 (100 ng/ml, R&D Systems # DY911) and TIMP-3 (2 μg/ml, R&D Systems # DY973) diluted in 1% BSA in PBS in comparison to calibration curves ranging from 0 to 4 ng/ml MMP-9 or TIMP-3 in 1% BSA/PBS.
Western Blotting
Nuclear proteins from A375 cell lines were extracted using an NE-PER nuclear and cytoplasmic protein extraction reagent kit (Thermo Fisher). Protein was quantified by BCA assay (Thermo Scientific-Pierce). Samples (11 μg protein) were subjected to SDS-PAGE (4–12% Bis-Tris, NuPAGE, Invitrogen), blotted on Immobilon-FL PVDF membranes (Millipore) and probed for KDM2B (rabbit anti-JHDM1B, Millipore, 09–864, 1:1000) and β-actin (mouse anti-Actin, Sigma, AC-74, 1:1000). Membranes were blocked with 5% nonfat milk in TBST (Tris-buffered saline, 0.1% Tween 20) for 1 hr at room temperature, then incubated overnight at 4°C with respective primary antibodies. Mouse and rabbit primary antibodies were incubated with secondary Odyssey IR dye antibodies (LI-COR, 1:14,000) and visualized with an Odyssey IR imaging system (LI-COR Biosciences).
To detect secreted SULF1 protein, conditioned medium from A375 wild-type and KDM2BC5 cells was collected after 3 days, centrifuged (1000 × g, 5 min), and the supernatant was passed through a 0.2 μm filter. The filtered media was transferred to a 30 kDa PES spin filter (Thermo Scientific-Pierce), concentrated by centrifugation (4200 × g, 30 min), and the media was exchanged three times by the addition of 50 mM Tris++ buffer (50 mM Tris, 5 mM MgCl2, 5mM CaCl2, 100 mM NaCl, 1X protease inhibitors, pH 7.5) to the concentrated sample. The resulting solution (~10-fold conc.) was supplemented with protease inhibitors (Roche) and quantified for total protein content using the BCA Assay (Thermo Scientific-Pierce). Aliquots of concentrated and unconcentrated conditioned media were prepared with matching total protein levels (5 μg/μL), analyzed by SDS-PAGE (4–15% TGX Mini Protean Gel, BioRad), and blotted onto PVDF membranes. Total protein content in the SDS-PAGE gel was evaluated by washing the gel in InstantBlue Coomassie Protein Stain (Expedeon) overnight at 4 °C. SULF1 protein was detected with an anti-SULF1 primary antibody (rabbit polyclonal, Sigma, SAB1410410, 1:1000) and a secondary anti-rabbit HRP antibody (Cell Signaling Technologies, 7074S, 1:2000). The membrane was visualized by the addition of Immobilon Crescendo Western HRP substrate (Millipore) followed by exposure in a Bio-Rad ChemiDoc XRS imaging system (BioRad).
Cell line generation
Cas9-expressing A375 cells were generated by transfection with Fugene 6 (Promega), envelope plasmid (pMD2.g, Addgene #12259), packaging plasmid (psPAX2, Addgene #12260) and Cas9 expression plasmid (lentiCas9-Blast, Addgene #52962) (4 μg each) followed by selection with 2 μg/mL blasticidin for 4 days. A375 mutant cell lines were generated by ligating sgRNAs targeting KDM2B (5’ – CTTGGTCAAGCGTCCGACTG – 3’), NDST1 (5’ – ATGACGCACCTGTCCAACTA – 3’), or SLC35B2 (5’ – TCCGCCTGAAGTACTGCACC – 3’) into lentiGuide-Puro (Addgene #52963) and co-transfecting each plasmid with Fugene 6 into HEK293T cells, along with pMD2.g (Addgene plasmid #12259) and psPAX2 (Addgene plasmid #12260) viral plasmids, to make lentiviral particles, which were subsequently used to transduce Cas9-expressing A375 cells. After treatment of the transduced cell pool with puromycin (1 μg/mL) for 3 days, surviving cells were seeded onto a 96-well plate at low density, and clonal populations were established. The A375-KDM2B SULF1 double mutant cell line (KDM2BC5 SULF1#1) was generated by assembling a SULF1-targeting Cas9/crRNA/tracrRNA ribonucleoprotein particle in vitro (crRNA: 5’-GTGATTGTGCACATACTTCC-3’) using standard protocols (Integrated DNA Technologies) and transfecting it into KDM2BC5 cells using electroporation (Neon; Thermo Fisher). After 7 days, the cells were seeded onto a 96-well plate at low density, and clonal populations were established. HeLa-KDM2B mutant cells were isolated by single-cell dilution from a HeLa-KDM2B mutant cell pool generated by Synthego Inc.
Growth experiments and soft agar assays
For growth curves, A375 wild-type, KDM2BC5, or KDM2BC5SULF1#1 cells were plated in 48-well plates (6,000 cells per well). Cell viability was measured with Cell Titer Blue (Promega) daily. Clonogenic colony formation was assessed by seeding cells at 1,000 cells per well in 6-well plates and incubating for 14 days under normal growth conditions. Colonies were visualized with methylene blue (12.5 mM in methanol) for 10 min at room temperature, washed with deionized water, and imaged. For quantification, the methylene blue was dissolved in 0.7 M sodium citrate in 50% ethanol and absorbance was measured at 650 nm.
For soft agar assays, 8,000 cells/well were plated in 6-well plates in complete DMEM containing 0.2% agarose, with a 0.4% agarose underlay. The colonies were fed 4 drops of DMEM every 4 days. The colonies were stained with 0.01% (w/v in 10% ethanol) crystal violet and scored using the “Analyze Particles” procedure in ImageJ software. For plotting, colony sizes (in pixels) were scaled by 106, log-transformed and pooled from all biological replicates.
Plasmid preparations, rescue experiments and quantitative PCR
Lentiviral particles carrying the human KDM2B gene were produced by co-transfection of HEK293T cells with a psPAX2 packaging plasmid (Addgene plasmid #12260) and the VSV-G-encoding plasmid pMD2.g (Addgene plasmid #12259). Medium containing the lentivirus particles was collected and used to infect HeLa-KDM2B mutant cells. After infection, the cells were cultured with 2 μg/ml puromycin to select for stably transduced cells.
For A375 rescue experiments, the PAM sequence in the pLV-KDM2B plasmid (VectorBuilder Inc.) was mutated and a catalytic mutant construct was generated by H242A point mutation using the Q5 Mutagenesis kit (NEB) before transfection. The identity of the plasmid was confirmed by Sanger sequencing (Eton Bioscience Inc.). KDM2BC5 cells (2 × 10⁵ cells/well) were transfected with Lipofectamine LTX with Plus reagent (Invitrogen) and either the PAM-mutated pLV-KDM2B plasmid, the PAM-mutated H242A mutant KDM2B plasmid, a human HS3ST3A1 expression plasmid (VectorBuilder), a human HS6ST2 expression plasmid (Applied Biological Materials Inc.), a mouse HS3ST1 expression plasmid, or an siRNA targeting human SULF1 (SASI_Hs02_00330796, Sigma). Cells were incubated with this mixture for 4 hr, then the medium was replaced with DMEM + 10% FBS. FACS binding experiments were performed 48 hrs post-transfection.
For qPCR experiments, RNA was extracted from A375 cells, reverse transcribed, and quantitated by qRT-PCR using primers for human KDM2B, SULF1, HS6ST2, HS3ST3A1, and YWHAZ. qPCR was performed using SYBR Green Master Mix (Applied Biosystems) following the manufacturer’s instructions. The expression of YWHAZ was used to normalize the expression of the target genes between samples. The primers used for qPCR are provided in Supplementary Table 3.
Protein biotinylation
A heparin-Sepharose column (100 μL, GE Healthcare) was pre-equilibrated with PBS (Gibco) then loaded with human FGF1 (ProSpec), FGF2 (Peprotech), FGF7 (ProSpec), or FGF10 (ProSpec) dissolved in PBS. The flow-through was reloaded onto the column twice to ensure complete binding. After washing twice with PBS, a 0.6 mg/mL solution of Sulfo-NHS-LC-biotin (Thermo Fisher) in PBS was loaded onto the column and incubated for 1 hr at room temperature. Each column was washed three times with PBS, then bound biotinylated protein was eluted with 0.4 mL of PBS buffer containing an additional 2 M NaCl. Biotinylated S100A12 was prepared as previously reported57. All biotinylated proteins were stored at −80°C before use.
Flow cytometry
A375 and HeLa cells grown in monolayer culture were washed with PBS, lifted using Cell Dissociation Buffer (Gibco) or 10 mM EDTA, and incubated in suspension for 30 min at 4°C with 0.5 μg/mL mAb 10E4 (AMSBio #370255-1, Clone F58-10E4, 1:1000), 5 μg/mL mAb 3G10 (AMSBio #370260-S, clone F69-3G10, 1:200), 80 nM biotin-FGF1, 2.5 nM biotin-FGF2, 180 nM biotin-FGF7, 35 nM biotin-FGF10, or 1 μg/mL biotin-S100A12, respectively. Alternatively, cells were incubated for 1 hr at 4°C with 500 nM human antithrombin (Aniara) or 10 nM human NRP1-His-biotin-streptavidin-Cy5 conjugate. Bound antithrombin was detected with 2 μg/ml anti-AT pAb (R&D Systems, #AF1267, 1:100) followed by 2.5 μg/ml donkey anti-goat conjugated to AlexaFluor488 (Invitrogen, #A-11055, 1:1000). Binding of biotinylated proteins was detected by 1:1000 dilution of streptavidin-Cy5 (Molecular Probes). For heparin lyase pre-treatment, adherent cells were incubated with 5 mU/mL each of heparin lyases I, II, and III for 30 min at 37°C in growth media. Flow cytometry was performed on a FACSCalibur (BD Biosciences) instrument (≥10,000 events/sample) and raw data was analyzed using FlowJo Analytical Software (Tree Star Inc.). Cells were gated according to forward and side scattering. The extent of protein binding was quantified using the geometric mean of the fluorescence intensity. These values were plotted and further analyzed using GraphPad Prism v8.0.
HS purification and LC-MS analysis
A375 wild-type or KDM2BC5 cells (0.5 × 10⁶) were seeded in a 10 cm diameter plate and harvested when confluent. Cell surface HS was isolated and the disaccharide composition was analyzed as described previously58.
Radiolabeling and HS structural analysis
A375-Cas9 and KDM2B mutant cells (1 × 10⁶) were radiolabeled with [35S]sulfate (50 μCi/mL) in F12 media containing 10% dialyzed FBS for 24 hrs at 37°C. HS was purified using the methods described above and analyzed by size exclusion chromatography (Sepharose 6B-L column 1 × 70 cm; 50 mM sodium acetate, 0.2 M NaCl, pH 6.0). For filter binding assays, recombinant FGF1 (Prospec), antithrombin (Anaira), or BSA (Sigma) were incubated with 20,000 counts of [35S]HS for 1 hr at room temperature. Binding was measured by filtration on prewashed nitrocellulose membranes as described59.
A GNeo affinity column was prepared by dissolving 1 mg of GNeo-biotin in 50 mM sodium acetate buffer containing 0.1 M NaCl, pH 6.0. The solution was added to a column (0.5 mL) of streptavidin-Sepharose (GE Healthcare) and incubated for 20 min at room temperature. Next, the column was washed thoroughly to remove unbound GNeo-biotin. Subsequently, [35S]HS was applied to the column and eluted with a stepwise salt gradient from 0.1 to 1.5 M NaCl.
Statistics and Reproducibility
Statistical tests and sample sizes are indicated in the figure legends. *** P<0.001; ** P<0.01; * P<0.05; # P<0.1. All tests were two-sided. Tests were performed in Prism (GraphPad) or R (R-Project). Measurements were taken from distinct samples, and the number of biological replicates is indicated in the legends. Error bars represent mean +/− standard deviation. Boxplot center refers to median, boxplot bounds refer to 25% and 75% percentile, whiskers refer to minimum and maximum, unless noted otherwise. Western blots were performed twice independently, and representative images are shown in the figures.
DATA AVAILABILITY STATEMENT
Any data generated or analyzed during this study, associated protocols, materials within the manuscript, and public databases (GSE163162, GSE145789) are included in the article and related supplementary information or are available from the corresponding author.
Extended Data
Extended Data Fig. 1. A genome-wide screen for resistance to diphtheria toxin.
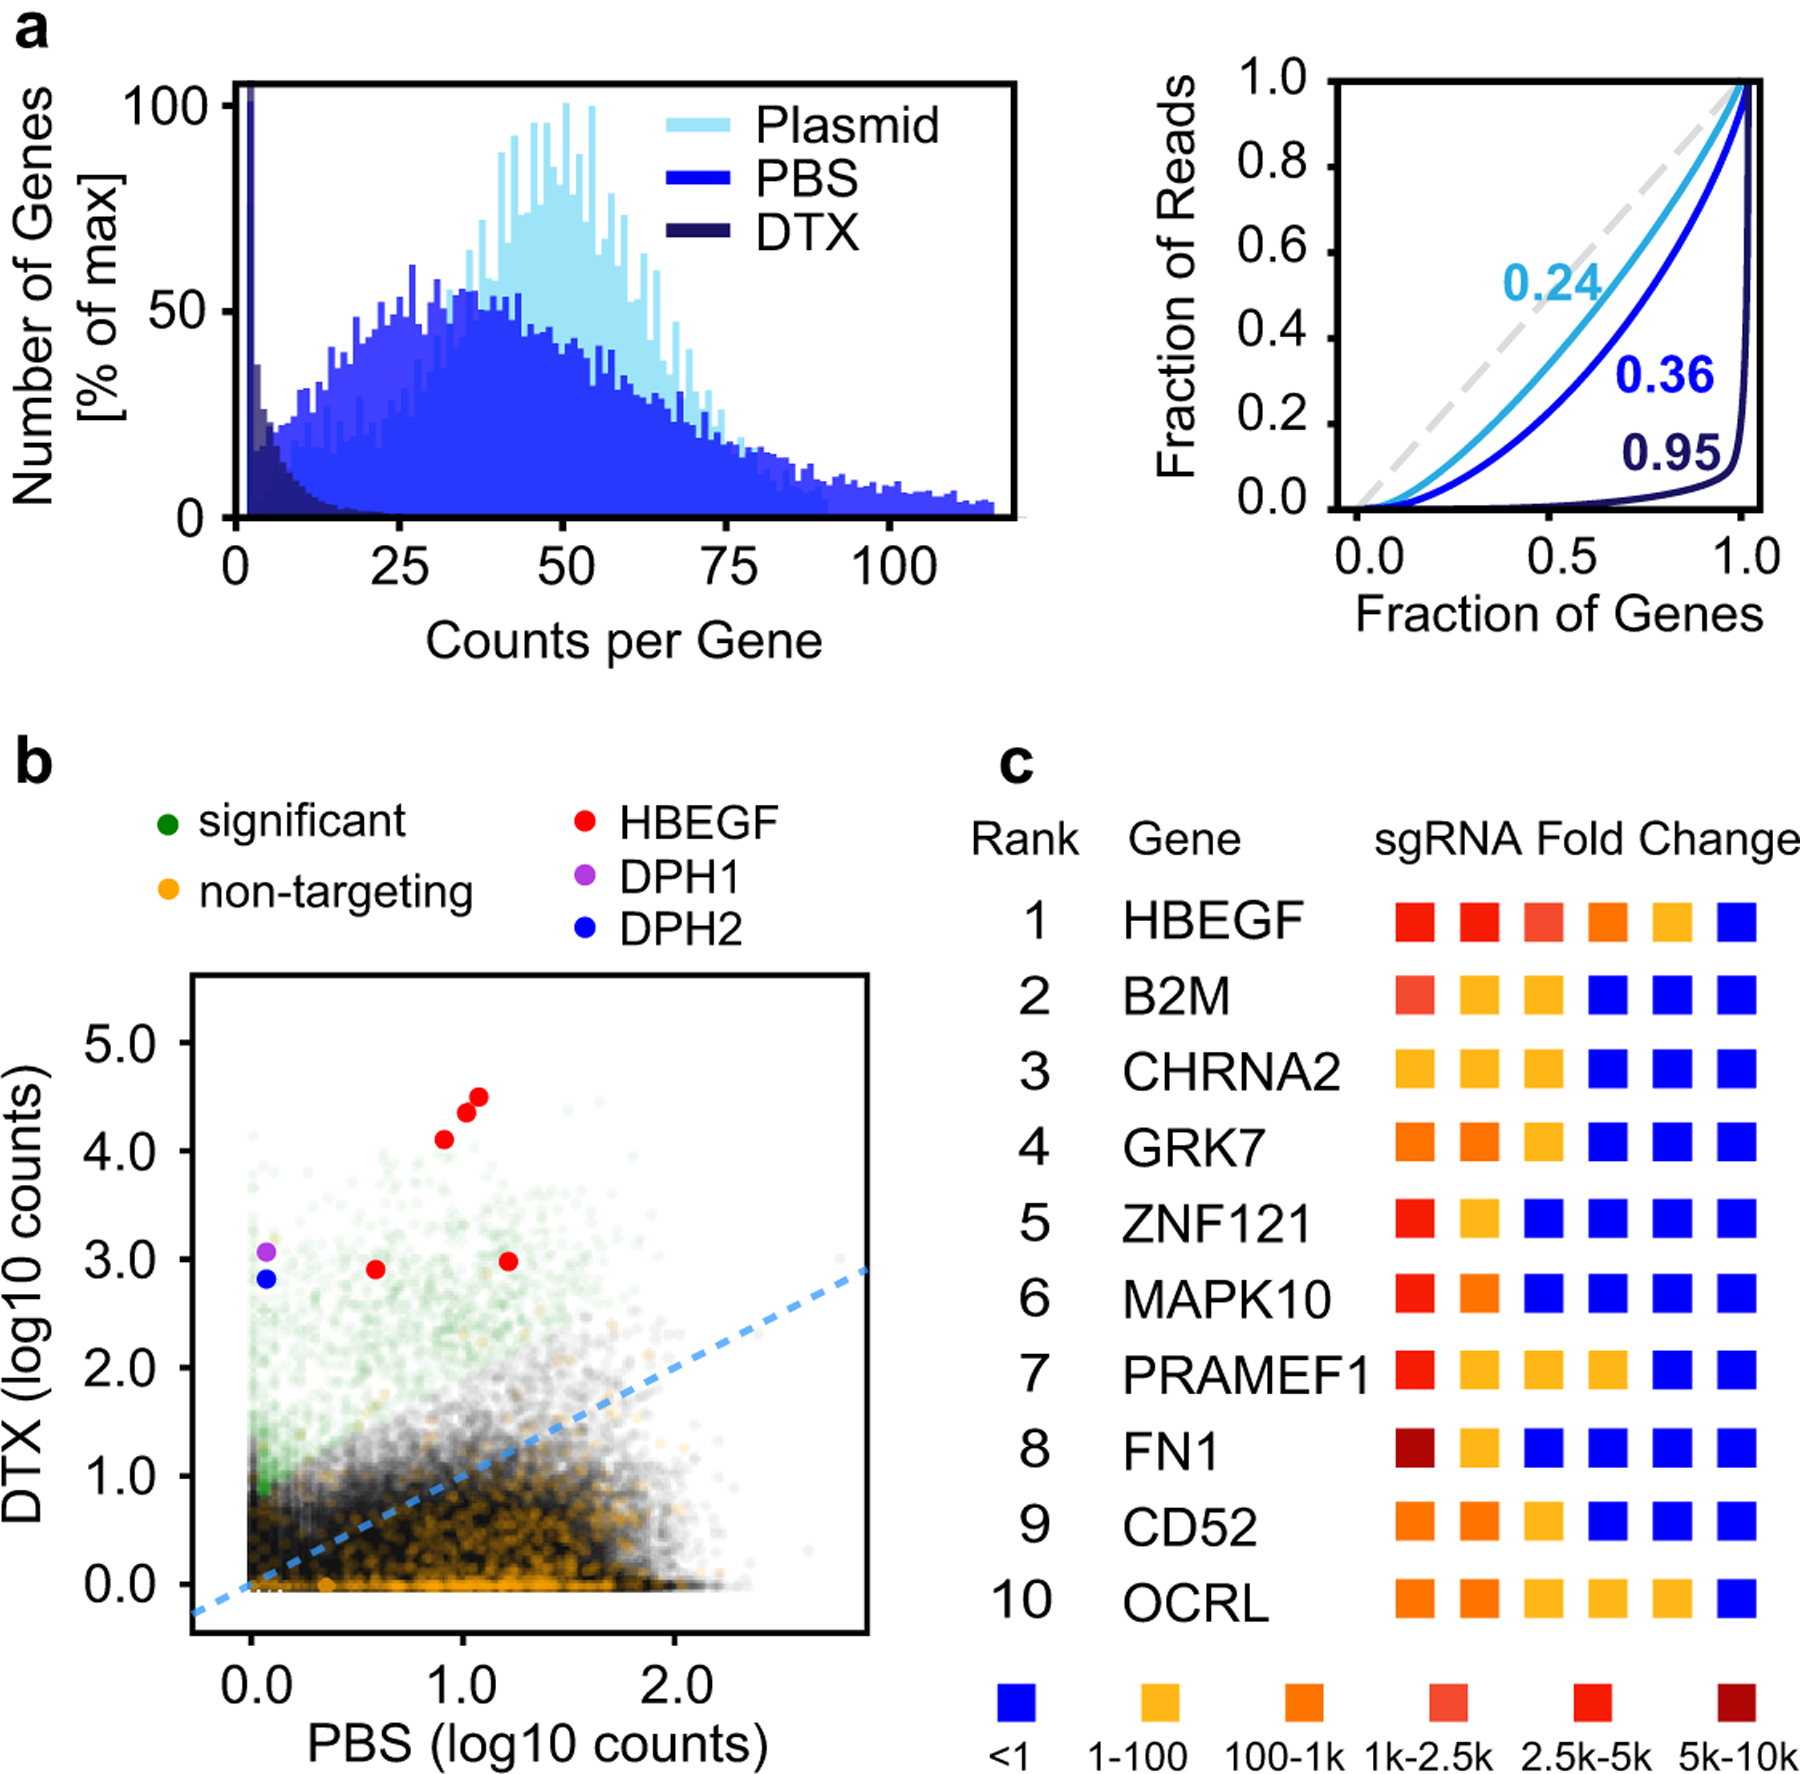
(a) Left: Frequency distribution of gene counts after treatment with either diphtheria toxin (DTX) or PBS (Plasmid = GeCKO plasmid library). Right: Lorenz curves showing the distribution of sequencing reads over the gene library. Numbers represent Gini coefficients. (b) Scatterplot of sgRNA counts (log10, normalized) in samples after DTX treatment versus PBS treatment. The sgRNA fraction with significant fold-change is shown in green. sgRNA fraction representing non-targeting controls shown in orange. HBEGF-targeting sgRNAs shown in red, and DPH genes are shown in purple and blue. (c) Table of the top 10 ranked genes showing enrichment after DTX treatment. The enrichment level of the six gene-targeting sgRNAs is indicated by color.
Extended Data Fig. 2. KDM2B-deficient cell lines.
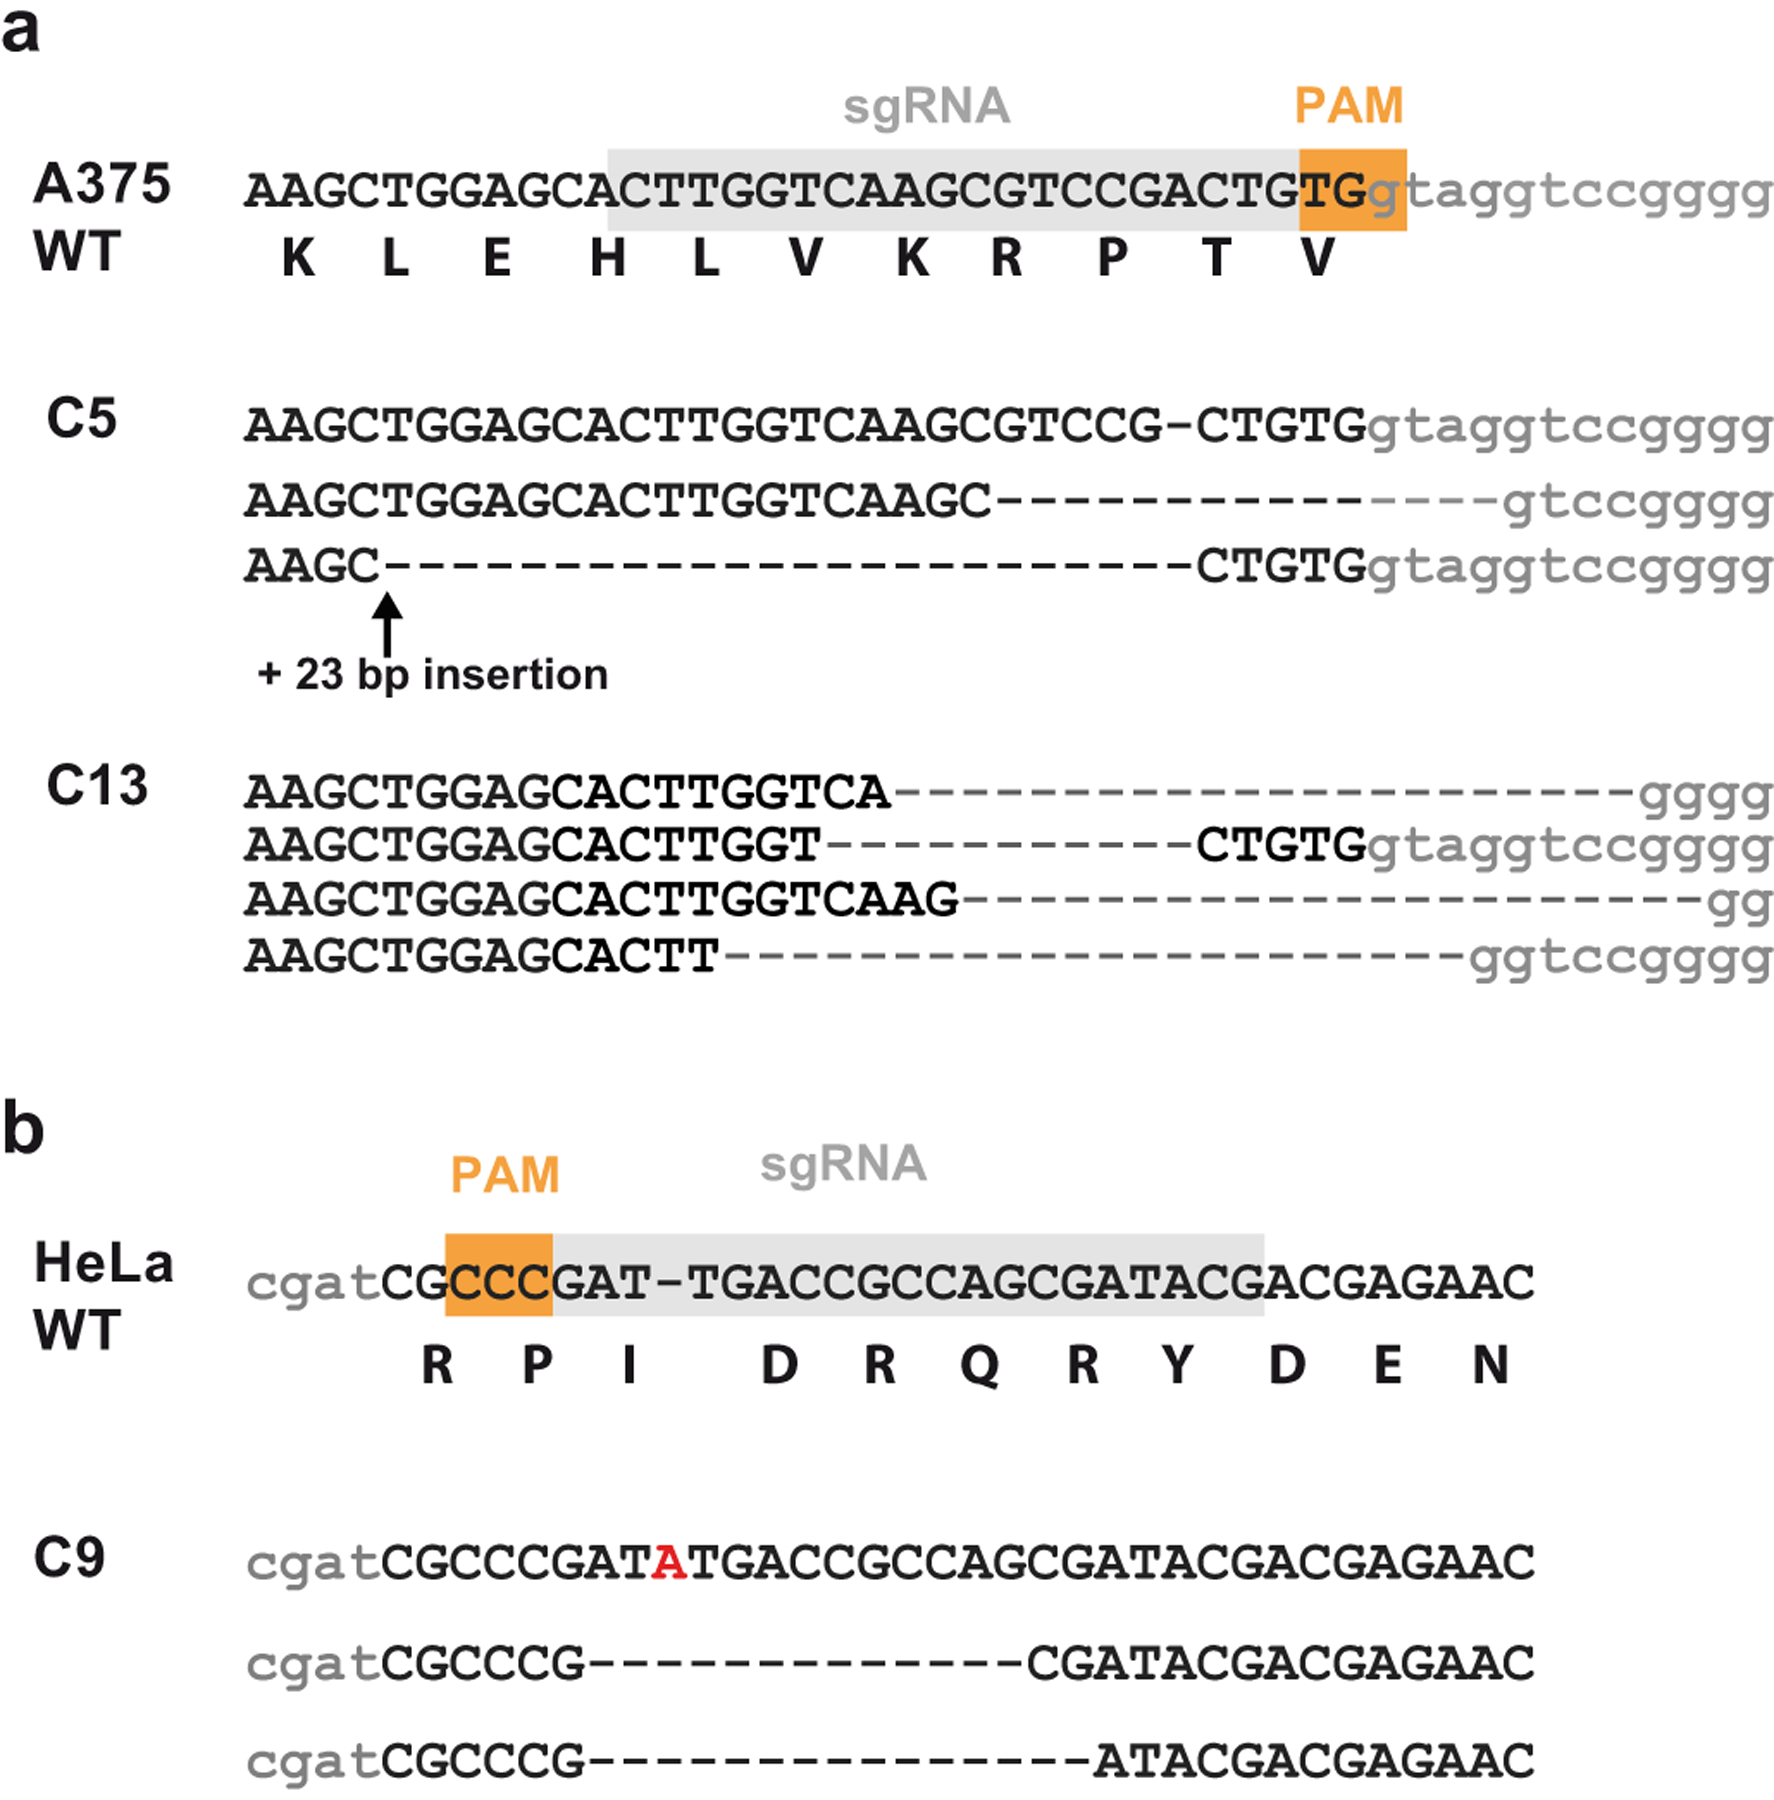
(a) Sanger sequencing of two A375 KDM2B knockout clones (C5 and C13) and (b) Sanger sequencing of one HeLa knockout clone (C9) after targeting with the indicated sgRNAs. Intron sequence denoted in lower case.
Extended Data Fig. 3. KDM2B affects protein binding.
(a) Protein binding in A375 KDM2B knockout clone C13 (t-tests; n=3). (b) Fold change in KDM2B mRNA expression in A375 KDM2BC5 cells, and in A375 KDM2BC5 cells expressing a KDM2B cDNA from a lentiviral construct (hKDM2B) (n=2). (c) FGF1 binding in HeLa KDM2BC9 cells, and in HeLa KDM2BC9 cells expressing KDM2B cDNA (hKDM2B) (t-test on log10 fluorescence data, n=5). (d) Fold change in KDM2B mRNA expression in A375 KDM2BC5 cells expressing a KDM2B cDNA with a point mutation (H242A) in the demethlase domain (n=2).
Extended Data Fig. 4. Transcriptomic changes in KDM2B-deficient cells.
(a) Fold change in SULF1 mRNA expression in A375 KDM2BC5 cells, and in A375 KDM2BC5 cells expressing a siRNA against SULF1 (n=2). (b) top: Western blot of SULF1 protein levels in conditioned media (CM) collected from A375 wild-type and KDM2BC5 cells (CM 10x equals 10-fold concentrated solution) bottom: Total protein (coomassie-stained gel), red frame indicates position of SULF1. (c) Gene track for H3K4me3, KDM2B, and H3K36me2 ChIP-Seq at the MNX1 locus, a known target of KDM2B. (d) Transcriptome-wide expression data displaying differentially expressed genes in KDM2BC5 cells compared to wild-type. HS biosynthetic genes and extracellular matrix genes are highlighted. (e) Gene set enrichment analysis of significantly downregulated (log2 ≤ −0.5, p ≤ 0.05; FDR-corrected) and upregulated (log2 ≥ 0.5, p ≤ 0.05; FDR-corrected) genes in A375 wild-type and KDM2BC5 RNA-Seq datasets (n=3). (f) MMP-9 and TIMP-3 levels in the supernatant from cultured A375 wild-type and KDM2BC5 cells (t-test, n=3). (g) Histograms showing FGF1 binding in A375 wild-type, KDM2BC5 cells, and in KDM2BC5 cells upon treatment with an siRNA targeting SULF1. (h) Fold change in HS6ST2 mRNA expression in A375 KDM2BC5 cells, and in A375 KDM2BC5 cells expressing a HS6ST2 cDNA from a lentiviral construct (hHS6ST2) (n=2). (i) Fold change in HS3ST3A1 mRNA expression in A375 KDM2BC5 cells, and in A375 KDM2BC5 cells expressing a HS3ST3A1 cDNA from a lentiviral construct (hHS3ST3A1) (n=2).
Extended Data Fig. 5. KDM2B affects cell growth through SULF1.
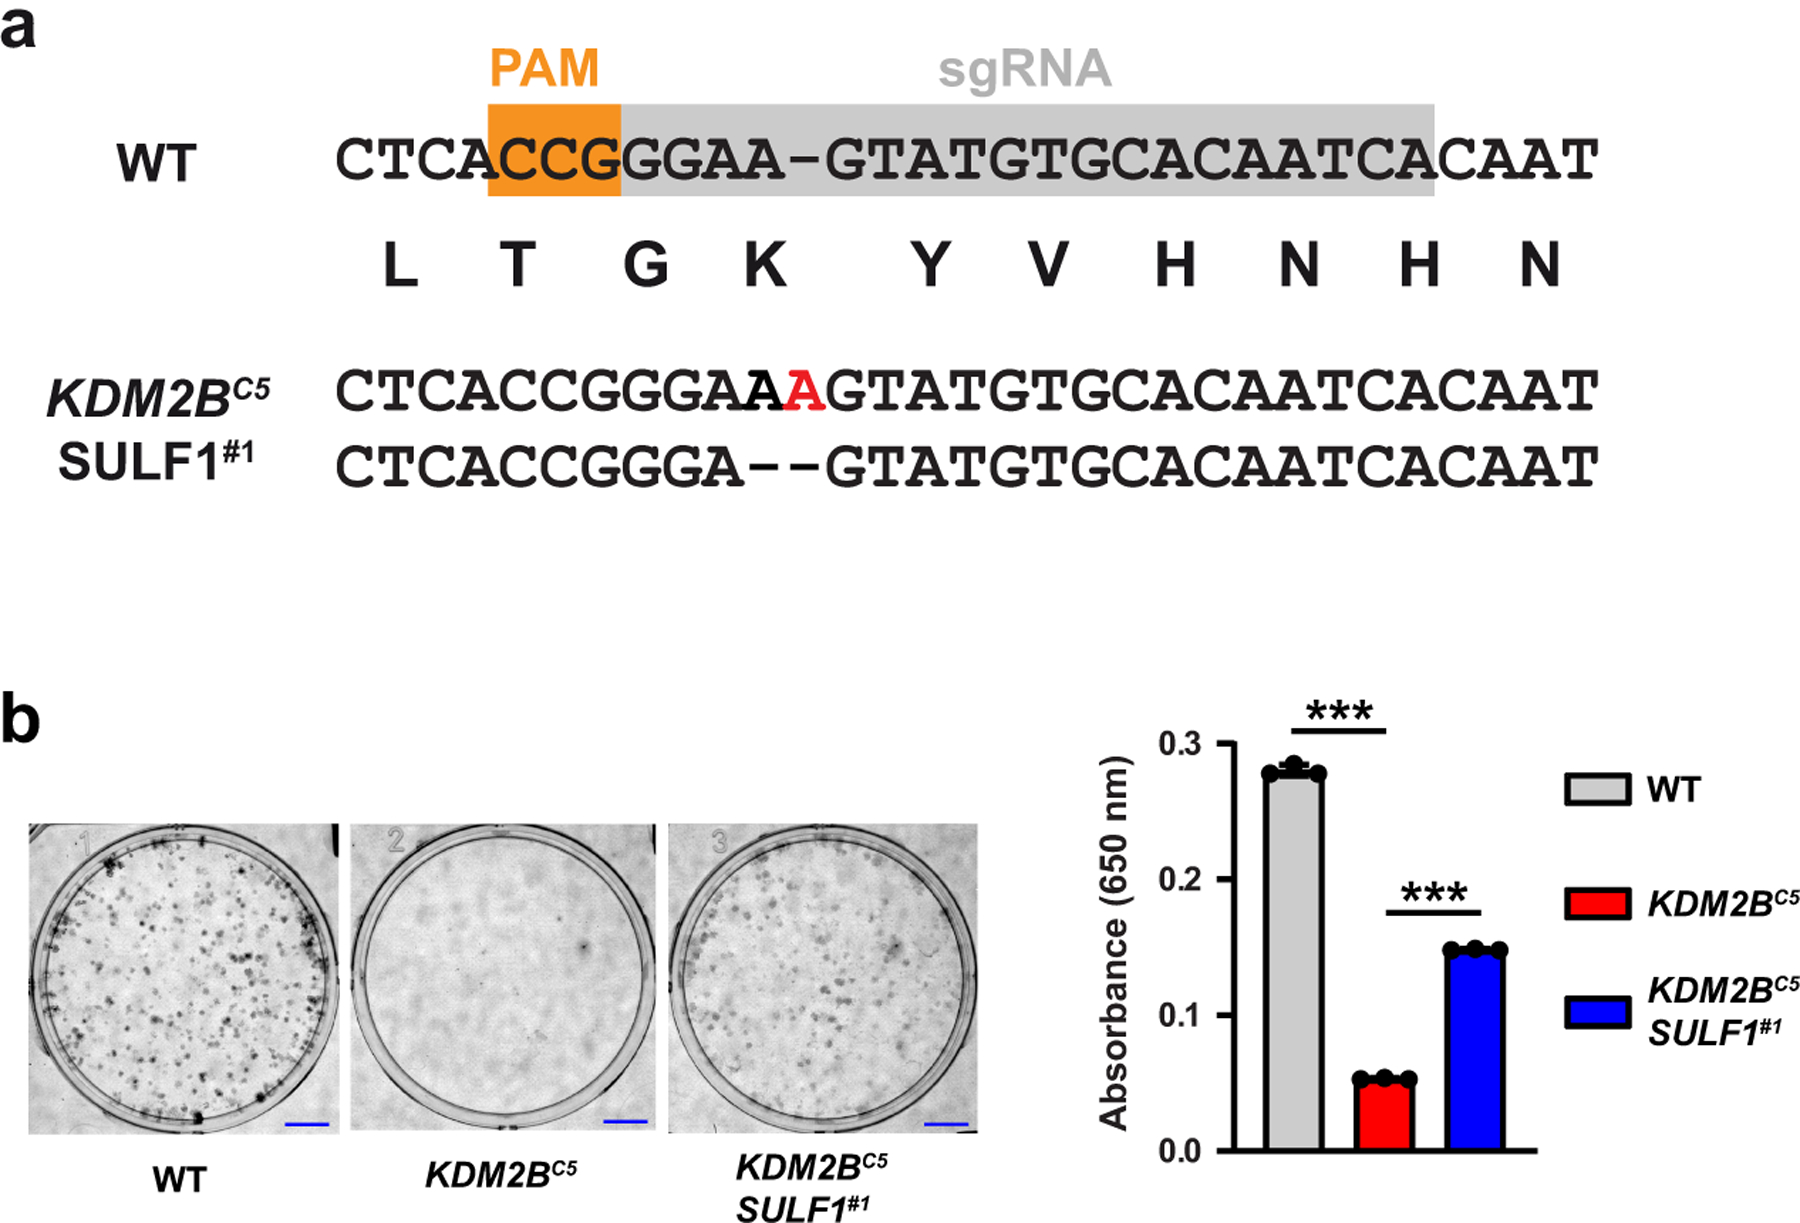
(a) Sanger sequencing of a A375 KDM2B SULF1 double knock-out clone (KDM2BC5 SULF1#1) after targeting with the indicated sgRNA. Both sequence changes result in frameshift mutations. (b) Clonogenic assay under normal growth conditions. After 14 days, colony growth was quantified by methylene blue staining and absorption readings at 650 nm (t-test, n=3). Scale bar = 5 mm.
Supplementary Material
ACKNOWLEDGEMENTS
We thank Craig van der Kooi, University of Kentucky, for providing the b1b2 domain of NRP1, and Ding Xu, University of Buffalo, for providing the biotinylated S100A12 protein. We also thank the GlycoAnalytics Core Facility at University of California San Diego for help with analytical experiments. We thank Curtis Kuo for processing of RNA sequencing data. RNA sequencing and CRISPR amplicon sequencing were conducted at the IGM Genomics Center, University of California, San Diego, La Jolla, CA (MCC grant # P30CA023100). This work was supported by grants R21 CA199292 (J.D.E and N.E.L.), GM33063 (to J.D.E.), GM119850 (N.E.L.), NSF CHE 200424 (to K.G.), T32 GM008326 (fellowship support for B.M.T.), DFG research fellowship 420160411 from the German Research Foundation (S.R.) and by grant K12HL141956 (fellowship support for R.J.W.).
Footnotes
COMPETING INTERESTS
The University of California San Diego and J.D.E. have a financial interest in TEGA Therapeutics, Inc. The terms of this arrangement have been reviewed and approved by the University of California San Diego in accordance with its conflict-of-interest policies.
REFERENCES
- 1.Xu D & Esko JD Demystifying heparan sulfate-protein interactions. Annu Rev Biochem 83, 129–57 (2014). [DOI] [PMC free article] [PubMed] [Google Scholar]
- 2.Bishop JR, Schuksz M & Esko JD Heparan sulphate proteoglycans fine-tune mammalian physiology. Nature 446, 1030–1037 (2007). [DOI] [PubMed] [Google Scholar]
- 3.Esko JD & Selleck SB Order out of chaos: Assembly of ligand binding sites in heparan sulfate. Annu Rev Biochem 71, 435–471 (2002). [DOI] [PubMed] [Google Scholar]
- 4.Presto J et al. Heparan sulfate biosynthesis enzymes EXT1 and EXT2 affect NDST1 expression and heparan sulfate sulfation. Proc Natl Acad Sci USA 105, 4751–6 (2008). [DOI] [PMC free article] [PubMed] [Google Scholar]
- 5.Kreuger J & Kjellen L Heparan sulfate biosynthesis: regulation and variability. J Histochem Cytochem 60, 898–907 (2012). [DOI] [PMC free article] [PubMed] [Google Scholar]
- 6.Weiss RJ et al. ZNF263 is a transcriptional regulator of heparin and heparan sulfate biosynthesis. Proc Natl Acad Sci U S A 117, 9311–9317 (2020). [DOI] [PMC free article] [PubMed] [Google Scholar]
- 7.Naba A et al. The extracellular matrix: Tools and insights for the “omics” era. Matrix Biol 49, 10–24 (2016). [DOI] [PMC free article] [PubMed] [Google Scholar]
- 8.Shalem O et al. Genome-scale CRISPR-Cas9 knockout screening in human cells. Science 343, 84–7 (2014). [DOI] [PMC free article] [PubMed] [Google Scholar]
- 9.Elson-Schwab L et al. Guanidinylated neomycin delivers large, bioactive cargo into cells through a heparan sulfate-dependent pathway. J Biol Chem 282, 13585–13591 (2007). [DOI] [PubMed] [Google Scholar]
- 10.Sanjana NE, Shalem O & Zhang F Improved vectors and genome-wide libraries for CRISPR screening. Nat Methods 11, 783–4 (2014). [DOI] [PMC free article] [PubMed] [Google Scholar]
- 11.Spahn PN et al. PinAPL-Py: A comprehensive web-application for the analysis of CRISPR/Cas9 screens. Sci Rep 7, 15854 (2017). [DOI] [PMC free article] [PubMed] [Google Scholar]
- 12.Zhou Y et al. High-throughput screening of a CRISPR/Cas9 library for functional genomics in human cells. Nature 509, 487–91 (2014). [DOI] [PubMed] [Google Scholar]
- 13.Shishido Y, Sharma KD, Higashiyama S, Klagsbrun M & Mekada E Heparin-like molecules on the cell surface potentiate binding of diphtheria toxin to the diphtheria toxin receptor membrane-anchored heparin-binding epidermal growth factor-like growth factor. J Biol Chem 270, 29578–29585 (1995). [DOI] [PubMed] [Google Scholar]
- 14.Su X, Lin Z & Lin H The biosynthesis and biological function of diphthamide. Crit Rev Biochem Mol Biol 48, 515–21 (2013). [DOI] [PMC free article] [PubMed] [Google Scholar]
- 15.Szklarczyk D et al. STRING v11: protein-protein association networks with increased coverage, supporting functional discovery in genome-wide experimental datasets. Nucleic Acids Res 47, D607–D613 (2019). [DOI] [PMC free article] [PubMed] [Google Scholar]
- 16.Yan M, Yang X, Wang H & Shao Q The critical role of histone lysine demethylase KDM2B in cancer. Am J Transl Res 10, 2222–2233 (2018). [PMC free article] [PubMed] [Google Scholar]
- 17.Vacik T, Ladinovic D & Raska I KDM2A/B lysine demethylases and their alternative isoforms in development and disease. Nucleus 9, 431–441 (2018). [DOI] [PMC free article] [PubMed] [Google Scholar]
- 18.Farcas AM et al. KDM2B links the Polycomb Repressive Complex 1 (PRC1) to recognition of CpG islands. Elife 1, e00205 (2012). [DOI] [PMC free article] [PubMed] [Google Scholar]
- 19.He J et al. Kdm2b maintains murine embryonic stem cell status by recruiting PRC1 complex to CpG islands of developmental genes. Nat Cell Biol 15, 373–84 (2013). [DOI] [PMC free article] [PubMed] [Google Scholar]
- 20.Frescas D, Guardavaccaro D, Bassermann F, Koyama-Nasu R & Pagano M JHDM1B/FBXL10 is a nucleolar protein that represses transcription of ribosomal RNA genes. Nature 450, 309–13 (2007). [DOI] [PubMed] [Google Scholar]
- 21.Zhang X, Ong C, Su G, Liu J & Xu D Characterization and engineering of S100A12-heparan sulfate interactions. Glycobiology 30, 463–473 (2020). [DOI] [PMC free article] [PubMed] [Google Scholar]
- 22.Banito A et al. The SS18-SSX Oncoprotein Hijacks KDM2B-PRC1.1 to Drive Synovial Sarcoma. Cancer Cell 34, 346–348 (2018). [DOI] [PMC free article] [PubMed] [Google Scholar]
- 23.Ashikari-Hada S et al. Characterization of growth factor-binding structures in heparin/heparan sulfate using an octasaccharide library. J Biol Chem 279, 12346–54 (2004). [DOI] [PubMed] [Google Scholar]
- 24.Kreuger J, Salmivirta M, Sturiale L, Giménez-Gallego G & Lindahl U Sequence analysis of heparan sulfate epitopes with graded affinities for fibroblast growth factors 1 and 2. J Biol Chem 276, 30744–30752 (2001). [DOI] [PubMed] [Google Scholar]
- 25.Sugaya N, Habuchi H, Nagai N, Ashikari-Hada S & Kimata K 6-O-sulfation of heparan sulfate differentially regulates various fibroblast growth factor-dependent signalings in culture. J Biol Chem 283, 10366–76 (2008). [DOI] [PubMed] [Google Scholar]
- 26.Thacker BE, Xu D, Lawrence R & Esko JD Heparan sulfate 3-O-sulfation: A rare modification in search of a function. Matrix Biol 35, 60–72 (2013). [DOI] [PMC free article] [PubMed] [Google Scholar]
- 27.Lamanna WC, Frese MA, Balleininger M & Dierks T Sulf loss influences N-, 2-O-, and 6-O-sulfation of multiple heparan sulfate proteoglycans and modulates fibroblast growth factor signaling. J Biol Chem 283, 27724–35 (2008). [DOI] [PubMed] [Google Scholar]
- 28.Habuchi H et al. The occurrence of three isoforms of heparan sulfate 6-O-sulfotransferase having different specificities for hexuronic acid adjacent to the targeted N-sulfoglucosamine. J Biol Chem 275, 2859–2868 (2000). [DOI] [PubMed] [Google Scholar]
- 29.Shworak NW et al. Molecular cloning and expression of mouse and human cDNAs encoding heparan sulfate D-glucosaminyl 3-O-sulfotransferase. J Biol Chem 272, 28008–19 (1997). [DOI] [PubMed] [Google Scholar]
- 30.Tian S et al. Genome-wide CRISPR screens for Shiga toxins and ricin reveal Golgi proteins critical for glycosylation. PLoS Biol 16, e2006951 (2018). [DOI] [PMC free article] [PubMed] [Google Scholar]
- 31.Labeau A et al. A Genome-Wide CRISPR-Cas9 Screen Identifies the Dolichol-Phosphate Mannose Synthase Complex as a Host Dependency Factor for Dengue Virus Infection. J Virol 94(2020). [DOI] [PMC free article] [PubMed] [Google Scholar]
- 32.Bassaganyas L et al. New factors for protein transport identified by a genome-wide CRISPRi screen in mammalian cells. J Cell Biol 218, 3861–3879 (2019). [DOI] [PMC free article] [PubMed] [Google Scholar]
- 33.Klose RJ, Kallin EM & Zhang Y JmjC-domain-containing proteins and histone demethylation. Nat Rev Genet 7, 715–27 (2006). [DOI] [PubMed] [Google Scholar]
- 34.Nagamine S et al. Organ-specific Sulfation Patterns of Heparan Sulfate Generated by Extracellular Sulfatases Sulf1 and Sulf2 in Mice. J Biol Chem 287, 9579–90 (2012). [DOI] [PMC free article] [PubMed] [Google Scholar]
- 35.Lamanna WC et al. Heparan sulfate 6-O-endosulfatases: discrete in vivo activities and functional co-operativity. Biochem J 400, 63–73 (2006). [DOI] [PMC free article] [PubMed] [Google Scholar]
- 36.Miller RL et al. Shotgun ion mobility mass spectrometry sequencing of heparan sulfate saccharides. Nat Commun 11, 1481 (2020). [DOI] [PMC free article] [PubMed] [Google Scholar]
- 37.Wu J et al. Sequencing Heparan Sulfate Using HILIC LC-NETD-MS/MS. Anal Chem 91, 11738–11746 (2019). [DOI] [PMC free article] [PubMed] [Google Scholar]
- 38.Wei J et al. Characterization and Quantification of Highly Sulfated Glycosaminoglycan Isomers by Gated-Trapped Ion Mobility Spectrometry Negative Electron Transfer Dissociation MS/MS. Anal Chem 91, 2994–3001 (2019). [DOI] [PMC free article] [PubMed] [Google Scholar]
- 39.Wang Y et al. KDM2B overexpression correlates with poor prognosis and regulates glioma cell growth. Onco Targets Ther 11, 201–209 (2018). [DOI] [PMC free article] [PubMed] [Google Scholar]
- 40.Zheng Q et al. Histone demethylase KDM2B promotes triple negative breast cancer proliferation by suppressing p15INK4B, p16INK4A, and p57KIP2 transcription. Acta Biochim Biophys Sin (Shanghai) 50, 897–904 (2018). [DOI] [PubMed] [Google Scholar]
- 41.Tzatsos A et al. Lysine-specific demethylase 2B (KDM2B)-let-7-enhancer of zester homolog 2 (EZH2) pathway regulates cell cycle progression and senescence in primary cells. J Biol Chem 286, 33061–9 (2011). [DOI] [PMC free article] [PubMed] [Google Scholar]
- 42.Galbiati A et al. Epigenetic up-regulation of ribosome biogenesis and more aggressive phenotype triggered by the lack of the histone demethylase JHDM1B in mammary epithelial cells. Oncotarget 8, 37091–37103 (2017). [DOI] [PMC free article] [PubMed] [Google Scholar]
- 43.Kuang Y et al. Histone demethylase KDM2B upregulates histone methyltransferase EZH2 expression and contributes to the progression of ovarian cancer in vitro and in vivo. Onco Targets Ther 10, 3131–3144 (2017). [DOI] [PMC free article] [PubMed] [Google Scholar]
- 44.Zhao E et al. Inhibition of cell proliferation and induction of autophagy by KDM2B/FBXL10 knockdown in gastric cancer cells. Cell Signal 36, 222–229 (2017). [DOI] [PubMed] [Google Scholar]
- 45.Kottakis F et al. FGF-2 regulates cell proliferation, migration, and angiogenesis through an NDY1/KDM2B-miR-101-EZH2 pathway. Mol Cell 43, 285–98 (2011). [DOI] [PMC free article] [PubMed] [Google Scholar]
- 46.Andricovich J, Kai Y, Peng W, Foudi A & Tzatsos A Histone demethylase KDM2B regulates lineage commitment in normal and malignant hematopoiesis. J Clin Invest 126, 905–20 (2016). [DOI] [PMC free article] [PubMed] [Google Scholar]
- 47.Ye B et al. LncKdm2b controls self-renewal of embryonic stem cells via activating expression of transcription factor Zbtb3. EMBO J 37(2018). [DOI] [PMC free article] [PubMed] [Google Scholar]
- 48.Bracken AP, Dietrich N, Pasini D, Hansen KH & Helin K Genome-wide mapping of Polycomb target genes unravels their roles in cell fate transitions. Genes Dev 20, 1123–36 (2006). [DOI] [PMC free article] [PubMed] [Google Scholar]
- 49.Lawrence R, Lu H, Rosenberg RD, Esko JD & Zhang L Disaccharide structure code for the easy representation of constituent oligosaccharides from glycosaminoglycans. Nat Methods 5, 291–292 (2008). [DOI] [PubMed] [Google Scholar]
- 50.Spahn PN et al. PinAPL-Py: A comprehensive web-application for the analysis of CRISPR/Cas9 screens. Sci Rep 7, 15854 (2017). [DOI] [PMC free article] [PubMed] [Google Scholar]
- 51.Bolger AM, Lohse M & Usadel B Trimmomatic: a flexible trimmer for Illumina sequence data. Bioinformatics 30, 2114–20 (2014). [DOI] [PMC free article] [PubMed] [Google Scholar]
- 52.Dobin A et al. STAR: ultrafast universal RNA-seq aligner. Bioinformatics 29, 15–21 (2013). [DOI] [PMC free article] [PubMed] [Google Scholar]
- 53.Anders S, Pyl PT & Huber W HTSeq--a Python framework to work with high-throughput sequencing data. Bioinformatics 31, 166–9 (2015). [DOI] [PMC free article] [PubMed] [Google Scholar]
- 54.Langmead B & Salzberg SL Fast gapped-read alignment with Bowtie 2. Nat Methods 9, 357–9 (2012). [DOI] [PMC free article] [PubMed] [Google Scholar]
- 55.Heinz S et al. Simple combinations of lineage-determining transcription factors prime cis-regulatory elements required for macrophage and B cell identities. Mol Cell 38, 576–89 (2010). [DOI] [PMC free article] [PubMed] [Google Scholar]
- 56.Banito A et al. The SS18-SSX Oncoprotein Hijacks KDM2B-PRC1.1 to Drive Synovial Sarcoma. Cancer Cell 34, 346–348 (2018). [DOI] [PMC free article] [PubMed] [Google Scholar]
- 57.Zhang X, Ong C, Su G, Liu J & Xu D Characterization and engineering of S100A12-heparan sulfate interactions. Glycobiology 30, 463–473 (2020). [DOI] [PMC free article] [PubMed] [Google Scholar]
- 58.Lawrence R et al. Evolutionary differences in glycosaminoglycan fine structure detected by quantitative glycan reductive isotope labeling. J Biol Chem 283, 33674–33684 (2008). [DOI] [PMC free article] [PubMed] [Google Scholar]
- 59.Kreuger J, Lindahl U & Jemth P Nitrocellulose filter binding to assess binding of glycosaminoglycans to proteins. Methods Enzymol 363, 327–39 (2003). [DOI] [PubMed] [Google Scholar]
Associated Data
This section collects any data citations, data availability statements, or supplementary materials included in this article.
Supplementary Materials
Data Availability Statement
Any data generated or analyzed during this study, associated protocols, materials within the manuscript, and public databases (GSE163162, GSE145789) are included in the article and related supplementary information or are available from the corresponding author.