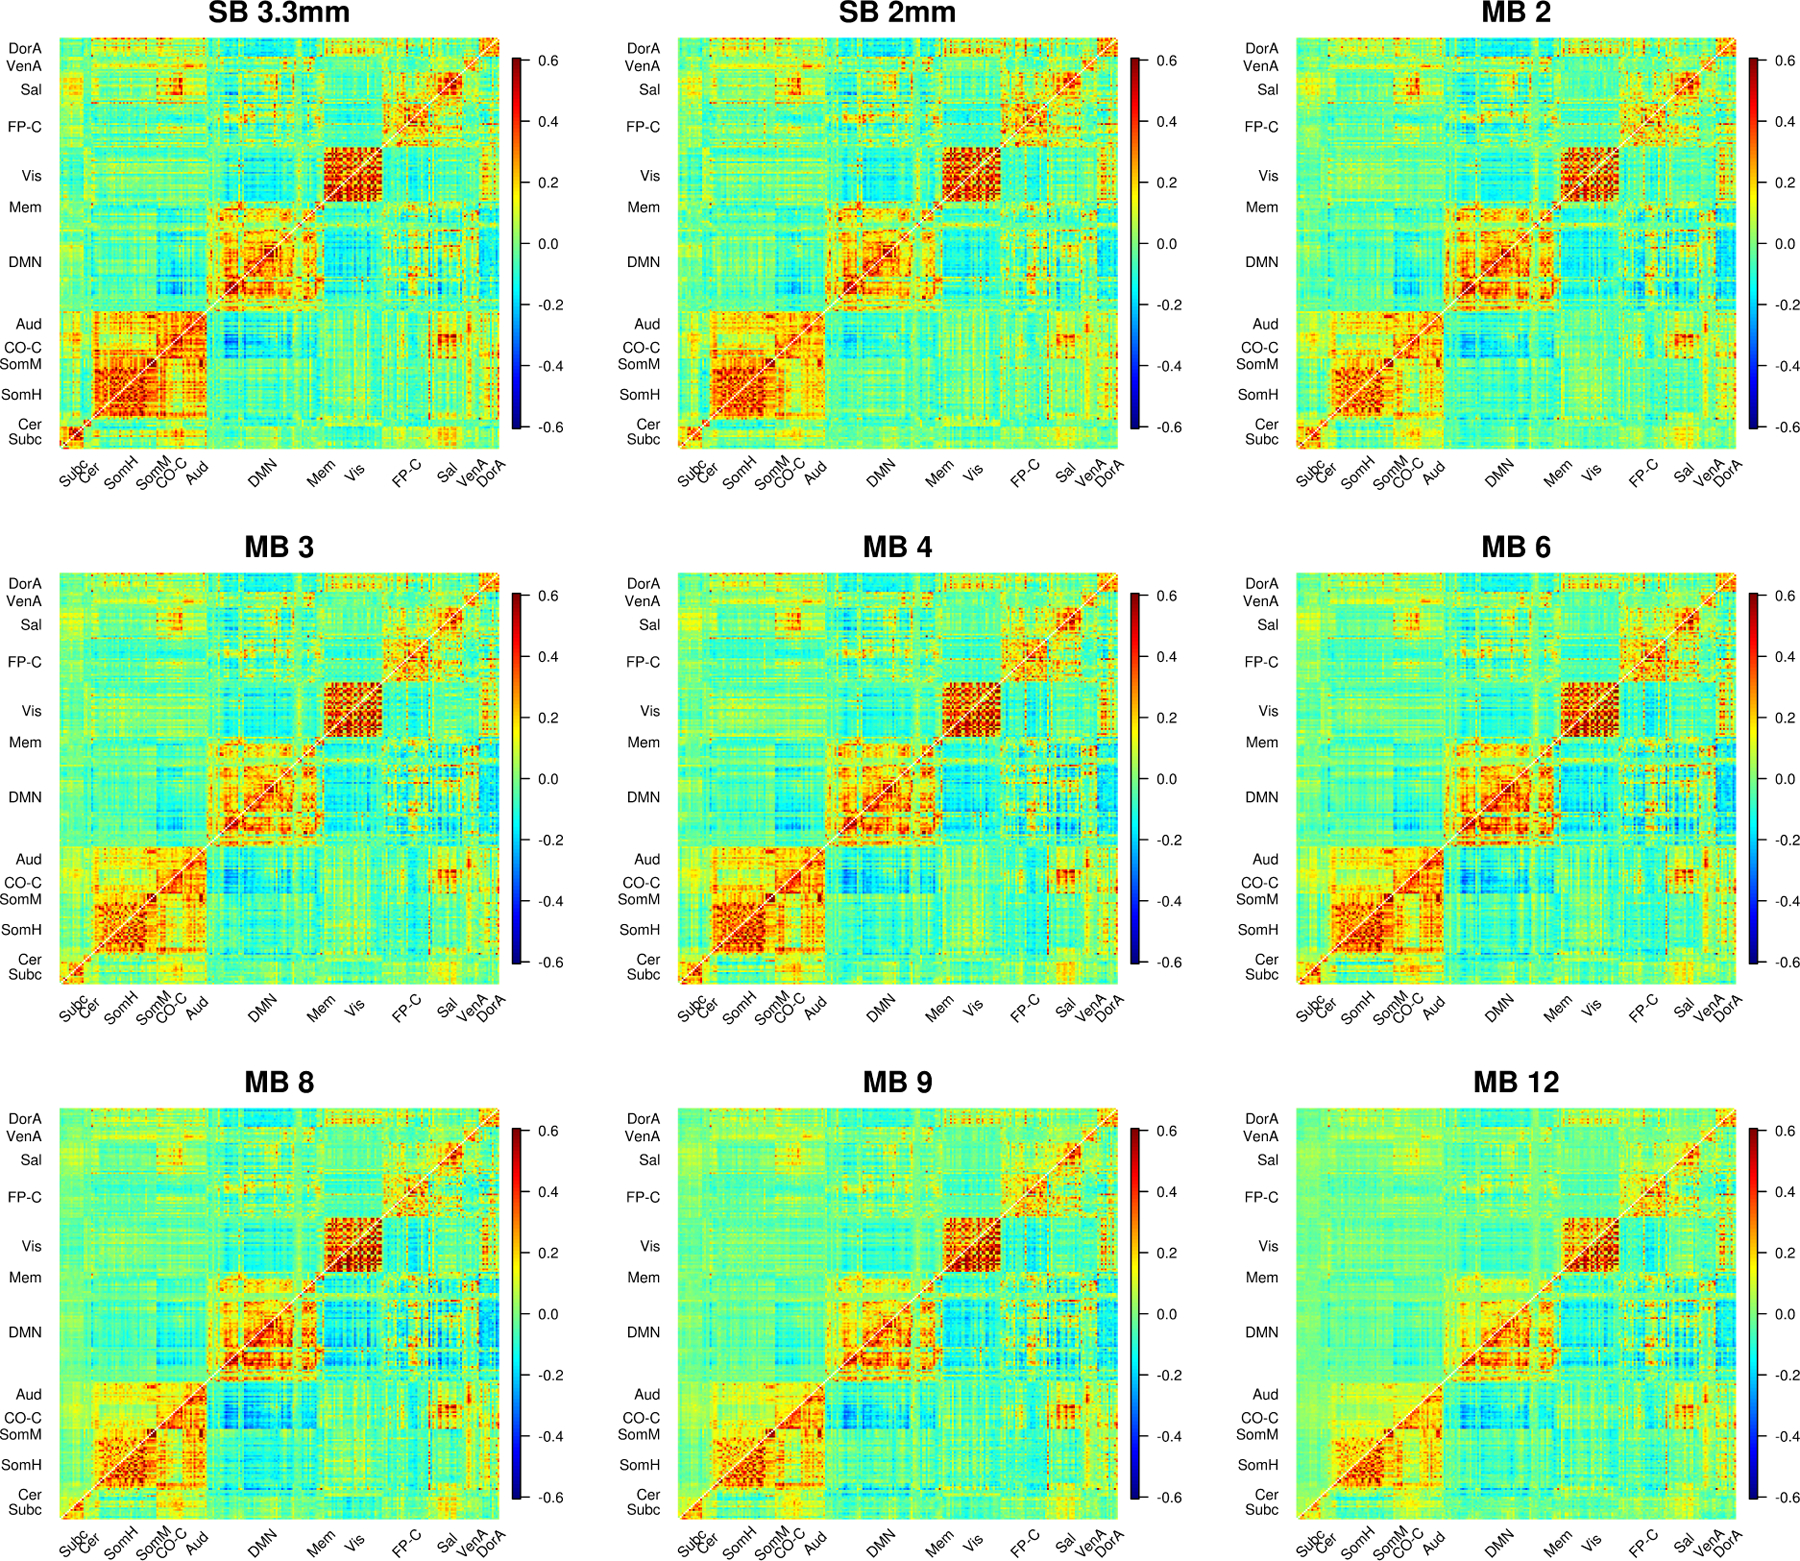
Figure 6:

Average correlations (Fisher z-transformed) for SB and MB acquisitions. 9p processing is above the diagonal and 9p+bandpass below. In 9p, the effects of acceleration differ across space, e.g., we see smaller correlations involving salience, auditory, cingulo-opercular task control, and subcortical regions in MB 12 than MB 4; a close inspection reveals MB 8 also tends to be lower than MB 4 in these edges. In contrast, correlations are more comparable within the visual system across most acquisitions. In 9p+bandpass, the correlations across MB factor are more similar (below diagonal). Web Supplement Figure S.8 depicts a zoomed in version of subcortical and cerebellar edges that more clearly illustrates lower correlations at higher MB factors for these regions. Web Supplement S.9 and S.10 illustrate impacts on edges that are expected to have positive correlations.
