Abstract
Cell death can be executed by regulated apoptotic and non-apoptotic pathways, including the iron-dependent process of ferroptosis. Small molecules are essential tools for studying the regulation of cell death. Using time-lapse imaging, and a library of 1,833 bioactive compounds, we assembled a large compendium of kinetic cell death modulatory profiles for inducers of apoptosis and ferroptosis. From this dataset we identify dozens of ferroptosis suppressors, including numerous compounds that appear to act via cryptic off-target antioxidant or iron chelating activities. We show that the FDA-approved drug bazedoxifene acts as a potent radical trapping antioxidant inhibitor of ferroptosis both in vitro and in vivo. ATP-competitive mechanistic target of rapamycin (mTOR) inhibitors, by contrast, are on-target ferroptosis inhibitors. Further investigation revealed both mTOR-dependent and mTOR-independent mechanisms that link amino acid metabolism to ferroptosis sensitivity. These results highlight kinetic modulatory profiling as a useful tool to investigate cell death regulation.
Introduction
Cell death can be executed by apoptosis or one of several non-apoptotic cell death mechanisms, including ferroptosis. Ferroptosis can be triggered by blocking the uptake of cystine by the system xc− cystine/glutamate antiporter1. Loss of cystine uptake leads to depletion of intracellular reduced glutathione (GSH), starving the phospholipid hydroperoxidase glutathione peroxidase 4 (GPX4) of its essential cofactor. Ultimately, GPX4 inactivation allows for iron-dependent accumulation of lipid hydroperoxides to lethal levels within the cell2. Many pathophysiological processes involve the induction of ferroptosis3,4. It is therefore of interest to better understand how ferroptosis is regulated and identify inhibitors of this process suitable for use in vivo.
Small molecules are useful mechanistic probes of cell death5. Apart from the intended target, small molecules can have off-target effects on other proteins or processes. Careful analysis of off-target effects can point to unexpected mechanisms of action and new drug repurposing opportunities6,7. Drug repurposing typically focuses on off-target modulation of protein function. However, compounds can also have direct chemical reactivities that may also be of interest, especially in the context of ferroptosis8,9. Systematic analysis of chemical reactivities, especially for existing drugs, could lead to unanticipated drug repurposing opportunities.
One powerful means to gain insight into cell death mechanisms is to examine how the phenotype of one lethal molecule is enhanced or suppressed (‘modulated’) by a second compound10. Modulatory profiling also has the potential to uncover new activators or inhibitors of a given cell death mechanism11. Here, we employ a direct time-lapse cell death imaging technique, scalable time-lapse analysis of cell death kinetics (STACK)12, to generate a large compendium of kinetic modulatory profiles for apoptosis and ferroptosis-inducing compounds. Interrogation of this compendium identified numerous small molecules, including the drug bazedoxifene, that inhibit ferroptosis via unanticipated chemical reactivities. By contrast, inhibitors of mechanistic target of rapamycin (mTOR) pathway can inhibit ferroptosis in an on-target manner. Investigating of the connection between mTOR signaling and ferroptosis also resulting in the discovery of an mTOR-independent mechanism linking amino acid levels to ferroptosis sensitivity.
Results
Kinetic modulatory profiling of cell death.
We developed a kinetic modulatory profiling approach to identify new modulators of apoptosis and ferroptosis (Fig. 1a, Supplementary Fig. 1a,b). HT-1080N fibrosarcoma cells were treated with one of eight different pro-apoptotic or pro-ferroptotic lethal ‘query’ compounds and simultaneously exposed to one of 1,833 different bioactive ‘modulator’ compounds or vehicle (DMSO), for a total of ~16,000 different conditions. Cell death in each condition was measured over time using STACK12. We computed the expected cell death for each query-modulator combination using the Bliss independence model13, and then determined the deviation between the expected and the observed cell death for each compound combination (Supplementary Fig. 1c,d). To facilitate an initial exploration of this dataset, z-scored deviation values were hierarchically clustered in an unsupervised manner across both query and modulator compounds and plotted as a heat map (Fig. 1b).
Figure 1. A kinetic modulatory profile.
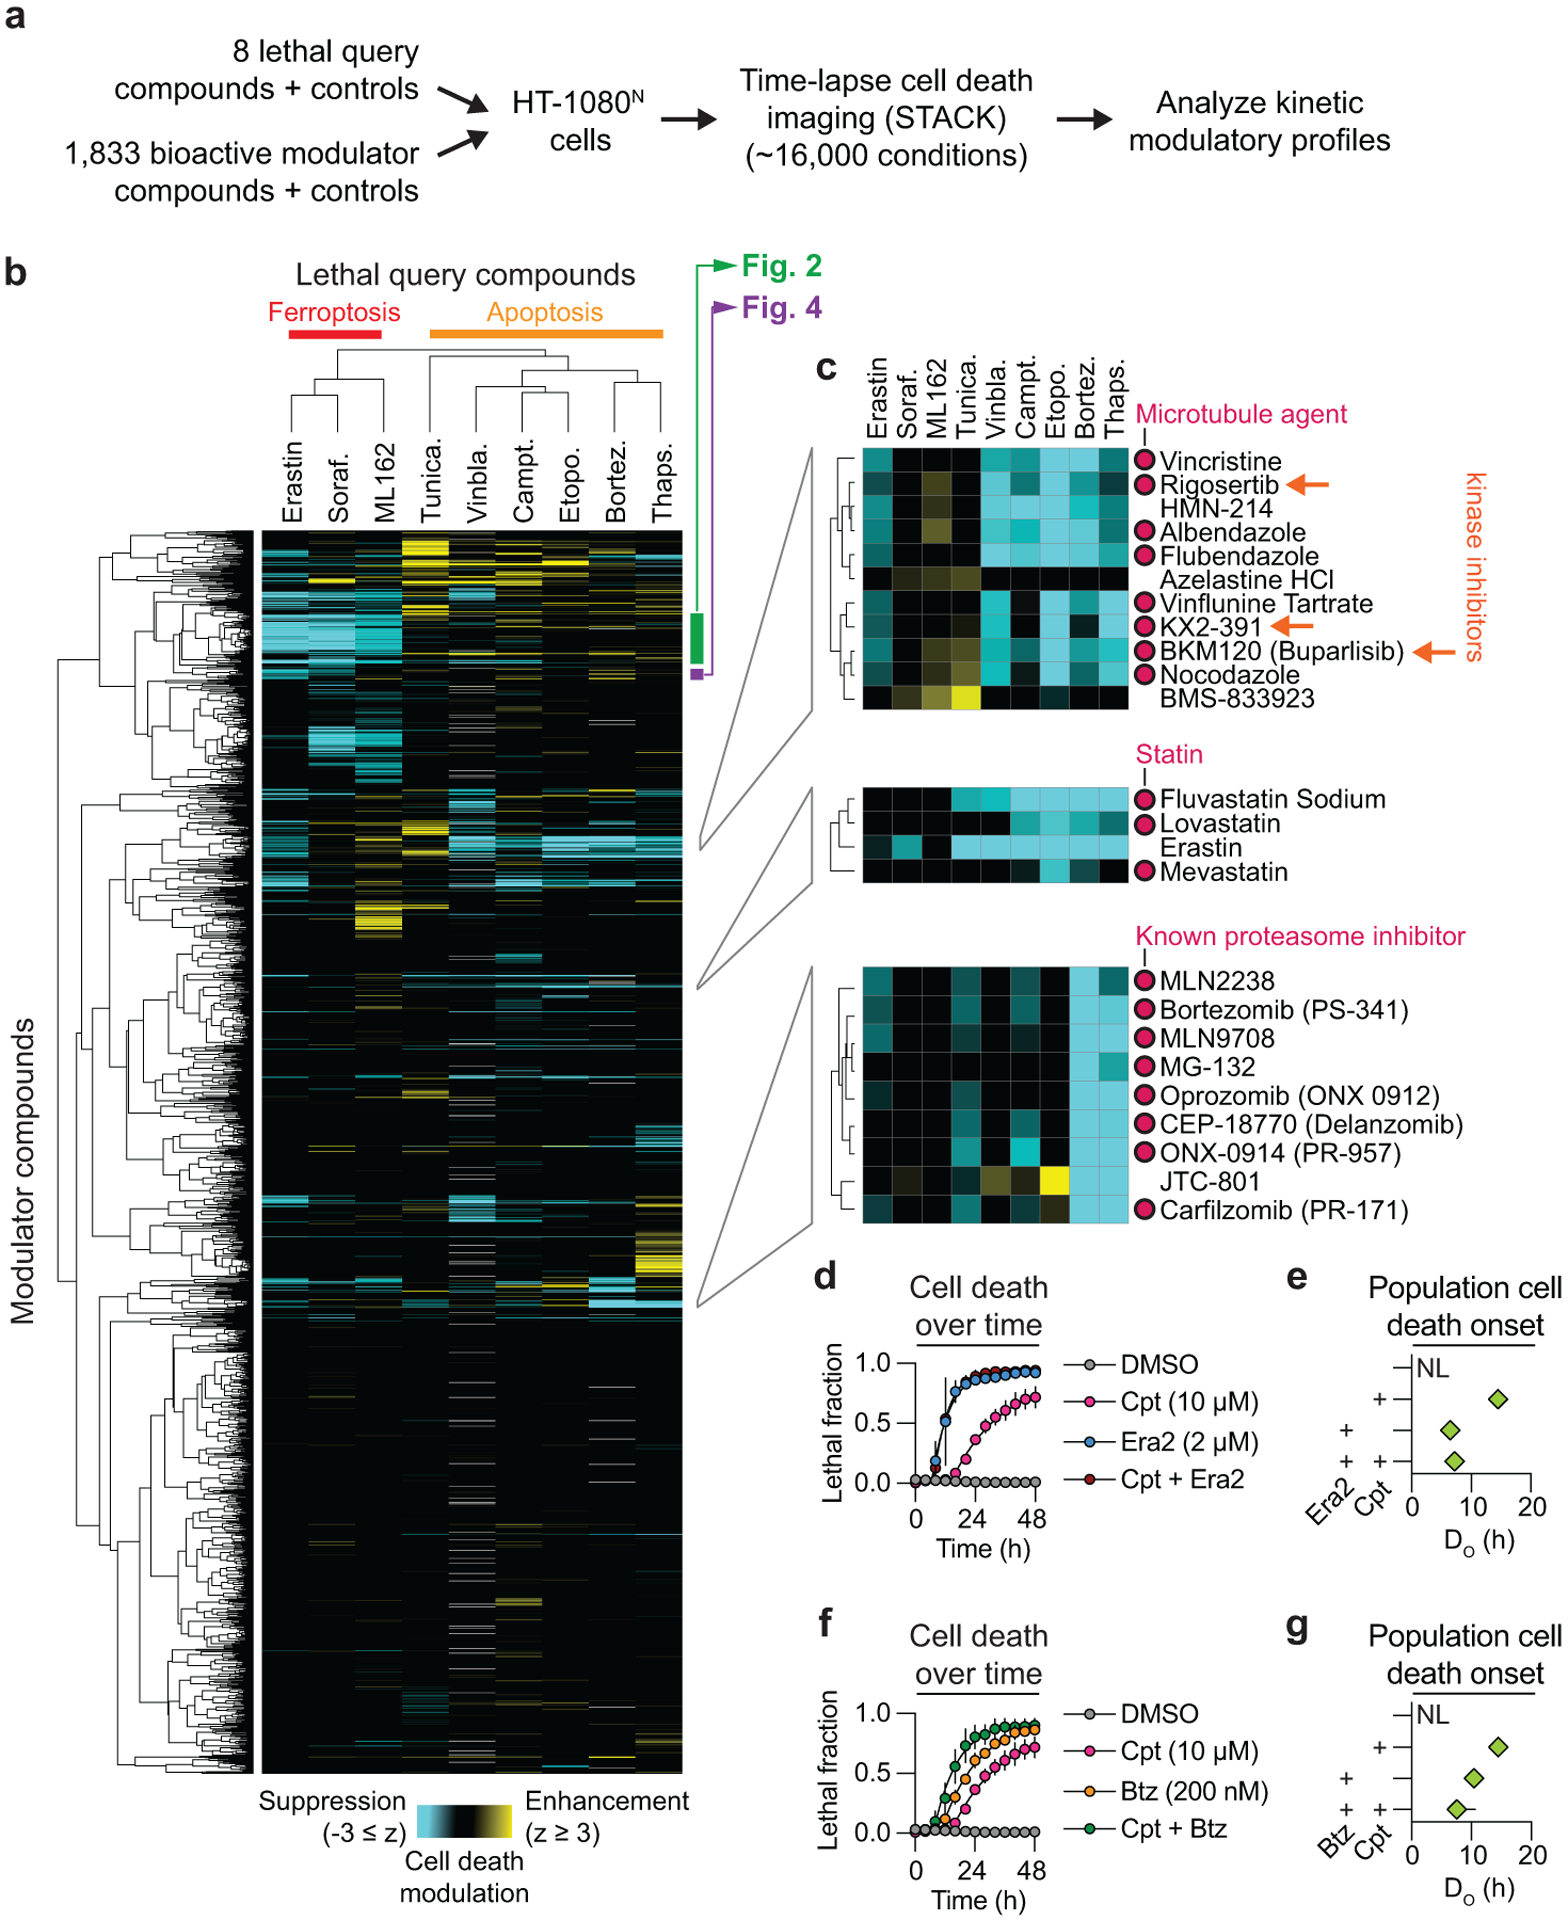
a, Overview of the kinetic modulatory profiling analysis and compendium generation. b, Deviation z-scores between the expected and observed effect of each compound combination in the compendium are plotted as a heat map. Grey cells indicate no data available. c, Three heatmap sub-clusters of interest. Orange arrows indicate kinase inhibitors that bind tubulin as off-targets. d, Cell death in HT-1080N cells as determined using STACK. Cpt: camptothecin, Era2: erastin2. e, Time of population cell death onset (DO)12 for treatments shown in d. NL: not lethal. f, Cell death in HT-1080N cells as determined using STACK. Btz: bortezomib. g, DO values for treatments shown in f. Note that the DMSO and Cpt data shown in d-g are from the same experiment. Results in d,f are mean ± SD from three independent experiments. Results in e,g are mean ± 95% confidence interval, derived from the curves in d and f, respectively.
Several features of this compendium were consistent with a high-quality dataset. First, the three ferroptosis-inducing query compounds and five apoptosis-inducing query compounds segregated into distinct clusters (Fig. 1c). Moreover, within the ferroptosis sub-cluster, the system xc− inhibitors erastin and sorafenib were more similar to each other than the GPX4 inhibitor ML162. This is consistent with ferroptosis induced by system xc− inhibition versus direct GPX4 inhibition having unique mechanisms of regulation14. Second, we observed functionally coherent clustering of modulator compounds. For example, eight known microtubule disrupting agents clustered together as modulators, including three kinase inhibitors (rigosertib, buparlisib and KX2–391) that directly inhibit tubulin polymerization in an off-target manner15–17 (Fig. 1c). In another example, erastin (also present as a modulator compound) clustered with the 3-hydroxy-3-methyl-glutaryl-coenzyme A reductase (HMGCR) inhibitors fluvastatin, lovastatin and mevastatin, consistent with inhibition of HMGCR promoting ferroptosis11,18 (Fig. 1c). In a final example, eight known proteasome inhibitors formed a distinct cluster (Fig. 1c). Interestingly, this cluster also contained the opioid receptor antagonist JTC-801, which can induce an unusual form of non-apoptotic cancer cell death19. Based on the observed clustering pattern, we hypothesized that JTC-801 inhibited proteasome function. Both JTC-801 and bortezomib induced cell death in HT-1080N cells with similar rapid kinetics that was only partially inhibited by a pan-caspase inhibitor (Extended Data Fig. 1a,b). However, only bortezomib stabilized the transcription factor NFE2L1/NRF1, whose levels are negatively regulated by the proteasome20 (Extended Data Fig. 1c). We infer than JTC-801 does not directly inhibit proteasome function, but possibly a related target that yields effects on cell death similar to proteasome inhibition.
Overall, the majority of compound combinations profiled as part of the compendium yielded no evidence for interaction. However, 295 combinations yielded apparent enhancing interactions (deviation z-scores ≥ 2), and 795 combinations resulted in apparent suppressing interactions (deviation z-scores ≤ −2). Among the apparent suppressing interactions were those between query and known lethal modulator compounds. These results may be explained in several ways. The Bliss model of drug interaction assumes distinct compound mechanisms of action13. Thus, trivially, combining a lethal compound with itself or a different compound with the same target results in less cell death than expected mathematically. This explains the apparent suppressive interactions between bortezomib (query) with itself and other proteasome inhibitors (modulators), and between vinblastine (query) with other microtubule disrupting agents (modulators) (Fig. 1b).
Other apparent suppressive interactions between lethal compounds may be explained by kinetic single agent dominance21, when one fast-acting lethal compound kills cells before a more slowly acting lethal compound has a chance to act. This phenomenon could explain the apparent suppressive interaction between erastin and camptothecin (Fig. 1c). In follow up experiments, the erastin analog erastin2 consistently initiated cell death ~8 h earlier than camptothecin, such that camptothecin may not have time to act before the induction of ferroptosis has already committed cells to death via this pathway (Fig. 1d,e). Kinetic single agent dominance21 may also be facilitated when different inducers of cell death activate distinct cell death mechanisms. Indeed, the combination of bortezomib and camptothecin, which both trigger apoptosis, yielded less evidence for single agent dominance (Fig. 1f,g). However, these compound interactions can be difficult to tease apart, especially when two lethal compounds both induce cell death so rapidly that little additional headroom is available to further accelerate cell death within the population, as observed for erastin2 and bortezomib (Extended Data Fig. 1d,e).
While many apparent suppressing interactions between lethal compounds are best explained by mathematical or kinetic phenomena, two lethal compounds could also exhibit apparent suppressing interactions in the compendium due to true mechanistic interference between cell death mechanisms. For example, we observed an apparent suppressing interaction in the compendium between the sarco/endoplasmic reticulum Ca²⁺-ATPase inhibitor thapsigargin (query) and erastin (modulator) (Fig. 1c). We confirmed in two additional cell lines that thapsigargin attenuated ferroptosis in response to erastin2, but not in response to direct GPX4 inhibition, suggesting a specific mechanism of cell death interference (Extended Data Fig. 1f). Understanding the nature of this and other mechanisms of cell death interference will require detailed characterization. Further analysis of the compendium using alternative metrics (e.g. Loewe additivity) to predict expected compound interactions may also yield a distinct set of predicted interactions. Nonetheless, the functionally coherent clustering observed here for both query and modulator compounds suggests the present approach is suitable for kinetic modulatory profiles.
Exploration of ferroptosis suppressor clusters.
Within the compendium, our attention was attracted to a cluster of 48 modulator compounds that had apparent suppressing interactions with all three ferroptosis-inducing compounds (Fig. 2a). Compounds in this cluster included known radical trapping antioxidant (RTA) inhibitors of ferroptosis, including ferrostatin-1 (Fer-1), phenothiazine, and carvedilol1,8,22,23. This cluster also contained the MEK1/2 inhibitor U0126, which also likely acts as an RTA ferroptosis inhibitor24 (Supplementary Fig. 2,3). These compounds were not lethal themselves, and so the apparent suppressive interactions observed here appeared more likely to reflect true mechanistic inhibition of cell death. Other compounds in this cluster had diverse structures and annotated targets, including the NF-κB pathway (JSH-23), sphingosine kinase (SKI II), and vascular endothelial growth factor receptor (linifanib). Structurally, many of these compounds contained conjugated primary or secondary amines reminiscent of Fer-1 (Fig. 2b). Several of these compounds were also outliers in their ability to suppress ferroptosis compared to other members of the same compound family, hinting at cryptic off-target activities (Extended Data Fig. 2a). Accordingly, we hypothesized that this cluster was enriched for RTA ferroptosis inhibitors.
Figure 2. Analysis of ferroptosis suppressor clusters.
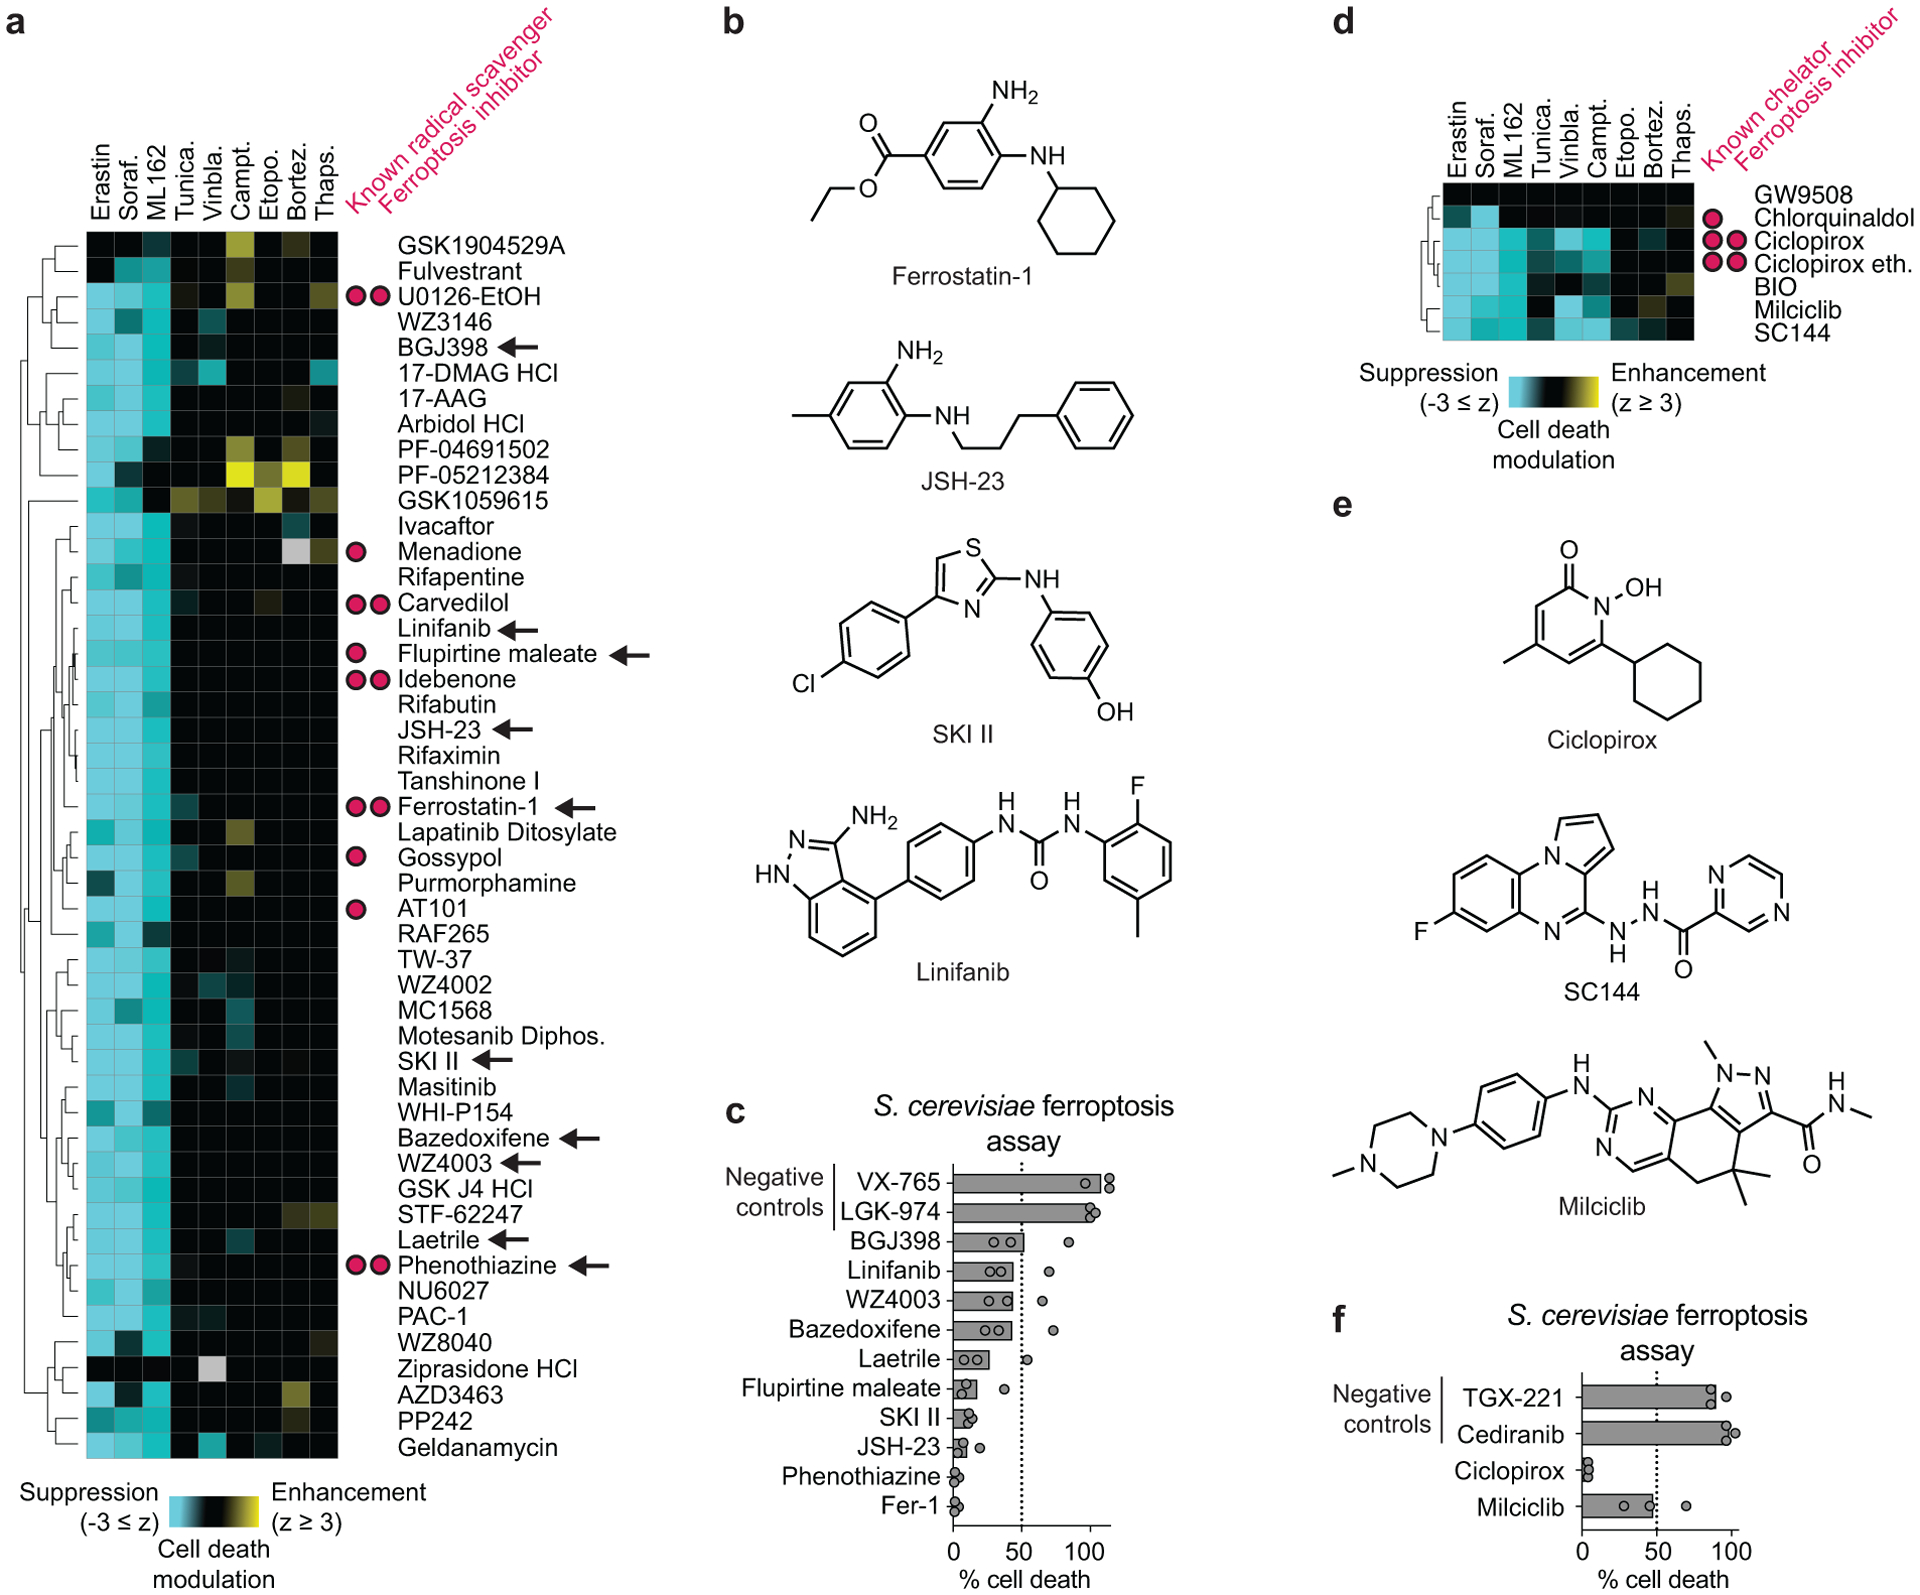
a, A cluster of ferroptosis suppressors (green bar in Fig. 1b) contains many known radical scavengers. b, Structures for select compounds found within the cluster in a. c, Effect of select compounds from the cluster in a (black arrows) on cell death in an S. cerevisiae model of ferroptosis. VX-765 and LGK-974 were randomly selected negative control compounds. d, A distinct cluster of ferroptosis suppressors containing known iron chelators. e, Structures for select compounds found within the cluster in d. f, Effect of select compounds from the cluster in d on cell death in an S. cerevisiae model of ferroptosis. TGX-221 and cediranib were randomly selected negative control compounds. Results in c and f are from three independent experiments.
To test this hypothesis, we examined the ability of eight structurally and functionally distinct compounds found within this cluster (BGJ398, linifanib, bazedoxifene, WZ4003, laetrile, flurpitine maleate, SKI II, and JSH-23) to suppress ferroptosis-like cell death in an S. cerevisiae-based assay25. This assay exploits the fact that yeast cells unable to synthesize the endogenous antioxidant CoQ6 are hypersensitized to the lethal effects of the polyunsaturated fatty acid α-linolenic acid (Supplementary Fig. 4). We previously showed that death in this model is suppressed by Fer-1 and other ferroptosis-specific inhibitors25. We reasoned that this model would also be useful for assessing potential compound off-target effects, as S. cerevisiae does not express orthologs for many compound targets (e.g. NF-κB, vascular endothelial growth factor receptor). We observed that all eight test compounds, along with two positive control RTAs (Fer-1, phenothiazine), substantially inhibited cell death in this model, while two randomly selected library compounds (VX-765, LGK-974) did not (Fig. 2c). These results are consistent with these compounds inhibiting ferroptosis through off-target chemical reactivities.
In addition to putative RTAs, we observed a distinct cluster of structurally-distinct pan-ferroptosis suppressors centered on the iron chelator ciclopirox1 (Fig. 2d,e). This cluster included the CD130/GP130 inhibitor SC144, which can induce a transcriptional response similar to ciclopirox26. We subsequently found that SC144 suppressed ferroptosis in HT-1080 cells treated with erastin2 or ML162 with sub-micromolar potency, similar to ciclopirox (Extended Data Fig. 2b). These findings suggested that this cluster may represent iron chelating compounds. The cyclin dependent kinase inhibitor milciclib was a novel predicted chelator found in this cluster. Consistent with this possibility, milciclib partially blocked cell death in the S. cerevisiae-based ferroptosis assay while two randomly selected library compounds did not (Fig. 2f). It remains possible that milciclib, and other compounds assayed in the compendium and yeast model, inhibit ferroptosis by inhibiting protein function. However, an equally compelling explanation for our results was that these structurally diverse compounds possess cryptic RTA and iron chelating activities that enable these molecules to suppress ferroptosis in distinct cellular models.
Cell-free profiling identifies ferroptosis inhibitors.
Given the above results, we sought to more systematically examine compound RTA and iron chelator chemical reactivities. Towards this end, we tested all 1,833 compounds in our library in the 2,2-diphenyl-1-picrylhydrazyl (DPPH) free radical scavenging assay1 and the ferrozine Fe2+ binding assay27 in a high-throughput format. 95 and 117 compounds reduced signal by ≥ 50% in the DPPH and ferrozine assays, respectively (Extended Data Fig. 3a). Thus, ~5% of all library compounds examined here showed evidence for off-target chemical reactivities potentially impacting ferroptosis.
We subsequently focused on the 95 compounds identified in the DPPH assay, plus five additional compounds just above the arbitrary 50% DPPH signal inhibition threshold. Overall, 43, 11, and 6 of these compounds suppressed erastin2-induced ferroptosis by at least 80% when tested in HT-1080N cells at 50 μM, 5 μM, and 0.5 μM, respectively (Fig. 3a). The six most potent compounds (Fer-1, SKI II, phenothiazine, JNJ-26854165, AZD3463, and bazedoxifene) all suppressed erastin2 and ML162-induced ferroptosis with sub-150 nM potency in confirmatory dose-response experiments, with Fer-1, phenothiazine, and bazedoxifene emerging as the most potent compounds in this analysis (Supplementary Table 1). Fer-1, phenothiazine, and bazedoxifene were also found in the large cluster of pan-ferroptosis suppressors identified in the compendium, and inhibited cell death the S. cerevisiae-based ferroptosis assay (Fig. 2c). The congruent cell-free and cell-based results for these compounds appeared most consistent with an RTA mechanism of ferroptosis inhibition.
Figure 3. Widespread bioactive compound antioxidant and iron chelating activity.
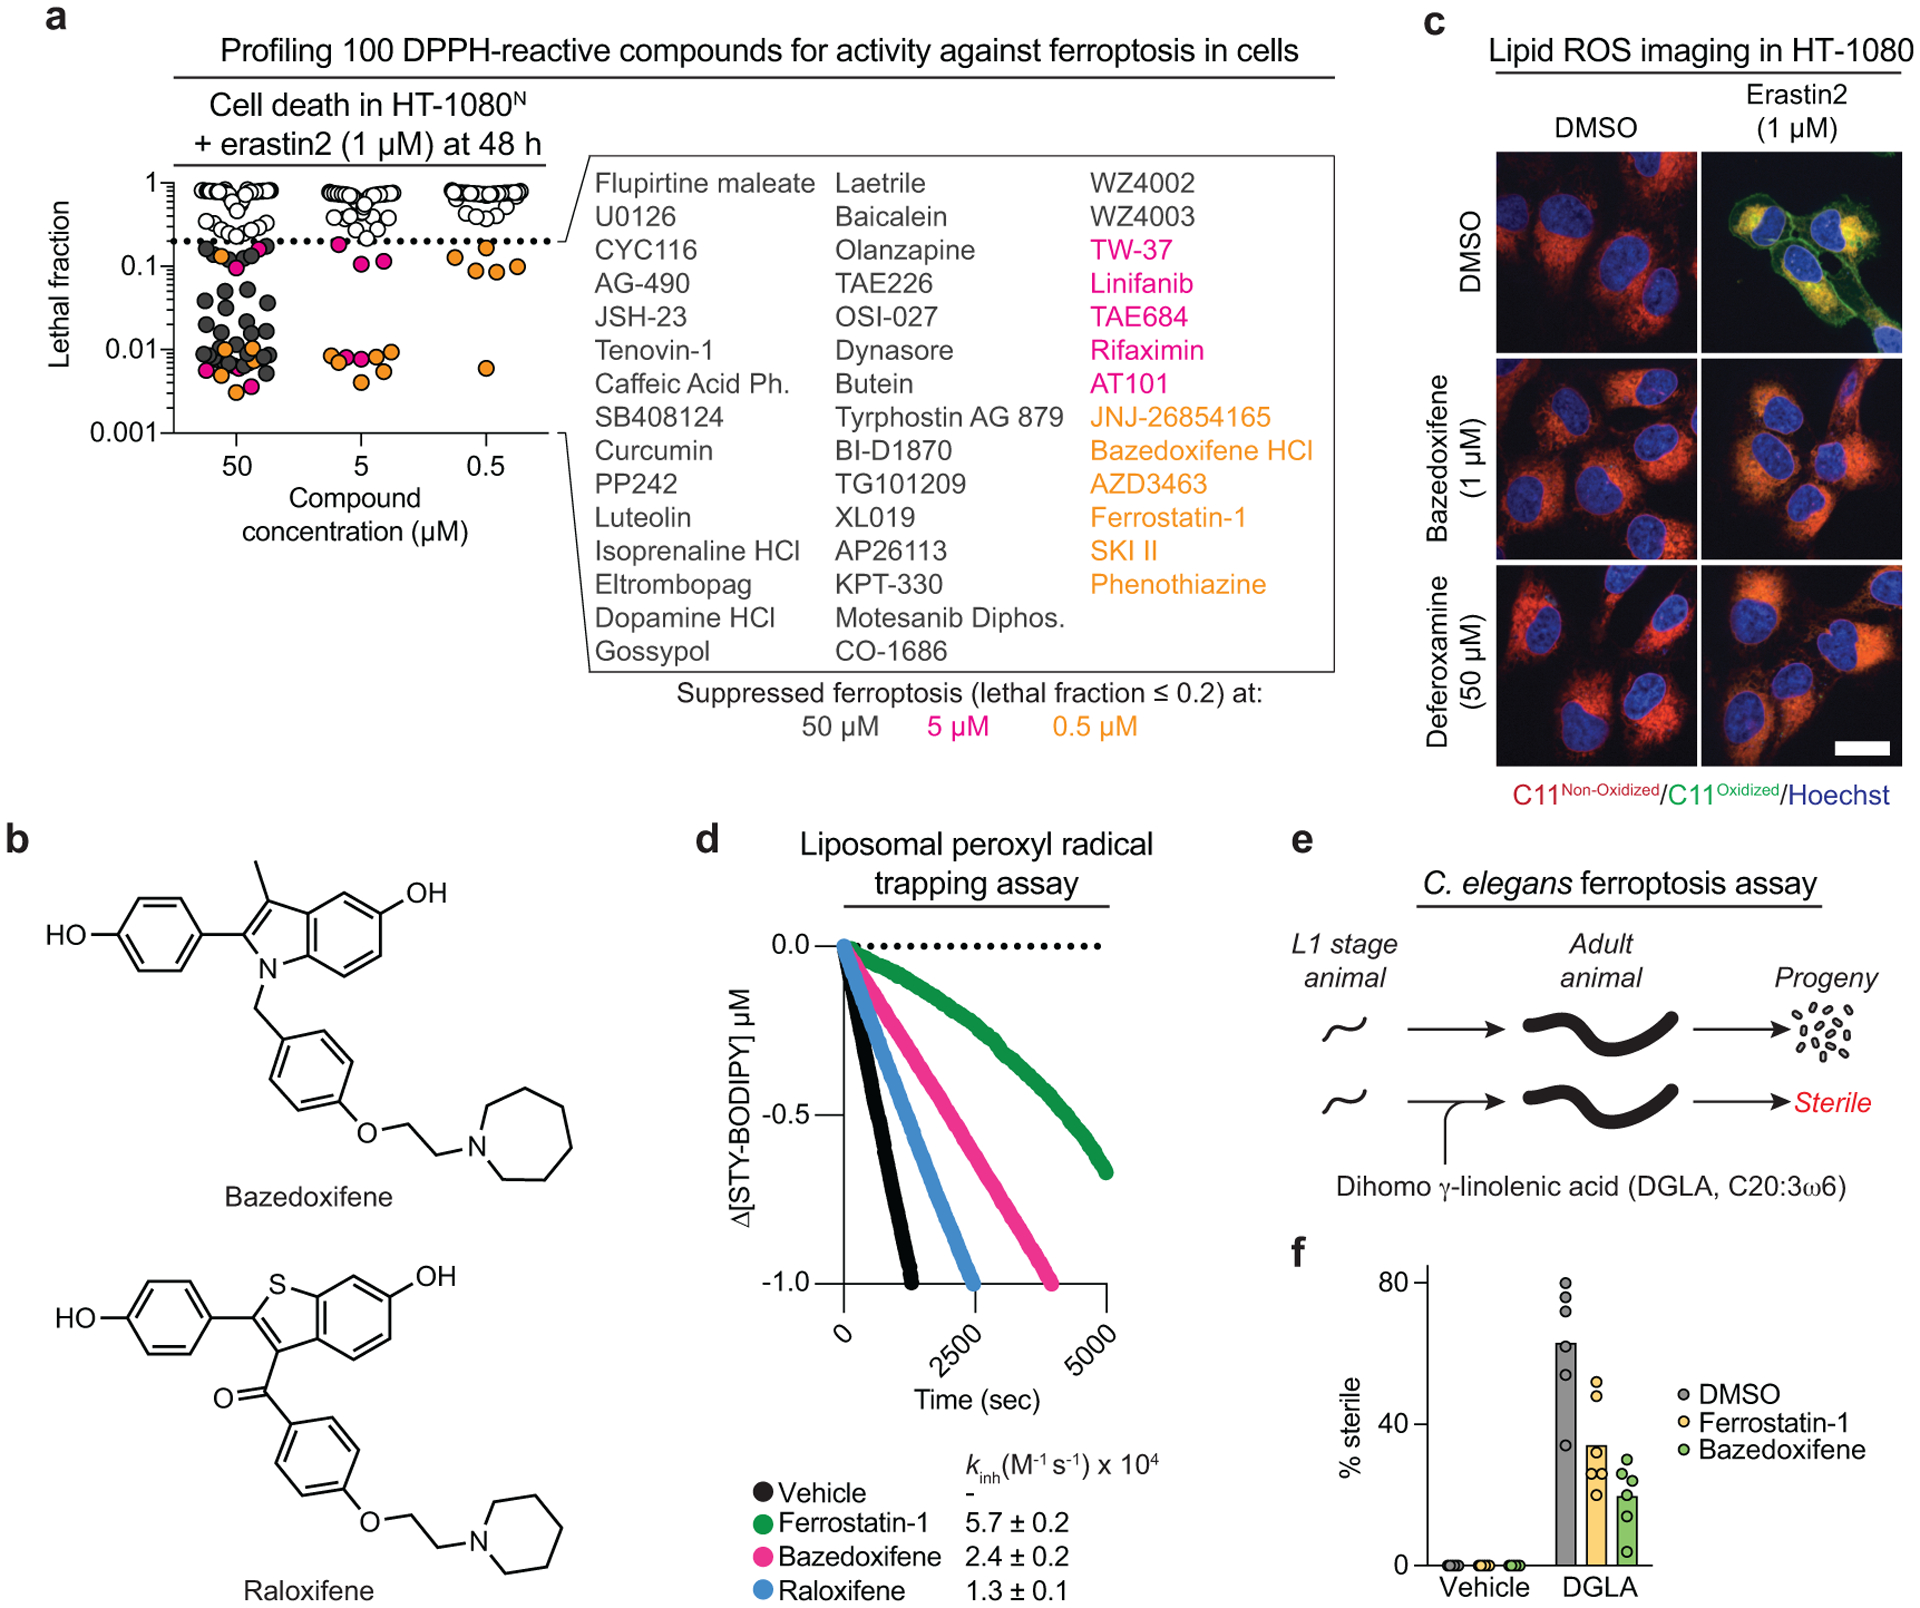
a, Cell death in cells co-treated with erastin2 and 100 different compounds that scored positively in the cell-free DPPH assay as determined using STACK. The 43 compounds that suppressed cell death by > 80% are listed, color coded by potency. Ph.: phenethyl ester; Diphos.: diphosphate. b, Structures of bazedoxifene and raloxifene. c, Lipid ROS detected using C11 BODIPY 581/591 (C11) in HT-1080 cells following 11 h treatment. Scale bar = 20 μm. Representative images from two independent experiments are shown. d, Kinetic competition arising in the inhibited co-autoxidation of egg-phosphatidylcholine (1 mM) and STY-BODIPY (10 μM) initiated with 0.2 mM di-tert-undecyl hyponitrite (DTUN). Inhibitors were used at 2 μM. Average inhibition rate constants (kinh) determined assuming a reaction stoichiometry (n) of unity. e, Outline of a C. elegans model of ferroptosis. f, Sterile animals ± DGLA (0.13 mM) ± inhibitors (150 μM). Each datapoint represents the mean for one independent experiment (n ≈ 50 worms/experiment).
Many compounds examined above scored highly in the cell-free DPPH assay yet did not inhibit ferroptosis in cells, even when tested at 50 μM (Extended Data Fig. 3b). We hypothesized that partitioning into lipid environments might be a crucial determinant of compound activity in cells1. Consistent with this hypothesis, across all 100 compounds ferroptosis suppression correlated with higher predicted lipophilicity and lower predicted water solubility (Extended Data Fig. 3b). Notably, ferroptosis suppression in cells did not correlate with cell-free DPPH radical scavenging (Extended Data Fig. 3b). This may be explained by differences in the nature of the lipid radicals formed in cell membranes during ferroptosis versus the stable DPPH radical in solution28. Thus, while the DPPH assay can detect candidate RTAs, this is not sufficient to ensure the ability to suppress ferroptosis in the cellular environment.
Bazedoxifene is an RTA ferroptosis inhibitor.
Bazedoxifene is a third-generation selective estrogen receptor (ER) modulator (SERM) approved drug for the treatment of post-menopausal osteoporosis29 (Fig. 3b). We elected to characterize the ability of this compound to inhibit ferroptosis in greater detail given the possibility that this approved drug could be repurposed for ferroptosis inhibition in vivo. Much like the positive control Fer-1, bazedoxifene suppressed lipid ROS accumulation in erastin2-treated HT-1080 cells, potentially accounting for how this compound inhibited ferroptosis (Fig. 3c). Several lines of evidence suggested that suppression of lipid ROS accumulation and ferroptosis were not explained by modulation of estrogen receptor function. First, out of 29 estrogen or progesterone receptor modulators profiled in the compendium, only bazedoxifene and the structurally related SERM raloxifene appreciably suppressed ferroptosis (Extended Data Fig. 2a). Second, the ability of bazedoxifene to suppress erastn2-induced ferroptosis was not altered by co-treatment with the ER antagonist 17β-estradiol, which has a ~10-fold greater affinity for ER than bazedoxifene30 (Extended Data Fig. 4a). Third, bazedoxifene potently suppressed ferroptosis in MDA-MB-231, E0771, and 4T1 breast cancer cell lines which do not express the estrogen receptor31 (Extended Data Fig. 4b,c).
Given the totality of our previous results, we hypothesized that bazedoxifene inhibited ferroptosis by acting as an RTA. Consistent with this, bazedoxifene trapped phospholipid-derived peroxyl radicals in a liposome-based, hyponitrite-initiated co-autoxidation assay28 almost as effectively as the positive control Fer-1 (kinh of 2.4×10⁴ M−1s−1 versus 5.7×10⁴ M−1s−1) (Fig. 3d, Extended Data Fig. 4d). Compared to bazedoxifene, raloxifene was a less potent inhibitor of erastin2-induced ferroptosis in HT-1080 cells and this correlated with weaker phospholipid-derived peroxyl radical trapping (kinh = 1.3×10⁴ M−1s−1) (Fig. 3b,d). These results are consistent with bazedoxifene inhibiting ferroptosis by acting as a RTA, and we propose that the greater potency of bazedoxifene relative to raloxifene may be due to the weaker O-H bond in the 5-hydroxyindole moiety in bazedoxifene compared to the 6-hydroxybenzothiophene moiety in raloxifene.
To examine whether bazedoxifene could suppress ferroptosis in vivo we employed a new C. elegans-based animal model32. Direct exposure to the polyunsaturated fatty acid dihomo-γ-linolenic acid (DGLA) induces ferroptotic germ cell death during C. elegans development and adult sterility (Fig. 3e). Like the positive control Fer-1, bazedoxifene inhibited DGLA-induced germ cell death and sterility (Fig. 3f, Extended Data Fig. 5a). We confirmed that bazedoxifene itself did not alter DGLA uptake (Extended Data Fig. 5b). Together, these results suggest that bazedoxifene can act as a potent RTA inhibitor of ferroptosis.
mTOR inhibition can suppress ferroptosis.
In the compendium, the system xc− inhibitors erastin and sorafenib clustered away from the GPX4 inhibitor ML162 (Fig. 1b). This suggested that certain compounds were likely to uniquely modulate ferroptosis induced by system xc− inhibition versus direct GPX4 inhibition. In this connection, our attention was attracted to a cluster of eight ATP-competitive mTOR inhibitors and dual mTOR/PI3K inhibitors, seven of which appeared to suppress ferroptosis induced by erastin and sorafenib but not ML162 (Fig. 4a). This pattern of clustering suggested that these modulators were unlikely to act as RTAs or iron chelators, which would also be expected to inhibit ML162-induced ferroptosis. Rather, we hypothesized that mTOR and dual mTOR/PI3K inhibitors acted in an on-target manner to specifically inhibit ferroptosis in response to system xc− inhibition. In support of this hypothesis, shRNA targeting the mTORC1 complex subunit RPTOR, but not the mTORC2-specific subunit RICTOR, inhibited erastin2-indued ferroptosis to the same extent as the ATP-competitive mTOR inhibitor INK128 (Extended Data Fig. 6a,b). Thus, mTORC1 inhibition appears sufficient to suppress ferroptosis in response to cystine deprivation.
Figure 4. mTOR inhibition suppresses ferroptosis.
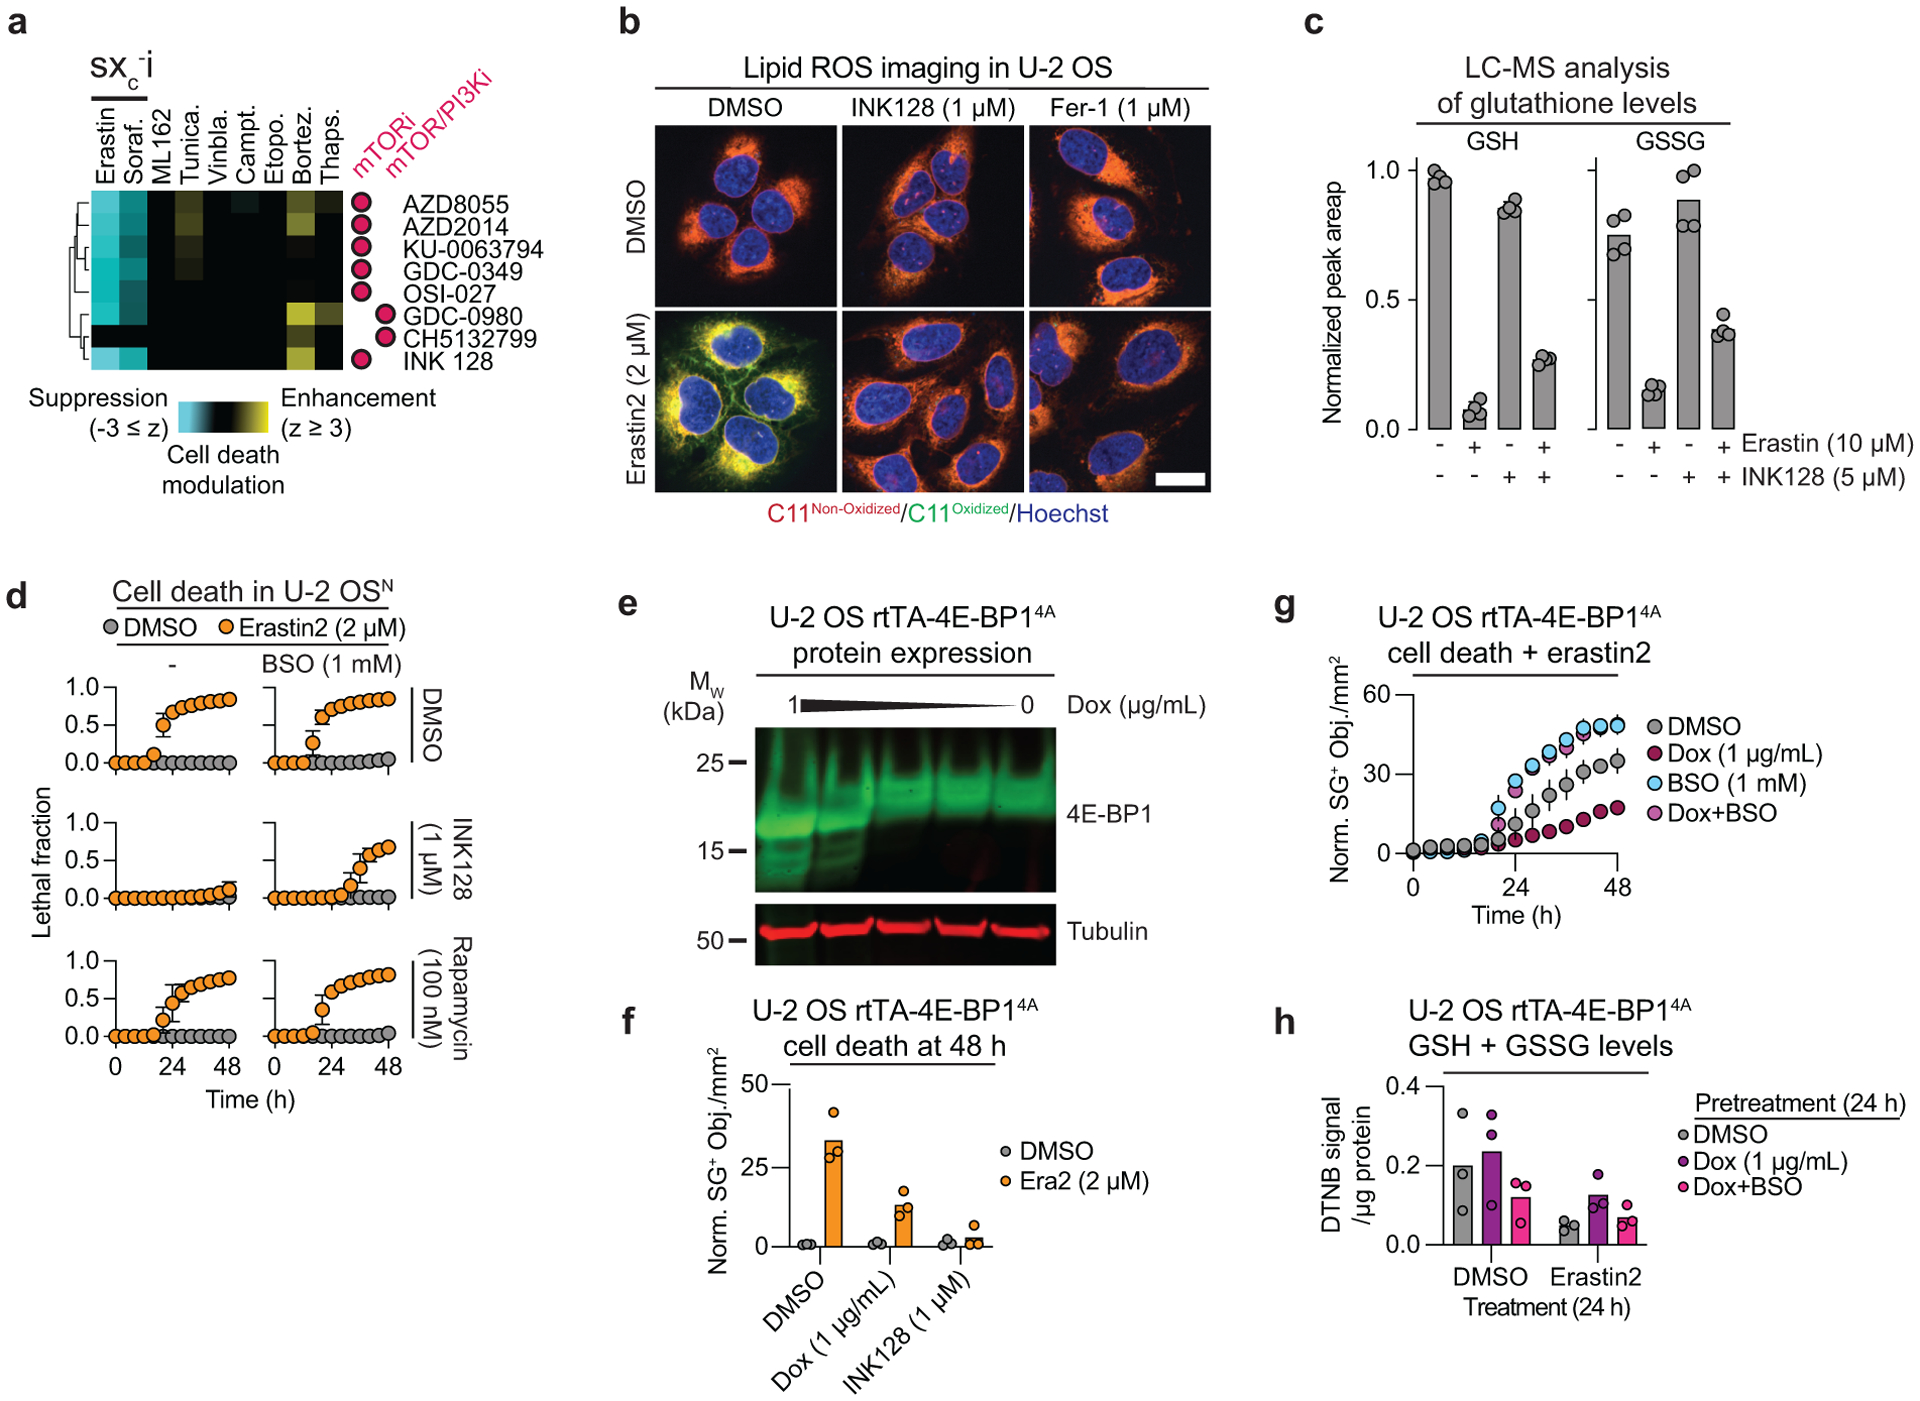
a, A cluster of mTOR and dual mTOR/PI3K inhibitors from the larger compendium (purple bar in Fig. 1c). sxc−i: system xc− inhibitors. b, Lipid ROS detected using C11 BODIPY 581/591 in cells treated for 22 h prior to imaging. Fer-1: ferrostatin-1. Scale bar = 20 μm. Imaging was performed three times and representative images from one experiment are shown. c, GSH and GSSG abundance in HT-1080 cells treated as indicated for 10 h. d, Cell death over time determined using STACK. e, Expression of 4E-BP14A under the control of a doxycycline (Dox)-inducible rtTA promoter. Blot is representative of two independent experiments. f, Cell death in U-2 OS rtTA-4E-BP14A cells determined by counts of SYTOX Green positive (SG+) objects. All compounds were added at the same time. g, Cell death over time in U-2 OS rtTA-4E-BP14A cells determined by counts of SG+ objects. Erastin2 was used at 250 nM. h, Total glutathione levels measured using Ellman’s reagent (DNTB). Dox and BSO (1 mM) pretreatment were carried out for 24 prior to the addition of DMSO or erastin2 (2 μM). In c, f and h results from three or four independent experiments are shown. Results in d and g are mean ± SD from three independent experiments.
INK128, along with another structurally-distinct ATP-competitive mTOR inhibitor, AZD8055, both suppressed erastin2-induced ferroptosis and phosphorylation of the mTOR target 4E-binding protein 1 (4E-BP1) in HT-1080N, U-2 OSN, and human embryonic kidney (HEK) 293TN cells (Extended Data Fig. 7a,b). Mechanistically, mTOR inhibitors reduced lipid ROS accumulation and enhanced residual intracellular glutathione levels following erastin2 treatment (Fig. 4b,c, Extended Data Fig. 7c). The ability of INK128 to suppress ferroptosis was blunted when cells were cotreated with buthionine sulfoximine (BSO), indicating that de novo GSH synthesis was required for the protective effect (Fig. 4d). mTOR inhibition did not increase system xc− activity; increased cystine import therefore seemed unlikely to explain how mTOR inhibition helped maintain glutathione levels and suppress ferroptosis (Extended Data Fig. 7d).
ATP-competitive mTOR inhibitors blocked ferroptosis better than rapamycin and related allosteric mTOR inhibitors (Fig. 4d, Extended Data Fig. 7e, Supplementary Fig. 5). Protein synthesis is one of several processes that are more sensitive to ATP-competitive mTOR inhibitors than rapalogs33. We and others previously observed that direct protein synthesis inhibiting using cycloheximide, or genetic silencing of RPL8, both suppress ferroptosis in response to system xc− inhibitors but not direct GPX4 inhibitors1,36, reminiscent of the phenotype observed here with mTOR inhibition. Thus, we hypothesized that mTOR-dependent regulation of protein synthesis could modulate ferroptosis in response to cystine deprivation. Supporting this model, ATP-competitive mTOR inhibitors blocked the phosphorylation of both 4E-BP1 and RPS6, two key regulators of mTOR-driven protein synthesis, while rapamycin inhibited RPS6 phosphorylation only, as expected34 (Extended Data Fig. 8a). Lower expression of ribosomal subunits (e.g. RPS3, RPL3, RPLP2) was also more strongly correlated with sensitivity to erastin than the GPX4 inhibitors RSL3 and ML210, across hundreds of cancer cell lines profiled in the Cancer Therapeutics Response Portal35 (Extended Data Fig. 8b). Finally, we confirmed in five different cancer cell lines that direct inhibition of protein synthesis using CHX attenuated ferroptosis in response to erastin2 but not ML162, and that these protective effects were partially reverted by cotreatment with BSO (Extended Data Fig. 8c).
To more directly test the role of mTOR-regulated protein synthesis in ferroptosis regulation we over-expressed in U-2 OS cells a non-phosphorylatable 4E-BP1 mutant (i.e. 4E-BP14A)37. This mutant inhibits protein synthesis downstream of mTOR by binding constitutively with eIF4E. Inducible 4E-BP14A expression was sufficient to reduce erastin2-induced ferroptosis (Fig. 4e,f). Moreover, the protective effect of 4E-BP14A expression was reverted by cotreatment with BSO, and this corresponded to weaker retention of intracellular glutathione following erastin2 treatment (Fig. 4g,h). Notably, 4E-BP1 and RPS6 phosphorylation were not altered by system xc− inhibition itself, indicated that mTOR remained active in the context of cystine deprivation (Extended Data Fig. 9a). Indeed, ongoing mTOR activity could drive amino acid consumption in protein synthesis that otherwise could be used for GSH synthesis. Consistent with this possibility, INK128 treatment resulted in accumulation of most amino acids within the cell while rapamycin treatment had weaker effects (Extended Data Fig. 9b).
mTOR-independent ferroptosis regulation by amino acids.
mTORC1 is sensitive to amino acid levels, especially leucine (Leu) and arginine (Arg)38. We therefore asked whether Leu or Arg withdrawal was sufficient to suppress erastin2-induced ferroptosis. Leu withdrawal did not inhibit erastin2-induced ferroptosis in U-2 OSN cells (Fig. 5a). By contrast, Arg withdrawal potently suppressed erastin2-induced cell death and lipid ROS accumulation (Fig. 5a–c). The protective effect of Arg deprivation could be reverted by re-supplementing with L-Arg or the Arg metabolic precursor citrulline, but not D-Arg (Fig. 5d, Extended Data Fig. 10a). Arg deprivation protected against erastin2-induced ferroptosis in seven different cancer cell lines in addition to U-2 OSN, but did not inhibit ferroptosis in response to the GPX4 inhibitor ML162 (Fig. 5e, Extended Data Fig. 10b). This suggested that, like mTOR inhibition, Arg deprivation might protect from ferroptosis by modulating glutathione metabolism. Consistent with this hypothesis, Arg deprivation was unable to inhibit erastin2-indued ferroptosis when BSO was included in the growth medium (Fig. 5f).
Figure 5. Arginine deprivation inhibits ferroptosis.
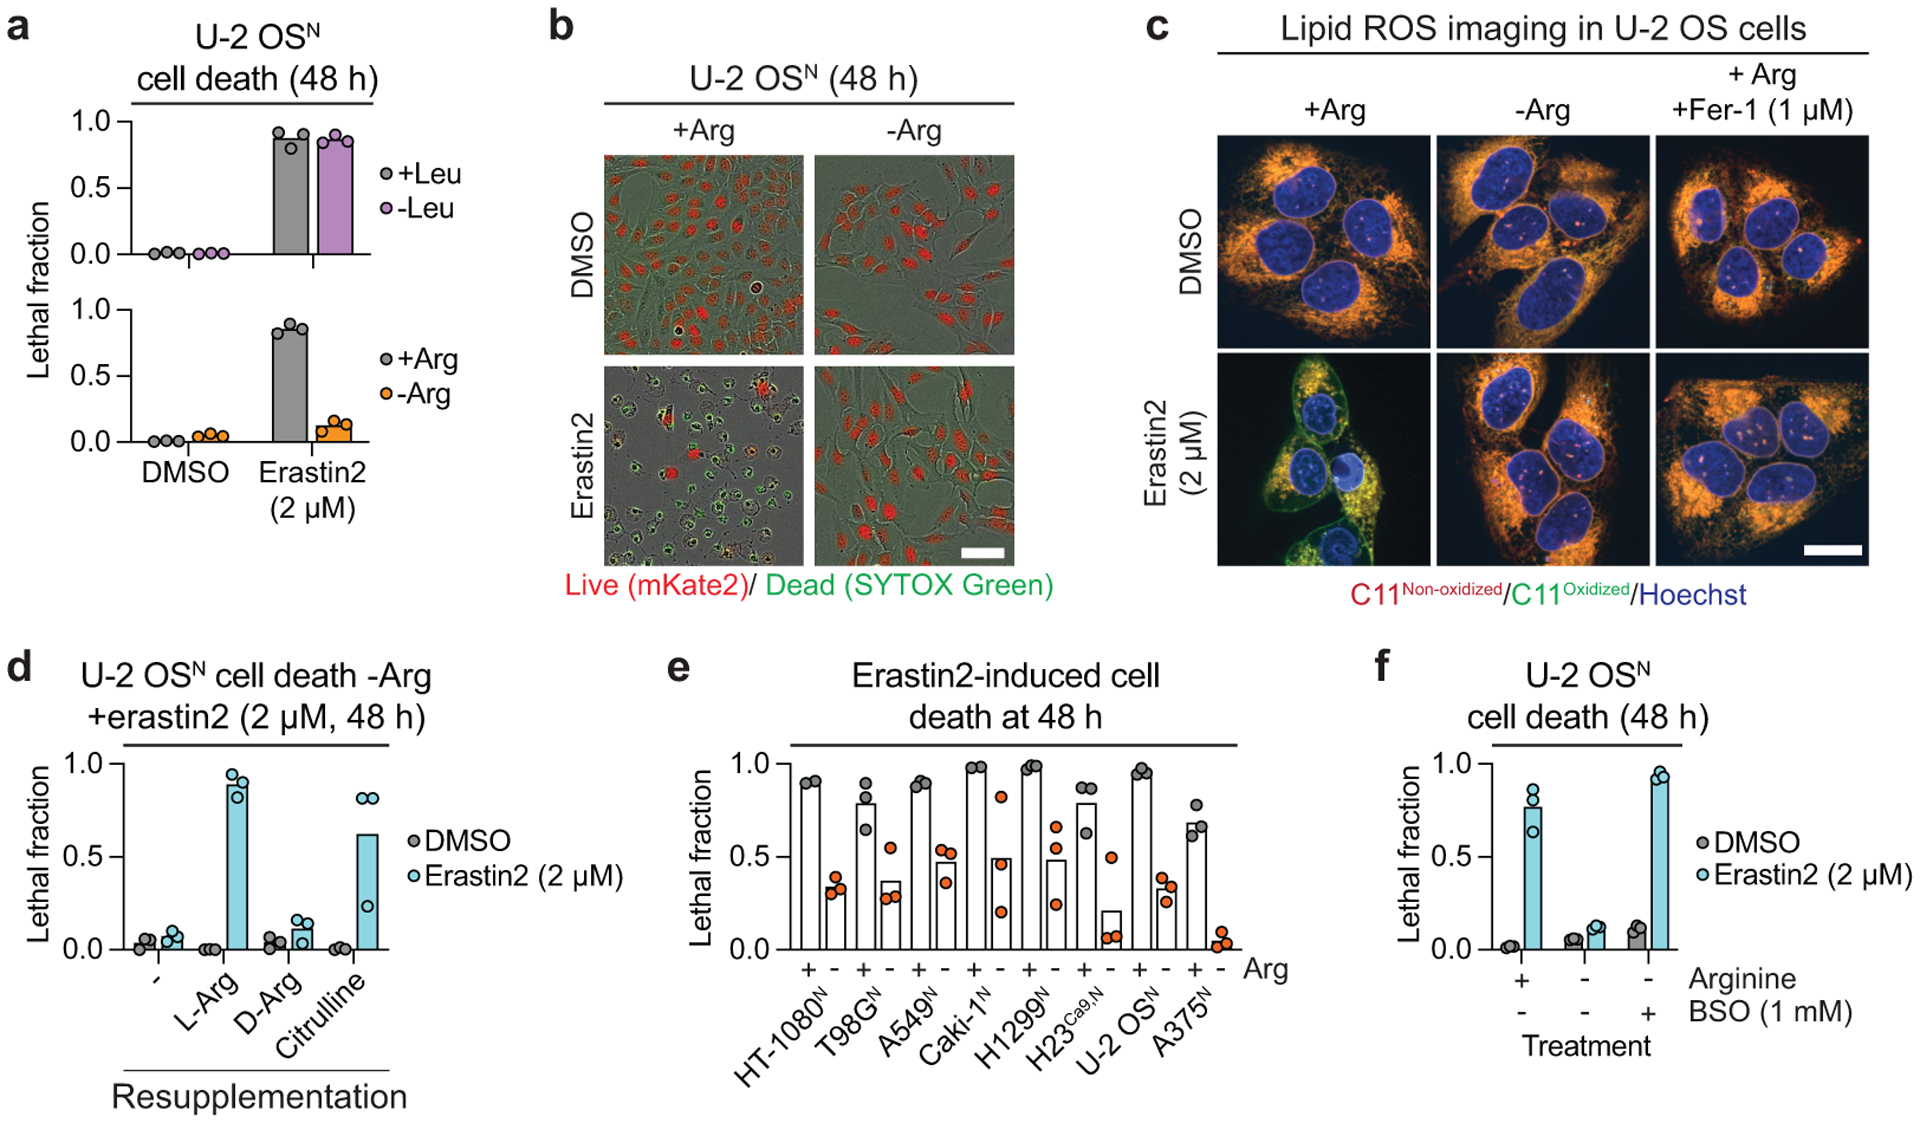
a, Cell death following withdrawal of leucine (Leu) or arginine (Arg) determined using STACK. b, Representative images from ± Arg experiment shown in a. Scale bar = 25 μm. Representative images from one of three experiments are shown. c, Lipid ROS detected using C11 BODIPY 581/591 (C11) in U-2 OS cells treated for 24 h prior to imaging. Fer-1: ferrostatin-1. Scale bar = 20 μm. Imaging was performed twice and representative images from one experiment are shown. d, Cell death in -Arg medium resupplemented with 365 μM L-arginine (L-Arg), D-arginine (D-Arg), or citrulline, determined using STACK. e, Erastin2-induced cell death in cell lines grown in DMEM medium with dialyzed FBS ± Arg (356 μM) determined using STACK. Erastin2 was used at 1 μM (HT-1080N, Caki-1N, H23NCas9,N), 2 μM (T98GN, H1299N, U-2 OSN, A375N) or 4 μM (A549N) to achieve equal basal cell killing. f, Cell death at 48 h determined using STACK. In a, d-f results from three independent experiments are shown.
The above data were consistent with the expectation that Arg deprivation blocked ferroptosis by inhibiting mTORC1 activity. Arg withdrawal reduced the phosphorylation of RPS6 in 293T cells, as expected39. However, Arg withdrawal did not inhibit 4E-BP1 phosphorylation in 293T cells, or RPS6 and 4E-BP1 phosphorylation in U-2 OS cells (Fig. 6a). Consistent with the absence of effect on key regulators of protein synthesis, bulk protein synthesis was reduced in U-2 OS cells by INK128 treatment but not by Arg deprivation, as determined using a puromycylation assay (Extended Data Fig. 10c,d). These results indicated that Arg withdrawal may suppress ferroptosis without inhibiting mTOR function.
Figure 6. Amino acid deprivation-induced ferroptosis suppression correlates with proliferative arrest.
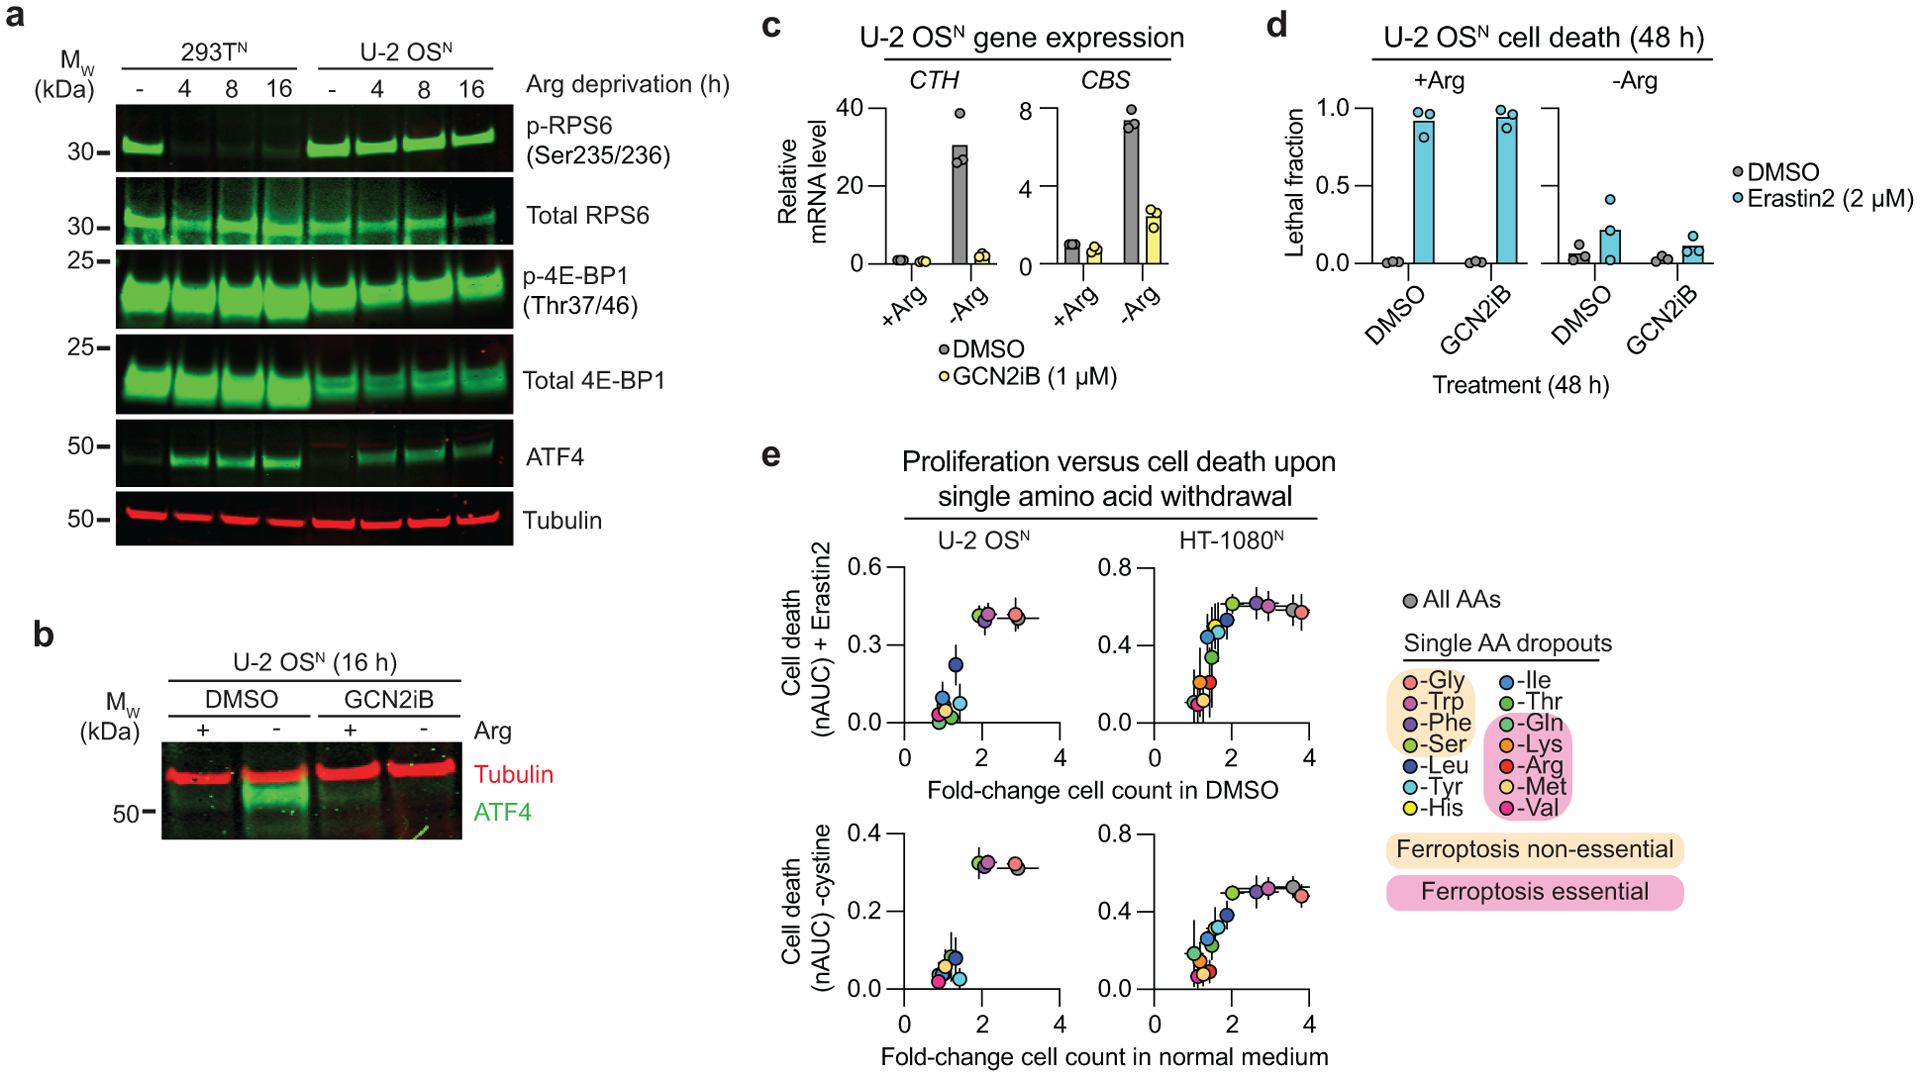
a, Immunoblots from cells deprived of Arg for the indicated times. Blot is representative of three independent experiments. b, Immunoblotting for ATF4 protein levels ± Arg-containing medium ± the GCN2 inhibitor GCN2iB (1 μM). Blot is representative of two independent experiments. c, Expression of the transsulfuration pathway genes under the same conditions as in b determined by RT-qPCR. d, Cell death determined using STACK. GCN2iB was used at 1 μM. e, Cell death over time determined using STACK and expressed as the normalized AUC (nAUC) versus proliferation under conditions of single amino acid withdrawal plus erastin2 (2 μM) or cystine co-withdrawal. Cell proliferation was quantified as the ratio of live cell (mKate2+) counts at 48 h versus 0 h in medium containing vehicle (DMSO) control and cystine. Results in c and d are from three independent experiments. Results in e represent mean ± SD from three independent experiments.
The GCN2/ATF4 pathway responds to amino acid deprivation and has been linked to the regulation of ferroptosis in some contexts40,41. The transcription factor ATF4 controls the expression of transsulfuration pathway enzymes (i.e. CBS, CTH) that could convert methionine to cysteine under conditions of cysteine limitation, and thereby potentially suppress ferroptosis. In U-2 OS cells, Arg deprivation increased ATF4 protein levels and the expression of CBS and CTH in a manner sensitive to the specific GCN2 inhibitor GCN2iB42 (Fig. 6a–c). However, despite blocking ATF4 expression and function, GCN2iB did not prevent Arg deprivation from inhibiting ferroptosis (Fig. 6d). Likewise, Arg deprivation suppressed erastin2-induced ferroptosis in HT-1080 cells stably expressing an shRNA targeting ATF4 (Ref.43) (Extended Data Fig. 10e,f). Thus, increased GCN2/ATF4 pathway activity appeared unable to explain the ability of Arg deprivation to suppress ferroptosis.
Given these unexpected results, we investigated more broadly how depriving cells of different individual amino acids impacted ferroptosis. Using STACK technology, we quantified the effects of 14 individual amino acid deprivation conditions on ferroptosis induced by erastin2 or cystine co-withdrawal. Strikingly, deprivation of glutamine, lysine, valine, methionine, and arginine, all suppressed ferroptosis in both U-2 OSN and HT-1080N cells in response to erastin2 or cystine withdrawal (Fig. 6e). By contrast, deprivation of glycine, tryptophan, phenylalanine and serine had little or no ability to inhibit ferroptosis. These amino acid-specific effects were not obviously related to the physical properties or shared metabolic roles. However, the ability of single amino acid withdrawal to prevent ferroptosis did track with the ability of these conditions to inhibit of proliferation (i.e. in the absence of erastin2 or cystine withdrawal) (Fig. 6e). Thus, acute amino acid deprivation-induced proliferative arrest correlates with protection from ferroptosis in a manner that can be independent of mTOR inhibition and GCN2/ATF4 pathway activation.
Discussion
We generated a large compendium of kinetic cell death modulatory profiles and used this compendium to identify novel chemical modulators of ferroptosis. Many compounds, including numerous drugs, appear to suppress ferroptosis in an off-target manner as cryptic RTAs or iron chelators. These results reinforce the concept that such activities are relatively common8,9. This may confound mechanistic studies, when one compound is assumed to be acting to inhibit ferroptosis through a particular protein target. However, cryptic drug RTA or iron chelator activities could be of interesting for drug repurposing. We find that bazedoxifene is a potent RTA inhibitor of ferroptosis. This is notable given that bazedoxifene has been shown to inhibit pathological cell death in several contexts, including the brain44,45. We speculate that these positive effects could be due in part to off-target ferroptosis suppression.
We find that on-target mTORC1 inhibition can delay ferroptosis triggered by system xc− inhibition or direct cystine deprivation. Protein synthesis normally consumes the majority of intracellular cysteine46. A model consistent with our data and earlier results47 is that reduced protein synthesis allows for intracellular cysteine to be shunted towards GSH synthesis. We speculate that direct inhibition of ribosome activity blocks ferroptosis selectively in response to system xc− inhibitors for similar reasons. Our results support the concept that ongoing mTOR activity can have a paradoxical pro-death effect in cancer cells when it drives the consumption of a metabolic resource that is limiting for survival48. Given the pleiotropic effects of mTORC1 signaling on metabolism33, it may not be unexpected that this pathway has different effects on ferroptosis sensitivity in other contexts49.
We find that cystine deprivation is largely unable to induce ferroptosis when other amino acids (Gln, Lys, Arg, Met and Val) are absent from the environment. Inhibition of mTORC1 function or activation of the GCN2/ATF4 pathway is not sufficient to explain how Arg withdrawal suppresses ferroptosis, and it will be interesting to investigate further whether this protective effect is explained by a shared mechanism. At present, our results suggest that slower proliferation upon the withdrawal of certain amino acids could contribute directly to cysteine or GSH sparing. These results argue that therapeutic anti-cancer cystine deprivation strategies50 may be most effective at inducing ferroptosis when other amino acids are present in the environment at levels sufficient to stimulate normal proliferation.
Online Methods
Chemicals and reagents.
An 1,833-member bioactive compound library, and an independent 86-member PI3K signaling inhibitor library comprising mTOR, PI3K and AKT pathway inhibitors, were obtained from Selleck Chemicals and stored at −80°C. Erastin2, annotated as compound 35MEW28 (Ref.51) and ML162 were synthesized by Acme Bioscience. Erastin was the kind gift of B. Stockwell (Columbia). Chemical used (supplier) were: DMSO, ferrostatin-1, thapsigargin, tunicamycin, cycloheximide, L-arginine, D-arginine and L-citrulline (Sigma-Aldrich Corporation); bortezomib, rapamycin, etoposide and buthionine sulfoximine (Thermo-Fisher Scientific); INK 128, AZD8055, vinblastine, camptothecin, sorafenib, bazedoxifene, raloxifene and JTC-801 (Selleck Chemicals); and GCN2iB (MedChemExpress). Buthionine sulfoximine was dissolved directly into cell media. All other drugs were prepared as stock solutions in DMSO. Stock solutions were stored at −20˚C.
Cell culture.
HT-1080 (CCL-121), U-2 OS (HTB-96), MDA-MB-231 (HTB-26), HEK293T (CRL-3216, hereafter 293T), NCI-H1299 (CRL-5803, hereafter H1299), A549 (CCL-185), T98G (CRL-1697), Caki-1 (HTB-46), and A375 (CRL-1619) were obtained from ATCC. Mouse 4T1 and E0771 triple negative breast cancer cells were originally obtained from ATCC and CH3 Biosystems, and obtained via Lingyin Li (Stanford, Dept. of Biochemistry). HT-1080 cells stably expressing a non-targeting shRNA (sh-NT) and an shRNA targeting ATF4 were the kind gift of Jiangbin Ye (Stanford, Dept, of Radiation Oncology). H23 cells stably expressing Cas9 (H23Cas9) were the kind gift of Michael Bassik (Stanford, Dept. of Genetics). The polyclonal nuclear mKate2-expressing (denoted by superscript ‘N’) cell lines HT-1080N, U-2 OSN, 293TN and H1299N were described previously12,52. Polyclonal populations of Caki-1N, A375N and H23Cas9,N cells were generated from the respective parental cells via transduction with the NucLight Red lentivirus, which directs the expression of nuclear-localized mKate2 (Essen BioSciences/Sartorius). Polyclonal mKate2-expressing populations were selected using puromycin (Life Technologies, Cat No. A11138–03, 1.5 μg/mL, for 48–72 h). All HT-1080 cells were cultured normally in DMEM Hi-glucose media (Corning Life Science, Cat No. MT-10–013-CV) supplemented with 1% non-essential amino acids (NEAAs, ThermoFisher Scientific). A549, 293T, MDA-MB-231, and T98G cells were cultured in DMEM Hi-glucose medium without supplemental NEAAs. U-2 OS, Caki-1, and A375 cells were cultured in McCoy’s 5A medium (Corning Life Science). H23Cas9, 4T1, and E0771 cells were cultured in RPMI 1640 with L-glutamine medium (Fischer Scientific), with E0771 cells additionally supplemented with 10% HEPES. All media were supplemented with 10% FBS and 0.5 mg/mL penicillin-streptomycin (Life Technologies) unless otherwise indicated. Cell lines were grown at 37˚C with 5% CO2 in humidified tissue culture incubators (Thermo Scientific).
Bioactive compound library profiling in cells.
Large-scale bioactive compound profiling was performed as described12. HT-1080N cells were grown in T-175 flasks (Corning Life Sciences) and trypsinized and counted using a Cellometer Auto T4 cell counter (Nexcelom). 40 μL of cell solution was added manually to each well of a 384 well clear bottom tissue culture plate (Corning) at a final density of 1,500 cells per well. The plate was spun briefly (500 rpm, 2 sec) to settle the cells evenly at the bottom of the wells. The next day, the medium was removed and replaced with 36 μL of media containing the dead cell probe SYTOX Green (20 nM, final concentration; Life Technologies) and DMSO or one of ten lethal compounds (final concentration), thapsigargin (12.5 nM), tunicamycin (10 μg/mL), camptothecin (5 μM), etoposide (100 μM), bortezomib (50 nM), vinblastine (0.1 μg/mL), erastin (10 μM), sorafenib (10 μM) and ML162 (5 μM). 4 μL of medium containing one of 1,833 different bioactive library compounds was then added (final concentration 5 μM) using a Versette robotic liquid handler (ThermoFisher Scientific) and plates were immediately transferred to an IncuCyte Zoom dual color live content imaging system (Model 4459, Essen BioScience/Sartorius) housed within a Thermo tissue culture incubator (37°C, 5% CO2).
Images were acquired using a 10x objective lens in phase contrast, green fluorescence (ex: 460 ± 20, em: 524 ± 20, acquisition time: 400 ms) and red fluorescence (ex: 585 ± 20, em: 665 ± 40, acquisition time: 800 ms) channels. For each well, images (1392 × 1040 pixels at 1.22 μm/pixel) were acquired every 2 h for a variable period of time reflecting the different kinetics of cell death induced by each lethal query compound (time): DMSO control (120 h), thapsigargin (112 h), tunicamycin (96 h), camptothecin (96 h), etoposide (102 h), bortezomib (96 h), vinblastine (96 h), erastin (46 h), sorafenib (46 h) and ML162 (24 h). Automated object detection was performed in parallel to data acquisition using the Zoom software package (V2016A/B) using a routine with the following settings (in parentheses) to count mKate2+ objects (Parameter adaption, threshold adjustment: 1; Edge split on; Edge sensitivity 50; Filter area min 20 μm2, maximum 800 μm2; Eccentricity max 1.0) and SG+ objects (Parameter adaption, threshold adjustment: 10; Edge split on; Filter area min 5 μm2, maximum 800 μm2; Eccentricity max 0.9).
Compendium data analysis and visualization.
Cell death within each population was analyzed using the scalable time-lapse analysis of cell death kinetics (STACK) approach using counts of live (mKate2+) and dead (SYTOX Green, SG+) cells to compute lethal fraction scores at each timepoint, as described12. At this stage, several data quality filters were applied. First, results obtained for ten autofluorescent compounds were removed from all subsequent analyses: nintedanib (BIBF 1120), sunitinib malate, enzastaurin (LY317615), PHA-665752, SB216763, SU11274, idarubicin HCl, TSU-68 (SU6668, orantinib), quinacrine 2HCl and Ro 31–8220 mesylate. Second, we removed from the analysis 16 bioactive library compounds from the bortezomib profile, and 76 bioactive library compounds from the vinblastine profile, as these were determined to have fewer than 50 live mKate2+ cells/well at t = 0, which we set arbitrarily as a cut-off to limit the potential impact of low cell density on compound sensitivity.
For all populations, lethal fraction scores over time were first organized into table format using Excel v16.4 (Microsoft Corp.) and then summarized as a single value by computing the area under the curve (AUC) value of the lethal fraction scores over time, using the default settings, in Prism 7 (GraphPad Software). AUC values vary as a function of time (i.e. for a given lethal stimulus, a longer period of incubation will result in higher AUC value). Thus, to enable a comparative analysis of bioactive compound modulatory effects between the lethal queries that were each observed for different lengths of time, AUC values for each population were normalized to the maximum possible cell death within the observation period, u. Thus, the normalized AUC (nAUC) = AUCObserved (time: 0→u)/AUCMax (time: 0→u). nAUC values were also computed for each bioactive compound alone from the DMSO screen at different time intervals. nAUC values for lethal query (‘Q’) and bioactive compound modulators (‘M’) alone were used to compute the expected nAUC (nAUCExpect) using the Bliss independence model (Q + M - [Q*M]). The difference between nAUCExpect and the experimentally observed nAUC value (nAUCObserved) were calculated for each compound combination (Difference = nAUCExpect – nAUCObserved). To account in an unbiased way for differences in the overall ‘modulatability’ of each lethal query by the bioactive compound library compounds, all Difference values were z-scored separately for each lethal query across all tested bioactive modulator compounds. Z-scores were hierarchically clustered in an unsupervised manner using default settings available in the Morpheus suite (https://software.broadinstitute.org/morpheus/). These setting were: Metric: one minus Pearson correlation, Linkage: Average, Cluster: rows and columns.
Small scale analysis of cell death.
In several small-scale experiments we examined cell death using the general STACK approach and instrument setting as described above. In certain follow-up experiments involving HT-1080N, A549N, and H23Cas9,N cells we used a modified STACK method where double mKate2/SYTOX Green positive counts were subtracted from live cell counts. Some experiments employed unmarked cells and SG+ cells only were counted as a metric of cell death. These counts were normalized to the starting confluence of the well to account for slight differences in cell seeding between conditions, as indicated.
Identification of known antioxidants and iron chelators.
To identify known antioxidants literature searches were performed using PubMed (https://www.ncbi.nlm.nih.gov/pubmed) and the search terms “[compound]” AND (“antioxidant” OR “ferroptosis”) on 18 Feb 2018.
Analysis of NRF1/NFE2L1 stabilization.
200,000 HT-1080N cells were seeded into a 6 well plates (Corning). The next day, media on these cells was aspirated and replaced with media containing DMSO (vehicle), borteomzib (200 nM) or JTC-801 (5 μM). DMSO and Bortezomib treated cells were harvested after 4 h while JTC-801 treated cells were harvested both at 4 h and after 8 h. Briefly, cells were washed with 1 mL Hanks Balanced Salt Solution (HBSS, Life Technologies) and trypsinized to harvest. Trypsin was quenched with growth medium. Cells were subsequently spun at 350 × g for 5 min. Media was aspirated from the pellets followed by a wash step with 1 mL of HBSS. Pellets were then resuspended in 100 μL of 9 M urea, sonicated, and spun for 15 min in a centrifuge at max speed. The resulting lysate was transferred to a new eppendorf and protein abundance was quantified using the BCA assay. 30 μg of protein from each lysate was loaded onto a Bolt 4–12% Bis-Tris Plus SDS gel (Life Technologies) for separation for 75 min at 100 V. The gel was transferred to a nitrocellulose membrane using the iBlot2 system (Life Technologies). Membranes were probed with a rabbit monoclonal antibody directed against the TCF11/NRF1/NFE2L1 (Cell Signaling Technology, dilution 1:1000) and a mouse monoclonal antibody directed against tubulin (Fisher Scientific, dilution 1:2000). Donkey anti-rabbit secondary antibody (IRDye 800LT, LI-COR Biosciences) and donkey anti-mouse antibody (IRDye 680LT, LI-COR Biosciences) were used at 1:15000 dilution to visualize bands. Membranes were imaged using the LI-COR CLx Imaging System.
Analysis of ERK phosphorylation.
200,000 HT-1080 cells/well were grown overnight in a 6-well tissue culture plate. Cells were washed with 1 mL HBSS and the media was replaced with serum-free DMEM High Glucose media containing 1% Pen/Strep. After 16 h serum starvation, HT-1080 cells were stimulated with serum-containing media ± U0126 (5 μM) or trametinib (250 nM) for 30 min, washed with 1 mL HBSS and lysed in 100 μL of 9 M urea containing protease and phosphatase inhibitor cocktail (Cell Signaling Technology). Samples were analyzed by Western blotting as described above. Rabbit monoclonal antibodies directed against the diphosphorylated (Thr202/Tyr204) form of ERK1/2 (p42/44 MAPK, Cell Signaling Technology, dilution: 1:1000) and total ERK1/2 (Cell Signaling Technology, dilution: 1:1000) were the primary antibodies.
Yeast experiments.
The Saccharomyces cerevisiae strain used in this study was coq3Δ (BY4741 MATa his3Δ0 leu2Δ0 met15Δ0 ura3Δ0 coq3Δ::kanMX4). coq3Δ was grown in YPD (1% yeast extract, BD Biosciences), 2% peptone (BD Biosciences), 2% dextrose (Fisher BioReagents). The day before the experiment, a single yeast coq3Δ colony was used to inoculate 5 mL YPD. The culture was grown overnight (30°C, 160 rpm). The next morning, the culture was diluted to OD600 = 0.1 in fresh YPD and incubated at 30°C, 160 rpm for ~4 h to mid-log phase (OD600 = 0.2–0.5). At mid-log phase, cells were harvested and washed two times with 2 volumes of sterile water, resuspended to a final OD600 = 0.8 in 0.1 M sodium phosphate buffer pH 6.2/2% glucose + 1 μM SYTOX Green, and 50 μL cell suspension was added to the appropriate wells of a 96-well clear black-side, clear, flat-bottom plate (Costar). The final SYTOX Green concentration was 250 nM. α-linolenic acid (Cayman Chemical) and vehicle (ethanol) were diluted to 1 mM in 0.1 M sodium phosphate buffer pH 6.2/2% glucose and 100 μL of the appropriate mixture was added to the appropriate wells. The final fatty acid concentration was 500 μM. Candidate antioxidants, iron chelators and DMSO were diluted to 40 μM in 0.1 M sodium phosphate buffer pH 6.2/2% glucose, and 50 μL of the appropriate mixture was added to the appropriate wells (final antioxidant concentration = 10 μM). Assay plates were incubated for 24 h (30°C, 160 rpm) in a Cytation3 cell imaging multimode reader (BioTek Instruments). At 24 h, the SYTOX Green fluorescence was measured on the Cytation3 using ex/em settings of 488/523. The background signal (0.1 M sodium phosphate buffer pH 6.2/2% glucose + 250 nM SYTOX Green only) was subtracted from all samples, and the final percent cell death was determined using the 500 μM α-LA + DMSO condition set to 100% cell death.
2,2-diphenyl-1-picrylhydrazyl (DPPH) assay.
For the DPPH profiling experiment of the 1,833-compound library, the stable radical 2,2-diphenyl-1-picrylhydrazyl (DPPH) was dissolved in methanol (MeOH) to a concentration of 53.3 μM. 60 μL of DPPH solution was added to 20 μL of diluted library compound (160 μM). The final concentrations of DPPH and test compounds were 40 μM. Samples were incubated in the dark at room temperature for 30 min. After incubation, absorbance was measured at 517 nm using a Cytation3 multimode reader. Each plate had eight wells with DPPH and vehicle (DMSO) only and eight wells with MeOH only for background subtraction. Each plate was blank subtracted using the average MeOH signal from eight wells, and comparison to eight control wells in each plate containing DPPH + DMSO only were used to compute a percentage inhibition value for each compound. The entire experiment was performed twice on separate days. 13 compounds had average normalized DPPH signals ≥ 150% of the negative controls and were excluded from further analysis (obatoclax mesylate, crystal violet, clofazimine, indirubin, vitamin B12, daunorubicin HCl, epirubicin HCl, enzastaurin, doxorubicin, idarubicin HCl, GW441756, BIO, and pirarubicin). Of the remaining 1,820 compounds, 5.2% (95/1818) exhibited normalized DPPH signals between 0–50% of the DMSO negative controls, with < 20% standard deviation between the two replicates being used as a consistency filter to help select compounds for subsequent analysis.
When the DPPH assay was performed for single compound follow-up experiments, DPPH was dissolved in methanol to a final concentration of 40.2 μM. 498 μL of DPPH solution was added to 2 uL of 10 mM compound dissolved in DMSO. The final concentrations of DPPH and test compounds were 40 μM. Samples were briefly vortexed and allowed to incubate in the dark at room temperature for 60 min. 150 μL aliquots of each DPPH:test compound solution were added to three wells of 96-well clear-bottom tissue culture plates (Corning) and absorbance at 517 nm was recorded using a Cytation3 multimode reader (BioTek). Absorbance at 517 nm was averaged across the three technical replicates, blank (methanol only) subtracted, and normalized to average DPPH absorbance. The entire experiment was performed three times on separate days.
Ferrozine iron chelation assay.
The 1,833-member bioactive compound library was examined using the ferrozine assay as follows. 4 μL of each library compound (2 mM) were diluted to a final concentration of 53.3 μM in two steps in H2O with a robotic liquid handler (ThermoFisher Scientific). Next, 4 μL of iron (II) chloride (100 μM) were added to 60 μL of each diluted compound and mixed. Finally, 16 μL of 3-(2-pyridyl)-5,6-diphenyl-1,2,4-triazine-p,p’-disulfonic acid monosodium salt hydrate (ferrozine) (125 μM) was added to 64 μL of compound + iron (II) chloride and mixed in 384-well clear-bottom plates (Corning). The final concentrations of the resulting 80 μL reactions for test compounds, iron (II) chloride, and ferrozine were 40 μM, 5 μM and 25 μM respectively. After incubating in the dark at room temperature for 60 min, absorbance readings were taken at 562 nm using a Cytation3 multimode reader. The experiment was repeated three times on different days, with some data lost from the third replicate only due to one damaged plate. Thus, the final dataset contains either two or three measurements for different compounds. For each compound, blank (ferrozine only) values were subtracted, and percent signal inhibition was computed relative to the average of a ferrozine:iron positive control. 117 compounds reduced the average ferrozine signal by 50% or more of the positive control. In a follow-up experiment, SC144 was cherry-picked from the larger library and tested in a ten-fold, two-point dose-response manner HT-1080 cells treated with erastin2 (1 μM) or ML162 (2 μM). Cell death was analyzed over 48 h by counting dead (SG+) cells.
Antioxidant mini-library and follow-up analysis.
Compounds identified in the DPPH library screen were cherry picked from a fresh library aliquot of the bioactive compound library for testing for the ability to suppress erastin2-induced cell death in HT-1080N cells. 95 compounds that reduced DPPH signal by ≥50%, along with five additional compounds close to the cutoff (2-methoxyestradiol, TCID, epinephrine HCl, milciclib and PYR-41) were analyzed. The sub-library of 100 compounds was tested in HT-1080N cells against three fixed concentrations of erastin2: 50 μM, 5 μM, and 0.5 μM. Cell death was analyzed over 48 h, scanning in 2 h intervals. Lethal fraction and nAUC scores were computed for each treatment. Data represent the mean of two independent experiments.
Analysis of cell death with 17β-estradiol competition assay.
HT-1080N cells were seeded into a clear bottom 384 well plate at a final density of 1,500 cells/well. Cells were treated with erastin2 (1 μM) ± bazedoxifene or raloxifene (both 1 μM) ± 17β-estradiol (100 nM). Counts of live and dead cells were acquired using the STACK method every 2 h for 36 h.
Lipophilicity prediction.
Compound lipophilicity was predicted using ALGOPS v2.1 to predict logP and logS values (http://www.vcclab.org/lab/alogps/).
Kinetic analysis of radical-trapping antioxidant activity.
All chemicals and solvents were purchased from commercial suppliers and used without further purification unless other indicated. STY-BODIPY and DTUN were prepared as reported28,53. Egg phosphatidylcholine liposomes were prepared as previously reported54. UV−visible spectra and kinetics were measured on a Cary-100 UV−vis spectrophotometer equipped with a temperature controller unit and a thermostatted 6 × 6 multicell holder. To a cuvette of 2.34 mL of 10 mM phosphate buffered saline (150 mM) at pH 7.4 was added 125 μL of 20 mM stock of 100 nm unilamellar egg phosphatidylcholine liposomes in the same buffer, and the cuvette was placed into the thermostatted sample holder of a UV−visible spectrophotometer and equilibrated to 37 °C. An aliquot (12.5 μL) of a 2.0 mM solution of STY-BODIPY in DMSO was added, followed by 10 μL of a 50 mM solution of DTUN in EtOH, and the solution was thoroughly mixed. The absorbance of the sample at 571 nm was monitored for ca. 20 min to ensure that STY-BODIPY consumption was proceeding at a constant rate, after which 10 μL of a 500 μM solution of the test antioxidant was added. The solution was thoroughly mixed and the absorbance readings resumed. The initial rate and inhibited period were then used to calculate kinh and n as described28.
C. elegans whole animal cell death assay and lipid analysis.
Germ cell death in C. elegans was analyzed as reported32. Briefly, N2 Bristol (wild-type) nematodes were maintained on nematode growth media (NGM) plates seeded with bacteria (E. coli OP50) at 20°C. Experiments with dihomo-γ-linolenic acid (DGLA) were performed using NGM plates formulated with 0.1% Tergitol NP40 (Sigma Chemicals) and 0.125 mM DGLA sodium salt (NuChek Prep, Inc.) or Tergitol alone (vehicle). Dry plates were seeded with OP50 and then three days later ferrostatin-1 or bazedoxifene were dissolved into the plates at a final concentration of 150 μM and allowed to dry for 30 min, before ~50 synchronized L1 larvae were transferred to each plate. Sterility was scored 72–96 h later, as determined by light microscopic examination of uterine embryos. In total, six separate populations of nematodes were scored for each condition. Fatty acids were analyzes from two independently treated worm populations using gas chromatography/mass spectrometry following direct transesterification using 2.5% H2SO4 in methanol (1 h, 70°C) to generate fatty acid methyl esters, as described55.
Analysis of cell death with mTOR inhibitors.
HT-1080N, U-2 OSN and 293TN cells were seeded in clear bottom 12-well plates (Corning) at densities of 75,000, 50,000, 100,000, and 50,000 cells per well, respectively, in 1 mL of medium. The next day, the medium was replaced with fresh medium containing SYTOX Green (final concentration = 20 nM) along with either DMSO or erastin2 (1 μM), INK 128 (1 μM) and AZD8055 (1 μM). Cells were then transferred into the IncuCyte Zoom enclosed within a tissue culture incubator and images were acquired using the 10x objective every 4 h for 48 h. Lethal fraction scores were computed over time as described above. In some experiments, U-2 OSN cells were co-treated ± buthionine sulfoximine (1 mM) or rapamycin (100 nM). In one experiment, ferroptosis was induced in U-2 OSN cells by placing the cells medium lacking cystine, as described56.
PI3K library mini-screen.
The effects of 86 different small molecule inhibitors of PI3K and related pathways were examined in U-2 OS cells. Cells were seeded in 384-well plates at a density of 1,500 cells/well in 40 μL of medium. The next day, the medium was removed and 36 μL of fresh medium containing SYTOX Green (20 nM final concentration) and the PI3K library compounds were added. The PI3K library compounds were added to final concentrations of 100 nM, 250 nM and 10 nM in separate plates. Then, either immediately, or following a 6 h pre-incubation, 4 μL of 10x erastin solution (10 μM final concentration) was added to cells, and cell were imaged using an IncuCyte microscope. Images were acquired using a 10x objective lens in phase contrast and green fluorescence (ex: 460 ± 20, em: 524 ± 20, acquisition time: 400 ms). Counts of SG+ dead cells at 24 h in response to erastin treatment alone were used to compute a normalized cell death for each condition, set equal to 1. The effect of each individual PI3K pathway inhibitor was assessed relative to this baseline, with a value of 0 being equal to no dead cells observed at 24 h. The entire experiment was repeated three times on separate days and the results shown are the average of these three experiments, where each dot represents an individual compound.
shRNA analysis.
To generate lentiviruses bearing shRNAs, plasmids encoding scramble, RPTOR, or RICTOR shRNAs (which were gifts from David Sabatini, Addgene plasmids #1864, #1858, and #1853, respectively) were co-transfected with 3rd generation lentiviral packaging plasmids (pMDLg/pRRE and pRSV-Rev, which were gifts from Didier Trono, Addgene plasmids #12251 and #12253 respectively, and pCMV-VSV-G, which was a gift from Bob Weinberg, Addgene plasmid #8454) into HEK293T cells using PolyJet (SignaGen Laboratories, Cat No. SL100688) as per manufacturer instructions. Viral supernatant was harvested 48 h and 72 h later, combined, filtered through a 0.45 μm PVDF filter (EMD Millipore), and stored in single-use aliquots at −80°C until use.
For functional studies, HT-1080 (immunoblot) or HT-1080N (STACK viability) cells were seeded in either 6-well plates (immunoblot, at 30,000 cells/well) or 12-well plates (viability, at 10,000 cells/well). The next day, medium was removed and replaced with DMEM + NEAAs (HT-1080 medium) with 8 μg/mL Polybrene (Sigma-Aldrich) containing fresh medium or viral supernatant at an MOI of ~3. 48 h later, the media were removed and replaced with HT-1080 medium containing 2 μg/mL puromycin (Life Technologies). The untransduced wells were instead treated with 1 μM INK128. 24 h later, cells in 6-well plates for immunoblots were harvested and prepared as described below, and cells in 12-well plates were washed once with HBSS and treated as described for viability experiments.
mTOR pathway cell lysis and immunoblotting.
Except where noted, adherent cells were washed once in ice cold PBS and lysed in 40 μL ice cold RIPA buffer (50 mM Tris HCl pH 7.5, 150 mM NaCl, 0.1% SDS, 0.5% sodium deoxycholate, 1% triton) plus protease/phosphatase inhibitor cocktail and 5 mM NaF. Lysate was removed from the well, added into 1.5 mL Eppendorf tubes, and sonicated with 10 one-second pulses at maximum amplitude with a Fisher Scientific Model 120 Sonic Dismembrator (Thermo Fisher). Lysates were centrifuged at 12,700 rpm speed at 4°C for 15–20 min, and the supernatant was isolated to exclude debris. Protein concentration was quantified using the Pierce Microplate BCA Assay Kit (Thermo Fisher). Samples were prepared with 10x Bolt Sample Reducing Agent (Life Technologies) and 4x Bolt LDS Sample Buffer and run on Bolt 4–12% Bis-Tris Plus gels at 100V for 1 h and 45 min using Bolt MES running buffer (Thermo Fisher) diluted to 1x. Protein was transferred to iBlot nitrocellulose membranes, blocked in Odyssey Blocking Buffer (Li-Cor) for 1 h at room temperature and incubated with primary antibodies. Primary antibodies used (dilution) were goat anti-actin (1:5000) from Santa Cruz, rabbit anti-phospho-Akt (Ser473) (1:1000), rabbit anti-Akt (1:1000), rabbit anti-RPS6 (1:1000 or 1:5000), rabbit anti-phospho-RPS6 Ser235/236 (1:1000 or 1:2000), rabbit anti-4EBP1 (1:1000), rabbit anti-phospho-4EBP1 Thr37/46 (1:1000), rabbit anti-ATF4 (1:1000) and rabbit anti-GAPDH (1:500) from Cell Signaling Technologies, and mouse anti-tubulin (1:10,000) from Fisher Scientific. Membranes were probed overnight at 4˚C or for 1 h at room temperature with rocking. Then, membranes were washed three times for 7 min in Tris-buffered saline (ISC BioExpress, Cat No. 0788) with 0.1% Tween-20 (TBST). Secondary antibodies used were IRDye 680RD Donkey anti-Mouse IgG, IRDye 680RD Donkey anti-Goat, and IRDye 800 Donkey anti-Rabbit, all from LI-COR. Samples were probed with secondary antibodies at 1:15,000 in Odyssey Blocking Buffer (LI-COR) diluted 1:1 with TBST for 1 h at room temperature. Membranes were washed three times for 7 min in TBST, then imaged with the LI-COR Odyssey CLx Imaging System.
C11 581/591 BODIPY imaging.
The day before the experiment, 150,000 HT-1080 or 100,000 U-2 OS cells/well were seeded into 6-well plates that had one 22 mm2 glass coverslip in each well. The next day, the cells were treated with the appropriate compound(s) in the appropriate medium for 11 h (erastin2 treatment) in HT-1080 cells, or 22 h (INK 128 treatment) or 24 h (arginine deprivation) in U-2 OS cells. After the completion of treatment time, the treatment medium was removed and then the cells were treated with C11 BODIPY 581/591 (Molecular Probes) at a final concentration of 5 μM and Hoechst (Molecular Probes) at a final concentration of 1 μg/mL, both dissolved in HBSS, and incubated at 37°C for 10 min. After 10 min, the C11 BODIPY 581/591/Hoechst mixture was removed and fresh HBSS was applied to the cells. The cover slips were mounted in 25 μL HBSS onto glass microscope slides. Cells were imaged using a Zeiss Axio Observer microscope with a confocal spinning-disk head (Yokogawa), PlanApoChromat 63×/1.4 NA oil immersion objective, and a Cascade II:512 electron-multiplying CCD camera (Photometrics). Images were processed in ImageJ 1.48v.
Glutamate release assay.
Adherent cells were washed twice in cystine uptake buffer (137 mM choline chloride, 3mM KCl, 1 mM CaCl2, 1 mM MgCl2,5 mM D-Glucose, 0.7 mM K2HPO4, 10 mM HEPES, 300 μM cystine, pH 7.4). Uptake buffer containing DMSO or Erastin2 (1 μM) was added to cells and incubated for 60 min at 37°C. Cell media was then collected and added to a 96-well assay plate (Corning). For normalization purposes, cells were trypsinized and cell number was quantified using a Cellometer Auto T4 Bright Field Cell Counter. Glutamate release was detected using the Amplex Red Glutamic Acid/Glutamate Oxidase Assay kit (Thermo Fisher) per the manufacturer’s instructions. 10 μM H2O2 and 25 μM L-glutamate were included as positive controls. Fluorescence readings were recorded at ex/em 530/590 on a BioTek Synergy Neo2 multimode reader. Background fluorescence from blank uptake media was subtracted and samples were normalized to cell number.
Determination of metabolite abundance by mass spectrometry.
HT-1080 cells were seeded in 15 cm2 dishes and treated with ± erastin2 (1 μM) ± INK 128 (5 μM) or rapamycin (100 nM) for 10 h. Cells were trypsinized, harvested, and cell number was quantified using a Cellometer Auto T4 Bright Field Cell Counter. Cells pelleted at 1,500 × g for 5 min, and pellets were frozen at −80°C. Four biological replicates were collected and analyzed by Metabolon (Durham, NC) as described previously25.
Cancer therapeutics response portal analysis.
We obtained data from the Cancer Therapeutics Response Portal (CTRP) v2.1 at https://ocg.cancer.gov/ctd2-data-project/broad-institute-screening-dependencies-cancer-cell-lines-using-small-molecules-0. The data for statistically significant Pearson correlations between basal gene expression and sensitivity to erastin, RSL3 (denoted 1S,3R-RSL-3 in the dataset) and ML210 from all cancer cell lines available for analysis were extracted from the v21.data.gex_global_analysis.txt table and plotted using Prism 7.0.
Amino acid deprivation and resupplementation.
All amino acid deprivation experiments were conducted by treating cells in starvation media, resupplemented with stock solutions of the missing amino acid. DMEM minus arginine was constituted by supplementing DMEM for SILAC (Thermo Fisher), which lacks L-lysine and L-arginine, with a 1000x stock solution of L-lysine*HCl at 130 g/L. L-lysine is found in stock DMEM at 0.146 g/L, but once fully diluted with FBS and P/S, DMEM constitutes only 89% of the final volume. Thus, a 1000x stock was 130 g/L. Similarly, DMEM minus leucine was constituted by supplementing DMEM-LM (Thermo Fisher), which lacks L-leucine and L-methionine, with 1000x stock solution of L-methionine at 26.7 g/L, 89% of the 30 mg/L contained in DMEM. To minimize the contribution of monomeric amino acids contained in normal FBS, all medias were supplemented with 10% dialyzed FBS (dFBS, Thermo Fisher) and 1% P/S.
Small-scale cell death analysis for amino acid manipulations and small molecule treatments.
The effects of amino acid deprivation and inhibitors on cell death were investigated in several ways. For amino acid deprivation experiments, most experiments used U-2 OSN cells. These cells were seeded overnight at either 20,000 cells/well in 24-well plates (BD Falcon), 40,000 cells/well in 12-well plates (Corning), or 100,000 cells/well in 6-well plates (Corning), in McCoy’s 5A medium. The next day, cells were washed once in pre-warmed HBSS, the medium was then replaced with DMEM-base resupplementation medium, as described above, containing different treatment conditions, and incubated in a Thermo tissue culture incubator (37°C, 5% CO2) for 48 h. Treatment conditions were medium lacking Arg only, medium lacking leucine only, medium lacking Arg and resupplemented with L-Arg, D-Arg or L-citrulline (all at 356 μM), medium lacking Arg resupplemented with increasing concentrations of L-Arg to enable the calculation of the L-Arg EC50 using four-point logistic regression in Prism 7, and medium lacking Arg and supplemented with buthionine sulfoximine (BSO, 1 mM). BSO was dissolved directly into the medium at the final concentration.
Cell death ± erastin2 ± Arg was examined in HT-1080N, T98GN, A549N, Caki-1N, H1299N, H23Cas9,N, U-2 OSN and A375N cells, all seeded in 24-well plates at 20,000 cells/well, with treatments starting the next day. Erastin2 concentrations used are given in the figure legend. Lethal fraction scores at 48 h were computed using STACK as described above. In one experiment, A375N, Caki-1N, H1299N, T98GN, and U-2 OSN cells were seeded at a density of 3,400 cells/well in 96-well plates then, the next day, cotreated with erastin2 or ML162 ± cycloheximide (CHX, 2.5 μg/mL) ± buthionine sulfoximine (BSO, 1 mM) and cell death determined over 72 h using STACK.
Determination of GSH levels using Ellman’s reagent.
Total glutathione levels were analyed using the Glutathione Assay Kit (Cayman Chemical, Cat No. 703002). U-2 OS cells were seeded at a density of 100,000 cells/well in McCoy’s 5A medium in 6-well plates. Following treatment, cells were washed once in ice cold PBS. DMSO-treated cells were scraped into 500 uL MES collection buffer while Era2-treated cells were scraped into 50 uL to concentrate depleted GSH due to low assay sensitivity. Importantly, GSH measurements were normalized to protein concentration which was equivalently concentrated with this method. Cells were sonicated with 10 one-second pulses at maximum amplitude with a Fisher Scientific Model 120 Sonic Dismembrator (Thermo Fisher) to lyse cells. To exclude debris, lysate was centrifuged at 12,700 RPM for 15 minutes at 4°C and supernatant was isolated. 25 μL of lysate was aliquoted and stored frozen at −20 °C for under a week before a Bradford Assay was performed to determine the protein concentration for normalization. The rest of the lysate was deproteinated by adding one volume of 0.1 g/mL metaphosphoric acid (Acros Organics), vortexing thoroughly, then centrifuging at 12,700 rpm for 3 min at room temperature. Metabolite extract was stored at −20°C for under a week before total GSH+GSSG levels were determined using Ellman’s reagent (DTNB, 5,5’-dithio-bis-2-nitrobenzoic acid) according to manufacturer’s instructions. Data are presented as DNTB fluorescence normalized to total protein or to a known GSH standard curve.
Puromycylation assay.
U-2 OS cells were seeded at a density of 100,000 cells/well in McCoy’s 5A medium in 6-well plates. The next day, cells were washed once in warm HBSS, and the medium was replaced with DMEM-base resupplementation medium, as described above, with or without Arg, leucine, or INK 128 (1 μM). After 16 h, the treatment medium was removed and cells were pulse-labelled for 15 min in the same medium containing puromycin (10 μg/mL). After 15 min, cells were harvested and processed via Western blot as described above. The primary antibodies were mouse anti-puromycin (EMD Millipore, dilution: 1:5000) and rabbit anti-GAPDH (dilution: 1:1000). Results were quantified and normalized to 1 by computing the ratio of anti-puromycin signal to the GAPDH signal within each treatment condition.
RT-qPCR.
U-2 OS cells were seeded at a density of 100,000 cells per well in 2 mL of McCoy’s 5A medium in 6-well plates. The next day, cells were washed once in HBSS then the medium was replaced with DMEM-base resupplementation medium ± Arg for 16 h. After 16 h, cells were carefully washed twice with ice cold HBSS. Cells were then gently scraped into 1 mL HBSS and centrifuged at 3,000 rpm for 2 min. The supernatant was removed and RNA extracted using the QiaShredder (Qiagen) and RNeasy (Qiagen) kits according to the manufacturer’s instructions. RNA was eluted in 65 μL DNase/RNase free water and stored at −80°C. cDNA synthesis reaction was performed using the Taqman Reverse Transcriptase Kit (Life Technologies), with 5.5 mM MgCl2, 500 μM dNTPs, 2.5 μM DT oligos, 2.5 μM hexamers, 0.4 units/μL RNAse inhibitor and 3.125 units/μL reverse transcriptase. 1 μg of RNA was used per reaction. cDNA was synthesized using a ProFlex PCR System (Applied Biosystems) thermocycler with the following program: 25°C for 10 min, 48°C for 40 min, and 95°C for 5 min. cDNAs were stored at −20°C. qPCR reactions were run using SYBR Green Master Mix (Life Technologies) and run on the Applied Biosystems QuantStudio 3 real-time PCR machine (Thermo Fisher). Data were analyzed using the ΔΔCT method using ACTB as a control. Primers for qPCR were as follows: ACTB (F: ATCCGCCGCCCGTCCACA R: ACCATCACGCCCTGGTGCCT), CBS (F: TGAGATCCTGCAGCAGTGTG R:CTCCTTCAGCTTCCTGGCAA), CTH (F: CCAGCACTCGGGTTTTGAATA R: TGCCACTTGCCTGAAGTACC).
Data availability statement.
Underlying deviation scores for the kinetic modulatory profile, mean signal suppression for the cell-free DPPH assay, and mean signal suppression for the cell-free ferrozine assay, are available as Source Data. Uncropped Western blots are available as Source Data and in the Supplementary Information.
Code availability statement.
The manuscript does not report any custom code.
Extended Data
Extended Data Fig. 1. Examination of compound interactions on cell death.
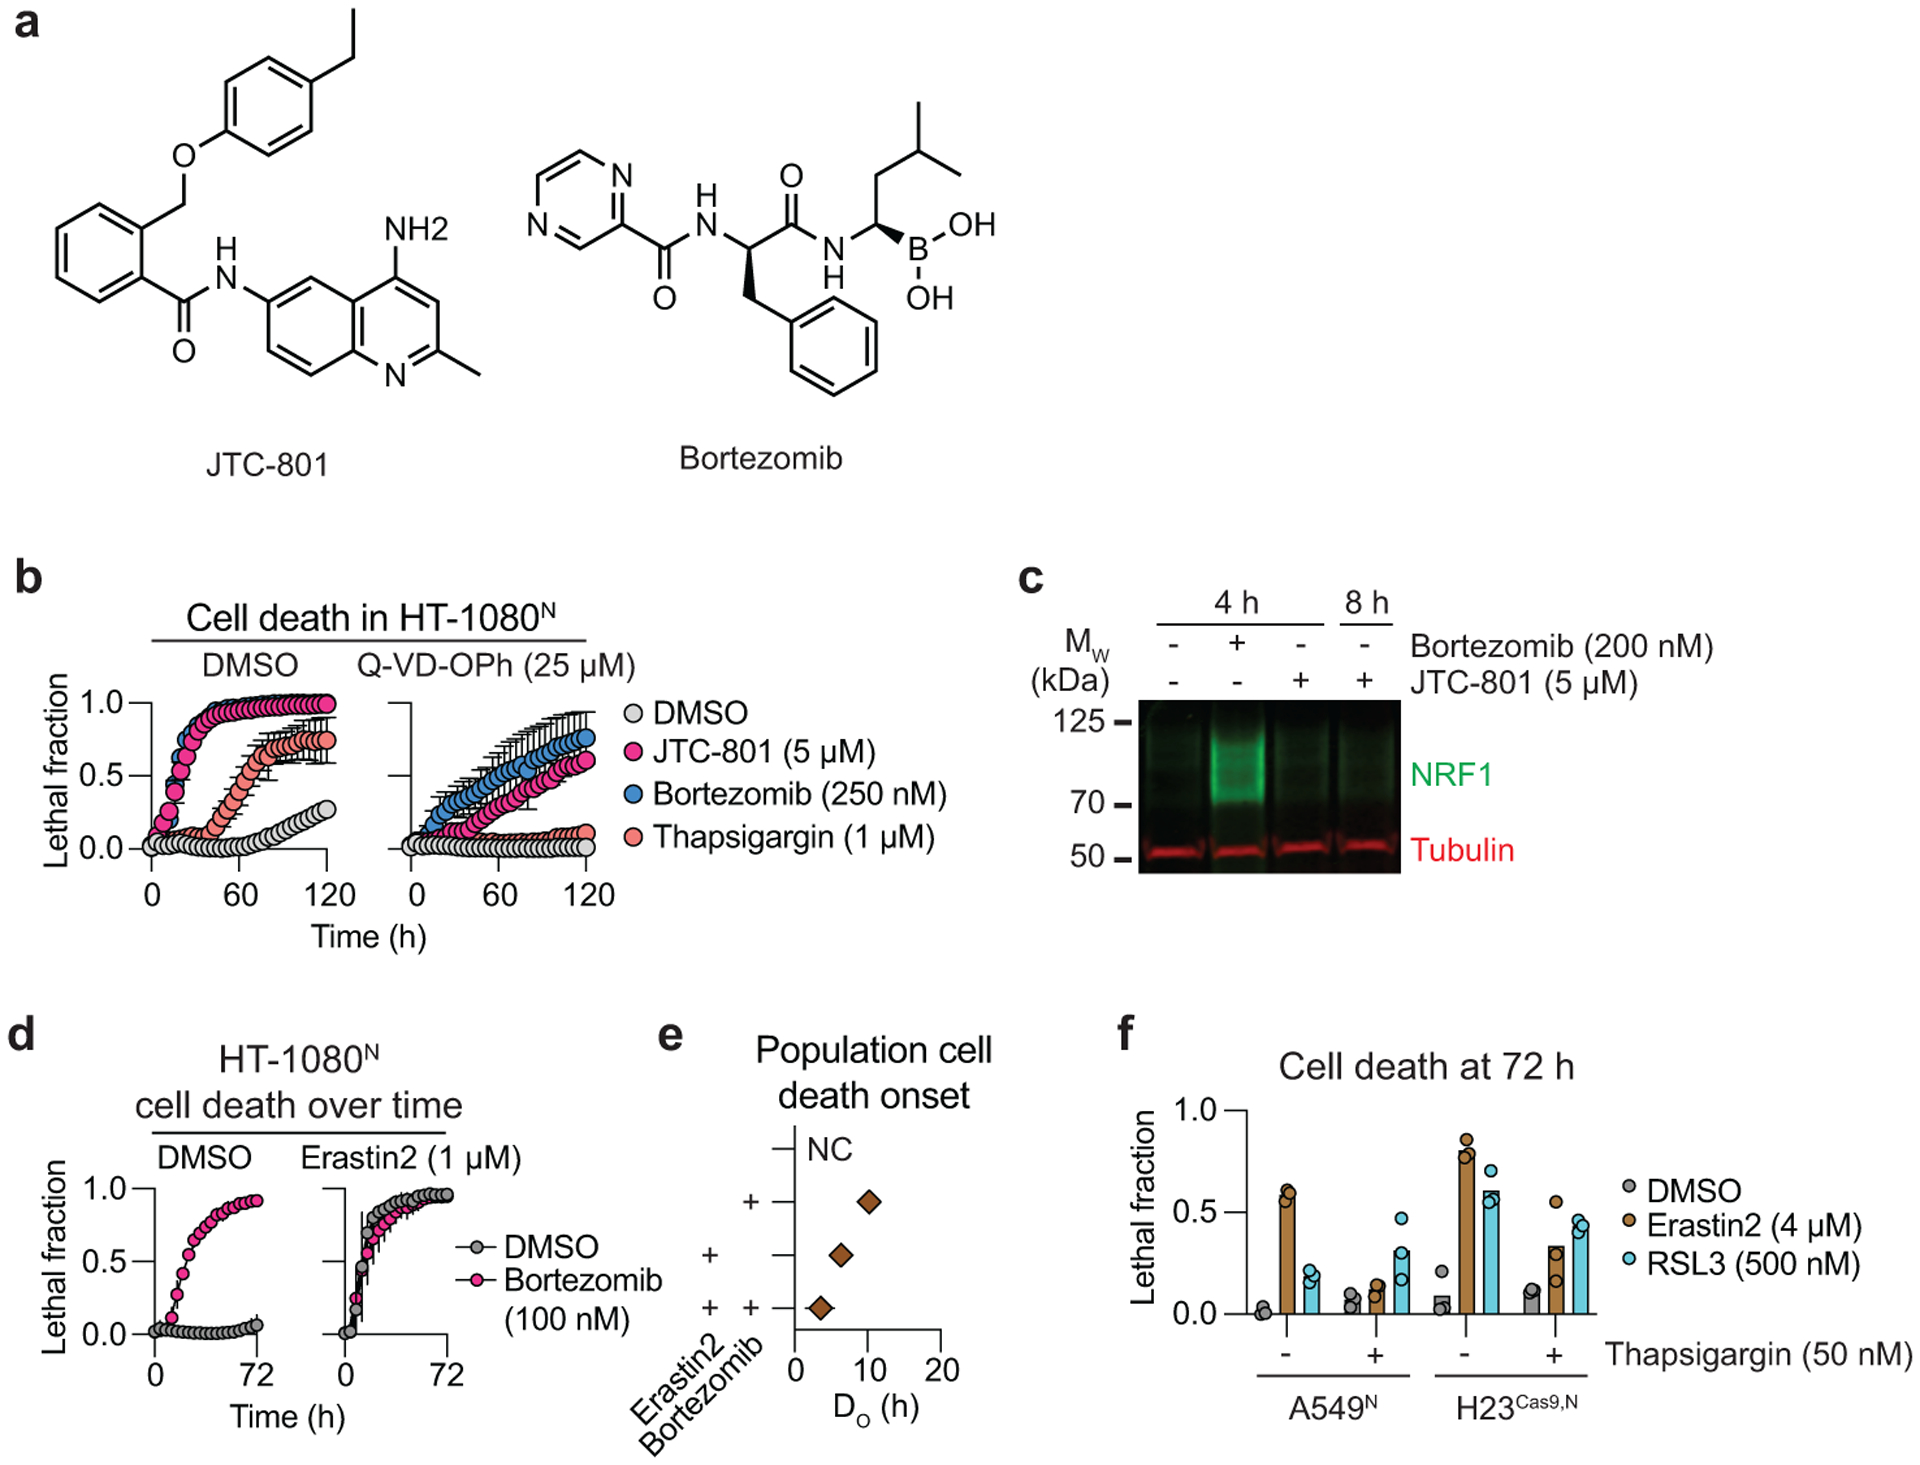
a, Chemical structures. b, Cell death determined using STACK. c, NRF1 (NFE2L1) protein levels. Blot is representative of three independent experiments. d, Cell death determined using STACK. e, Quantification of the timing of population cell death onset (DO) from the lethal fraction curves in d. f, Cell death in two different cell lines determined using STACK. Results in b, d and e are mean ± SD from three independent experiments, while in f results are from two or three independent experiments.
Extended Data Fig. 2. Investigating ferroptosis inhibitors.

a, Cell death data extracted from the compendium for erastin treatment. Each dot represents a single modulator compound, tested once at 5 μM, organized together by major target class. Lower nAUC values indicate greater death suppression. MEKi: mitogen activated protein kinase kinase 1/2 inhibitors (n = 14); AdRm: adrenergic receptor modulators (n = 55); ER/PRm: estrogen/progesterone receptor modulators (n = 29); VEGFRi: vascular endothelial growth factor receptor inhibitors (n = 20); K+Cm: potassium channel modulators (n = 19). The vertical dotted line indicates the mean lethality of the control erastin + DMSO conditions. b, Cell death determined by counting SYTOX Green positive (SG+) objects. The experiment was performed twice on different days and data represents mean ± SD.
Extended Data Fig. 3. Cell free RTA and iron chelator profiling.
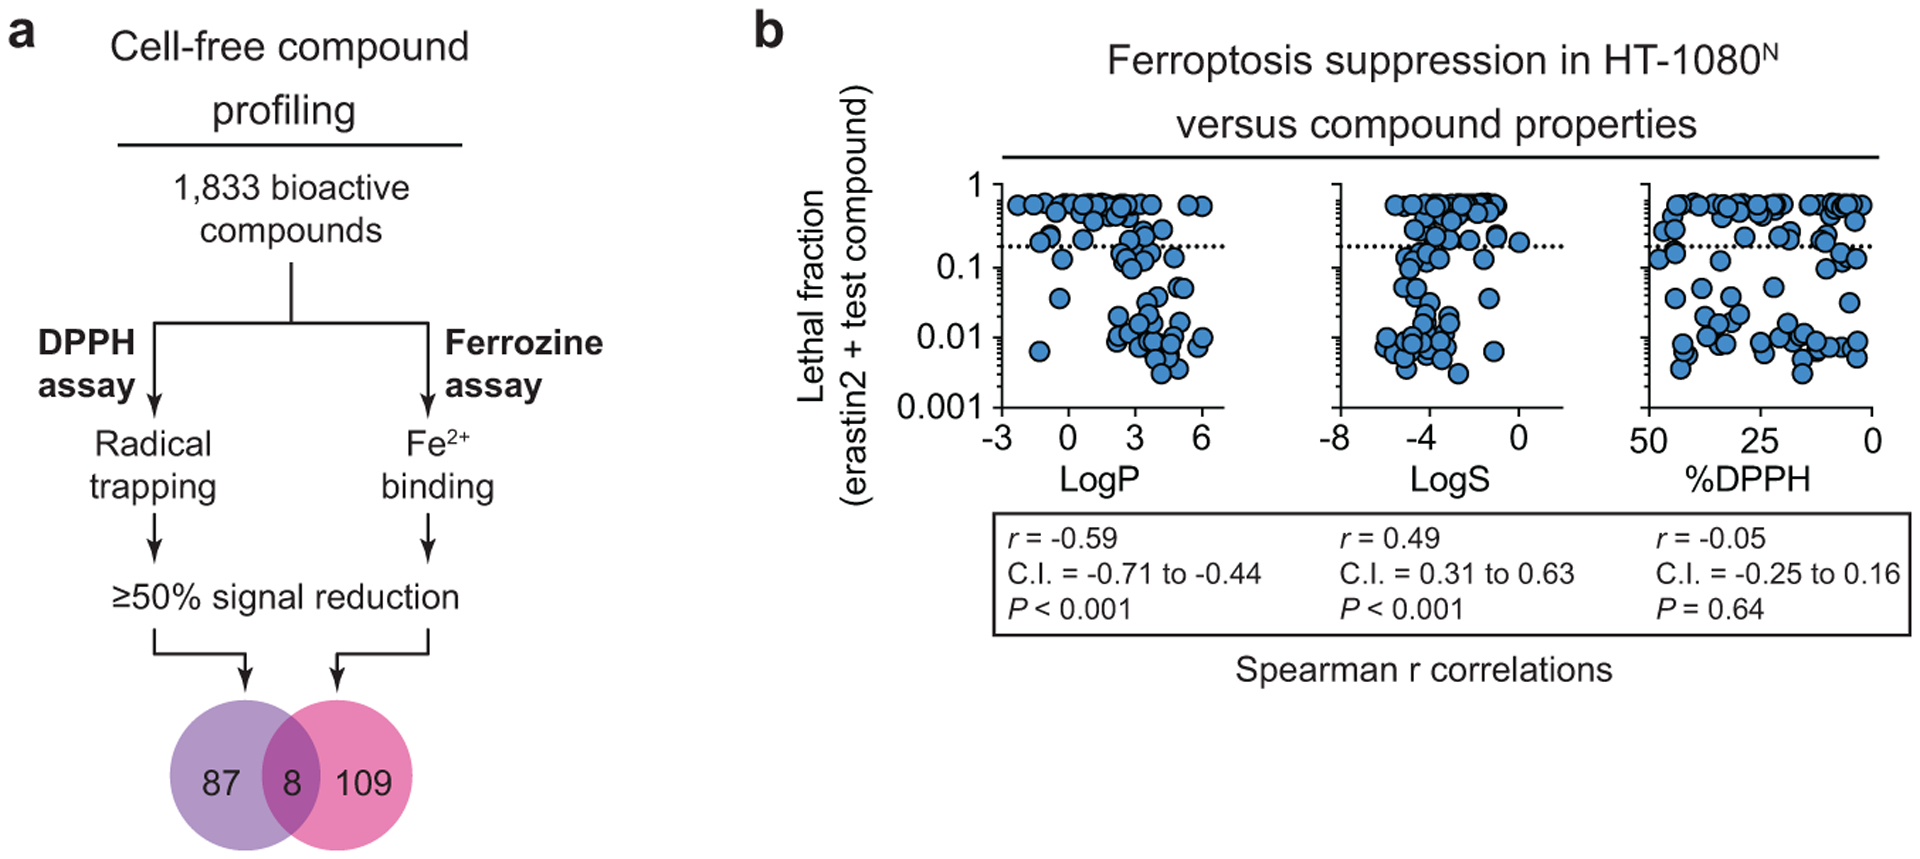
a, Overview of cell free compound profiling for radical trapping and Fe2+-binding activity. b, Cell death at 48 h in HT-1080N cells treated with erastin2 (1 μM) and candidate radical trapping compounds (50 μM, n =100) plotted against predicted hydrophilicity (LogS), predicted lipophilicity (LogP) and the %DPPH inhibition values from the cell-free assay. Dotted lines indicate a lethal fraction of 0.2. Spearman correlation values are reported with the 95% confidence interval (C.I.). Exact P value (two-tailed) are reported where computable.
Extended Data Fig. 4. Bazedoxifene suppresses ferroptosis in mammalian cells.
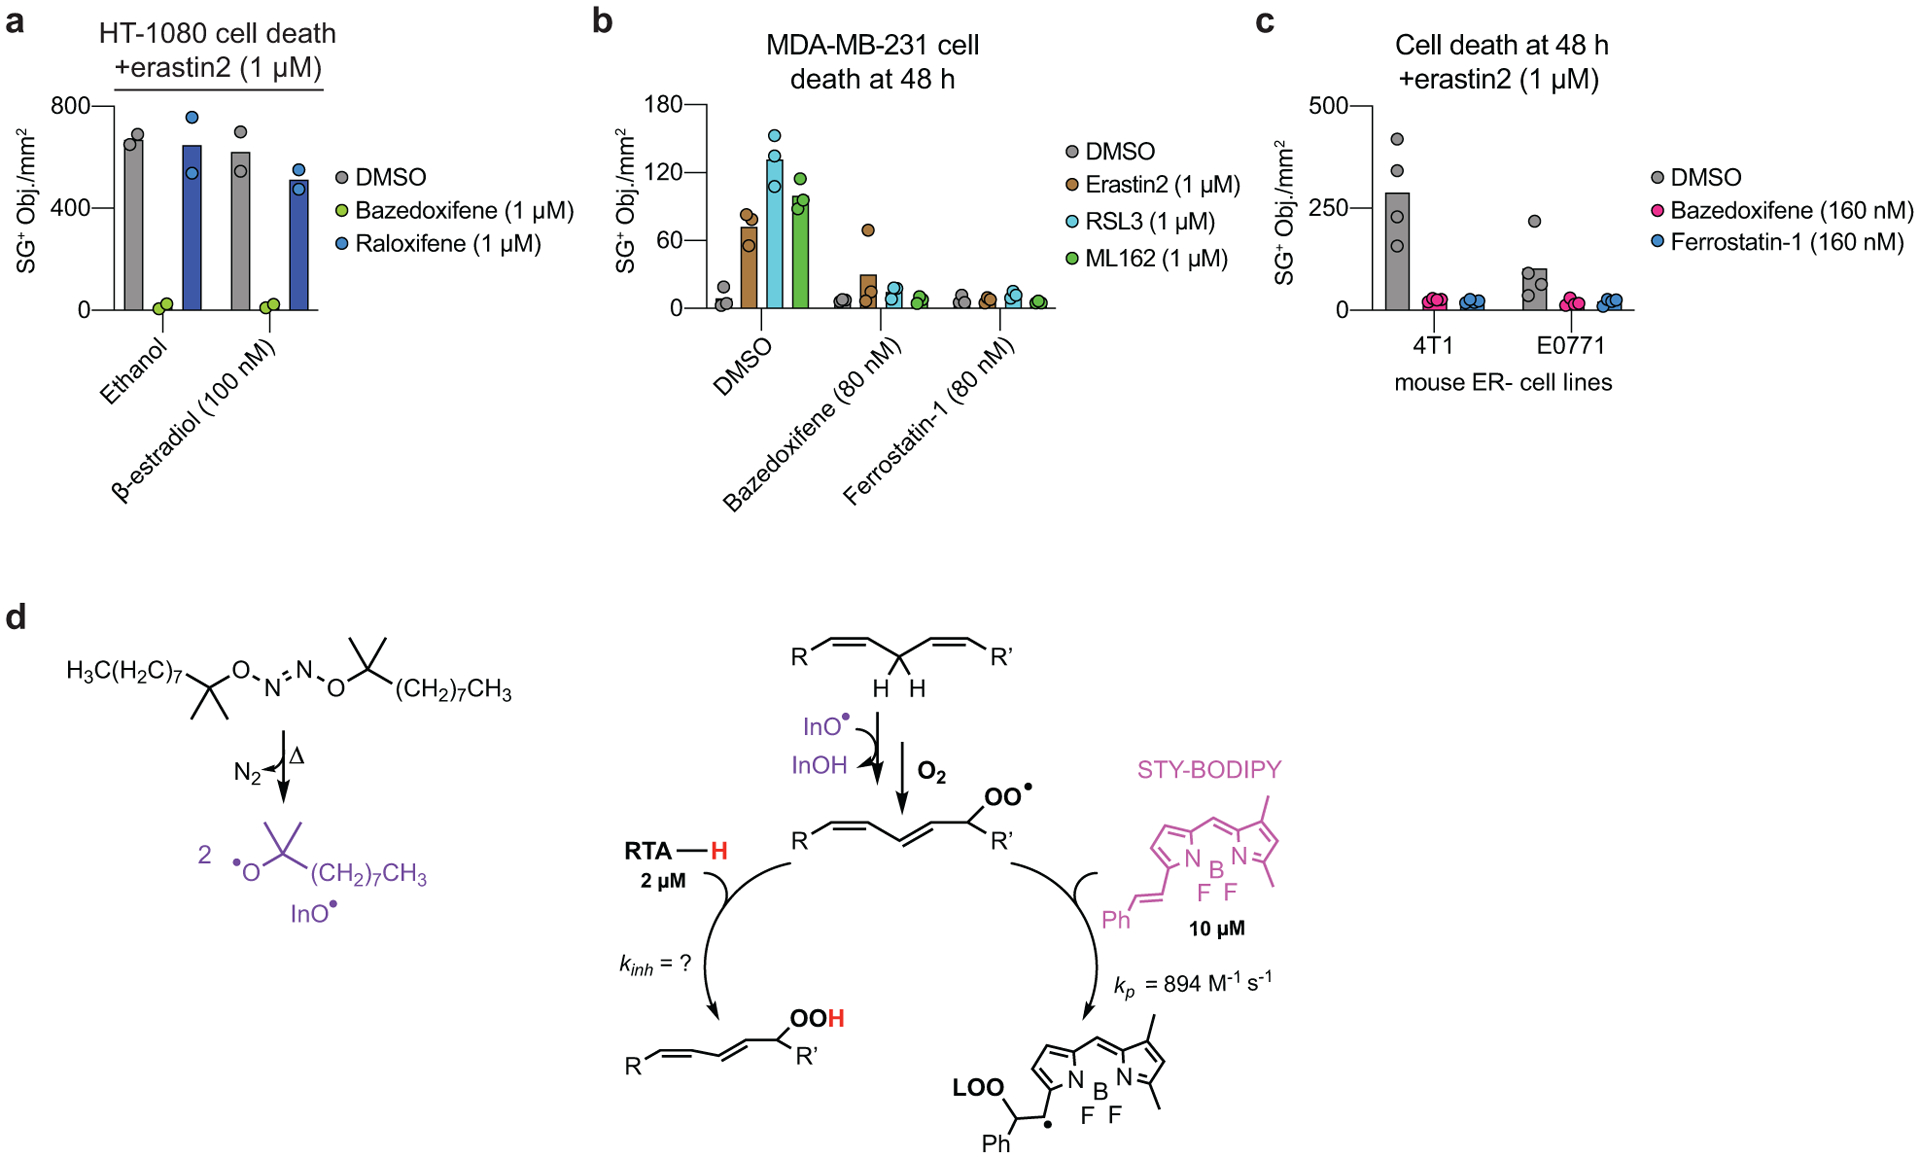
a, Cell death quantified as the number of SYTOX Green positive (SG+) objects (i.e. dead cells) over time. Data are mean ± SD from two independent experiments. b,c, Cell death quantified by SG+ object counting. Data are from three or four independent experiments. d, Outline of the STY-BODIPY kinetic competition assay. Egg-phosphatidylcholine (1 mM) and STY-BODIPY (10 μM) are incubated with 0.2 mM di-tert-undecyl hyponitrite (DTUN), in addition to a radical trapping antioxidant (RTA-H).
Extended Data Fig. 5. Bazedoxifene prevents ferroptosis in C. elegans.
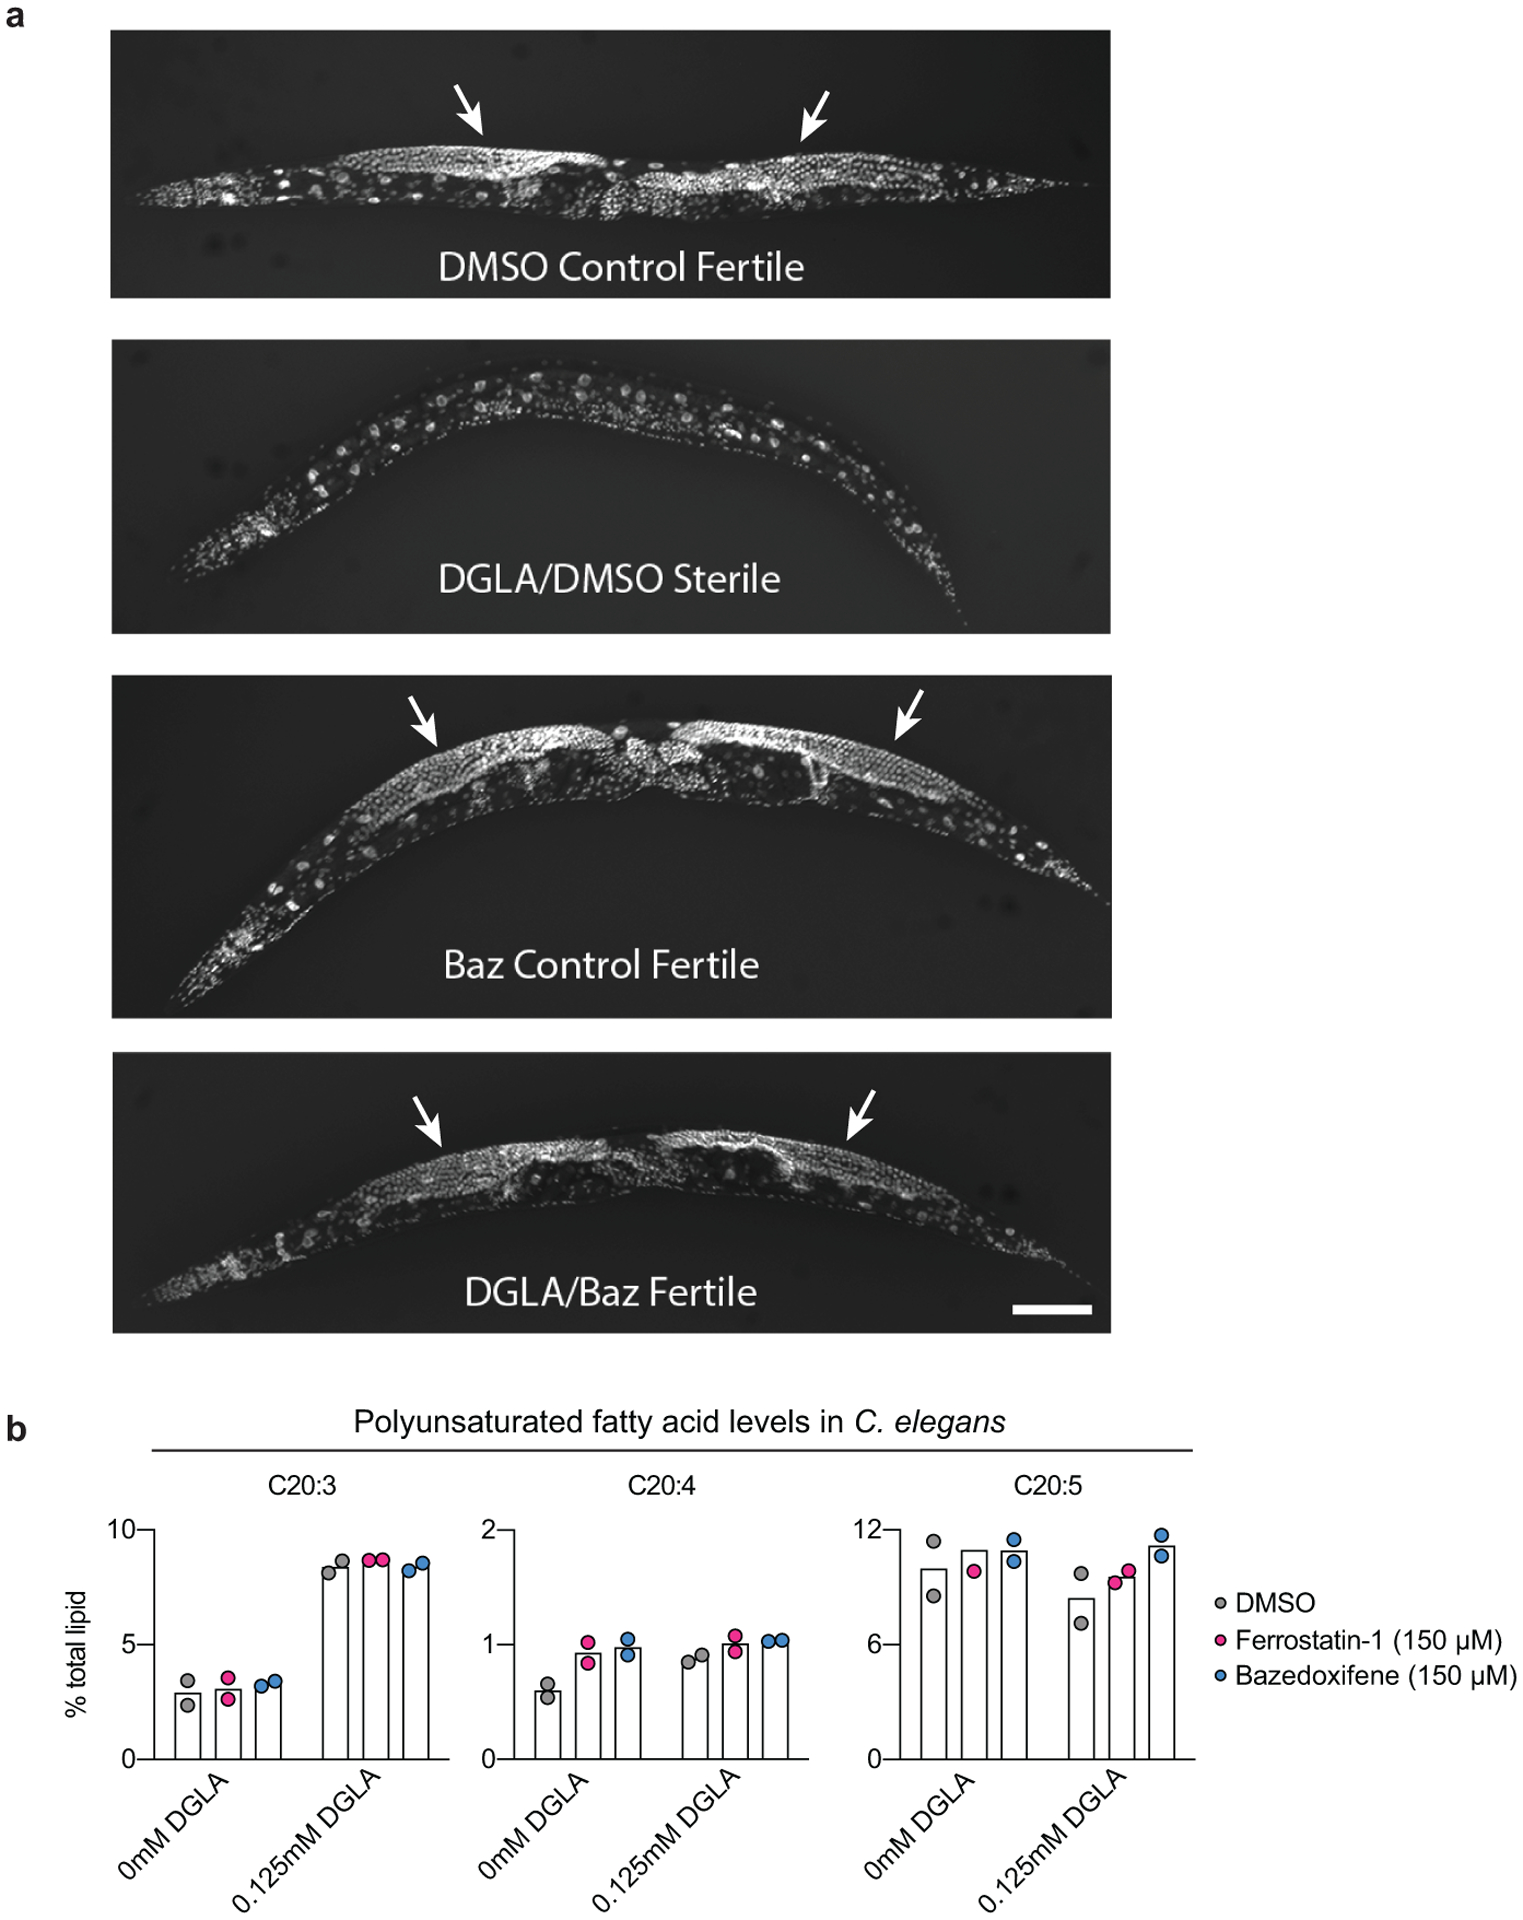
a, Representative images of DAPI-stained adult C. elegans under the different treatment conditions indicated below each image. The gonads of fertile worms are indicated (arrows). DGLA: dihomo-γ-linolenic acid (125 μM); Baz: bazedoxifene (150 μM). Scale bar = 100 μm. Imaging was repeated twice and representative animals from one experiment are shown. b, Polyunsaturated fatty acid levels as a function of total lipids determined in worms using gas chromatography/mass spectrometry. Results are from two independent experiments on separate populations of worms.
Extended Data Fig. 6. mTOR regulates ferroptosis sensitivity.
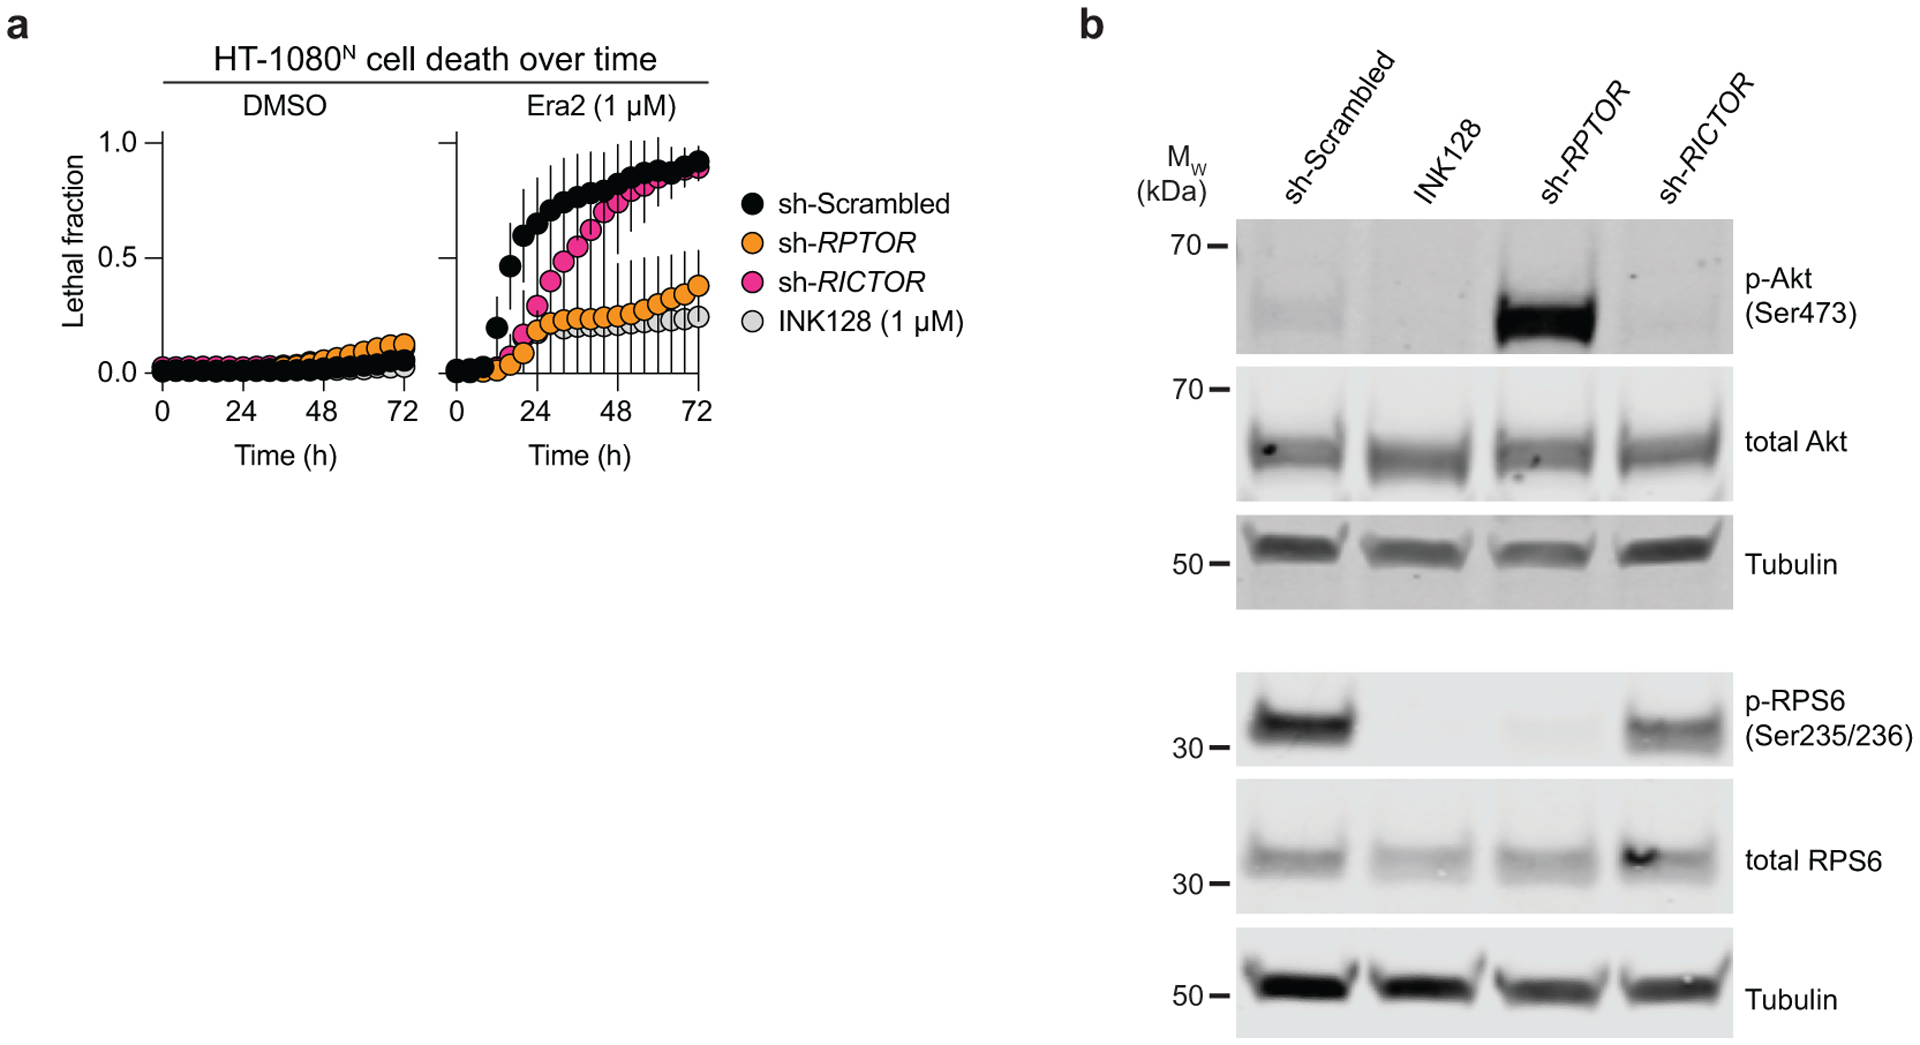
a, Cell death over time determined using STACK. Cells were infected with control (scrambled) shRNA or shRNAs targeting RPTOR or RICTOR for 72 h prior to compound treatment. INK128 was used as a positive control. Results are mean ± SD from three independent experiments. b, Expression and phosphorylation of proteins in the mTOR pathway following infection of HT-1080 cells as in a for 48 h. Blot is representative of three independent experiments.
Extended Data Fig. 7. mTOR inhibitors suppress ferroptosis.
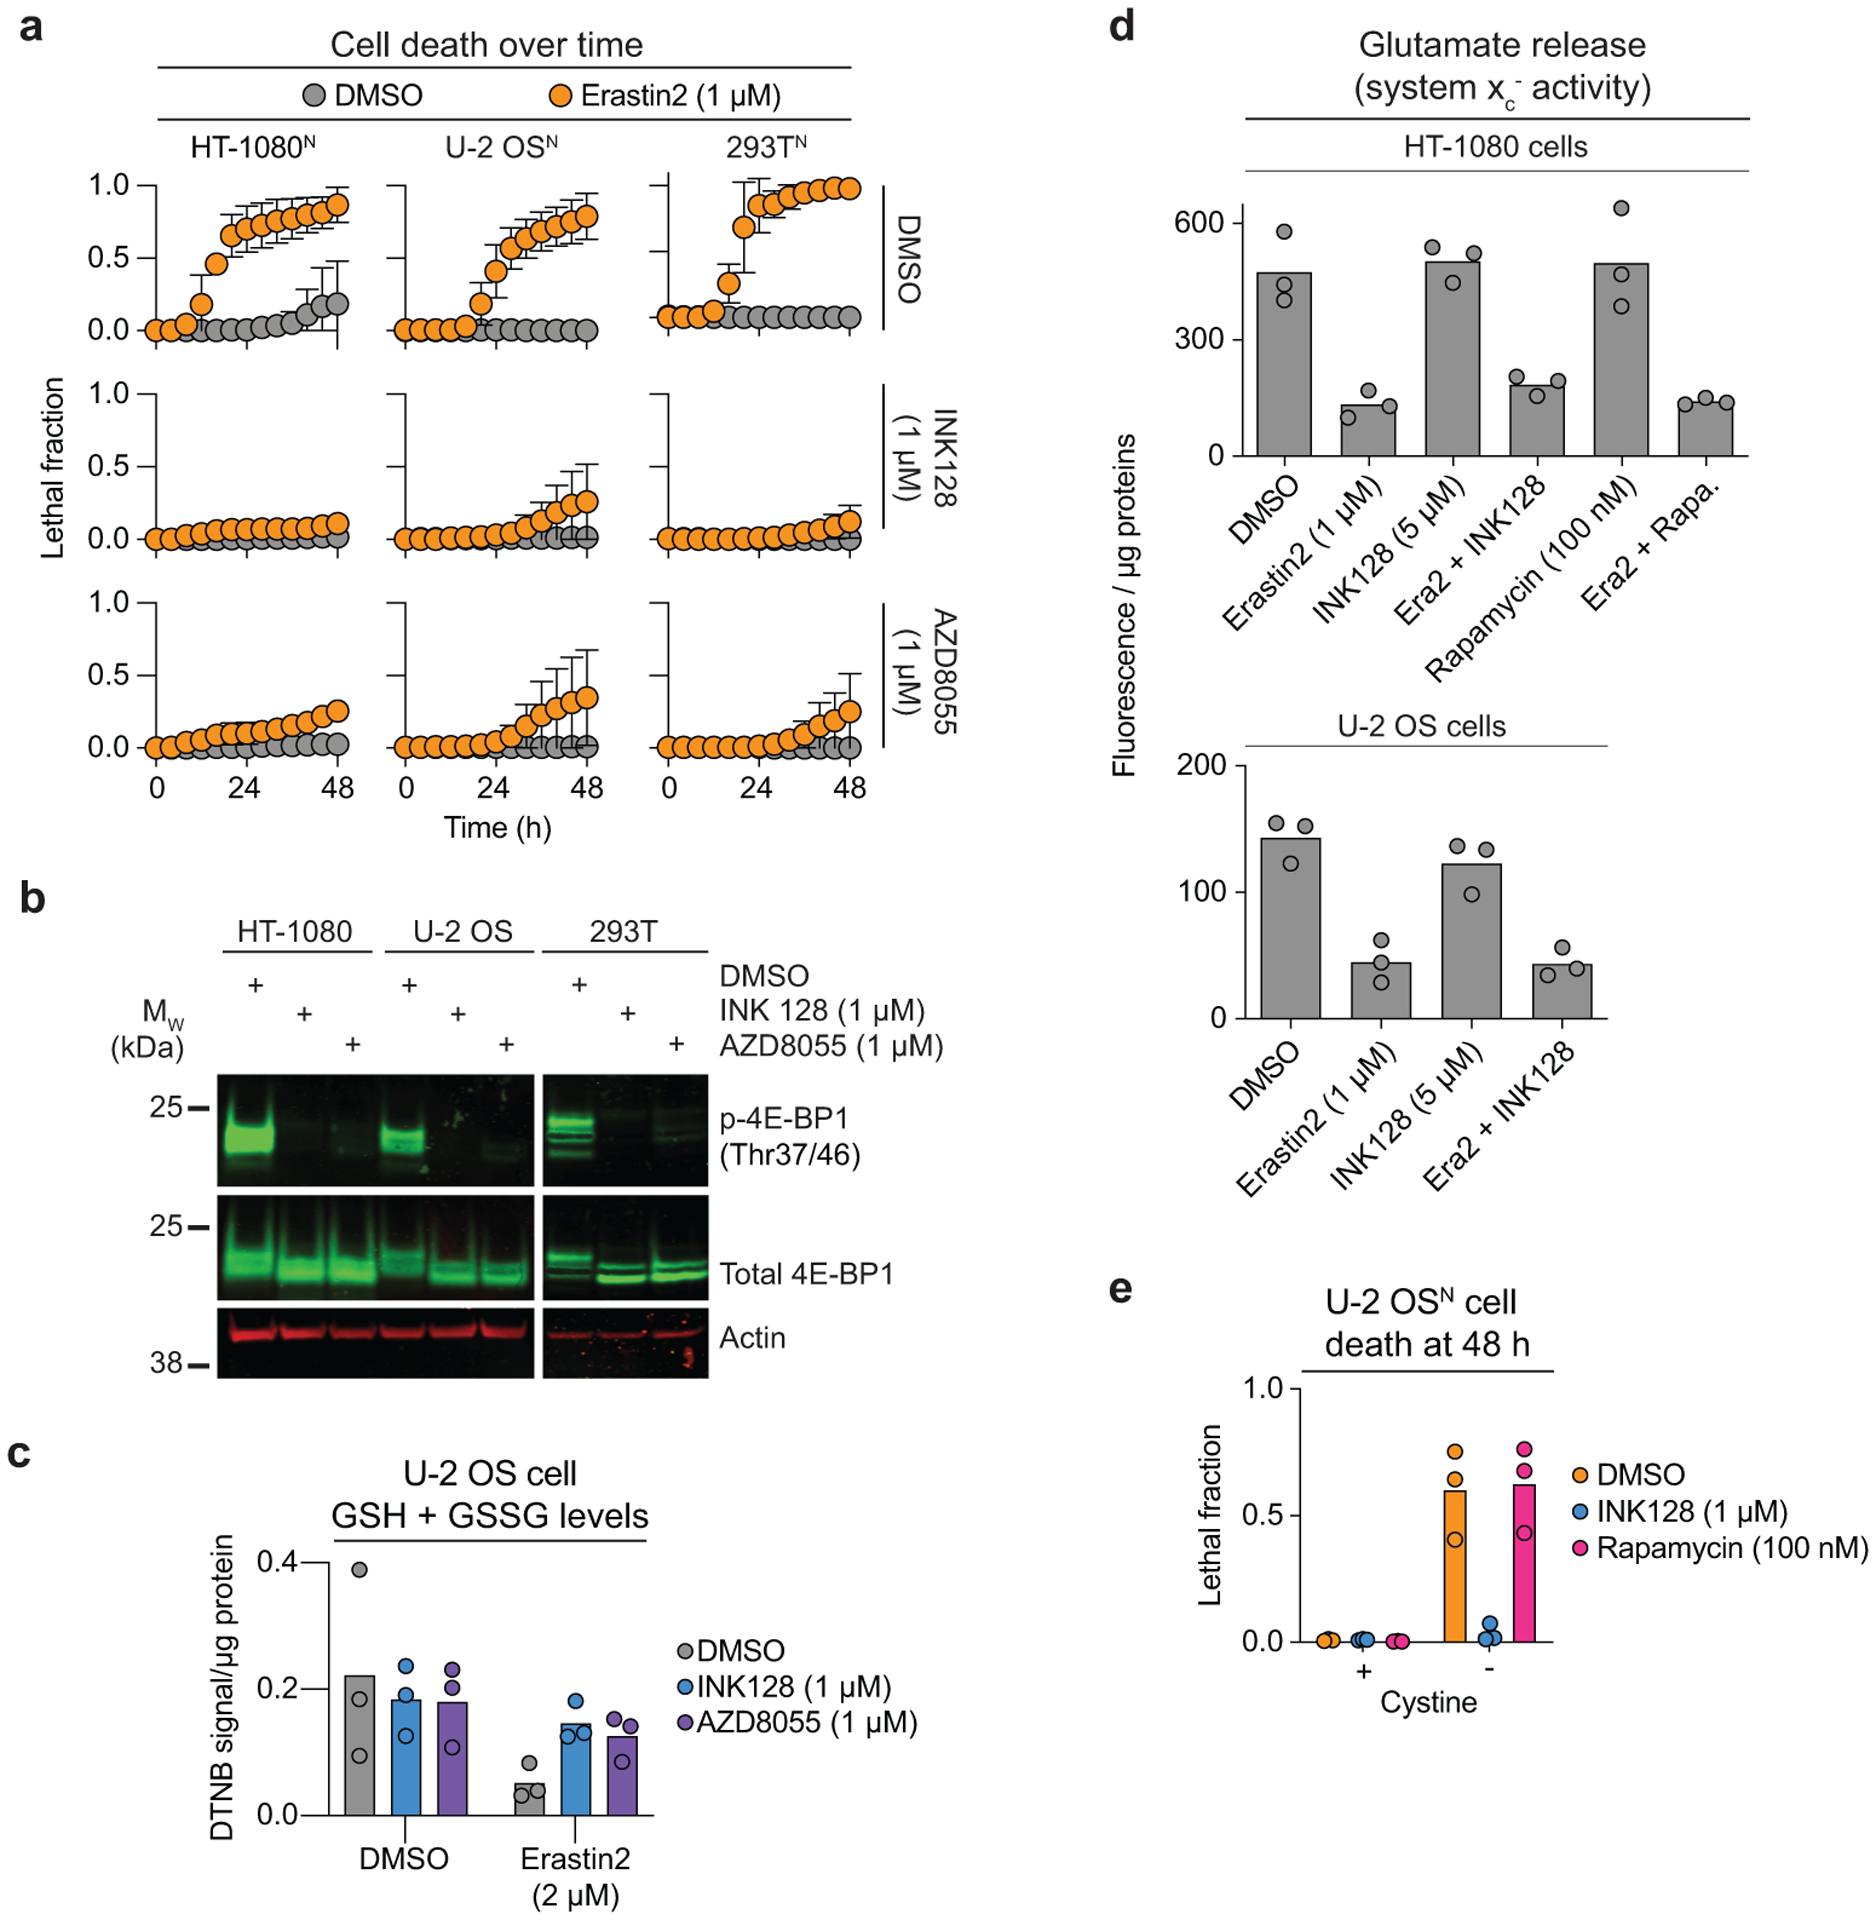
a, Cell death determined using STACK in three different cell lines. Results are mean ± SD from three independent experiments. b, 4E-BP1 protein phosphorylation and total levels. Blot is representative of three independent experiments. c, Total glutathione (GSH+GSSG) levels measured using Ellman’s reagent (DNTB). d, System xc− activity inferred from glutamate release over 2 h from HT-1080 and U-2 OS cells treated as indicated. e, Cell death determined using STACK. Results in c-e are from three independent experiments
Extended Data Fig. 8. mTOR and protein synthesis regulate ferroptosis.
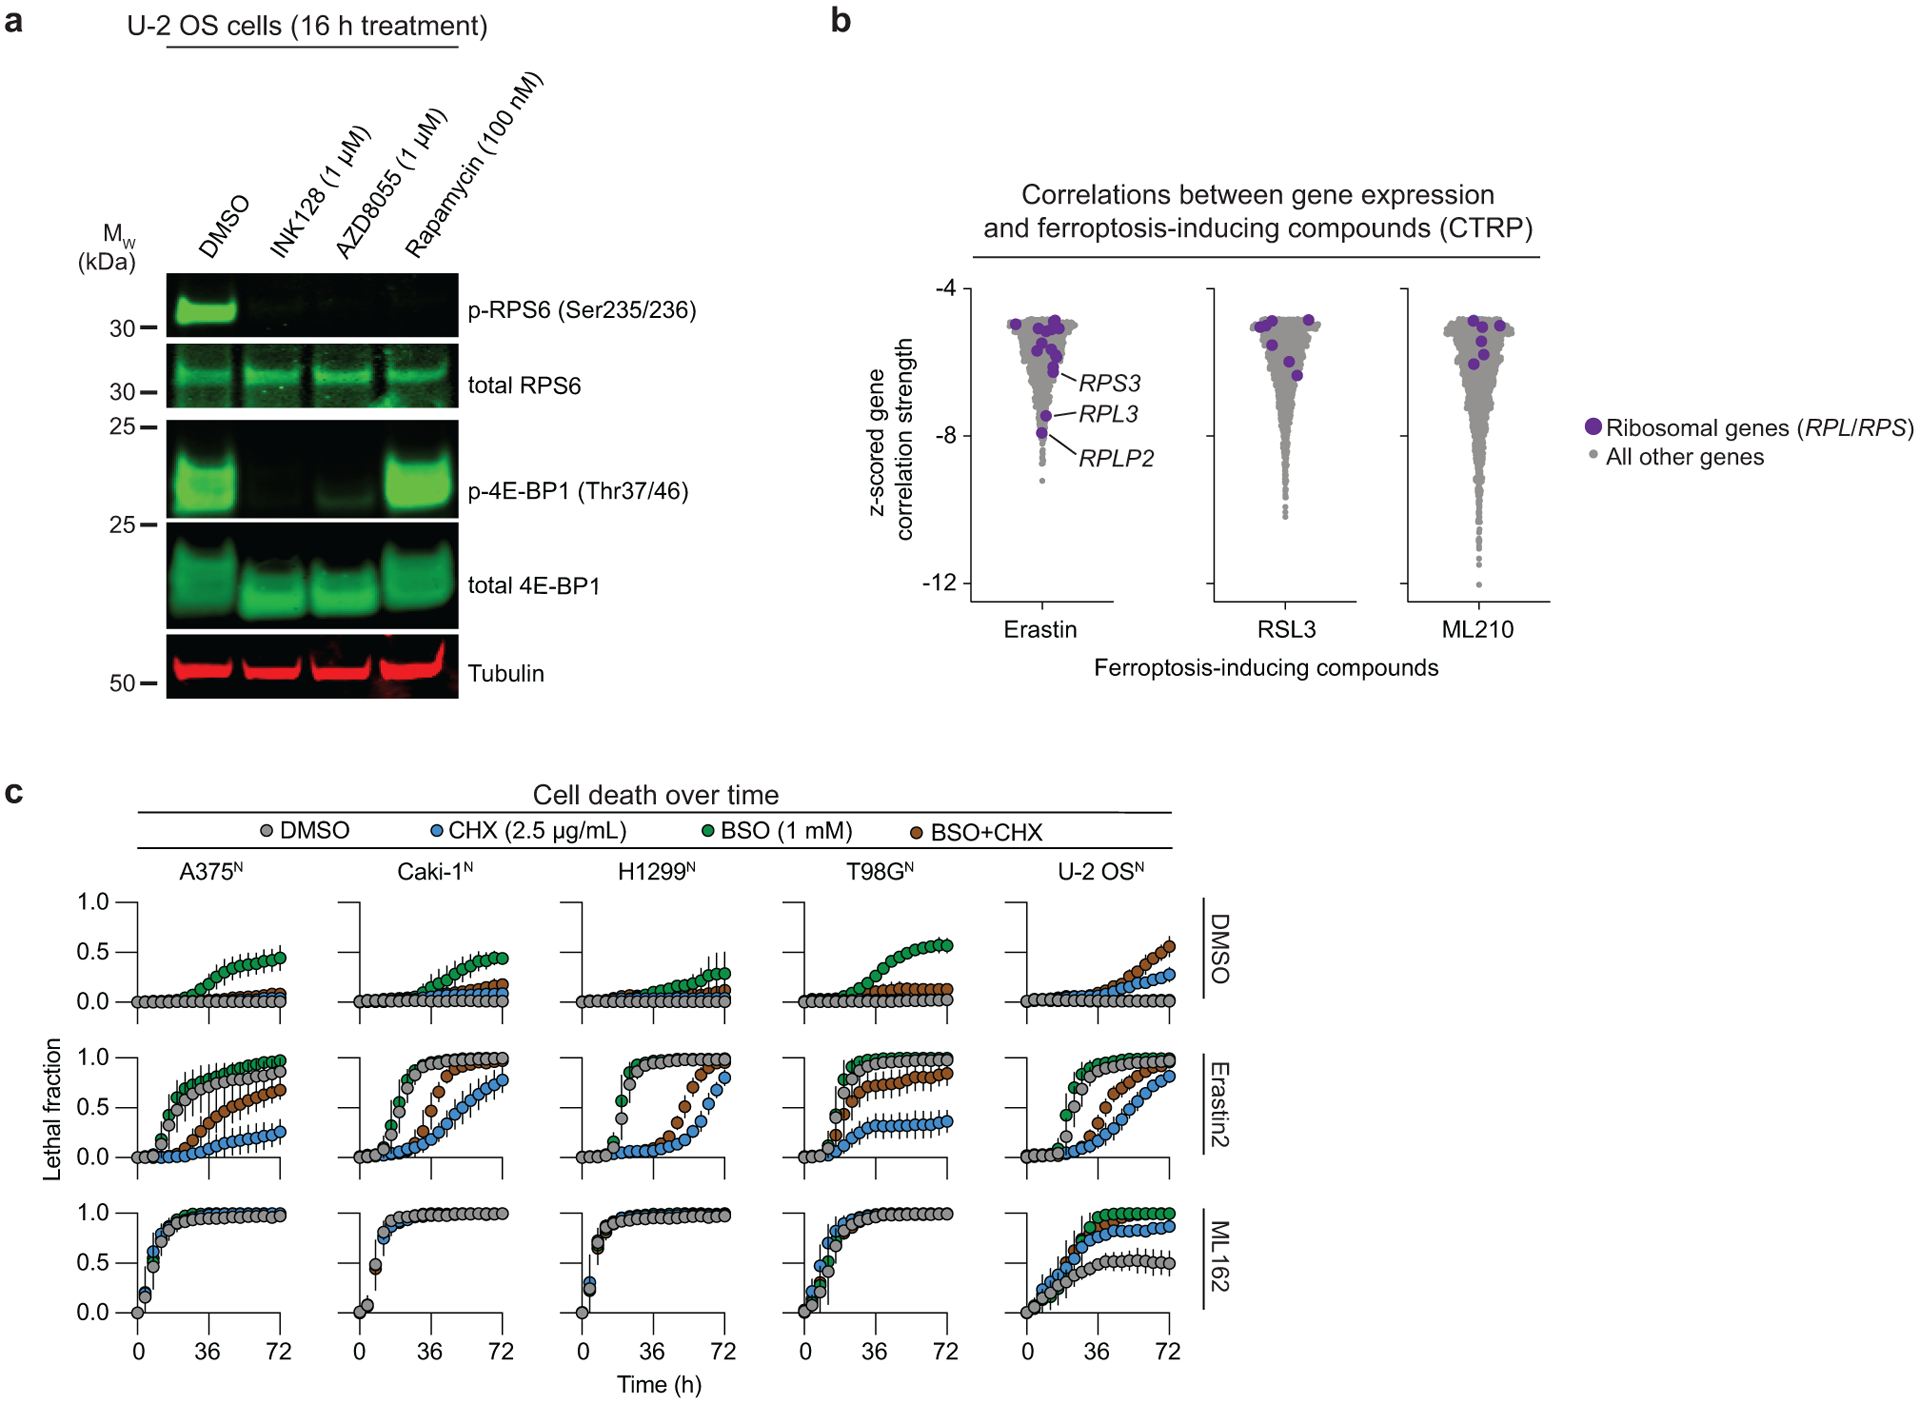
a, Phosphorylation and levels of mTOR pathway effectors in U-2 OS cells. Blot is representative of three independent experiments. b, Analysis of Cancer Therapeutics Response Portal (CTRP) dataset for ferroptosis-inducing compounds. c, Cell death determined using STACK. Erastin2 was used at 2 μM in all cell lines except Caki-1N (1 μM), ML162 was used at 4 μM in all cell lines except Caki-1N (2 μM). CHX: cycloheximide, BSO: buthionine sulfoximine. Results are mean ± SD from three independent experiments.
Extended Data Fig. 9.
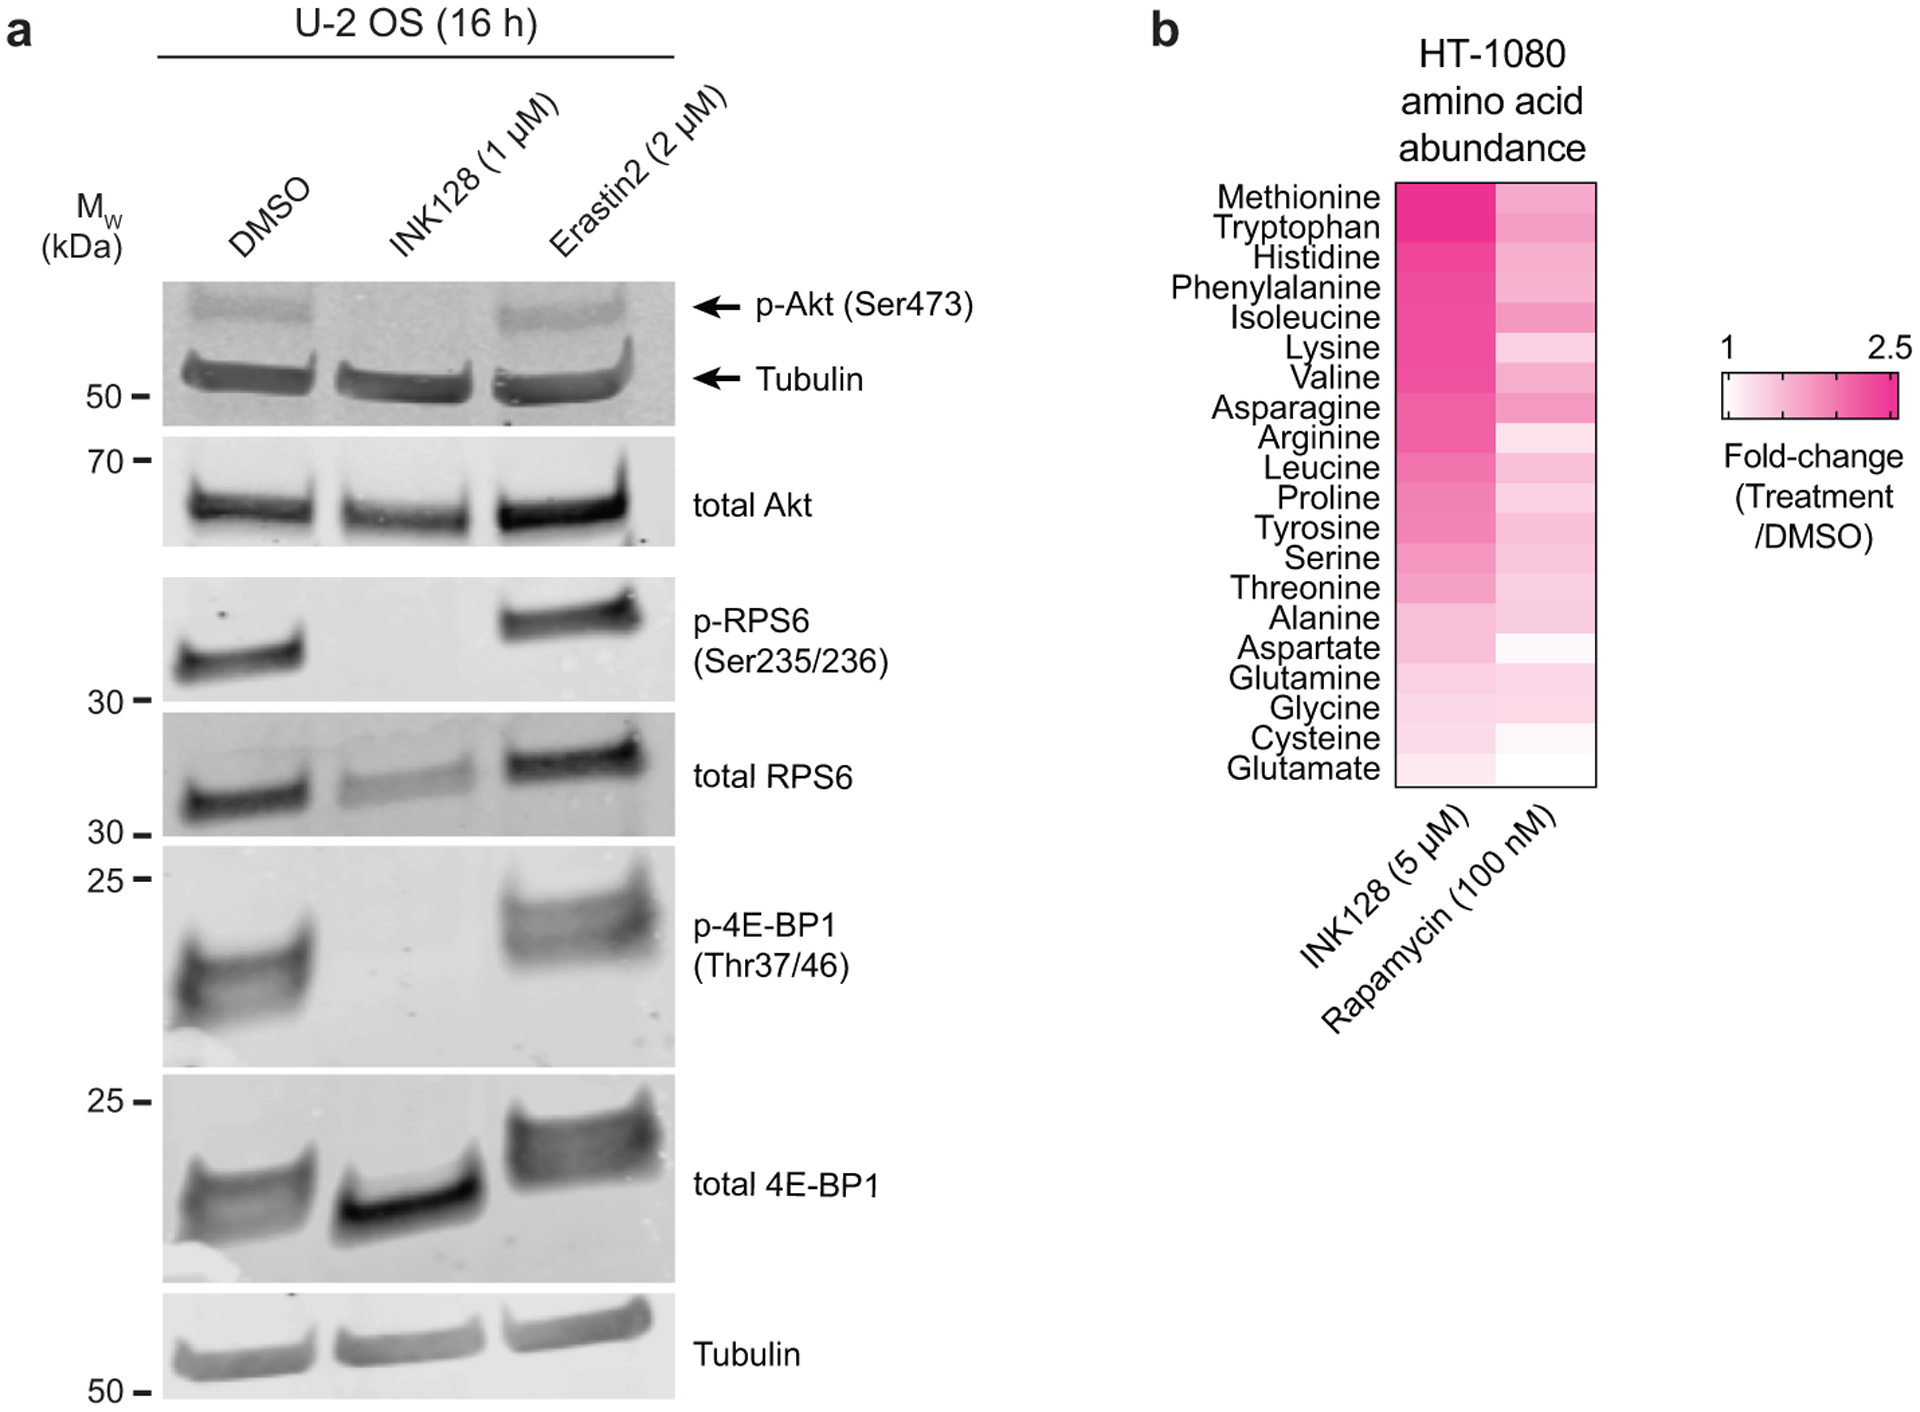
a, Phosphorylation and levels of mTOR pathway effectors. Blot is representative of three independent experiments. b, Fold-change in amino acids levels in HT-1080 cells determined using liquid chromatography coupled to mass spectrometry.
Extended Data Fig. 10. Arginine uptake regulates ferroptosis.
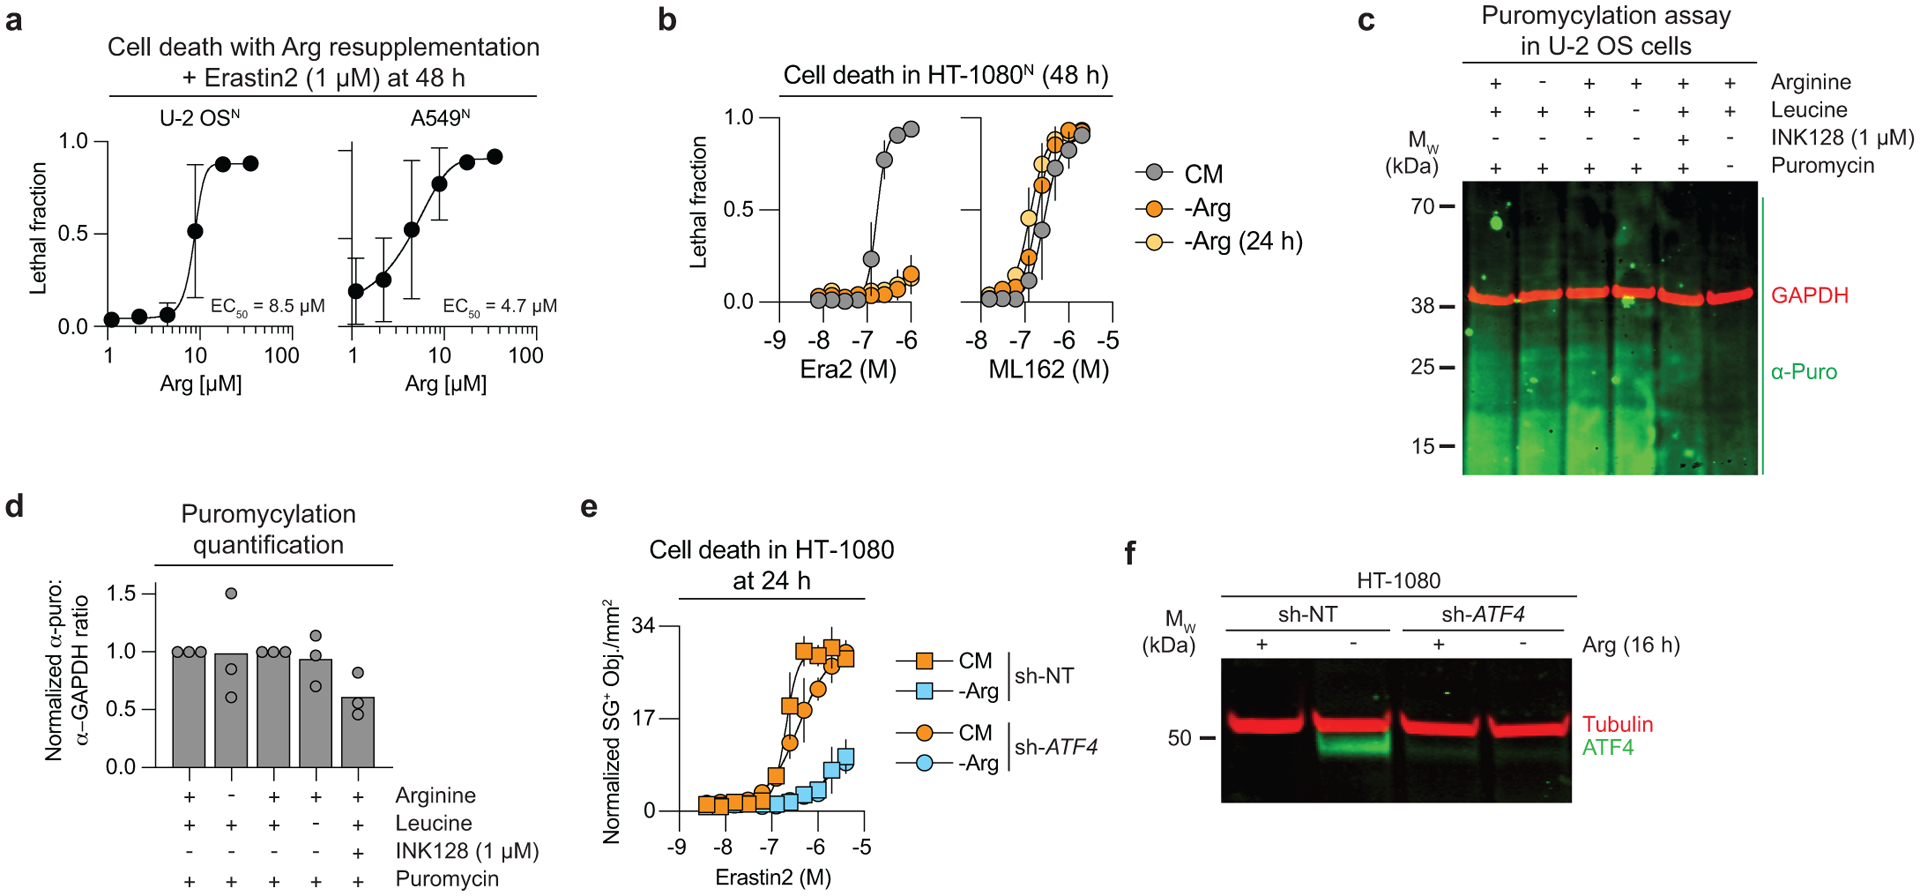
a, Dose-dependent effect of arginine (Arg) resupplementation on erastin2-induced cell death determined using STACK. Erastin2 was used at 2 μM (U-2 OSN) or 4 μM (A549N). b, Cell death as determined using STACK in cells grown in complete medium (CM), switched to -Arg medium at the time of compound addition, or 24 h before compound addition. c, Detection of puromycylated peptides. Results are representative of three independent experiments. d, Quantification of results from three puromycylation experiments, as in c. e, SYTOX Green positive (SG+) dead cell counts normalized to initial cell confluence. f, Confirmation of ATF4 knockdown at the protein level. Blot is representative of two independent experiments. Results in a,b and e represent mean ± SD from three independent experiments.
Supplementary Material
Acknowledgments
We thank J. Cao, A. Tarangelo, Z. Inde and E. Kolebrander Ho for experimental assistance; B. Stockwell, L. Li, M. Bassik, J. Ye, and M. Cyert for reagents. Certain constructs were obtained from Addgene. This work was supported by awards from NSERC (RGPIN-06741-2016) to D.A.P., and the NIH (1R01GM133883) to J.L.W. and (4R00CA166517-03, 1R01GM122923) to S.J.D.
Footnotes
Competing financial interest
S.J.D. is a member of the scientific advisory board for Ferro Therapeutics, has consulted for Toray Industries and AbbVie Inc., and is an inventor on patents related to ferroptosis.
References
- 1.Dixon SJ et al. Ferroptosis: an iron-dependent form of nonapoptotic cell death. Cell 149, 1060–1072, doi: 10.1016/j.cell.2012.03.042 (2012). [DOI] [PMC free article] [PubMed] [Google Scholar]
- 2.Yang WS et al. Regulation of ferroptotic cancer cell death by GPX4. Cell 156, 317–331, doi: 10.1016/j.cell.2013.12.010 (2014). [DOI] [PMC free article] [PubMed] [Google Scholar]
- 3.Stockwell BR, Jiang X & Gu W Emerging Mechanisms and Disease Relevance of Ferroptosis. Trends Cell Biol 30, 478–490, doi: 10.1016/j.tcb.2020.02.009 (2020). [DOI] [PMC free article] [PubMed] [Google Scholar]
- 4.Conrad M & Pratt DA The chemical basis of ferroptosis. Nat Chem Biol 15, 1137–1147, doi: 10.1038/s41589-019-0408-1 (2019). [DOI] [PubMed] [Google Scholar]
- 5.Li Y, Qian L & Yuan J Small molecule probes for cellular death machines. Curr Opin Chem Biol 39, 74–82, doi: 10.1016/j.cbpa.2017.05.007 (2017). [DOI] [PMC free article] [PubMed] [Google Scholar]
- 6.Smith CE et al. Non-steroidal Anti-inflammatory Drugs Are Caspase Inhibitors. Cell Chem Biol 24, 281–292, doi: 10.1016/j.chembiol.2017.02.003 (2017). [DOI] [PMC free article] [PubMed] [Google Scholar]
- 7.Corsello SM et al. The Drug Repurposing Hub: a next-generation drug library and information resource. Nat Med 23, 405–408, doi: 10.1038/nm.4306 (2017). [DOI] [PMC free article] [PubMed] [Google Scholar]
- 8.Mishima E et al. Drugs Repurposed as Antiferroptosis Agents Suppress Organ Damage, Including AKI, by Functioning as Lipid Peroxyl Radical Scavengers. J Am Soc Nephrol 31, 280–296, doi: 10.1681/ASN.2019060570 (2020). [DOI] [PMC free article] [PubMed] [Google Scholar]
- 9.Shah R, Shchepinov MS & Pratt DA Resolving the Role of Lipoxygenases in the Initiation and Execution of Ferroptosis. ACS Cent Sci 4, 387–396, doi: 10.1021/acscentsci.7b00589 (2018). [DOI] [PMC free article] [PubMed] [Google Scholar]
- 10.Wolpaw AJ et al. Modulatory profiling identifies mechanisms of small molecule-induced cell death. Proc Natl Acad Sci U S A 108, E771–780, doi: 10.1073/pnas.1106149108 (2011). [DOI] [PMC free article] [PubMed] [Google Scholar]
- 11.Shimada K et al. Global survey of cell death mechanisms reveals metabolic regulation of ferroptosis. Nat Chem Biol 12, 497–503, doi: 10.1038/nchembio.2079 (2016). [DOI] [PMC free article] [PubMed] [Google Scholar]
- 12.Forcina GC, Conlon M, Wells A, Cao JY & Dixon SJ Systematic Quantification of Population Cell Death Kinetics in Mammalian Cells. Cell Syst 4, 600–610 e606, doi: 10.1016/j.cels.2017.05.002 (2017). [DOI] [PMC free article] [PubMed] [Google Scholar]
- 13.Fitzgerald JB, Schoeberl B, Nielsen UB & Sorger PK Systems biology and combination therapy in the quest for clinical efficacy. Nat Chem Biol 2, 458–466, doi: 10.1038/nchembio817 (2006). [DOI] [PubMed] [Google Scholar]
- 14.Soula M et al. Metabolic determinants of cancer cell sensitivity to canonical ferroptosis inducers. Nat Chem Biol 16, 1351–1360, doi: 10.1038/s41589-020-0613-y (2020). [DOI] [PMC free article] [PubMed] [Google Scholar]
- 15.Jost M et al. Combined CRISPRi/a-Based Chemical Genetic Screens Reveal that Rigosertib Is a Microtubule-Destabilizing Agent. Mol Cell 68, 210–223 e216, doi: 10.1016/j.molcel.2017.09.012 (2017). [DOI] [PMC free article] [PubMed] [Google Scholar]
- 16.Bohnacker T et al. Deconvolution of Buparlisib’s mechanism of action defines specific PI3K and tubulin inhibitors for therapeutic intervention. Nat Commun 8, 14683, doi: 10.1038/ncomms14683 (2017). [DOI] [PMC free article] [PubMed] [Google Scholar]
- 17.Smolinski MP et al. Discovery of Novel Dual Mechanism of Action Src Signaling and Tubulin Polymerization Inhibitors (KX2–391 and KX2–361). J Med Chem 61, 4704–4719, doi: 10.1021/acs.jmedchem.8b00164 (2018). [DOI] [PubMed] [Google Scholar]
- 18.Viswanathan VS et al. Dependency of a therapy-resistant state of cancer cells on a lipid peroxidase pathway. Nature 547, 453–457, doi: 10.1038/nature23007 (2017). [DOI] [PMC free article] [PubMed] [Google Scholar]
- 19.Song X et al. JTC801 Induces pH-dependent Death Specifically in Cancer Cells and Slows Growth of Tumors in Mice. Gastroenterology 154, 1480–1493, doi: 10.1053/j.gastro.2017.12.004 (2018). [DOI] [PMC free article] [PubMed] [Google Scholar]
- 20.Tomlin FM et al. Inhibition of NGLY1 Inactivates the Transcription Factor Nrf1 and Potentiates Proteasome Inhibitor Cytotoxicity. ACS Cent Sci 3, 1143–1155, doi: 10.1021/acscentsci.7b00224 (2017). [DOI] [PMC free article] [PubMed] [Google Scholar]
- 21.Richards R et al. Drug antagonism and single-agent dominance result from differences in death kinetics. Nat Chem Biol 16, 791–800, doi: 10.1038/s41589-020-0510-4 (2020). [DOI] [PMC free article] [PubMed] [Google Scholar]
- 22.Zilka O et al. On the Mechanism of Cytoprotection by Ferrostatin-1 and Liproxstatin-1 and the Role of Lipid Peroxidation in Ferroptotic Cell Death. ACS Cent Sci 3, 232–243, doi: 10.1021/acscentsci.7b00028 (2017). [DOI] [PMC free article] [PubMed] [Google Scholar]
- 23.Shah R, Margison K & Pratt DA The Potency of Diarylamine Radical-Trapping Antioxidants as Inhibitors of Ferroptosis Underscores the Role of Autoxidation in the Mechanism of Cell Death. ACS Chem Biol 12, 2538–2545, doi: 10.1021/acschembio.7b00730 (2017). [DOI] [PubMed] [Google Scholar]
- 24.Gao M, Monian P, Quadri N, Ramasamy R & Jiang X Glutaminolysis and Transferrin Regulate Ferroptosis. Mol Cell 59, 298–308, doi: 10.1016/j.molcel.2015.06.011 (2015). [DOI] [PMC free article] [PubMed] [Google Scholar]
- 25.Skouta R et al. Ferrostatins inhibit oxidative lipid damage and cell death in diverse disease models. J Am Chem Soc 136, 4551–4556, doi: 10.1021/ja411006a (2014). [DOI] [PMC free article] [PubMed] [Google Scholar]
- 26.Lu T et al. Up-regulation of hypoxia-inducible factor antisense as a novel approach to treat ovarian cancer. Theranostics 10, 6959–6976, doi: 10.7150/thno.41792 (2020). [DOI] [PMC free article] [PubMed] [Google Scholar]
- 27.Jeitner TM Optimized ferrozine-based assay for dissolved iron. Anal Biochem 454, 36–37, doi: 10.1016/j.ab.2014.02.026 (2014). [DOI] [PubMed] [Google Scholar]
- 28.Shah R, Farmer LA, Zilka O, Van Kessel ATM & Pratt DA Beyond DPPH: Use of Fluorescence-Enabled Inhibited Autoxidation to Predict Oxidative Cell Death Rescue. Cell Chem Biol 26, 1594–1607 e1597, doi: 10.1016/j.chembiol.2019.09.007 (2019). [DOI] [PubMed] [Google Scholar]
- 29.Silverman SL et al. Efficacy of bazedoxifene in reducing new vertebral fracture risk in postmenopausal women with osteoporosis: results from a 3-year, randomized, placebo-, and active-controlled clinical trial. J Bone Miner Res 23, 1923–1934, doi: 10.1359/jbmr.080710 (2008). [DOI] [PubMed] [Google Scholar]
- 30.Komm BS et al. Bazedoxifene acetate: a selective estrogen receptor modulator with improved selectivity. Endocrinology 146, 3999–4008, doi: 10.1210/en.2005-0030 (2005). [DOI] [PubMed] [Google Scholar]
- 31.Le Naour A et al. EO771, the first luminal B mammary cancer cell line from C57BL/6 mice. Cancer Cell Int 20, 328, doi: 10.1186/s12935-020-01418-1 (2020). [DOI] [PMC free article] [PubMed] [Google Scholar]
- 32.Perez MA, Magtanong L, Dixon SJ & Watts JL Dietary Lipids Induce Ferroptosis in Caenorhabditiselegans and Human Cancer Cells. Dev Cell 54, 447–454 e444, doi: 10.1016/j.devcel.2020.06.019 (2020). [DOI] [PMC free article] [PubMed] [Google Scholar]
- 33.Valvezan AJ & Manning BD Molecular logic of mTORC1 signalling as a metabolic rheostat. Nat Metab 1, 321–333, doi: 10.1038/s42255-019-0038-7 (2019). [DOI] [PMC free article] [PubMed] [Google Scholar]
- 34.Kang SA et al. mTORC1 phosphorylation sites encode their sensitivity to starvation and rapamycin. Science 341, 1236566, doi: 10.1126/science.1236566 (2013). [DOI] [PMC free article] [PubMed] [Google Scholar]
- 35.Rees MG et al. Correlating chemical sensitivity and basal gene expression reveals mechanism of action. Nat Chem Biol 12, 109–116, doi: 10.1038/nchembio.1986 (2016). [DOI] [PMC free article] [PubMed] [Google Scholar]
- 36.Yang WS & Stockwell BR Synthetic lethal screening identifies compounds activating iron-dependent, nonapoptotic cell death in oncogenic-RAS-harboring cancer cells. Chem Biol 15, 234–245, doi: 10.1016/j.chembiol.2008.02.010 (2008). [DOI] [PMC free article] [PubMed] [Google Scholar]
- 37.Thoreen CC et al. A unifying model for mTORC1-mediated regulation of mRNA translation. Nature 485, 109–113, doi: 10.1038/nature11083 (2012). [DOI] [PMC free article] [PubMed] [Google Scholar]
- 38.Wolfson RL & Sabatini DM The Dawn of the Age of Amino Acid Sensors for the mTORC1 Pathway. Cell Metab 26, 301–309, doi: 10.1016/j.cmet.2017.07.001 (2017). [DOI] [PMC free article] [PubMed] [Google Scholar]
- 39.Chantranupong L et al. The CASTOR Proteins Are Arginine Sensors for the mTORC1 Pathway. Cell 165, 153–164, doi: 10.1016/j.cell.2016.02.035 (2016). [DOI] [PMC free article] [PubMed] [Google Scholar]
- 40.Harding HP et al. An integrated stress response regulates amino acid metabolism and resistance to oxidative stress. Mol Cell 11, 619–633, doi: 10.1016/s1097-2765(03)00105-9 (2003). [DOI] [PubMed] [Google Scholar]
- 41.Dai C et al. Transcription factors in ferroptotic cell death. Cancer Gene Ther 27, 645–656, doi: 10.1038/s41417-020-0170-2 (2020). [DOI] [PubMed] [Google Scholar]
- 42.Nakamura A et al. Inhibition of GCN2 sensitizes ASNS-low cancer cells to asparaginase by disrupting the amino acid response. Proc Natl Acad Sci U S A 115, E7776–E7785, doi: 10.1073/pnas.1805523115 (2018). [DOI] [PMC free article] [PubMed] [Google Scholar]
- 43.Ye J et al. The GCN2-ATF4 pathway is critical for tumour cell survival and proliferation in response to nutrient deprivation. EMBO J 29, 2082–2096, doi: 10.1038/emboj.2010.81 (2010). [DOI] [PMC free article] [PubMed] [Google Scholar]
- 44.Jover-Mengual T et al. Molecular mechanisms mediating the neuroprotective role of the selective estrogen receptor modulator, bazedoxifene, in acute ischemic stroke: A comparative study with 17beta-estradiol. J Steroid Biochem Mol Biol 171, 296–304, doi: 10.1016/j.jsbmb.2017.05.001 (2017). [DOI] [PubMed] [Google Scholar]
- 45.Lan YL et al. Bazedoxifene protects cerebral autoregulation after traumatic brain injury and attenuates impairments in blood-brain barrier damage: involvement of anti-inflammatory pathways by blocking MAPK signaling. Inflamm Res 68, 311–323, doi: 10.1007/s00011-019-01217-z (2019). [DOI] [PubMed] [Google Scholar]
- 46.Yu X & Long YC Crosstalk between cystine and glutathione is critical for the regulation of amino acid signaling pathways and ferroptosis. Sci Rep 6, 30033, doi: 10.1038/srep30033 (2016). [DOI] [PMC free article] [PubMed] [Google Scholar]
- 47.Ratan RR, Murphy TH & Baraban JM Macromolecular synthesis inhibitors prevent oxidative stress-induced apoptosis in embryonic cortical neurons by shunting cysteine from protein synthesis to glutathione. J Neurosci 14, 4385–4392 (1994). [DOI] [PMC free article] [PubMed] [Google Scholar]
- 48.Nofal M, Zhang K, Han S & Rabinowitz JD mTOR Inhibition Restores Amino Acid Balance in Cells Dependent on Catabolism of Extracellular Protein. Mol Cell 67, 936–946 e935, doi: 10.1016/j.molcel.2017.08.011 (2017). [DOI] [PMC free article] [PubMed] [Google Scholar]
- 49.Baba Y et al. Protective effects of the mechanistic target of rapamycin against excess iron and ferroptosis in cardiomyocytes. Am J Physiol Heart Circ Physiol 314, H659–H668, doi: 10.1152/ajpheart.00452.2017 (2018). [DOI] [PMC free article] [PubMed] [Google Scholar]
- 50.Cramer SL et al. Systemic depletion of L-cyst(e)ine with cyst(e)inase increases reactive oxygen species and suppresses tumor growth. Nat Med 23, 120–127, doi: 10.1038/nm.4232 (2017). [DOI] [PMC free article] [PubMed] [Google Scholar]
- 51.Dixon SJ et al. Pharmacological inhibition of cystine-glutamate exchange induces endoplasmic reticulum stress and ferroptosis. Elife 3, e02523, doi: 10.7554/eLife.02523 (2014). [DOI] [PMC free article] [PubMed] [Google Scholar]
- 52.Tarangelo A et al. p53 Suppresses Metabolic Stress-Induced Ferroptosis in Cancer Cells. Cell Rep 22, 569–575, doi: 10.1016/j.celrep.2017.12.077 (2018). [DOI] [PMC free article] [PubMed] [Google Scholar]
- 53.Haidasz EA, Van Kessel AT & Pratt DA A Continuous Visible Light Spectrophotometric Approach To Accurately Determine the Reactivity of Radical-Trapping Antioxidants. J Org Chem 81, 737–744, doi: 10.1021/acs.joc.5b02183 (2016). [DOI] [PubMed] [Google Scholar]
- 54.Li B et al. Besting vitamin E: sidechain substitution is key to the reactivity of naphthyridinol antioxidants in lipid bilayers. J Am Chem Soc 135, 1394–1405, doi: 10.1021/ja309153x (2013). [DOI] [PubMed] [Google Scholar]
- 55.Watts JL & Browse J Genetic dissection of polyunsaturated fatty acid synthesis in Caenorhabditis elegans. Proc Natl Acad Sci U S A 99, 5854–5859, doi: 10.1073/pnas.092064799 (2002). [DOI] [PMC free article] [PubMed] [Google Scholar]
- 56.Cao JY et al. A Genome-wide Haploid Genetic Screen Identifies Regulators of Glutathione Abundance and Ferroptosis Sensitivity. Cell Rep 26, 1544–1556 e1548, doi: 10.1016/j.celrep.2019.01.043 (2019). [DOI] [PMC free article] [PubMed] [Google Scholar]
Associated Data
This section collects any data citations, data availability statements, or supplementary materials included in this article.
Supplementary Materials
Data Availability Statement
Underlying deviation scores for the kinetic modulatory profile, mean signal suppression for the cell-free DPPH assay, and mean signal suppression for the cell-free ferrozine assay, are available as Source Data. Uncropped Western blots are available as Source Data and in the Supplementary Information.


