

Abstract
Drug molecules either bind to membrane-bound targets or permeate through cell membranes to reach intracellular targets, and hence their membrane partition and permeation are of great importance. Here we studied the effects of cholesterol on the partition of amantadine, an anti-flu drug molecule, into 1,2-dimyristoyl-sn-glycero-3-phosphocholine bilayers using molecular dynamics simulations. The membrane partition of amantadine is sensitive to the cholesterol mole fraction (xchol). In the absence of cholesterol, amantadine is stably bound in membranes, but at xchol = 32%, it can escape to the aqueous phase, in agreement with recent experiments. The reduced membrane partition of amantadine at high cholesterol content is mainly due to the perturbation of the bilayer structure and dynamics. Surrounding lipids stabilize amantadine by having their tails wrapped around the drug molecule, and this ability is compromised when cholesterol is present to increase the order in lipid tails. The atomic details on interactions with lipids and perturbations by cholesterol revealed here provide insight into membrane partition and delivery of drug molecules to their targets.
Graphical Abstract
Cholesterol affects the distribution of drug molecules in the cell membrane.
Introduction
Membrane proteins perform numerous physiological functions and account for 60% of drug targets.1 The delivery of drugs to their specific targets is affected by their partition into cell membranes. For example, two agonists with different affinities for the angiotensin AT1 receptor, a G-protein-coupled receptor, were found to have distinct partition behaviors in dipalmitoyl phosphatidylcholine bilayers, possibly contributing to their difference in pharmacological properties.2 In addition to phospholipids, cell membranes usually contain many other components. Notably, eukaryotic plasma membranes contain exceptionally high cholesterol contents, up to a mole fraction (xchol) of 50%.3 Cholesterol has significant effects on the structure and dynamics of cell membranes.4, 5 In particular, it promotes the formation of lipid rafts, which are liquid-ordered microdomains.6 Membrane composition (including cholesterol) may also affect the partition and permeability of drugs.7, 8 For example, the membrane-binding properties of Ca2+-channel blockers can be significantly altered by the addition of cholesterol.9 Molecular details on the partition of drug molecules into cell membranes, including the localization, orientation, and dynamics of membrane-bound drugs, are valuable for understanding drug action as well as toxicity.10
Amantadine (AMT) is an antiviral drug that targets the influenza M2 protein. It consists of an adamantane backbone with an amino group substituted at one of the four methine positions (Fig. 1A). The M2 protein is a tetrameric proton-selective ion channel, with 97 residues in each subunit. Residues 22–46 form the single transmembrane helix that lines the channel pore, while residues 47–62 form an amphipathic helix at the bilayer interface.11, 12 The amphipathic helix is known to bind cholesterol13, and a cholesterol-recognition motif involving Y52 and Y57 was identified14. While the ion channel activity is primarily associated with the transmembrane helix, the amphipathic helix has been implicated in altering membrane curvature and mediating viral budding and membrane scission15, 16; the latter activities are significantly influenced by the presence of cholesterol. The influence of cholesterol may have important consequences considering that M2 is located at the neck of budding virions, where the cholesterol-enriched viral membrane meets the lower-cholesterol plasma membrane13, 15.
Figure 1. Molecular dynamics simulations of amantadine molecules in hydrated lipid bilayers with cholesterol.
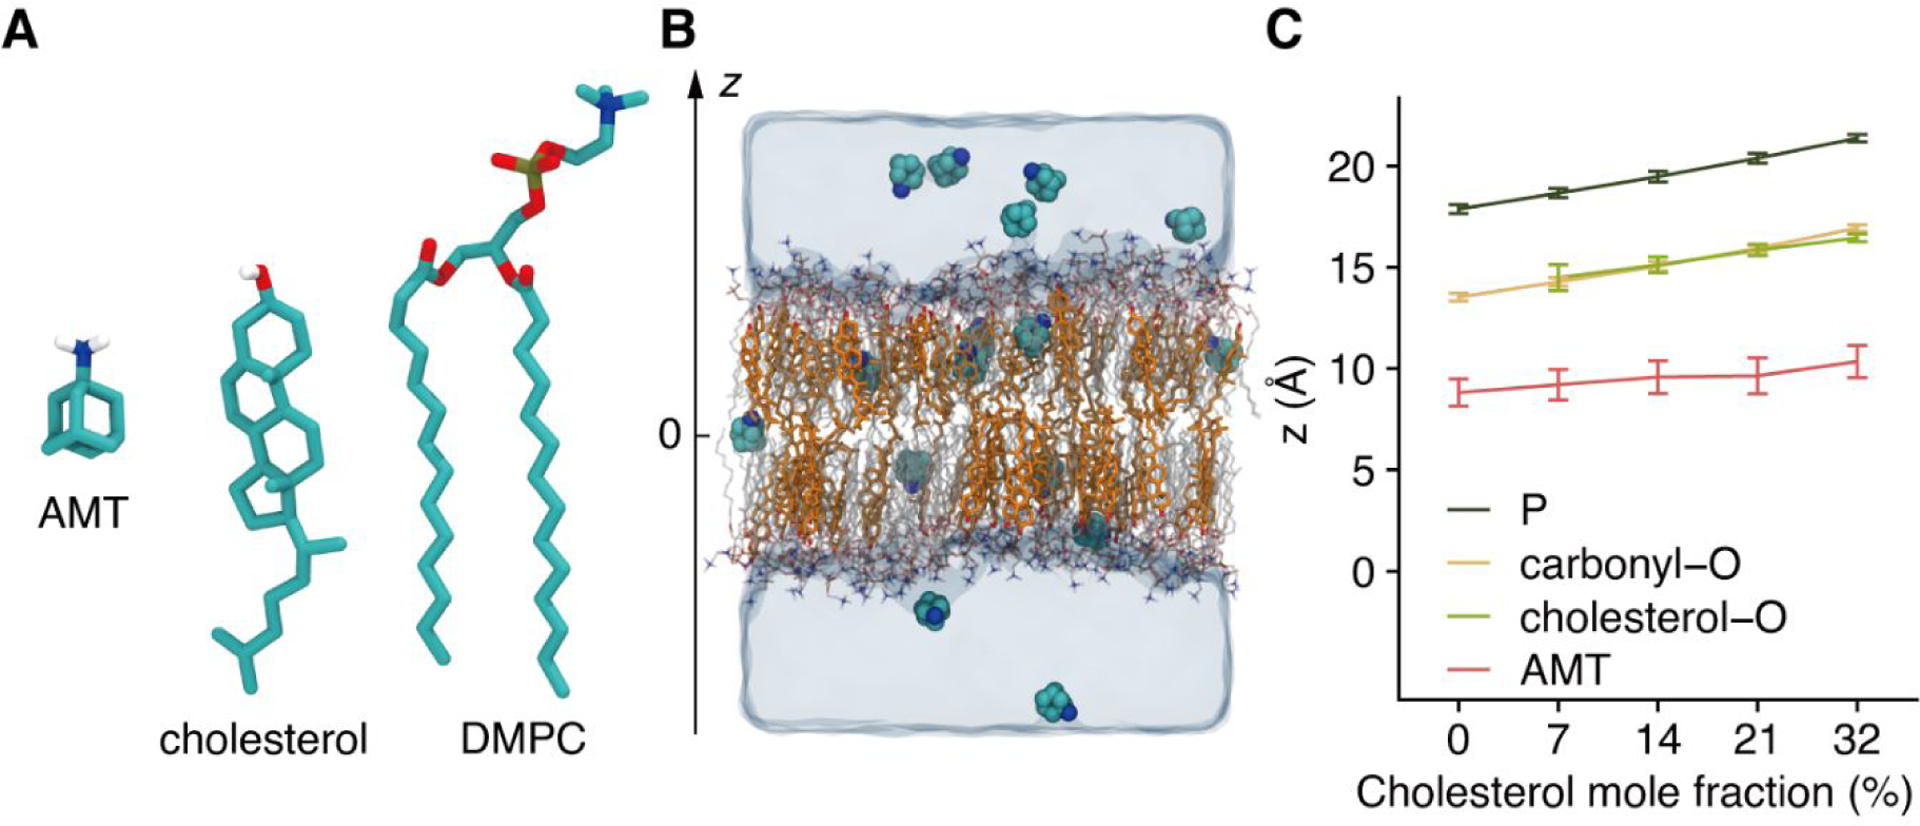
(A) Molecular structures of amantadine (AMT), cholesterol, and 1,2-dimyristoyl-sn-glycero-3-phosphocholine (DMPC). For clarity, only the hydrogen atoms bonded to polar atoms are shown. (B) A snapshot of the system with the membrane containing 32% cholesterol. AMT is in space-filling mode, cholesterol (in yellow) and DMPC (with red for oxygen, blue for nitrogen, and white for the rest part) are shown in stick mode, and waters are presented as a continuum. The z-axis is along the membrane normal, with the center of the membrane defined as z = 0. (C) The center of mass of certain atoms (dark green for phosphate, yellow for carbonyl oxygen on DMPC, green for hydroxyl oxygen on cholesterol, and red for AMT) under different cholesterol contents. The error bar shows the standard deviation calculated among saved snapshots.
Membrane partition of AMT (and its influence by cholesterol) may affect the delivery of the drug to the M2 protein in two critical ways. First, since virions enter host cells via endocytosis, the membrane binding of AMT may provide an efficient way to produce high drug concentrations inside endosomes. It has been found that membrane anchoring of an inhibitor significantly increased its potency against the Alzheimer’s disease β-secretase found in endosomes.17 Second, while it has now been established that AMT acts on M2 as a pore blocker11, 18–24, at least a portion of the drug molecules entering the M2 pore may be recruited from the proximal membrane.
In addition to the M2 protein, AMT is also known to bind to other membrane protein targets. In particular, AMT binds to NMDA-subtype glutamate receptors, both into the pore as a blocker and in a peripheral site as an allosteric modulator.25 Notably, AMT was used to treat Parkinson’s disease for decades.26 A very recent study proposed that AMT could also be an antiviral drug for COVID-19.27 These additional protein targets serve as further motivation for the present study.
The interactions of adamantane-based drugs with membrane-bound M2, specifically the pore-lining residues, have been explored by molecular dynamics (MD) simulations.28–34 More relevant to the present work are experimental22, 35–39 and computational38, 40 studies on the partition of adamantane-based drugs in pure lipid bilayers and in a virus-mimetic membrane containing cholesterol. Our previous MD simulations showed that, in a 1,2-dimyristoyl-sn-glycero-3-phosphocholine (DMPC) bilayer, AMT is located in the lipid hydrophilic/hydrophobic interfacial region, such that the polar amine group interacts with the lipid headgroup and glycerol backbone, while the bulky nonpolar adamantane group interacts with the glycerol backbone and much of the fatty acyl chain as it wraps underneath the drug.38 This interaction mode provided a resolution to apparently confusing data showing AMT interactions with both the headgroups and the acyl tails of lipids.35–37
Here we report MD simulations of AMT in cholesterol-containing DMPC bilayers. The molecule’s partition in membranes is found to be highly dependent on cholesterol content. AMT is stably bound in membranes under relatively low xchol, but has a tendency to escape to the aqueous phase under high xchol, in agreement with recent experiments39. The reduced partition of AMT in cholesterol-containing membranes is related to the compromised ability of proximal acyl chains to wrap around the drug molecule, due to the ordering of the acyl chains by cholesterol. The simulations revealed experimentally inaccessible atomic details on drug-membrane interactions. This information may help understand drug partitioning into cell membranes and drug delivery to the M2 protein and other membrane protein targets.
Computational Methods
System setup.
We prepared the initial configuration of the fully hydrated DMPC or DMPC/cholesterol systems using CHARMM-GUI41. A rectangular box was used, with a square lateral (i.e., x-y) cross section. Due to the relatively slow diffusion during passive permeation of small molecules across membranes42, 16 AMT molecules were randomly placed in each system to improve sampling efficiency: eight of which were in the aqueous phase, and the other eight were inside the lipid bilayer (Fig. 1B). Additional information about the composition and dimensions of each system is listed in Table 1.
TABLE 1.
List of the simulation systems
| No. of DMPC | No. of Chol. | xchol | No. of Atoms | x and y Lengths (Å) | z Length (Å) | Volume of simulation box (Å3) |
|---|---|---|---|---|---|---|
| 256 | 0 | 0% | 60649 | 88.53 | 73.75 | 5.78×10⁵ |
| 238 | 18 | 7% | 59854 | 85.54 | 77.90 | 5.70×10⁵ |
| 220 | 36 | 14% | 59062 | 82.05 | 83.63 | 5.63×10⁵ |
| 202 | 54 | 21% | 58270 | 79.64 | 87.22 | 5.53×10⁵ |
| 174 | 82 | 32% | 57038 | 75.42 | 94.72 | 5.39×10⁵ |
Computational details.
We followed the protocol used in the previous study38. Briefly, the NAMD 2.13 program43 was used for all the MD simulations. CHARMM36 parameters44 were used for the DMPC lipid, and the TIP3P model was used for water45. The partial charges of AMT were generated here using Gaussian1647 and the restraint electrostatic potential fitting method48. Other bonded and non-bonded parameters for AMT were generated using the CHARMM general force field (CGenFF).46 To start each simulation, the system was energy minimized with gradually decreasing harmonic restraints to remove bad contacts. The system was then heated to 303 K (above the DMPC phase transition temperature, 296 K) for 1.5 ns at constant volume. The simulations were continued in the NPT ensemble at 1 atm pressure and 303 K for 400 ns. Langevin dynamics with a damping frequency of 2 ps−1 was used to maintain the temperature, and the Langevin piston method was used to maintain the pressure49. All bonds containing hydrogens were constrained by the SHAKE method50, allowing for an integration time step of 2 fs. The nonbonded cutoff was set to 12 Å, and the particle-mesh Ewald method51 was applied to treat long-range electrostatic interactions. The last 200 ns of each trajectory was used for analysis. We carried out two replicate MD simulations for each system and obtained consistent results.
Free energy calculations.
To determine the free energy landscape of the permeation process, we calculated the potentials of mean force (PMFs) of AMT at xchol = 0% and 32%, and at three temperatures: 303 K, 308 K, and 313 K, for each xchol. The distance, z, between the center of mass of AMT and the central plane of the lipid bilayer was set as the reaction coordinate. The range of z from 0 (at the center of the bilayer) to 32 Å (in the aqueous phase) was sampled in 28 windows, with width of 1 Å for z from 0 to 24 Å and 2 Å for z from 24 to 32 Å. To obtain the initial structure in each window, a steered MD simulation was carried out, by pulling an AMT molecule in the aqueous phase into a well-equilibrated lipid bilayer at a constant velocity of 5 Å/ns. A structure for each window was selected and equilibrated for 50 ns with z under restraint. The adaptive biasing force method52, 53 was then applied to calculate the PMF profile in the next 10 ns. Bootstrap was used to estimate the averages and errors. All the PMF calculations were carried at constant NVT.
Calculation of void fraction of membranes.
We calculated voids in membranes by scanning a probe voxel; the scanned region covered the entire simulation box in the x and y directions and up to 60 Å in the z direction (enough to span the membrane thickness). The probe voxel consisted of 50 × 50 × 10 dummy atoms at 0.1 Å spacing in each direction. The dummy atom was assigned a radius of 1.5 Å. At a given z, the number of dummy atoms that did not clash with the atoms of the simulation system was obtained. The void fraction was the ratio between the number of non-clashing dummy atoms and the total number of probed sites.
Results
Cholesterol perturbs DMPC bilayer structure.
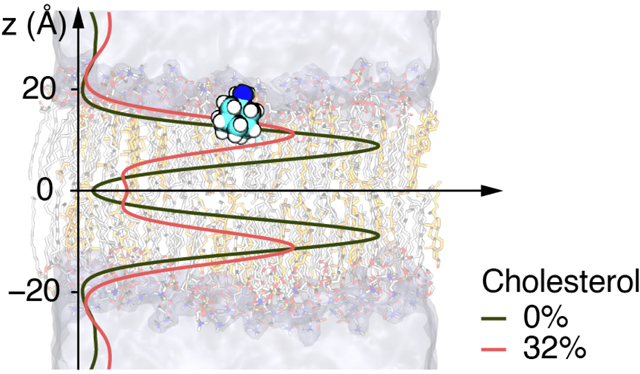
We first monitored the average positions of the DMPC phosphate and carbonyl oxygen atoms, and the cholesterol oxygen atoms (if present) within a leaflet. As shown in Fig. 1C, the average half-thickness of the membrane, as measured by the average z of phosphate atoms, increases from 17.9 Å at xchol = 0% to 21.4 Å at xchol = 32%. This observation is in agreement with cholesterol-induced increases in membrane thickness reported by previous experimental54 and computational55 studies.
It is also apparent that the lipid hydrophobic tail is the primary region where membrane thickness increases with increasing xchol, as the average z of carbonyl oxygen atoms expand in parallel to the counterpart of phosphate atoms, such that the difference in average z between phosphate and carbonyl oxygen atoms remains constant (Fig. 1C). Also worth noting, the average z of cholesterol oxygen atoms coincides with that of carbonyl oxygen atoms, indicating that specific binding between cholesterol and DMPC lipids locks their relative position. These structural changes of the membrane have significant consequences for the partition of AMT, as described below.
We also analyzed the density profiles of water, DMPC, cholesterol, and AMT along the membrane normal (averaged over the two leaflets; Fig. 2). With increasing xchol, the density of DMPC becomes smaller while that of cholesterol becomes larger at the membrane core (|z| < 10 Å). Around z = 10 Å, the DMPC density develops a flat shoulder at high cholesterol content, hinting at increased ordering of lipid tails in the middle of each leaflet.
Figure 2. Density profiles of different molecular species in the system.
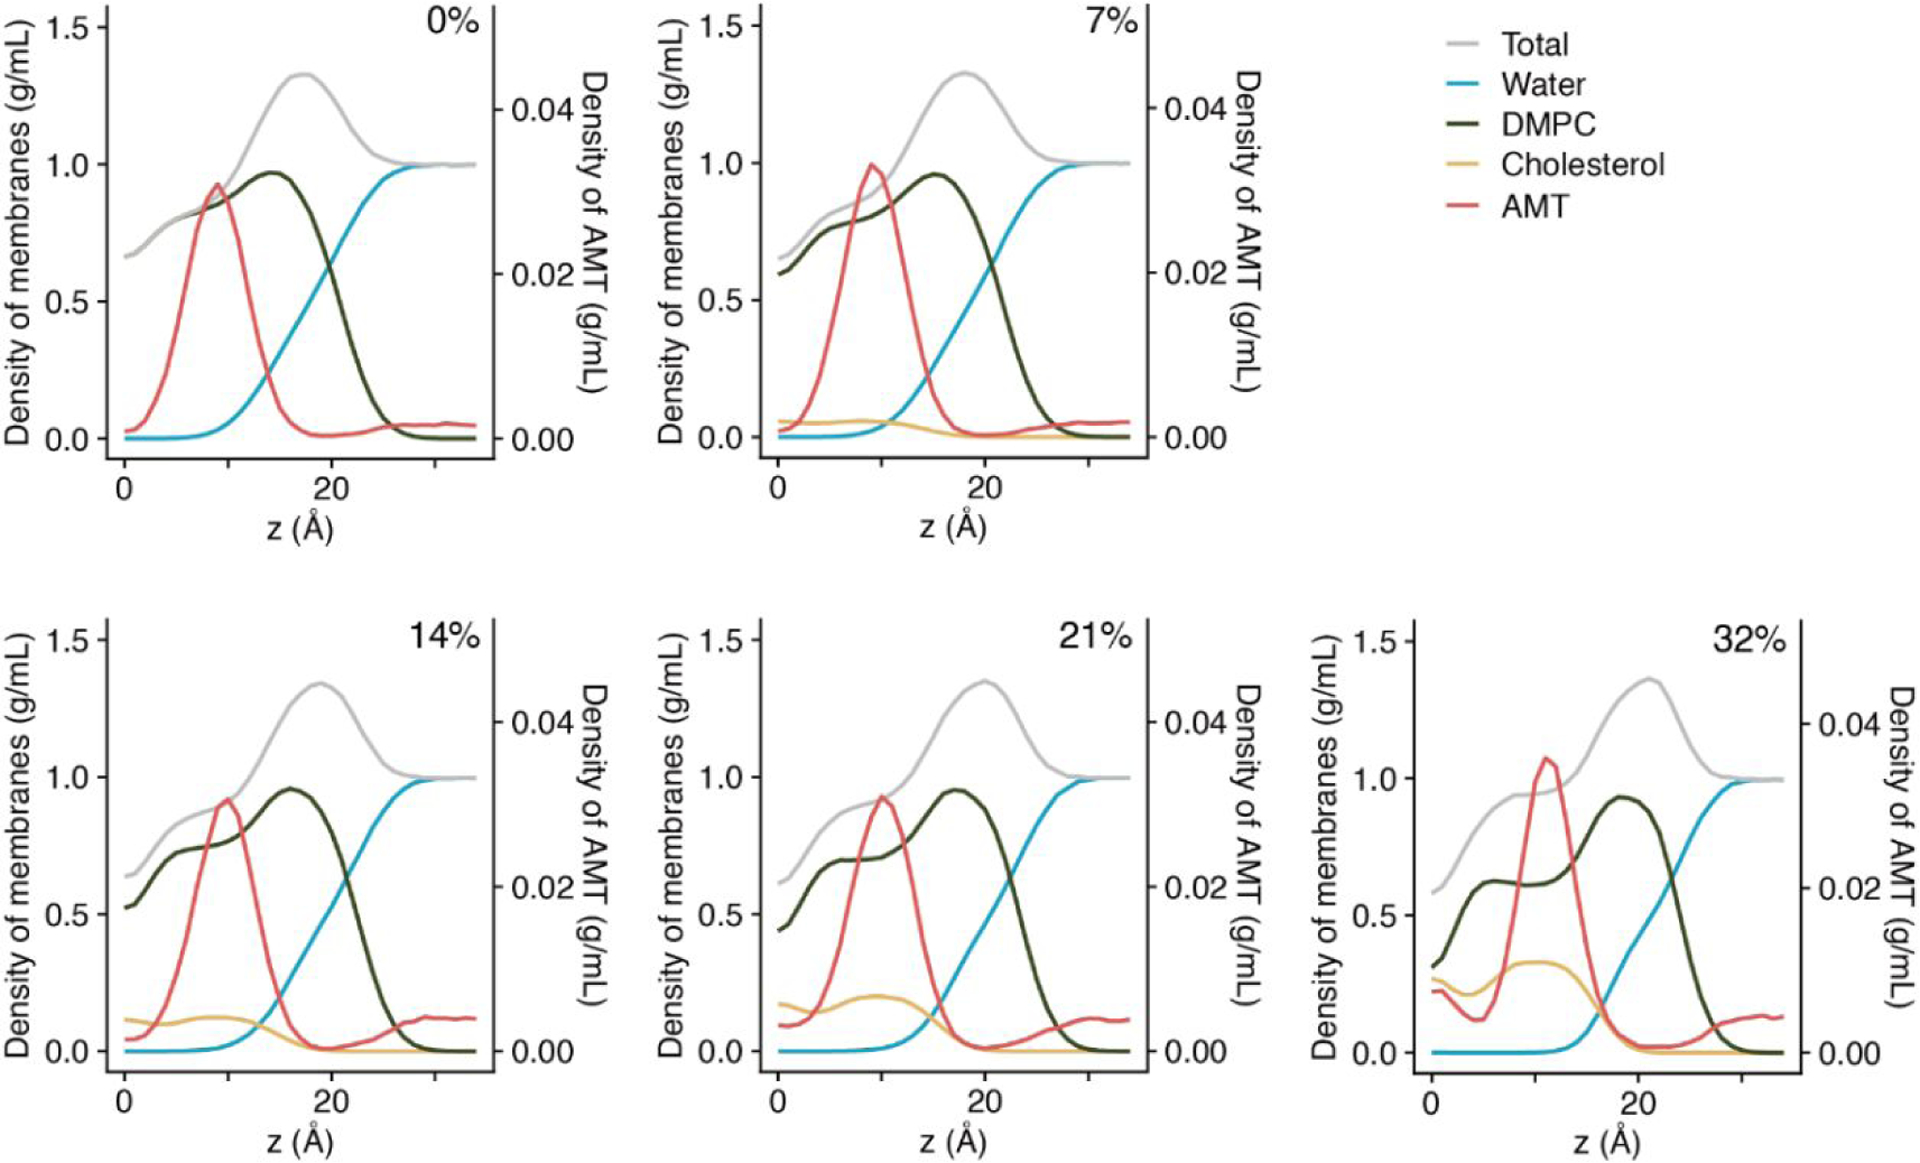
The data shown are the average of two leaflets in a bilayer. The scale of the y-axis on the left is for water and lipids; the scale on the right is for AMT.
Within each bilayer, the void fraction peaks at the middle of the bilayer (i.e., z = 0; Fig. 3A & 3B). With increasing cholesterol content, there is a significant migration of voids from 5 Å < z < 10 Å (corresponding to the location of the steroid ring of cholesterol) to the middle of the bilayer. This migration is likely due to a combination of (1) tight packing between cholesterol steroid ring and DMPC, and (2) unequal lengths of cholesterol and DMPC. A similar situation was observed in other lipid bilayers with cholesterol.56 Fig. 3C presents the monotonic increase in the peak void fraction with increasing xchol.
Figure 3. The effect of cholesterol on membrane void space.
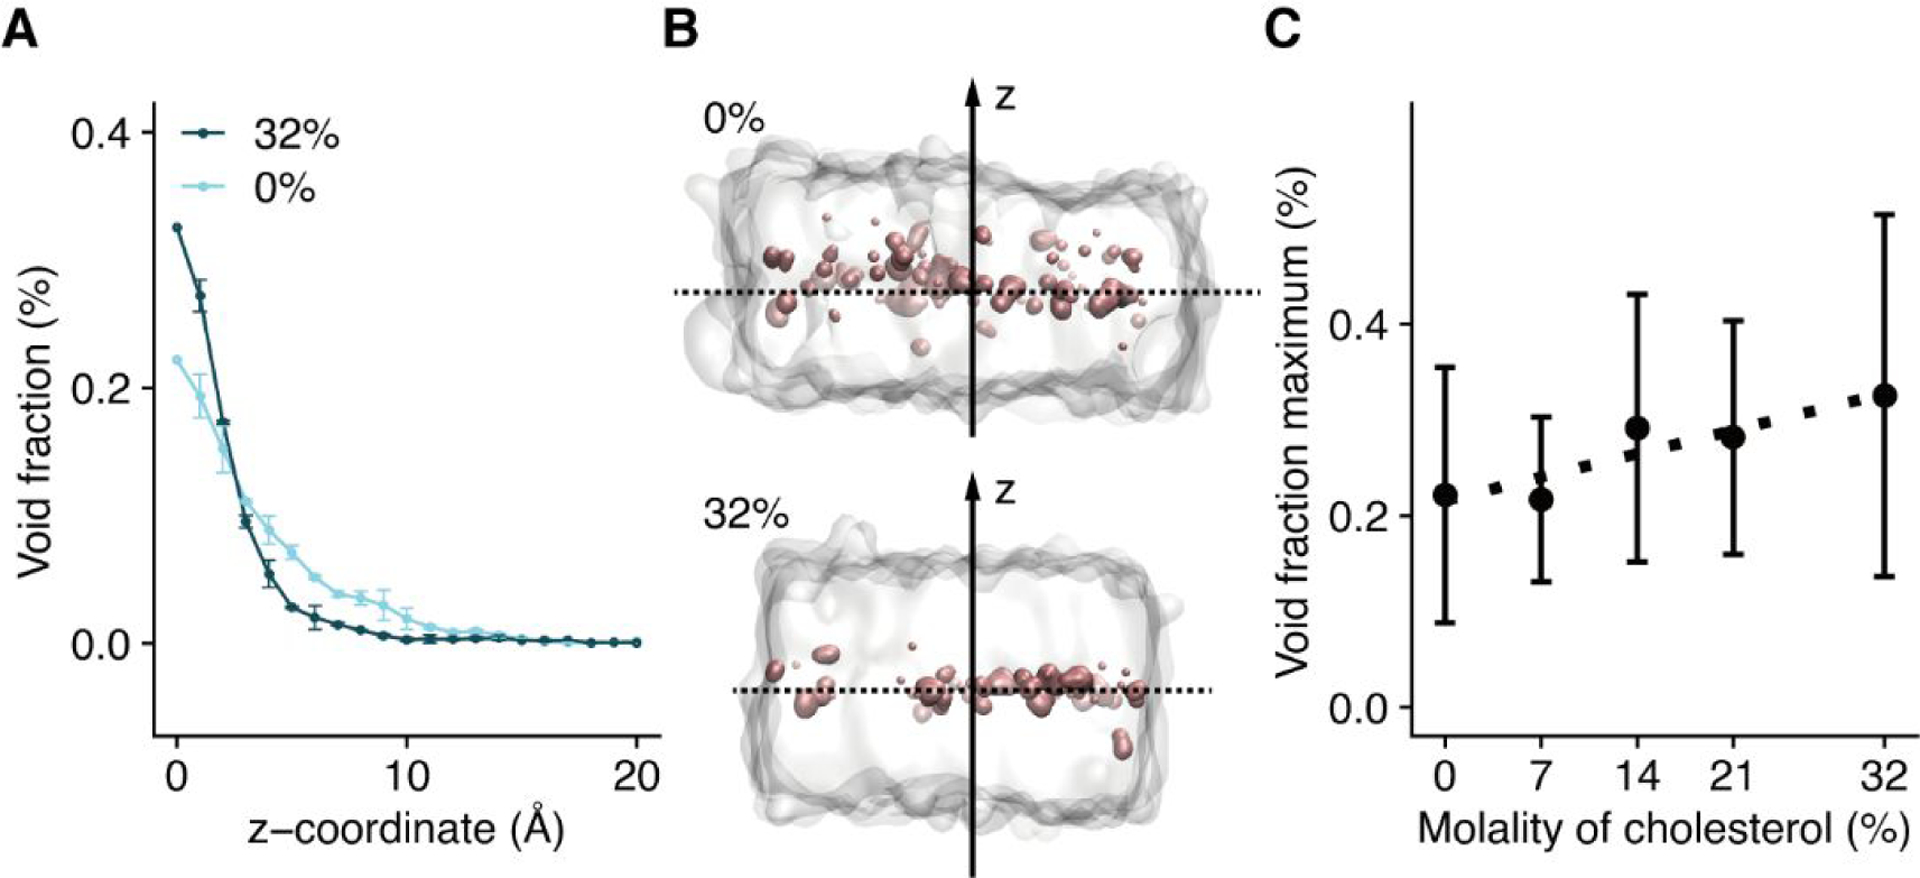
(A) The void fraction profiles at xchol = 0% (light blue) and xchol = 32% (dark blue). (B) Representative snapshots showing voids inside bilayers of pure DMPC (top panel) or DMPC with 32% cholesterol (bottom panel). The dashed line shows the membrane center (z = 0), which is defined as the center of mass of the phosphate atoms in the two leaflets. Voids are presented as pink surface. (C) The increase in the peak void fraction at z = 0 with increasing cholesterol mole fraction.
Cholesterol reduces membrane partition of AMT.
The membrane partition of AMT molecules depends on the cholesterol mole fraction (Fig. 4). In our simulations, 8 AMT molecules started in the aqueous phase and another 8 started in the liquid bilayer at each xchol. The trajectories for the z positions of all the 16 AMT molecules at xchol = 0%, 7%, 14%, 21%, and 32% are collected in Figs. S1–S5, respectively; two extreme cases are also presented in Fig. 4A & 4B. In the cholesterol-free case, AMT molecules started from the aqueous phase move into the lipid bilayer after ~100 ns and then, much like those started from the lipid bilayer, stay there stably in the rest of the trajectories (Fig. 4A). As the cholesterol level is increased, the length of time that AMT molecules linger in the aqueous phase increases and, at xchol = 32%, one AMT molecule started from the aqueous phase makes a brief excursion into the lipid bilayer and then returns to the aqueous phase (Fig. 4B). Moreover, in the presence of cholesterol, AMT molecules started in the lipid bilayer can make excursions into the aqueous phase and, at xchol = 32%, one AMT molecule started in the lipid bilayer escapes entirely into the aqueous phase. Taken together, we can conclude that, with increasing xchol, AMT has an increasing tendency to partition in the aqueous phase.
Figure 4. The distributions of AMT z position.
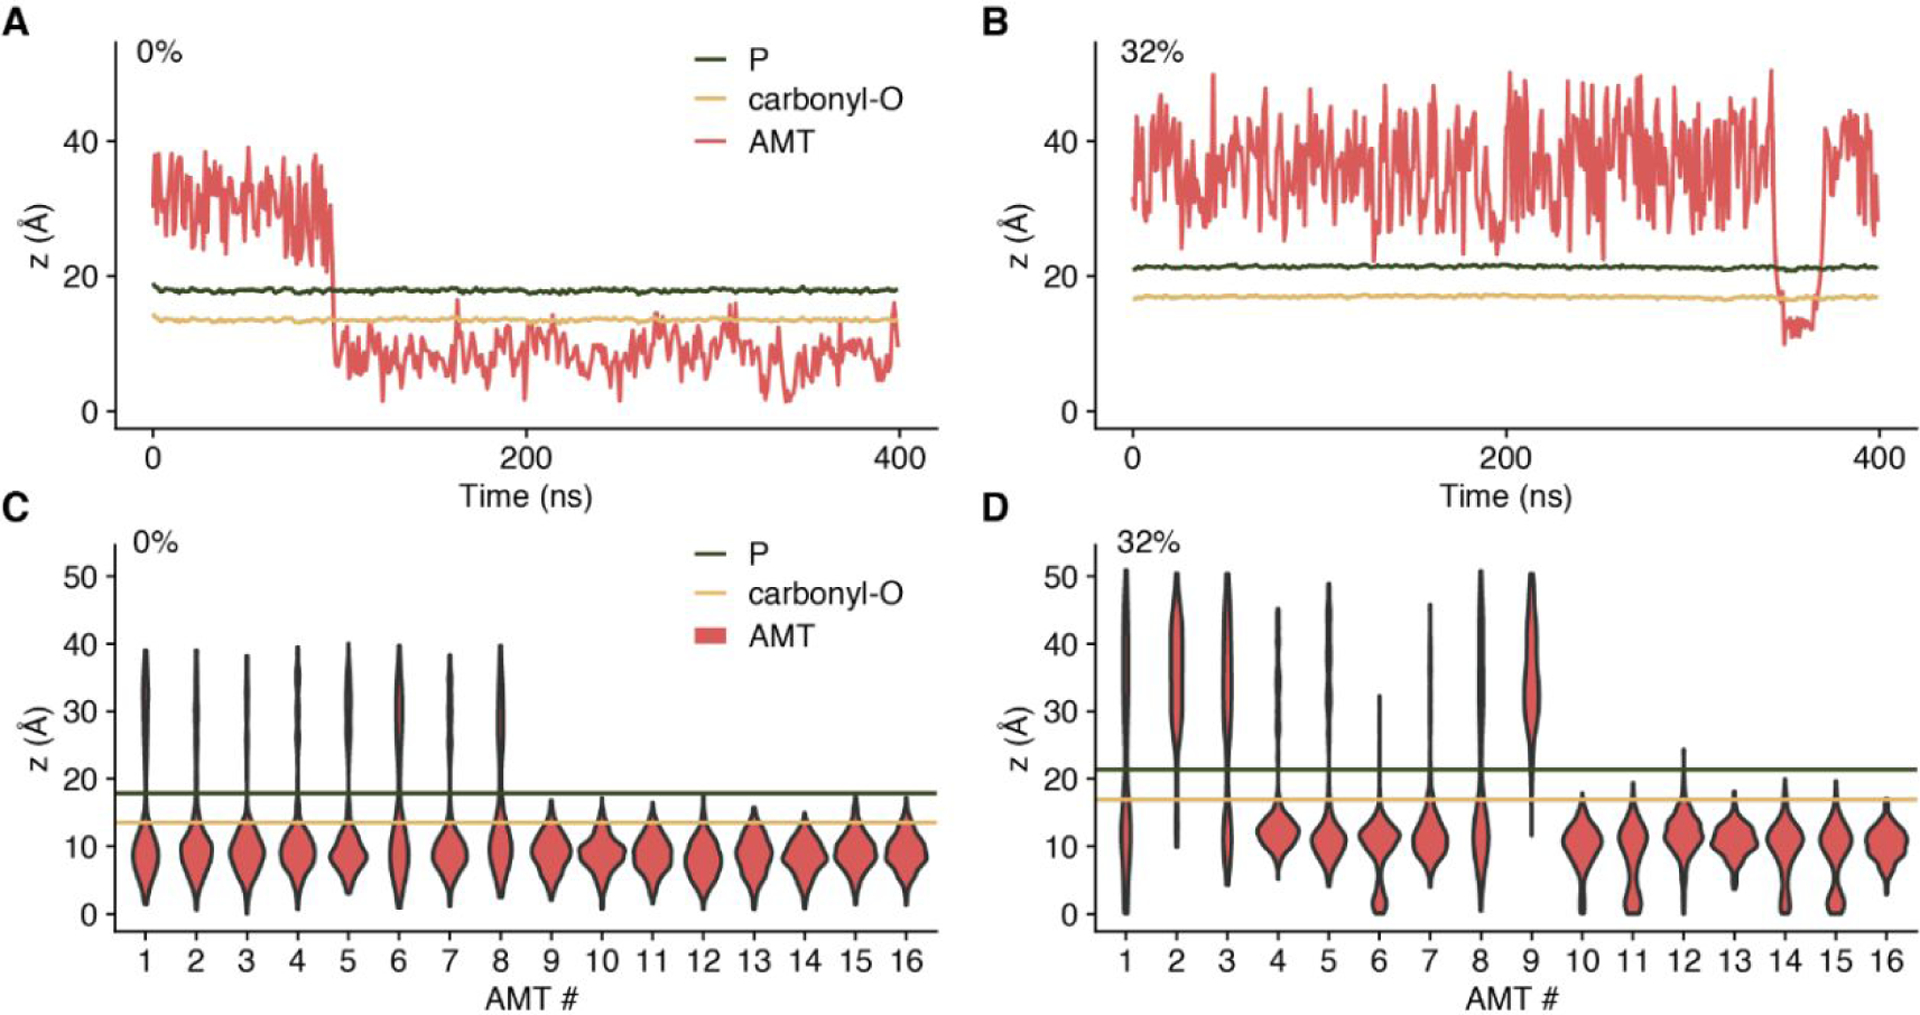
(A-B) Trajectories of two AMT molecules started in the aqueous phase, one at xchol = 0 (A) and the other xchol = 32% (B). (C-D) Distributions of z positions of 16 AMT molecules at xchol = 0 (C) and xchol = 32% (D), shown as violin plots. In both systems, the first 8 AMT molecules were initially located in the aqueous phase, while the second 8 AMT molecules were initially in lipids.
We use violin plots to display the distributions of the z positions of the 16 AMT molecules at xchol = 0% in Fig. 4C and at xchol = 32% in Fig. 4D. It is clear that, in the absence of cholesterol, the AMT distributions have a peak position inside lipid bilayers, at z ~9 Å (see also Figs. 1C and 2). In contrast, at the high cholesterol content, AMT molecules initially located in the aqueous phase spend comparable amounts of time there and in lipid bilayers, whereas those started in the lipid bilayer can also move into the aqueous phase. The major peak of the AMT z distributions inside lipid bilayers shifts outward slightly, to around 12 Å (see also Figs. 1C and 2). In addition, a second peak, at the bilayer center, emerges, and can be attributed to the increase in void space (Fig. 3A & 3B). That AMT molecules started from aqueous and lipid phases reach different z distributions is an indication that our 400-ns conventional MD simulations are inadequate in producing an equilibrium distribution. This deficiency is addressed below by free energy calculations.
Cholesterol orders acyl chains and hinders the membrane partition of AMT.
The rigid planar steroid ring of cholesterol faces the outer half (6 Å < z < 11 Å) of the DMPC acyl chains (see Fig. 1A), leading to the latter’s ordering. To quantify this ordering, we calculated the order parameter SCD (“CD” signifies a C-H bond upon deuteration in experimental measurements) of each C-H bond along the acyl chain according to Eq. 1.
| (1) |
where θ is the angle between the C-H bond and membrane normal. Moreover, to identify the effect of acyl chain ordering on the membrane partition of AMT, we divided DMPC lipids into two populations: (1) an AMT-proximal population, comprising lipids within 3 Å of any AMT; and (2) an AMT-distal population, comprising the remaining lipids. We separately averaged SCD values in these two DMPC populations (Fig. 5A & 5B).
Figure 5. The ordering of DMPC acyl chains by cholesterol.
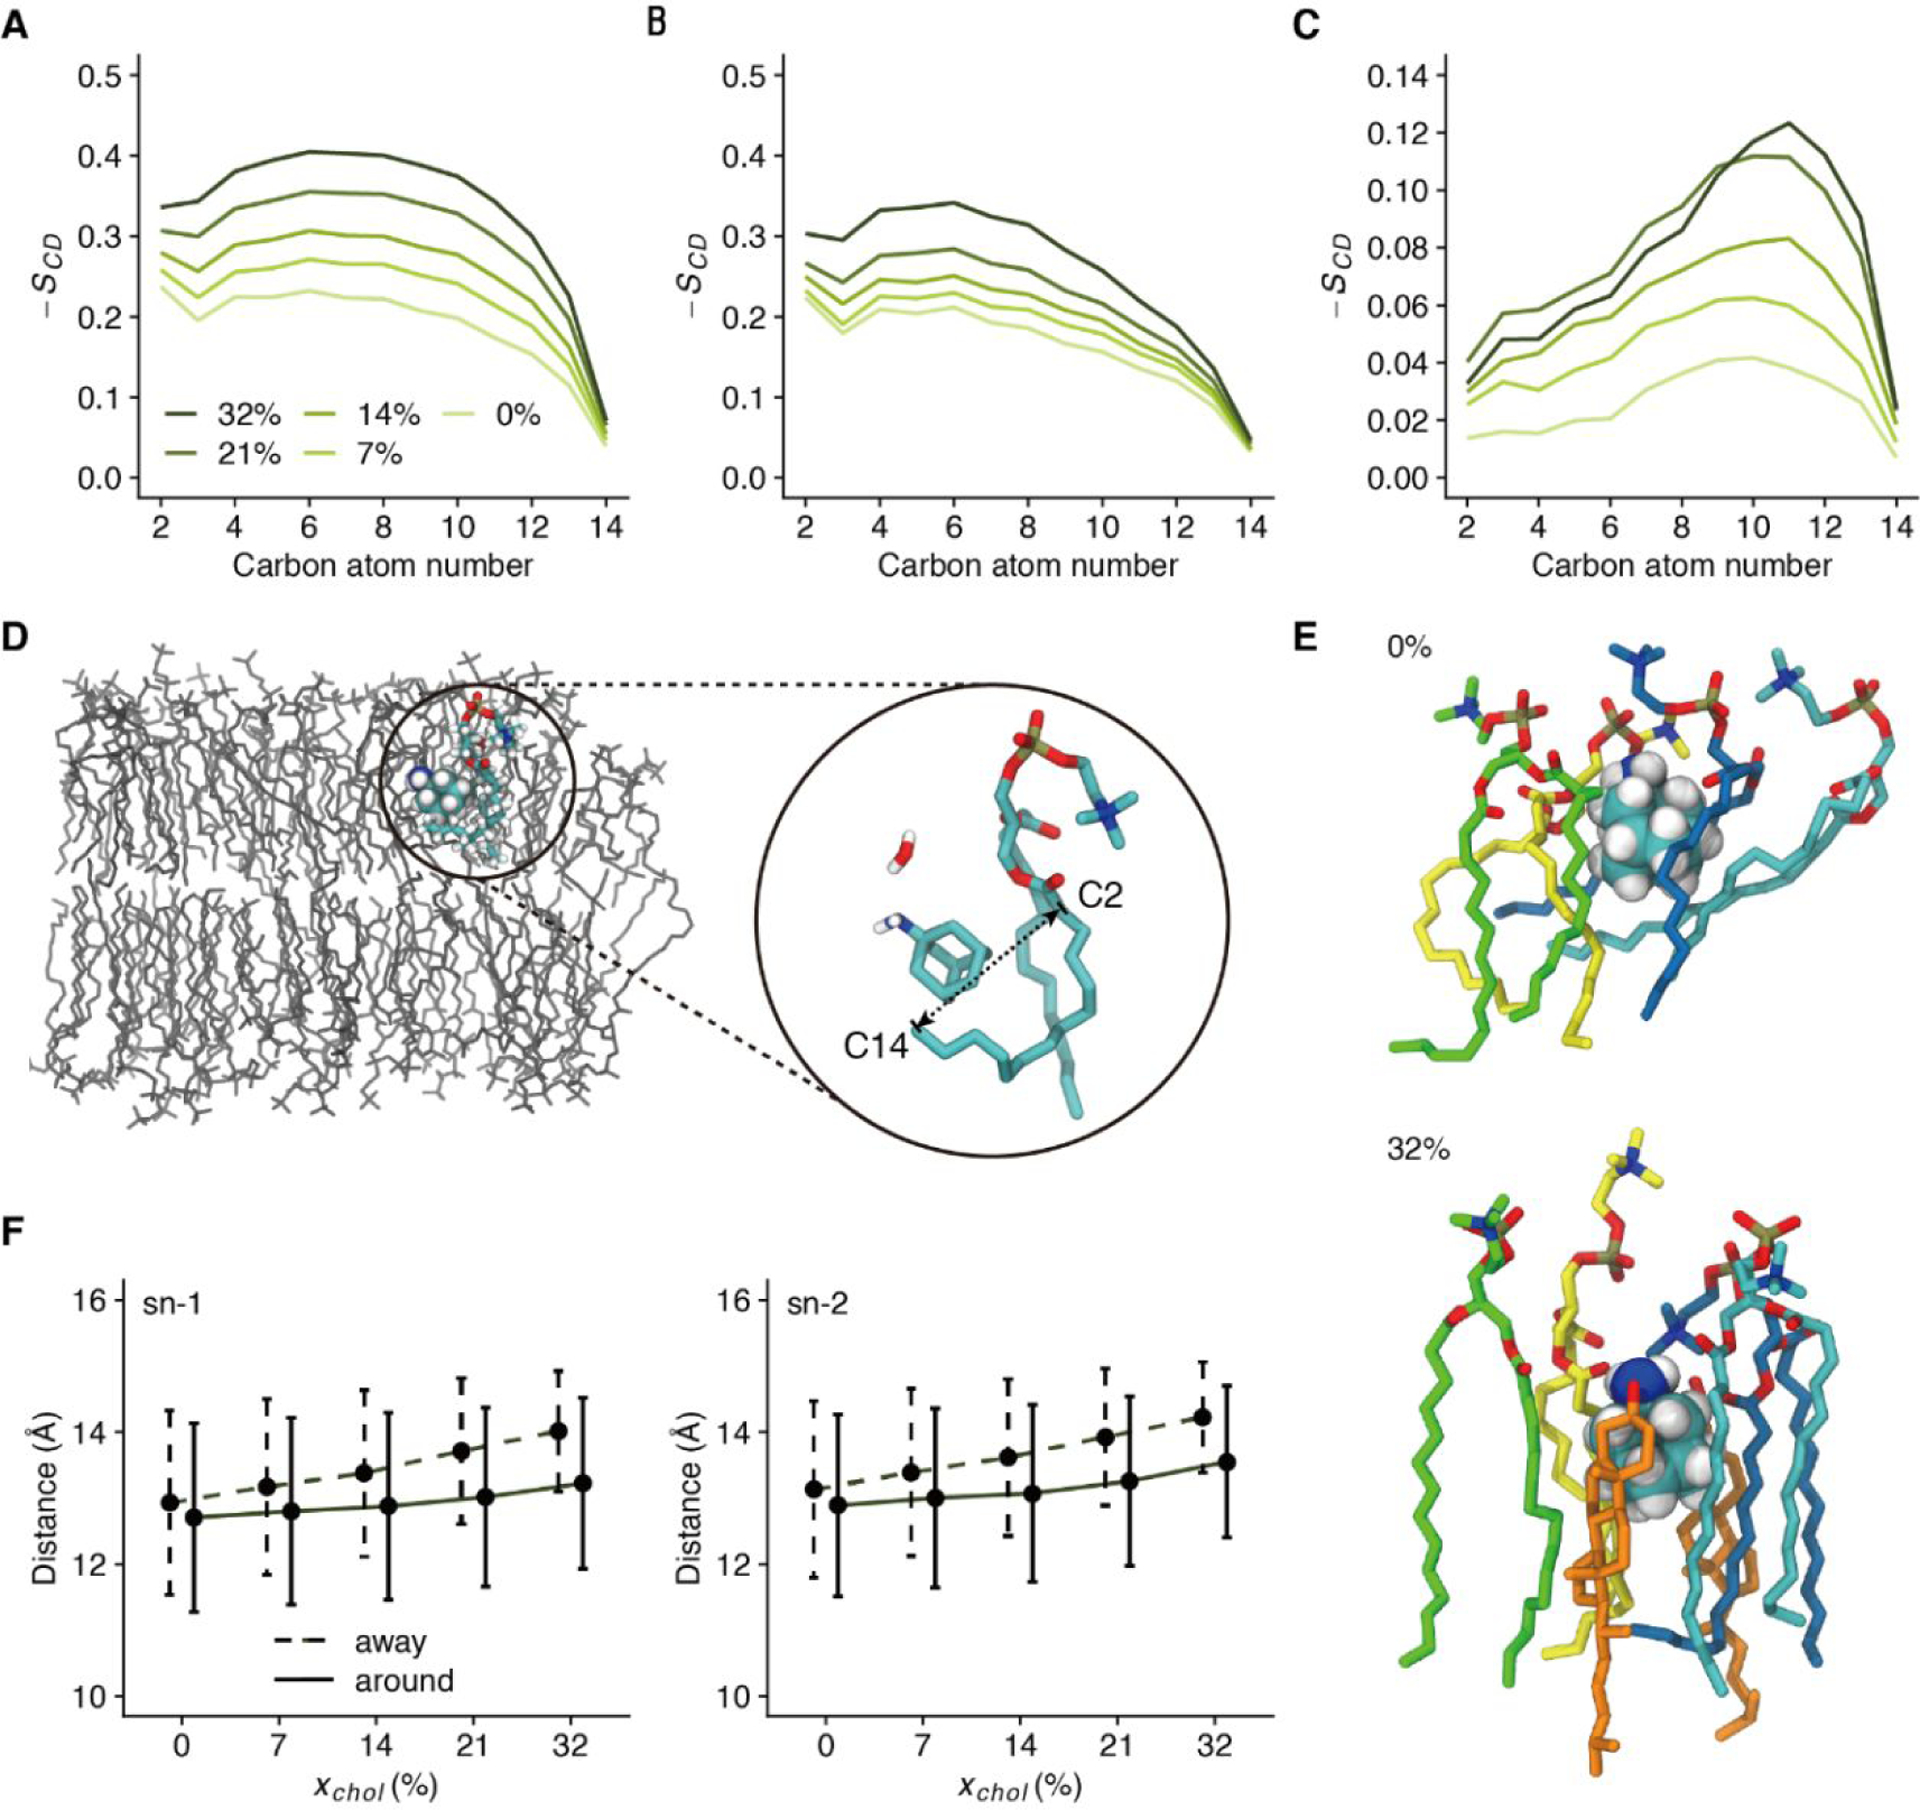
(A-B) Order parameters of C-H bonds along the DMPC sn-1 acyl chains that are away from AMT molecules (A) or around AMT molecules (B) in systems with different xchol. (C) Difference in order parameters between the two populations. (D) A representative snapshot showing acyl chains wrapping around the bound AMT in a pure DMPC bilayer. One AMT molecule, as well as one water molecule and one DMPC molecule interacting with this AMT, are highlighted with the space-filling mode, which are further illustrated in the zoomed inset. (E) Representative snapshots of the DMPC lipids (in the stick mode) around AMT (in the space-filling mode) in the absence (top panel) and presence (bottom panel) of cholesterol (in orange stick). (F) The distance between the C2 and C14 atoms of each acyl chain, as an indication of acyl chain bending [see the inset of panel (D)]. The acyl chains away from (dashed line) or around (solid line) AMT molecules are separately shown. Data for the sn-1 and sn-2 chains are shown in the left and right panels, respectively.
Regardless of whether AMT is nearby, cholesterol always increases the order parameters, especially in the outer half of the acyl chains. However, around AMT, the increase in acyl chain ordering is significantly suppressed. Irrespective of cholesterol content, AMT-proximal acyl chains are less ordered than AMT-distal ones (Fig. 5C). The cholesterol-mediated acyl chain ordering is thus incompatible with membrane partition of AMT. Indeed, as already noted in our previous study38, in the absence of cholesterol, the bottom of the AMT adamantane group is tightly wrapped by acyl chain tails (Fig. 5D & 5E top panel). However, due to ordering by cholesterol, acyl chains are less able to bend and wrap around AMT (Fig. 5E bottom panel), thereby reducing the stability of the bound AMT. We characterize the acyl chain bending by calculating the distance between its first and last carbon atoms (Fig. 5F). Whereas AMT prefers bent acyl chains (smaller carbon-carbon distance), cholesterol straightens acyl chains. The straightening of acyl chains is responsible for the increase in membrane thickness reported in Fig. 1C.
Free energy calculations validate reduced membrane partition of AMT by cholesterol.
To further validate the effect of cholesterol on AMT’s membrane partition and the underlying mechanism, we calculated the PMFs of AMT along z as well as the enthalpy and entropy components, at xchol = 0% and 32%. The enthalpy-entropy decomposition was according to Eqs. 2–3.
| (2) |
| (3) |
We chose T = 308 K and ΔT = 5 K.
As shown in Fig. 6A, in the absence of cholesterol, the PMF profile of AMT has a deep free energy well at the middle of the leaflet (z = ~9 Å). The free energy depth (relative to the aqueous phase) is ~ 4 kcal/mol. In comparison, in the presence of cholesterol, the well becomes shallower (depth ~ 2.7 kcal/mol) and also shifts towards the lipid-water interface (z = ~12 Å). In addition, a new well arises in the middle of the bilayer. These free energy results are qualitatively consistent with the observations in the conventional MD simulations (Figs. 1C, 2, & 4). Indeed, the density profiles from the conventional MD simulations at 303 K (Fig. 2) convert to PMFs that have good match in the lipid region with those calculated by the ABF method, though not for the relative height between the lipid region and the aqueous phase (Fig. S6).
Figure 6. The potentials of mean force and partition coefficients of AMT in the absence and presence of cholesterol.
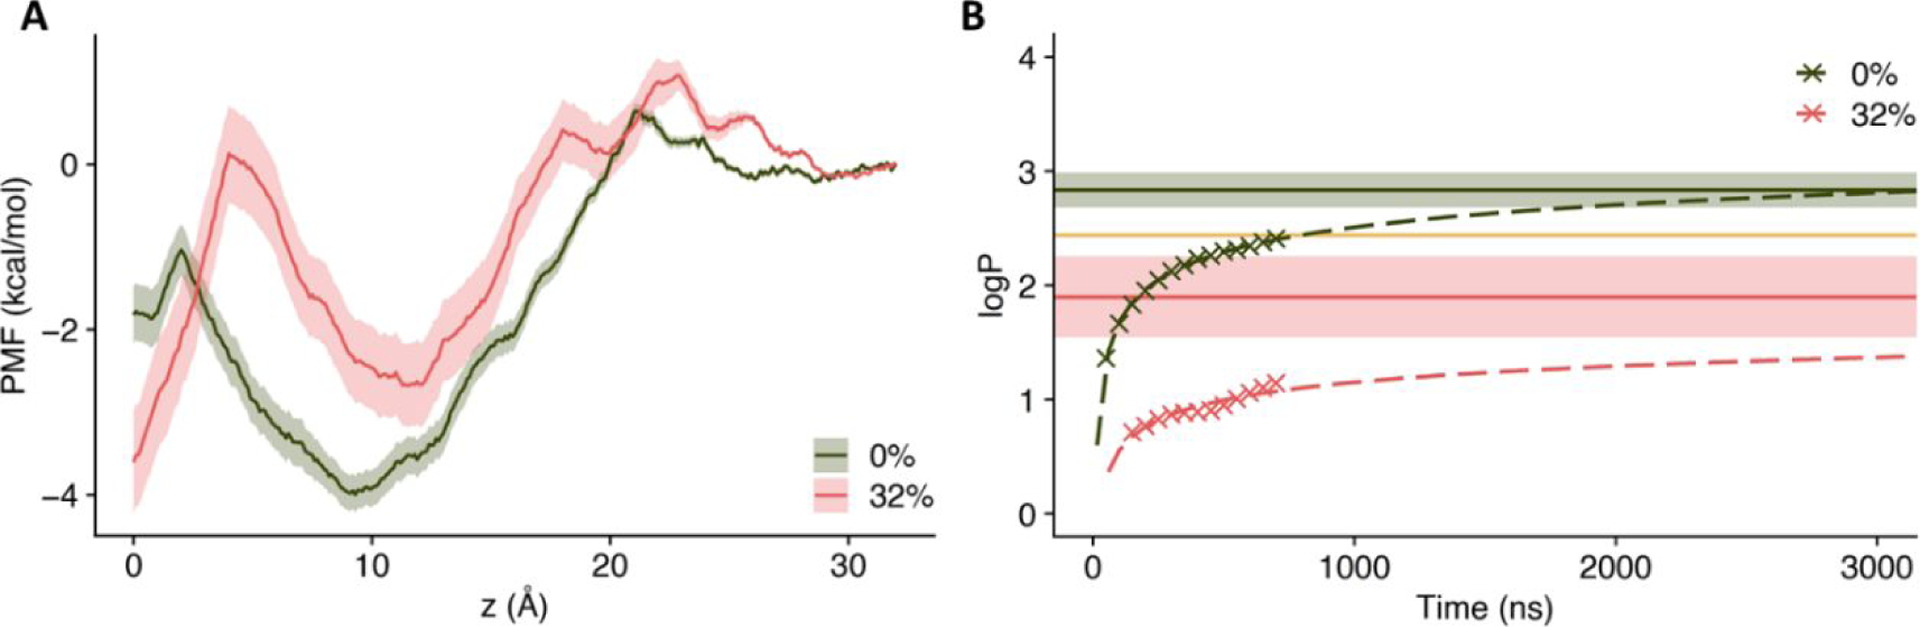
(A) The PMFs of AMT along z at xchol = 0 (dark green line) and 32% (red line) at 308 K. (B) The estimated partition coefficient, logP, from MD simulations. The dashed line shows the calculated logP from extrapolating the data from the conventional MD simulations; the solid line shows the calculated logP from the free energy calculations. The solid line in orange represents the experimentally determined logP.
Free energy decomposition (Fig. S7) suggests that the reduced well depth in the presence of cholesterol is due to lower entropy. Apparently, as the lipid environment gets rigidified by cholesterol, the bound AMT also loses freedom. In the absence of cholesterol, the flexibility of DMPC lipids afford many ways to accommodate the bound AMT. With a rigidified lipid environment, the number of ways to accommodate the AMT molecule becomes limited. The rigidified lipid environment also restricts the lateral motions of AMT molecules (Fig. S8). During the same amount of time, lateral motions of AMT extend far less distances at 32% cholesterol than in the pure lipid system.
Kinetic effects in the membrane partition of AMT are also of interest. The barrier of the PMF for entering the lipid bilayer is higher with 32% cholesterol than in the pure lipid system (Fig. 6A). Free energy decomposition (Fig. S7) again suggests that the difference in this barrier height arises from lipid regification by cholesterol. The higher barrier explains why in the conventional MD simulations it takes longer for AMT molecules to move from the aqueous phase into the lipid bilayer when cholesterol is present. Even more significantly, cholesterol reduces the barrier for AMT to leave the lipid bilayer. This explains why, in the absence of cholesterol, once AMT molecules get inside the lipid bilayer, they stably stay there, but in the presence of 32% cholesterol, AMT can escape from the lipid bilayer into the aqueous phase.
The partition coefficient (logP) is a well-known measure of the lipophilicity of drug molecules. We estimated logP of AMT from the transfer free energy between the lipid bilayer and aqueous phase using the PMFs. Predictions for logP in the range of 2.3 (313 K) to 4.0 (303 K) in the cholesterol-free condition are consistent with the experimental value of 2.4457. We also tried to extrapolate logP from the relatively short (hundreds of ns) conventional MD simulations. As shown in Fig. 6B, the two methods give consistent predictions. The partition coefficient decreases by 1–2 log units at xchol = 32%, quantifying the reduced membrane partition of AMT in the presence of cholesterol.
DISCUSSION
The MD simulations in the present work showed that the membrane partition of the M2-targeting drug molecule, AMT, is sensitive to the presence of cholesterol. At low cholesterol mole fractions, the drug molecule stably binds to DMPC bilayers, with DMPC acyl chains wrapped from below. Cholesterol at a high mole fraction results in the expulsion of the drug molecule from the lipid bilayer. These atomic details on drug-membrane interactions may prove useful for understanding drug partition into cell membranes and drug delivery to the M2 protein and other membrane protein targets. Our work strengthens other recent reports of reduced membrane partition of small molecules, such as antifungal drug itraconazole58, in the presence of cholesterol.
The increased tendency of AMT to escape to the aqueous phase at high cholesterol content has direct experimental support. Solid-state NMR experiments of Cady et al.39 found that AMT bound to DMPC bilayers (at a drug-lipid molar ratio of 1:15) nearly 100%. However, in a virus-mimetic membrane containing 30% cholesterol, a sharp isotropic peak, interpreted as arising from AMT in bulk water, accounted for 18% of total intensity. The isotropic peak was cholesterol-dependent, reducing significantly when xchol was lowered to 23%.
Interestingly, in the same study39, when an M2 construct (residues 21–61) containing the transmembrane and amphipathic helices was introduced to the DMPC bilayers (at a protein-lipid molar ratio of 1:15), three AMT populations with an occupancy ratio of 47:45:7 were observed, representing species bound to the M2 protein, to the bilayers, and in the aqueous phase. In the virus-mimetic membrane containing 30% cholesterol, AMT was only found in the aqueous phase. Part of the loss in the bilayer population of AMT can be attributed to the same reason as found in the M2-free experiments and in our MD simulations. Perhaps more importantly, the M2 amphipathic helix is known to alter membrane curvature and this action is regulated by cholesterol15. A conflict between a membrane curvature that favors stably bound AMT and one that is sustained by the amphipathic helix in the presence of cholesterol may explain the complete loss of the bilayer population of AMT. It is also intriguing that, at the same time, AMT also loses its ability to bind M2. This result provides some support to the contention that at least a sub-population of the AMT molecules bound in the M2 pore comes from exchange with a membrane-bound population.
The present work used a single type of lipids, DMPC, which is widely used in experimental studies. Cell membranes have far more complicated compositions. Different lipids, with neutral and charged headgroups as well as unsaturated and saturated tails, mixed with cholesterol may have distinct influences on the partition behaviors of drug molecules. The present work’s approach and findings provide a solid foundation for studying drug partition in more native-like membrane environments.
Supplementary Material
ACKNOWLEDGEMENTS
HD was supported by the National Key Research and Development Program of China (2017YFB0702600, 2017YFB0702601), the National Natural Science Foundation of China (Grant Nos. 21773115, 21833002), the Natural Science Foundation of Jiangsu Province (Grant No. BK20190056), and the Fundamental Research Funds for the Central Universities (021514380014). HXZ was supported by National Institutes of Health Grant GM118091. Parts of the calculations were performed using computational resources on an IBM Blade cluster system from the High-Performance Computing Center (HPCC) of Nanjing University.
Footnotes
Supporting Information
The z positions of AMT in the simulations at xchol = 0%, 7%, 14%, 21%, and 32%; comparison of PMF profiles obtained from conventional MD simulations and by the ABF method; the enthalpy-entropy decomposition of the PMFs; and the lateral motions of AMT in the lipid bilayer.
CONFLICT OF INTEREST
The authors declare no competing interests.
REFERENCES
- (1).Arinaminpathy Y; Khurana E; Engelman DM; Gerstein MB, Computational Analysis of Membrane Proteins: The Largest Class of Drug Targets. Drug Discov. Today 2009, 14, 1130–1135. [DOI] [PMC free article] [PubMed] [Google Scholar]
- (2).Fotakis C; Christodoueas D; Zoumpoulakis P; Kritsi E; Benetis NP; Mayromoustakos T; Reis H; Gili A; Papadopoulos MG; Zervou M, Comparative Biophysical Studies of Sartan Class Drug Molecules Losartan and Candesartan (Cv-11974) with Membrane Bilayers. J. Phys. Chem. B 2011, 115, 6180–6192. [DOI] [PubMed] [Google Scholar]
- (3).Ohvo-Rekila H; Ramstedt B; Leppimaki P; Slotte JP, Cholesterol Interactions with Phospholipids in Membranes. Prog. Lipid Res 2002, 41, 66–97. [DOI] [PubMed] [Google Scholar]
- (4).Rog T; Pasenkiewicz-Gierula M; Vattulainen I; Karttunen M, Ordering Effects of Cholesterol and Its Analogues. BBA-Biomembranes 2009, 1788, 97–121. [DOI] [PubMed] [Google Scholar]
- (5).Berkowitz ML, Detailed Molecular Dynamics Simulations of Model Biological Membranes Containing Cholesterol. BBA-Biomembranes 2009, 1788, 86–96. [DOI] [PubMed] [Google Scholar]
- (6).Simons K; Vaz WL, Model Systems, Lipid Rafts, and Cell Membranes. Annu. Rev. Biophys. Biomol. Struct 2004, 33, 269–95. [DOI] [PubMed] [Google Scholar]
- (7).Wennberg CL; van der Spoel D; Hub JS, Large Influence of Cholesterol on Solute Partitioning into Lipid Membranes. J. Am. Chem. Soc 2012, 134, 5351–5361. [DOI] [PubMed] [Google Scholar]
- (8).Tse CH; Comer J; Wang Y; Chipot C, Link between Membrane Composition and Permeability to Drugs. J. Chem. Theory Comput 2018, 14, 2895–2909. [DOI] [PubMed] [Google Scholar]
- (9).Mason RP; Moisey DM; Shajenko L, Cholesterol Alters the Binding of Ca2+ Channel Blockers to the Membrane Lipid Bilayer. Mol. Pharmacol 1992, 41, 315–321. [PubMed] [Google Scholar]
- (10).Zhu Q; Lu Y; He X; Liu T; Chen H; Wang F; Zheng D; Dong H; Ma J, Entropy and Polarity Control the Partition and Transportation of Drug-Like Molecules in Biological Membrane. Sci. Rep 2017, 7, 17749. [DOI] [PMC free article] [PubMed] [Google Scholar]
- (11).Sharma M; Yi MG; Dong H; Qin HJ; Peterson E; Busath DD; Zhou H-X; Cross TA, Insight into the Mechanism of the Influenza a Proton Channel from a Structure in a Lipid Bilayer. Science 2010, 330, 509–512. [DOI] [PMC free article] [PubMed] [Google Scholar]
- (12).Tian C; Gao PF; Pinto LH; Lamb RA; Cross TA, Initial Structural and Dynamic Characterization of the M2 Protein Transmembrane and Amphipathic Helices in Lipid Bilayers. Prot. Sci 2003, 12, 2597–605. [DOI] [PMC free article] [PubMed] [Google Scholar]
- (13).Rossman JS; Jing X; Leser GP; Balannik V; Pinto LH; Lamb RA, Influenza Virus M2 Ion Channel Protein Is Necessary for Filamentous Virion Formation. J. Virol 2010, 84, 5078–88. [DOI] [PMC free article] [PubMed] [Google Scholar]
- (14).Thaa B; Levental I; Herrmann A; Veit M, Intrinsic Membrane Association of the Cytoplasmic Tail of Influenza Virus M2 Protein and Lateral Membrane Sorting Regulated by Cholesterol Binding and Palmitoylation. Biochem. J 2011, 437, 389–97. [DOI] [PubMed] [Google Scholar]
- (15).Rossman JS; Jing X; Leser GP; Lamb RA, Influenza Virus M2 Protein Mediates Escrt-Independent Membrane Scission. Cell 2010, 142, 902–13. [DOI] [PMC free article] [PubMed] [Google Scholar]
- (16).Paulino J; Pang X; Hung I; Zhou H-X; Cross TA, Influenza a M2 Channel Clustering at High Protein/Lipid Ratios: Viral Budding Implications. Biophys. J 2019, 116, 1075–1084. [DOI] [PMC free article] [PubMed] [Google Scholar]
- (17).Rajendran L; Schneider A; Schlechtingen G; Weidlich S; Ries J; Braxmeier T; Schwille P; Schulz JB; Schroeder C; Simons M, et al. , Efficient Inhibition of the Alzheimer’s Disease Beta-Secretase by Membrane Targeting. Science 2008, 320, 520–3. [DOI] [PubMed] [Google Scholar]
- (18).Hu J; Asbury T; Achuthan S; Li C; Bertram R; Quine JR; Fu R; Cross TA, Backbone Structure of the Amantadine-Blocked Trans-Membrane Domain M2 Proton Channel from Influenza a Virus. Biophys. J 2007, 92, 4335–43. [DOI] [PMC free article] [PubMed] [Google Scholar]
- (19).Jing X; Ma C; Ohigashi Y; Oliveira FA; Jardetzky TS; Pinto LH; Lamb RA, Functional Studies Indicate Amantadine Binds to the Pore of the Influenza a Virus M2 Proton-Selective Ion Channel. Proc. Natl. Acad. Sci. U. S. A 2008, 105, 10967–72. [DOI] [PMC free article] [PubMed] [Google Scholar]
- (20).Stouffer AL; Acharya R; Salom D; Levine AS; Di Costanzo L; Soto CS; Tereshko V; Nanda V; Stayrook S; DeGrado WF, Structural Basis for the Function and Inhibition of an Influenza Virus Proton Channel. Nature 2008, 451, 596–599. [DOI] [PMC free article] [PubMed] [Google Scholar]
- (21).Ohigashi Y; Ma C; Jing X; Balannick V; Pinto LH; Lamb RA, An Amantadine-Sensitive Chimeric Bm2 Ion Channel of Influenza B Virus Has Implications for the Mechanism of Drug Inhibition. Proc. Natl. Acad. Sci. U. S. A 2009, 106, 18775–9. [DOI] [PMC free article] [PubMed] [Google Scholar]
- (22).Cady SD; Schmidt-Rohr K; Wang J; Soto CS; DeGrado WF; Hong M, Structure of the Amantadine Binding Site of Influenza M2 Proton Channels in Lipid Bilayers. Nature 2010, 463, 689–692. [DOI] [PMC free article] [PubMed] [Google Scholar]
- (23).Sharma M; Li C; Busath DD; Zhou HX; Cross TA, Drug Sensitivity, Drug-Resistant Mutations, and Structures of Three Conductance Domains of Viral Porins. BBA-Biomembranes 2011, 1808, 538–46. [DOI] [PMC free article] [PubMed] [Google Scholar]
- (24).Pielak RM; Oxenoid K; Chou JJ, Structural Investigation of Rimantadine Inhibition of the Am2-Bm2 Chimera Channel of Influenza Viruses. Structure 2011, 19, 1655–1663. [DOI] [PMC free article] [PubMed] [Google Scholar]
- (25).Traynelis SF; Wollmuth LP; McBain CJ; Menniti FS; Vance KM; Ogden KK; Hansen KB; Yuan HJ; Myers SJ; Dingledine R, Glutamate Receptor Ion Channels: Structure, Regulation, and Function. Pharmacol. Rev 2010, 62, 405–496. [DOI] [PMC free article] [PubMed] [Google Scholar]
- (26).Wolf E; Seppi K; Katzenschlager R; Hochschorner G; Ransmayr G; Schwingenschuh P; Ott E; Kloiber I; Haubenberger D; Auff E, et al. , Long-Term Antidyskinetic Efficacy of Amantadine in Parkinson’s Disease. Mov. Disord 2010, 25, 1357–1363. [DOI] [PubMed] [Google Scholar]
- (27).Aranda Abreu GE; Hernandez Aguilar ME; Herrera Covarrubias D; Rojas Duran F, Amantadine as a Drug to Mitigate the Effects of Covid-19. Med. Hypotheses 2020, 140. [DOI] [PMC free article] [PubMed] [Google Scholar]
- (28).Chen HN; Wu YJ; Voth GA, Proton Transport Behavior through the Influenza a M2 Channel: Insights from Molecular Simulation. Biophys. J 2007, 93, 3470–3479. [DOI] [PMC free article] [PubMed] [Google Scholar]
- (29).Yi M; Cross TA; Zhou H-X, A Secondary Gate as a Mechanism for Inhibition of the M2 Proton Channel by Amantadine. J. Phys. Chem. B 2008, 112, 7977–7979. [DOI] [PMC free article] [PubMed] [Google Scholar]
- (30).Yi MG; Cross TA; Zhou H-X, Conformational Heterogeneity of the M2 Proton Channel and a Structural Model for Channel Activation. Proc. Natl. Acad. Sci. U. S. A 2009, 106, 13311–13316. [DOI] [PMC free article] [PubMed] [Google Scholar]
- (31).Qin GR; Yu KQ; Shi T; Luo C; Li GH; Zhu WL; Jiang HL, How Does Influenza Virus a Escape from Amantadine? J. Phys. Chem. B 2010, 114, 8487–8493. [DOI] [PubMed] [Google Scholar]
- (32).Arkin IT; Leonov H; Astrahan P; Krugliak M, How Do Aminoadamantanes Block the Influenza M2 Channel, and How Does Resistance Develop? J. Am. Chem. Soc 2011, 133, 9903–9911. [DOI] [PubMed] [Google Scholar]
- (33).Liu LA; Gu RX; Wei DQ; Du JG; Liu L; Liu H, Free Energy Calculations on the Two Drug Binding Sites in the M2 Proton Channel. J. Am. Chem. Soc 2011, 133, 10817–10825. [DOI] [PubMed] [Google Scholar]
- (34).Wang J; Ma CL; Fiorin G; Carnevale V; Wang T; Hu FH; Lamb RA; Pinto LH; Hong M; Klein ML, et al. , Molecular Dynamics Simulation Directed Rational Design of Inhibitors Targeting Drug-Resistant Mutants of Influenza a Virus M2. J. Am. Chem. Soc 2011, 133, 12834–12841. [DOI] [PMC free article] [PubMed] [Google Scholar]
- (35).Duff KC; Cudmore AJ; Bradshaw JP, The Location of Amantadine Hydrochloride and Free Base within Phospholipid Multilayers: A Neutron and X-Ray Diffraction Study. BBA-Biomembranes 1993, 1145, 149–156. [DOI] [PubMed] [Google Scholar]
- (36).Subczynski WK; Wojas J; Pezeshk V; Pezeshk A, Partitioning and Localization of Spin-Labeled Amantadine in Lipid Bilayers: An Epr Study. J. Pharm. Sci 1998, 87, 1249–1254. [DOI] [PubMed] [Google Scholar]
- (37).Wang JF; Schnell JR; Chou JJ, Amantadine Partition and Localization in Phospholipid Membrane: A Solution Nmr Study. Biochem. Biophys. Res. Commun 2004, 324, 212–217. [DOI] [PubMed] [Google Scholar]
- (38).Li C; Yi M; Hu J; Zhou H-X; Cross TA, Solid-State Nmr and Md Simulations of the Antiviral Drug Amantadine Solubilized in Dmpc Bilayers. Biophys. J 2008, 94, 1295–302. [DOI] [PMC free article] [PubMed] [Google Scholar]
- (39).Cady S; Wang T; Hong M, Membrane-Dependent Effects of a Cytoplasmic Helix on the Structure and Drug Binding of the Influenza Virus M2 Protein. J. Am. Chem. Soc 2011, 133, 11572–9. [DOI] [PMC free article] [PubMed] [Google Scholar]
- (40).Chew CF; Guy A; Biggin PC, Distribution and Dynamics of Adamantanes in a Lipid Bilayer. Biophys. J 2008, 95, 5627–36. [DOI] [PMC free article] [PubMed] [Google Scholar]
- (41).Jo S; Kim T; Iyer VG; Im W, Software News and Updates - Charmm-Gui: A Web-Based Grraphical User Interface for Charmm. J. Comput. Chem 2008, 29, 1859–1865. [DOI] [PubMed] [Google Scholar]
- (42).Yang NJ; Hinner MJ, Getting across the Cell Membrane: An Overview for Small Molecules, Peptides, and Proteins. Methods Mol. Biol. (Clifton, N.J.) 2015, 1266, 29–53. [DOI] [PMC free article] [PubMed] [Google Scholar]
- (43).Phillips JC; Hardy DJ; Maia JDC; Stone JE; Ribeiro JV; Bernardi RC; Buch R; Fiorin G; Henin J; Jiang W, et al. , Scalable Molecular Dynamics on Cpu and Gpu Architectures with Namd. J. Chem. Phys 2020, 153. [DOI] [PMC free article] [PubMed] [Google Scholar]
- (44).Klauda JB; Venable RM; Freites JA; O’Connor JW; Tobias DJ; Mondragon-Ramirez C; Vorobyov I; MacKerell AD Jr.; Pastor RW, Update of the Charmm All-Atom Additive Force Field for Lipids: Validation on Six Lipid Types. J. Phys. Chem. B 2010, 114, 7830–7843. [DOI] [PMC free article] [PubMed] [Google Scholar]
- (45).Jorgensen WL; Chandrasekhar J; Madura JD; Impey RW; Klein ML, Comparison of Simple Potential Functions for Simulating Liquid Water. J. Chem. Phys 1983, 79, 926–935. [Google Scholar]
- (46).Vanommeslaeghe K; Hatcher E; Acharya C; Kundu S; Zhong S; Shim J; Darian E; Guvench O; Lopes P; Vorobyov I, et al. , Charmm General Force Field: A Force Field for Drug-Like Molecules Compatible with the Charmm All-Atom Additive Biological Force Fields. J. Comput. Chem 2010, 31, 671–690. [DOI] [PMC free article] [PubMed] [Google Scholar]
- (47).Frisch MJ; Trucks GW; Schlegel HB; Scuseria GE; Robb MA; Cheeseman JR; Scalmani G; Barone V; Petersson GA; Nakatsuji H, et al. Gaussian 16, Revision C.01; Gaussian, Inc.: Wallingford, CT, 2016. [Google Scholar]
- (48).Wang JM; Cieplak P; Kollman PA, How Well Does a Restrained Electrostatic Potential (Resp) Model Perform in Calculating Conformational Energies of Organic and Biological Molecules? J. Comput. Chem 2000, 21, 1049–1074. [Google Scholar]
- (49).Feller SE; Zhang Y; Pastor RW; Brooks BR, Constant Pressure Molecular Dynamics Simulation: The Langevin Piston Method. J. Chem. Phys 1995, 103, 4613–4621. [Google Scholar]
- (50).Miyamoto S; Kollman PA, Settle: An Analytical Version of the Shake and Rattle Algorithm for Rigid Water Models. J. Comput. Chem 1992, 13, 952–962. [Google Scholar]
- (51).Darden T; York D; Pedersen L, Particle Mesh Ewald: An N Log(N) Method for Ewald Sums in Large Systems. J. Chem. Phys 1993, 98, 10089–10092. [Google Scholar]
- (52).Darve E; Rodríguez-Gómez D; Pohorille A, Adaptive Biasing Force Method for Scalar and Vector Free Energy Calculations. J. Chem. Phys 2008, 128, 144120. [DOI] [PubMed] [Google Scholar]
- (53).Hénin J; Fiorin G; Chipot C; Klein ML, Exploring Multidimensional Free Energy Landscapes Using Time-Dependent Biases on Collective Variables. J. Chem. Theory Comput 2010, 6, 35–47. [DOI] [PubMed] [Google Scholar]
- (54).Pan J; Mills TT; Tristram-Nagle S; Nagle JF, Cholesterol Perturbs Lipid Bilayers Nonuniversally. Phys. Rev. Lett 2008, 100, 198103. [DOI] [PMC free article] [PubMed] [Google Scholar]
- (55).de Meyer F; Smit B, Effect of Cholesterol on the Structure of a Phospholipid Bilayer. Proc. Natl. Acad. Sci. U. S. A 2009, 106, 3654–3658. [DOI] [PMC free article] [PubMed] [Google Scholar]
- (56).Falck E; Patra M; Karttunen M; Hyvonen MT; Vattulainen I, Impact of Cholesterol on Voids in Phospholipid Membranes. J. Chem. Phys 2004, 121, 12676–12689. [DOI] [PubMed] [Google Scholar]
- (57).Martin YC, Exploring Qsar: Hydrophobic, Electronic, and Steric Constants American Chemical Society: Washington, DC. , 1995. [Google Scholar]
- (58).Poojari C; Zak A; Dzieciuch-Rojek M; Bunker A; Kepczynski M; Rog T, Cholesterol Reduces Partitioning of Antifungal Drug Itraconazole into Lipid Bilayers. J. Phys. Chem. B 2020, 124, 2139–2148. [DOI] [PMC free article] [PubMed] [Google Scholar]
Associated Data
This section collects any data citations, data availability statements, or supplementary materials included in this article.