

Abstract
The protein complexes of the mitochondrial electron transport chain exist in isolation and higher order assemblies termed supercomplexes (SCs) or respirasomes (SC I+III2+IV). The association of complexes I, III, and IV into the respirasome is regulated by unknown mechanisms. Here, we designed a Nanoluciferase complementation reporter for complex III and IV proximity to determine in vivo respirasome levels. In a chemical screen, we found that inhibitors of the de novo pyrimidine synthesis enzyme dihydroorotate dehydrogenase (DHODH) potently increased respirasome assembly and activity. Bypassing DHODH inhibition via uridine supplementation decreases SC assembly by altering mitochondrial phospholipid composition, specifically elevated peroxisomal-derived ether phospholipids. Cell growth rates upon DHODH inhibition depends on ether lipid synthesis and SC assembly. These data reveal that nucleotide pools signal to peroxisomes to modulate synthesis and transport of ether phospholipids to mitochondria for SC assembly that are necessary for optimal cell growth in conditions of nucleotide limitation.
Introduction
The predominant function of mitochondria in eukaryotic organisms is to perform metabolic reactions crucial for biosynthesis, redox homeostasis, and energy production. The mitochondrial respiratory chain comprised of complexes I-V regulates these processes. Electrons are garnered from metabolism of carbohydrates, amino acids, and fatty acids and coupled to electron transport chain (ETC, complexes I-IV) activity, passing down an electrochemical gradient to O2 1. The transport of electrons within NADH-ubiquinone oxidoreductase (complex I), ubiquinol-cytochrome c oxidoreductase (complex III), and cytochrome c oxidase (complex IV) is linked to proton pumping across the inner mitochondrial membrane (IMM), generating an electrochemical gradient (Δp) that is coupled to ATP production at ATP synthase (complex V).
The mitochondrial respiratory chain dynamically organizes into isolated and super-assembled complexes. For example, complex I exists predominantly in association with complexes III and IV in the respirasome, and to a minor extent with complex III (SC I+III2) 2,3. Multiple high resolution cryo-EM structures of the respirasome and megacomplex (SC I2+III2+IV2) support the existence of SCs and the protein interactions that enable their assembly 4–8. SCs are functional respiratory structures with enhanced efficiency of electron transport 9–13. Despite a concerted effort to identify proteins that promote SC formation 14–20, only SC Assembly Factor 1 (SCAF1), that bridges complexes III and IV 21,22, is exclusive for SCs. Respirasome assembly can occur independently of SCAF1 20,22–24, indicating there are other regulators of SC assembly.
The assembly and maintenance of SCs is also governed by the mitochondrial phospholipid environment 25–29. Mitochondria contain two membranes, the outer mitochondrial membrane (OMM) and the IMM, the latter of which is densely packed with protein complexes including the respiratory chain. Non-bilayer phospholipids phosphatidylethanolamine (PE) and cardiolipin (CL) are enriched in the IMM to establish architectural domains such as tubular or lamellar cristae, where the respiratory complexes reside 30. These phospholipids are required for SC assembly 25–29, however, the regulation and functional impact of distinct species in mitochondrial membrane composition and respiration are largely unknown.
In this study, we developed an innovative tool for measuring mitochondrial respirasomes in live cells using a split Nanoluciferase (NanoLuc) methodology 31 for complex III and IV proximity. Our bimolecular luminescence complementation technique circumvents the requisite of mitochondrial isolation and detergent solubilization methods to visualize SCs. Using this new methodology, we performed a high-throughput chemical screen for positive regulators of respirasome assembly and uncovered a regulatory mechanism for mitochondrial respirasome levels in proliferative cells that is sensitive to cellular pools of pyrimidine nucleotides. Inhibition of the pyrimidine synthesis enzyme DHODH restructures the ETC towards respirasome assembly and activity due to alterations in phospholipid synthesis pathways that are reliant on the pyrimidine nucleotide CTP. Through unbiased lipidomics, we find that peroxisomal-derived ether lipids, a subclass of phospholipids with unique structural properties, drive respirasome assembly in the context of DHODH inhibition. Thus, we conclude that lower levels of pyrimidine nucleotides stimulate respirasome assembly by altering mitochondrial phospholipid composition towards increased abundance of ether lipids.
Results
Design of mitochondrial SC III2:IV complementation reporters
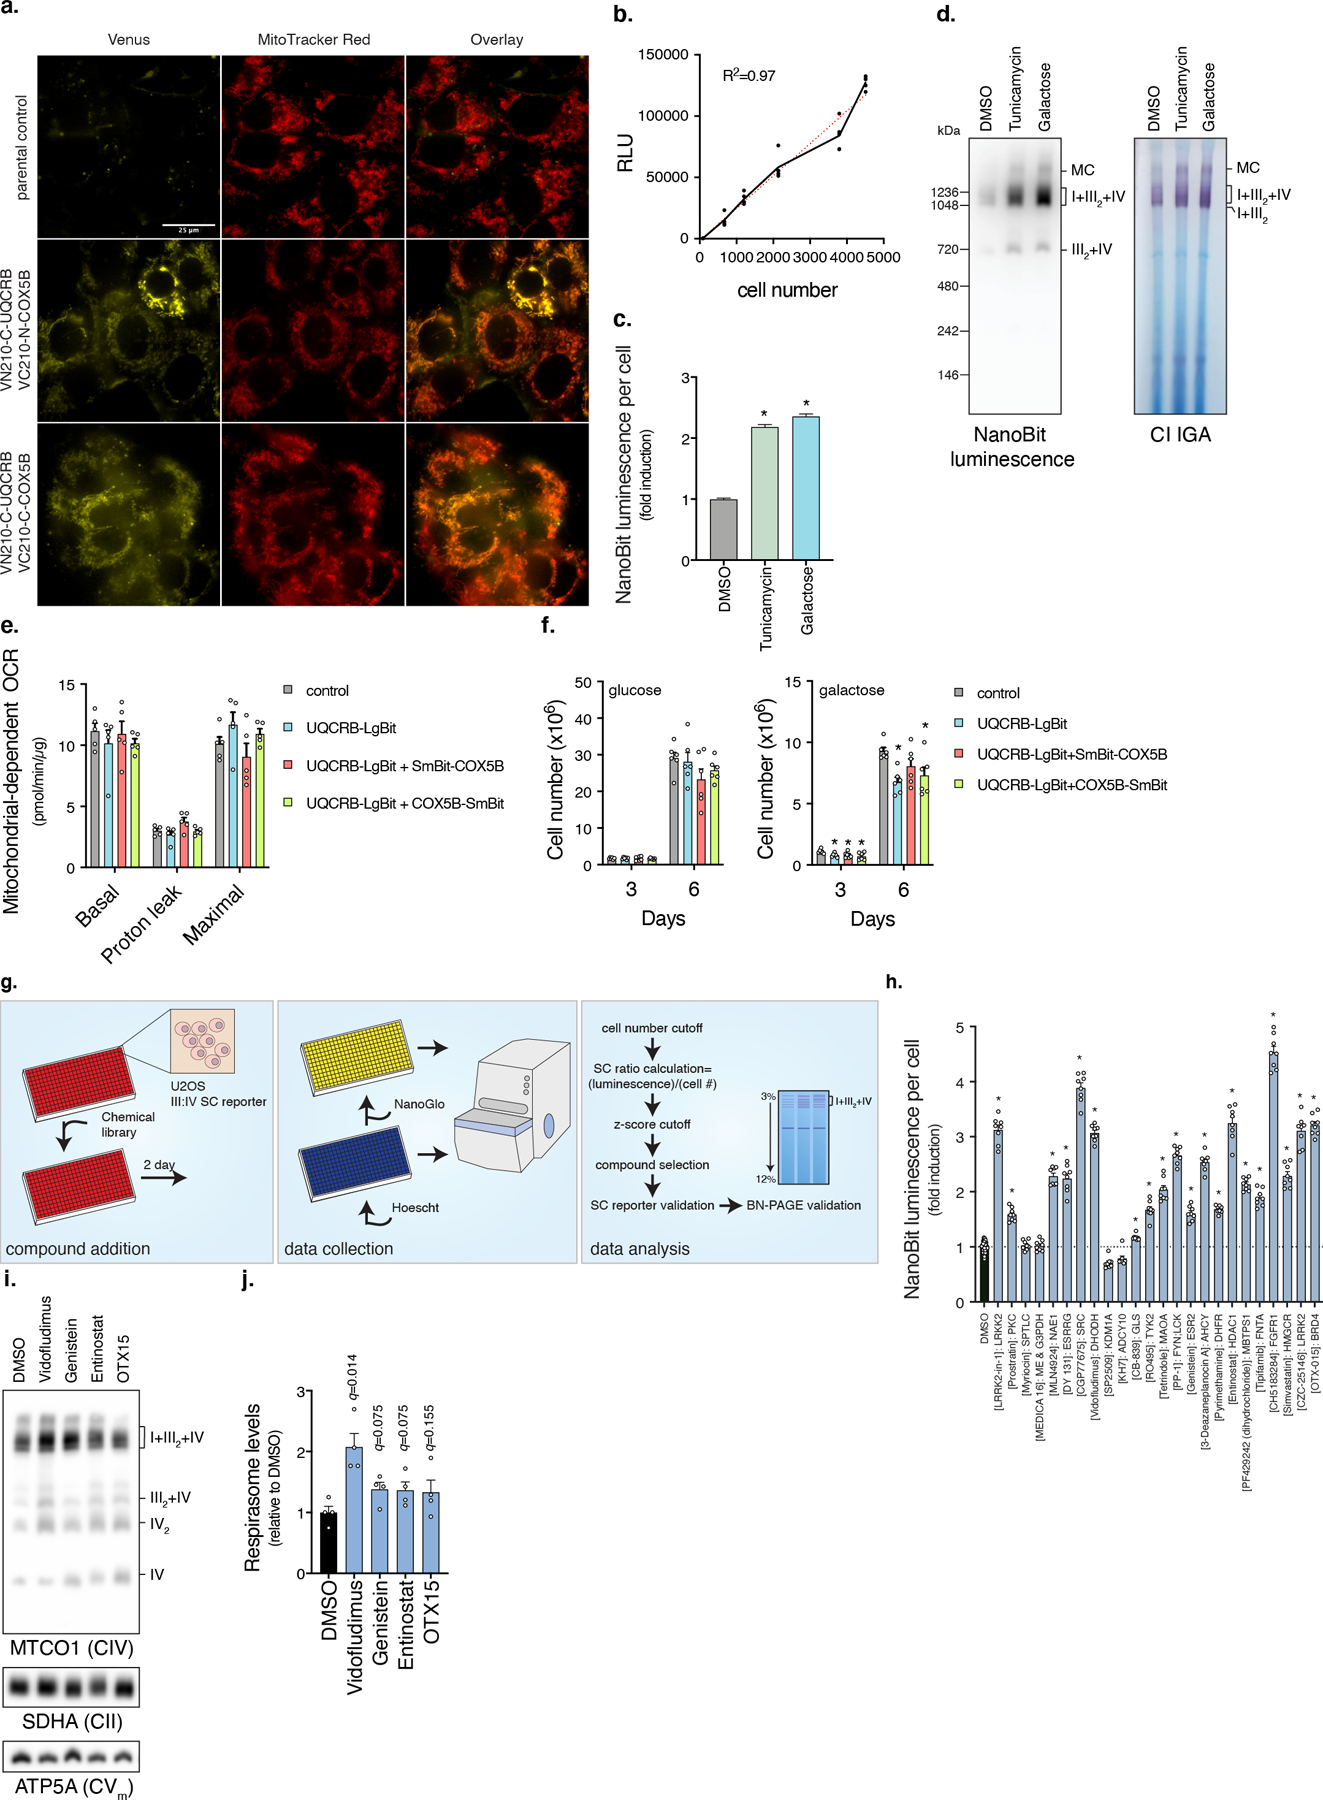
To investigate SC assembly in live cells we designed a protein:protein proximity reporter. Recently, several cryo-EM structures of the respirasome were solved 4–7. We used these structures to examine the proximity of complex I, III, and IV protein subunit termini (N or C) and found that the interface between complex III and IV is a highly conserved region with protein termini projecting into the matrix (Fig. 1a). We constructed protein complementation reporters that rely on the self-association of split Venus fluorescent (VN210, VC210) 32 or luminescent (LgBiT, SmBiT) 31 fragments fused to complex III and IV proteins that spatially interact (Fig. 1b, Supplementary Table 1). UQCRB-C-VN210 and either COX5B-N/C-VC210 exhibited fluorescence that co-localized with mitochondria (Fig. 1c, Extended Data Fig. 1a). These protein pairs were then adapted to the high signal:noise reporter system NanoLuc Binary Technology (NanoBiT) 31. UQCRB-C-LgBiT and either COX5B-N/C-SmBiT produced strong NanoBiT luminescence compared to UQCRB-C-LgBiT alone (42- and 220-fold induction, respectively) (Fig. 1d), and was proportional to cell number (R2 = 0.97) with a linear signal independent of confluency (Extended Data Fig. 1b). Galactose media or tunicamycin 33 increased, while chloramphenicol decreased reporter signal (Fig. 1d,e, Extended Data Fig. 1c,d), revealing the NanoBiT reporter is dynamic. These fusion proteins integrated into complex III complexes, and using an in-gel luciferase assay, luminescence was specific to bands that co-migrate with complex I:III2:IV and III2:IV (Fig. 1e). These fusion proteins did not alter respiration or proliferation, suggesting intact mitochondrial function (Extended Data Fig. 1e,f).
Fig. 1. A high-throughput chemical screen identifies regulators of respirasome formation.
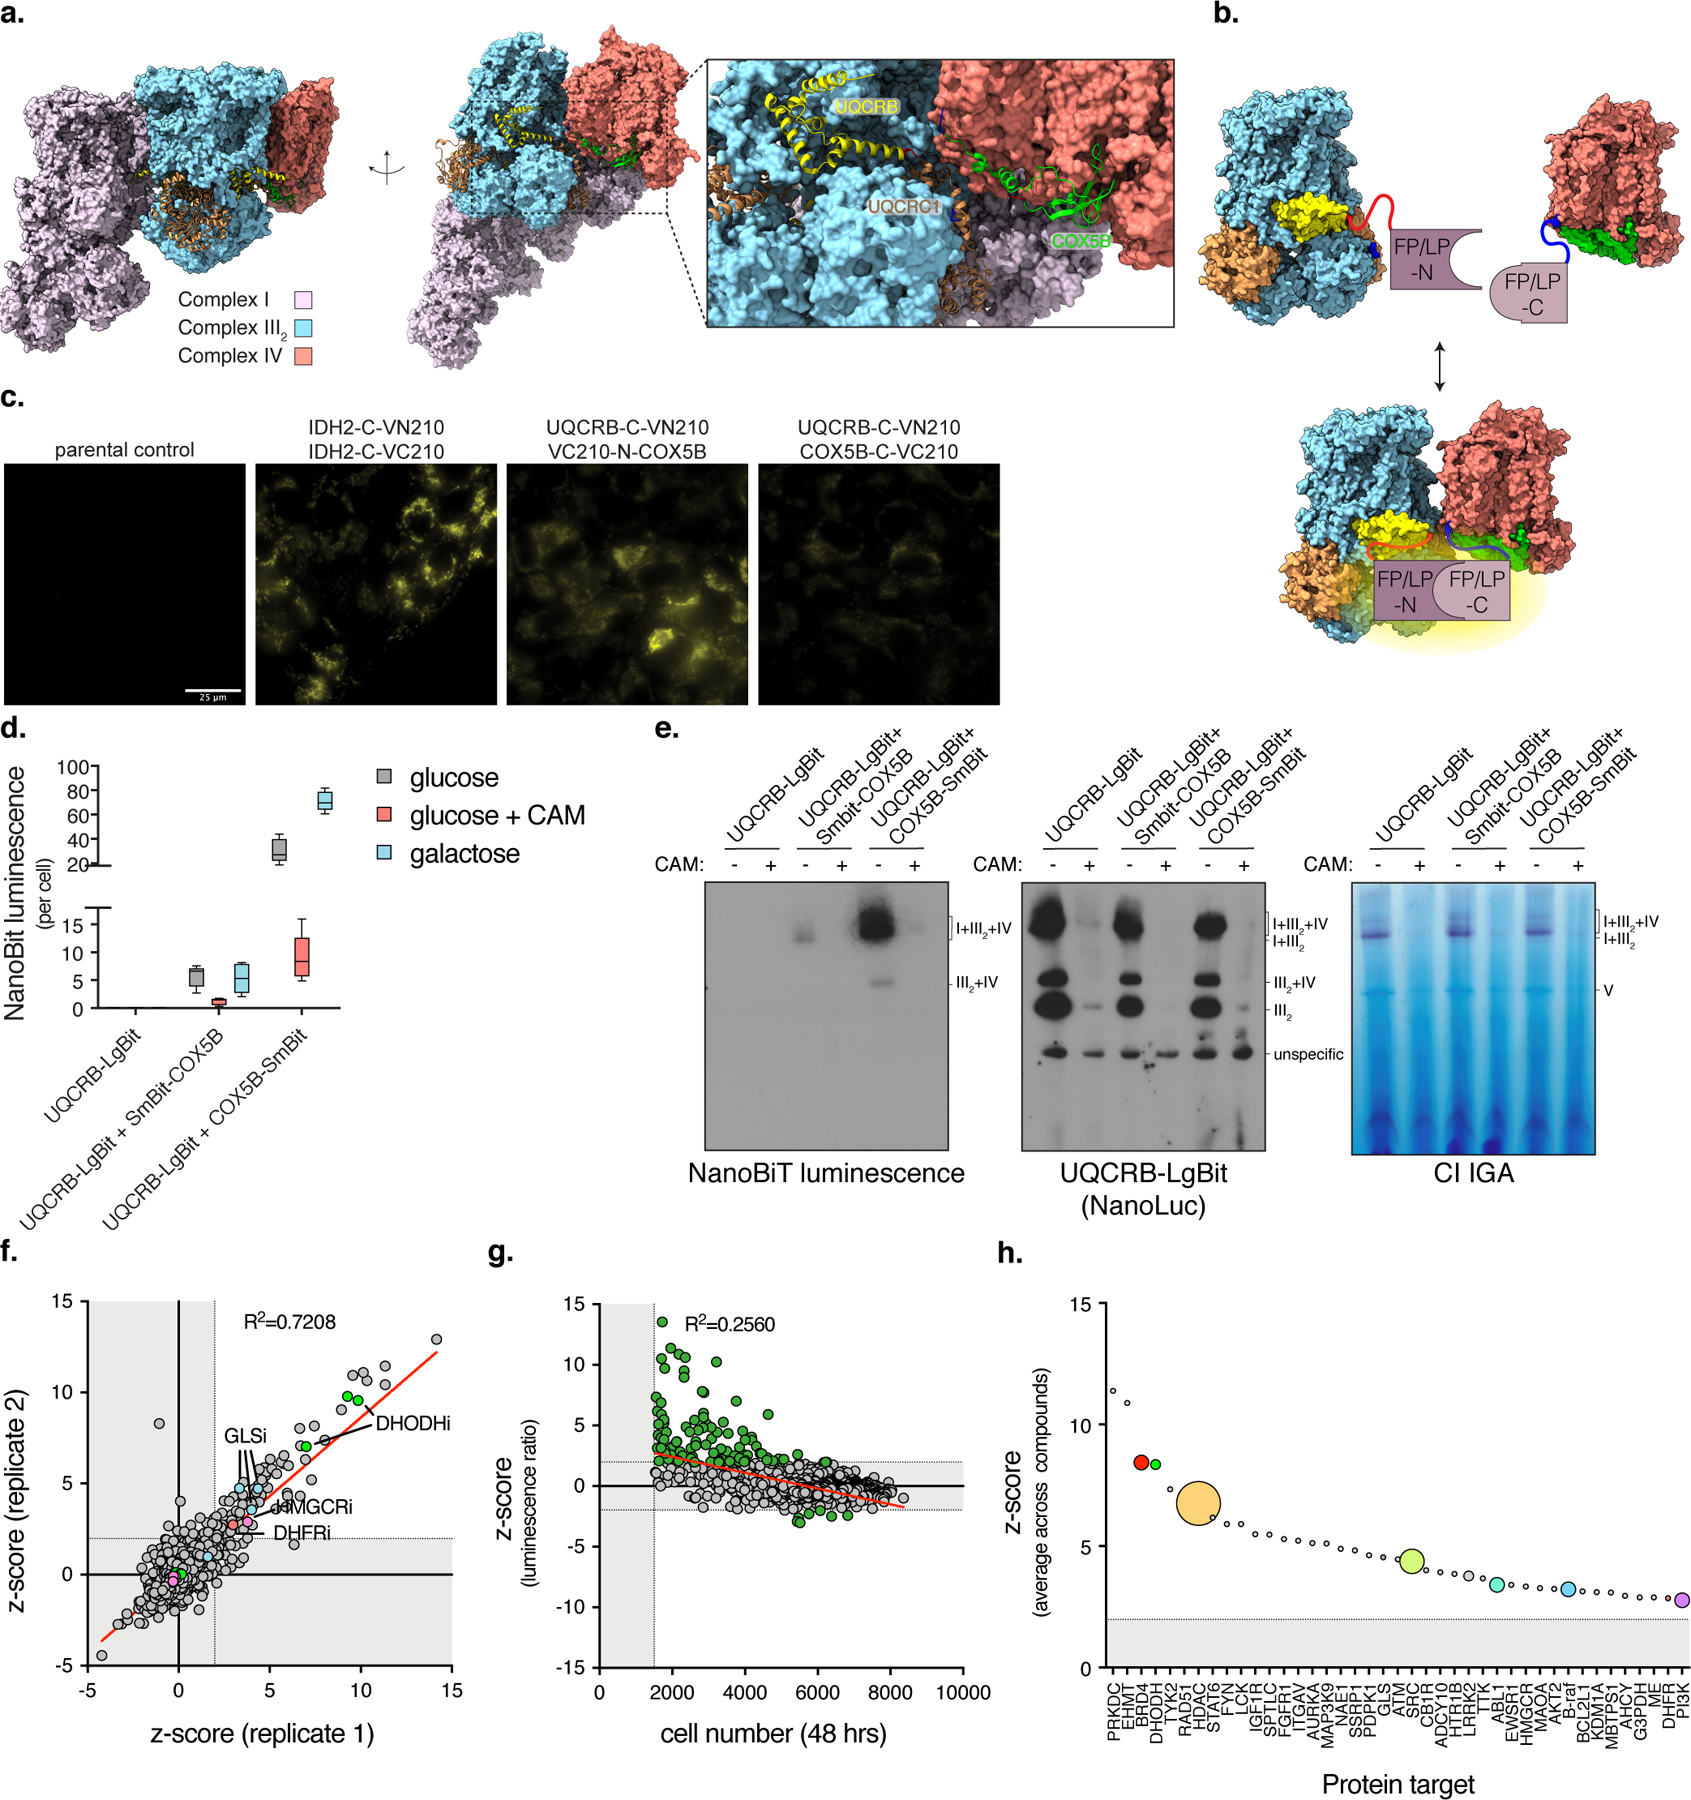
a, Cryo-EM structure of the mammalian respirasome depicting the interface between complex III2 and IV. N-termini are labeled blue and C-termini are red. PDB: 5GUP. b, Complex III2:IV proximity using subunit constructs tagged with split Venus or Nanoluciferase. c, Fluorescent microscopy using UQCRB-C-VN210 and COX5B-N/C-VC210. Scale bar, 25 µm (n=2 experiments). d, Luminescent measurements of cells expressing UQCRB-C-LgBit and COX5B-N/C-SmBit in the presence of chloramphenicol (CAM, 40 µM) or galactose media (box and whisker plot, line at median, 5–95% C.I.). e, BN-PAGE of mitochondrial fractions isolated from cells expressing NanoBiT constructs and treated with ethanol or chloramphenicol (n=2 experiments). Indicated gels were incubated with NanoGlo or CI activity substrates. IGA (in-gel activity). f, Scatter plot of z-score of compounds across plate duplicates in primary screen. g, Scatter plot of z-score of compounds versus cell number (initial seeding of 1,000 cells/well). h, Bubble scatter plot of average z-score of positive compounds (z-score>1.96) targeting certain proteins. Size of dot represents the number of compounds that scored positive in primary screen and target that protein. Cells were treated with compounds for 48 hours.
A chemical screen for mitochondrial respirasome formation
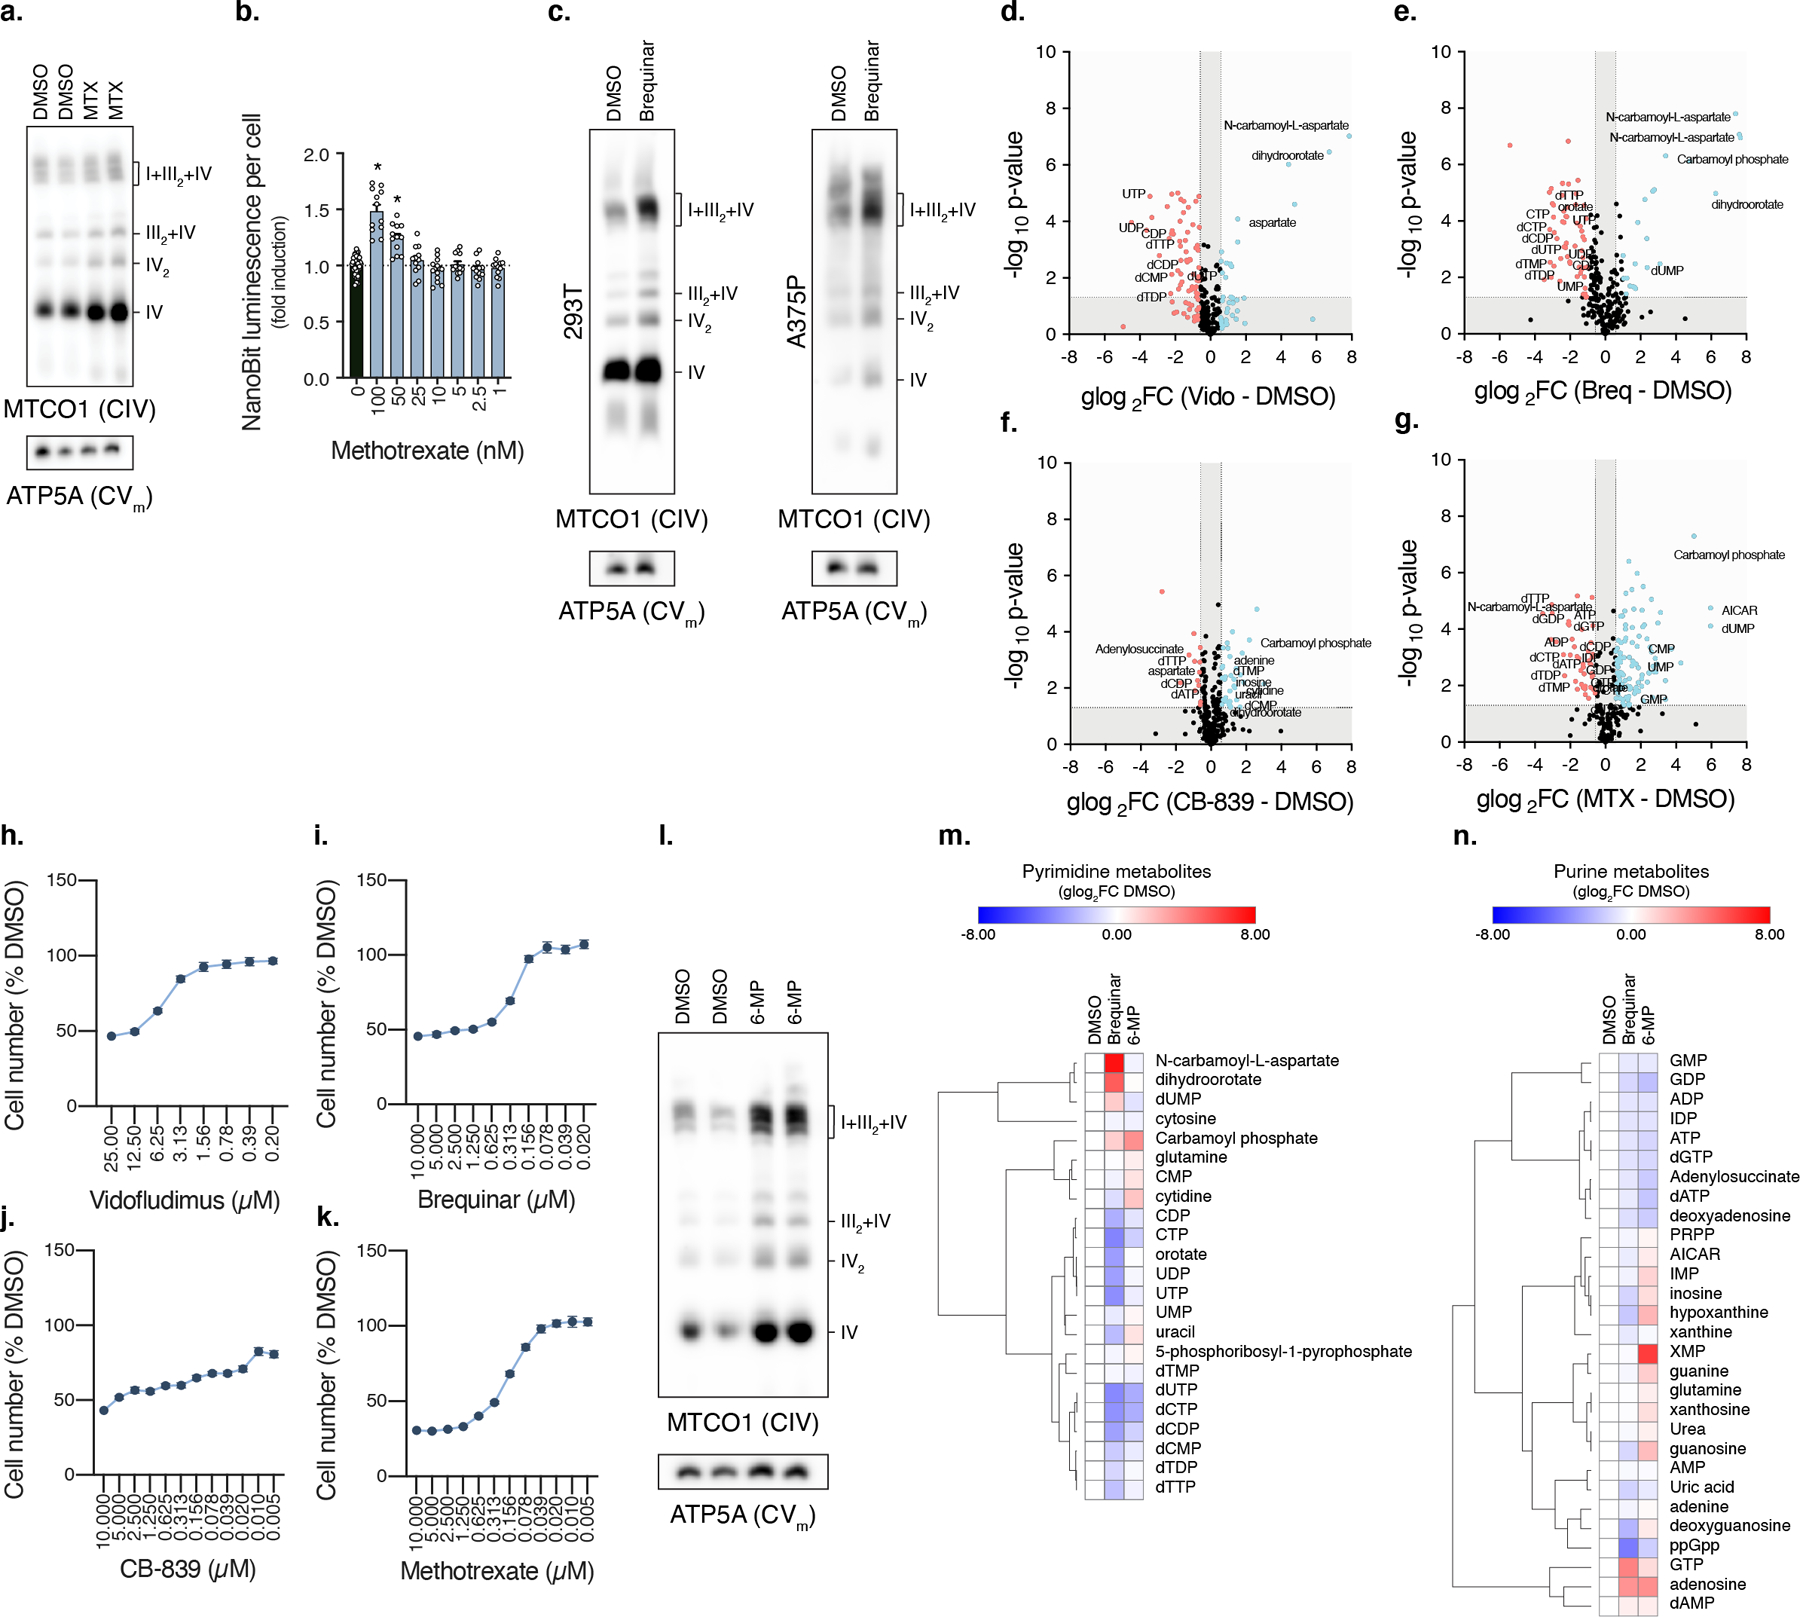
We used the NanoBiT reporter expressing UQCRB-C-LgBiT and COX5B-C-SmBiT to perform a high-throughput chemical screen using 4,703 compounds from libraries with annotated protein targets (Extended Data Fig. 1g). Using a cell number cutoff to exclude toxicity and a z-score to select the top 2.5%, we identified 94/4703 (2%) positive hits (Fig. 1f, Supplementary Data 1, Supplementary Table 2). The luminescent ratio negatively correlated with cell number (r=-0.5060, p<0.0001) (Fig. 1g), but compounds that reduce cell number did not necessarily increase the luminescence ratio, arguing specificity to certain hits. Protein targets with high confidence were identified with multiple drugs and/or titrations scoring positive (Fig. 1h). Most compounds re-tested at the lowest scoring concentration (21/25, 84%) (Extended Data Fig. 1h). However, only a subset such as the DHODH inhibitor Vidofludimus re-tested using BN-PAGE (Extended Data Fig. 1i,j), indicating that some differences exist between the in vivo reporter and isolated mitochondria.
DHODH is the rate-limiting enzyme in de novo pyrimidine synthesis and converts orotate to dihydroorotate 34. Other compounds targeting nucleotide metabolism also scored positive including glutaminase and DHFR inhibitors (Fig. 1f, 2a-e, Extended Data Fig. 2a,b, Supplementary Data 1), suggesting that nucleotide metabolism controls respirasome assembly. This response also occurred in other rapidly proliferating cell types such as human embryonic kidney (293T) and melanoma (A375P) cells (Extended Data Fig. 2c). To determine if these inhibitors are on-target we performed metabolomics (Supplementary Data 2). DHODH inhibitors decreased pyrimidine nucleotides, while increasing levels of upstream metabolites dihydroorotate and N-carbamoyl-L-aspartate (Extended Data Fig. 2d,e). CB-839 (glutaminase inhibitor) decreased aspartate and nucleotides dTTP, dCDP, dATP (Extended Data Fig. 2f). Methotrexate (DHFR inhibitor) reduced both pyrimidine and purine nucleotide pools (Extended Data Fig. 2g). Pyrimidine pools decreased and purine degradation metabolites increased in cells treated with these inhibitors (Fig. 2f,g), consistent with decreases in cell proliferation (Extended Data Fig. 2h-k). To determine if this response is specific to pyrimidine nucleotide depletion, we also treated cells with the purine synthesis inhibitor 6-mercaptopurine (6-MP), which induced respirasome formation and also altered pyrimidine pools (Extended Data Fig. 2l-n, Supplementary Data 2). These results indicate that depletion of pyrimidines correlate with elevated respirasome assembly, with direct inhibitors of pyrimidine synthesis causing the most dramatic effect.
Fig. 2. Pyrimidine nucleotides inversely correlate with respirasome assembly.
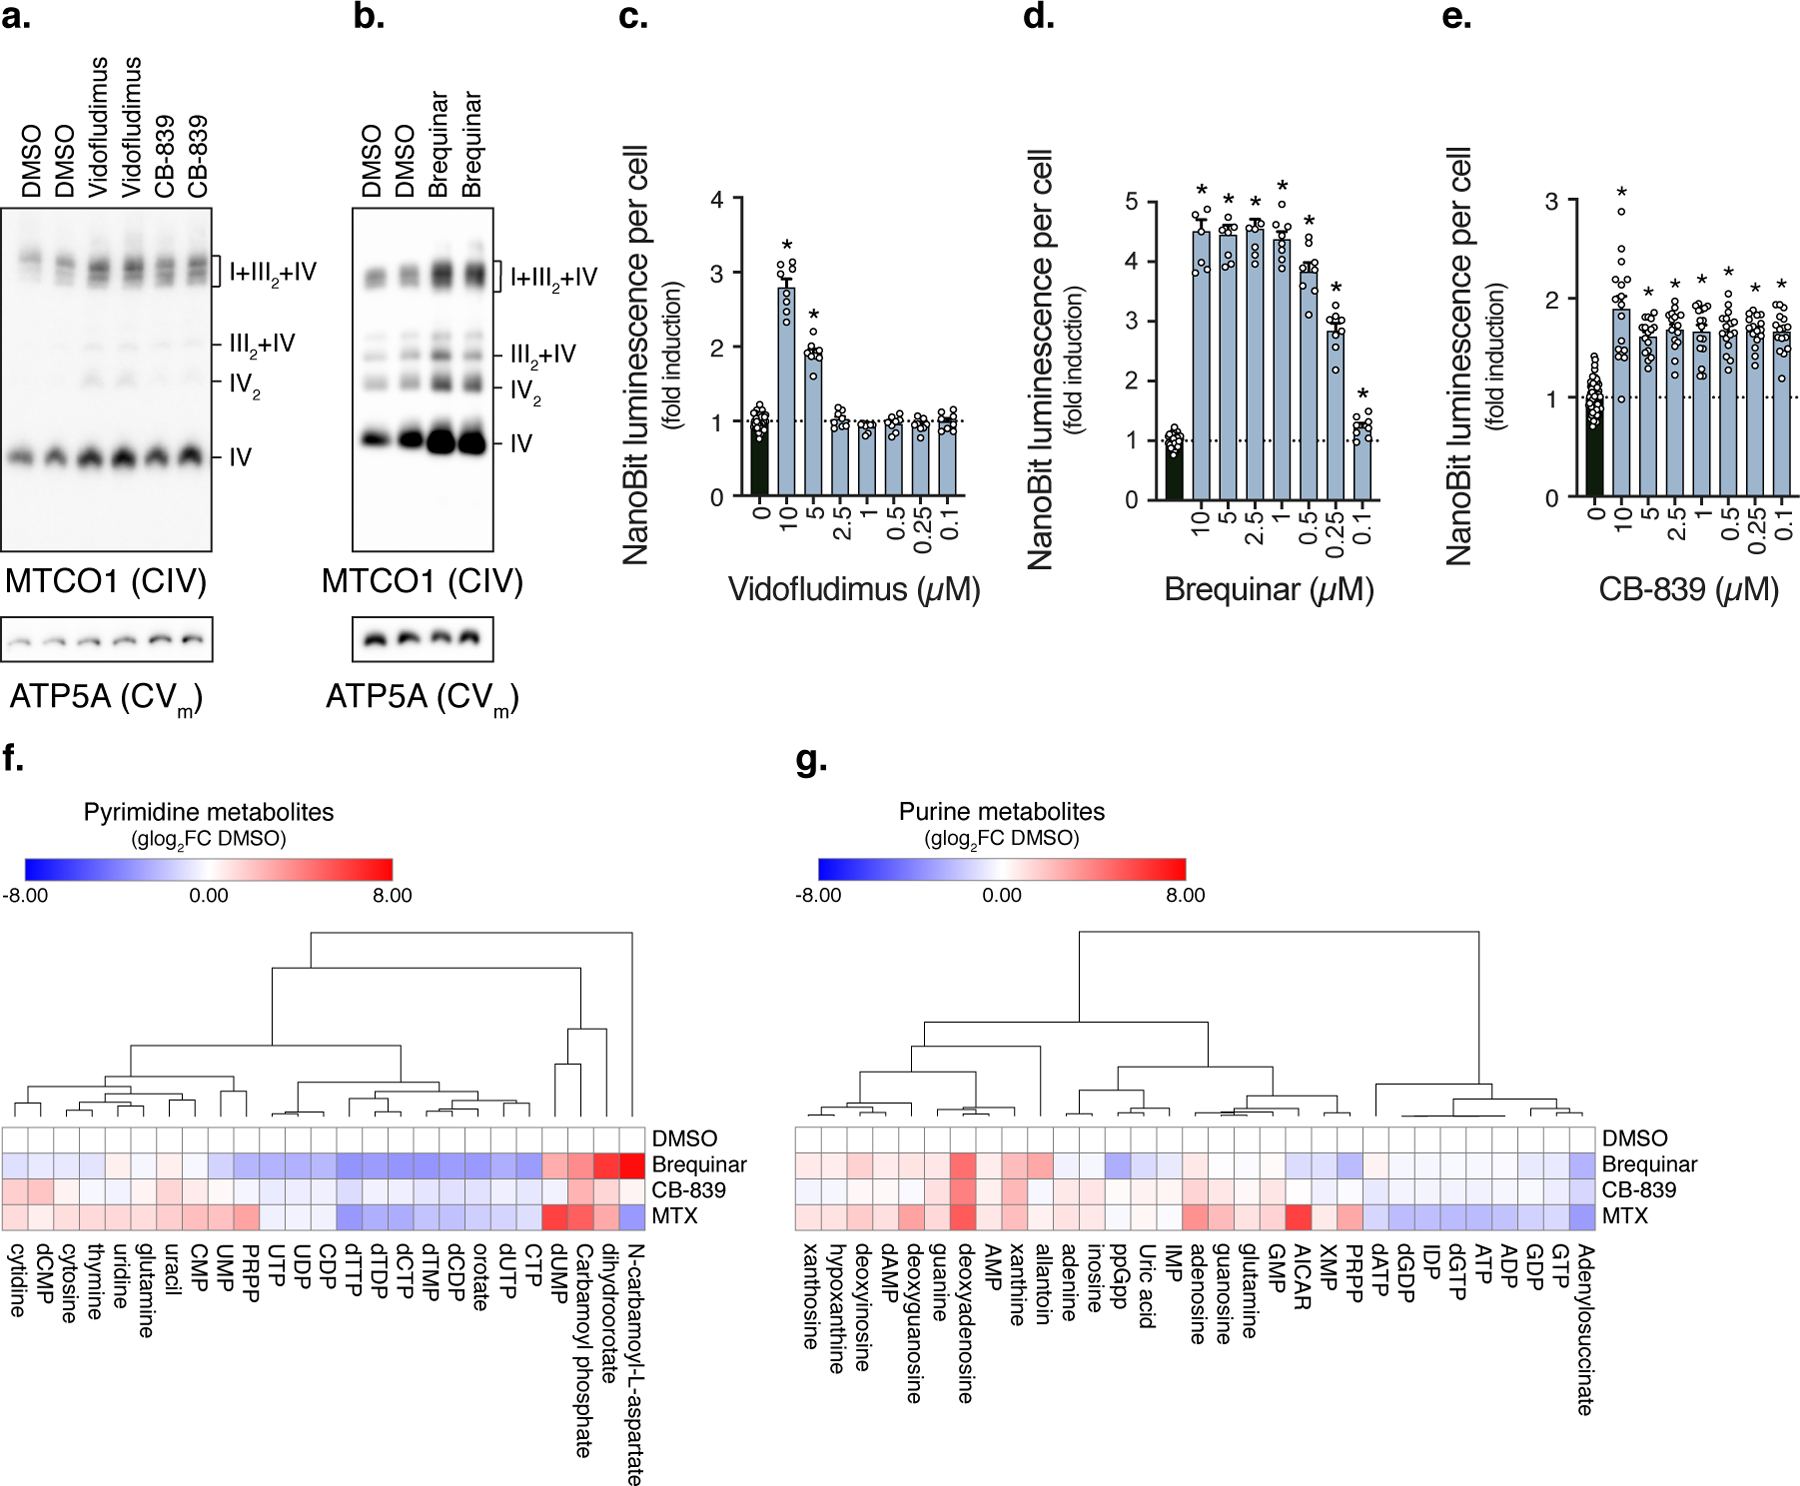
a-b, BN-PAGE of solubilized mitochondrial fractions isolated from cells treated with Vidofludimus (10 µM), CB-839 (10 µM), or Brequinar (0.5 µM) (n=2 experiments). c-e, Luminescence of NanoBiT reporter cells treated with Vidofludimus, Brequinar (DMSO, n=32; Vidofludimus, n=8, * q<0.0001; Brequinar, n=8 biologically independent samples, * q<0.0001), or CB-839 (DMSO, n=64; CB-839, n=16 biologically independent samples, * q<0.0001). f-g, Heatmaps of metabolite changes in cells treated with Vidofludimus, CB-839, Brequinar, or Methotrexate (n=3 biologically independent samples). Cells were treated with compounds for 48 hours, heatmap row/column groupings are Pearson’s correlations, data are presented as mean values +/- s.e.m., Student’s t-test with a two-stage linear step-up procedure of Benjamini, Krieger and Yekutieli, with Q = 5%. Vido (Vidofludimus), Breq (Brequinar), and MTX (Methotrexate).
Respirasome assembly is regulated by nucleotide levels
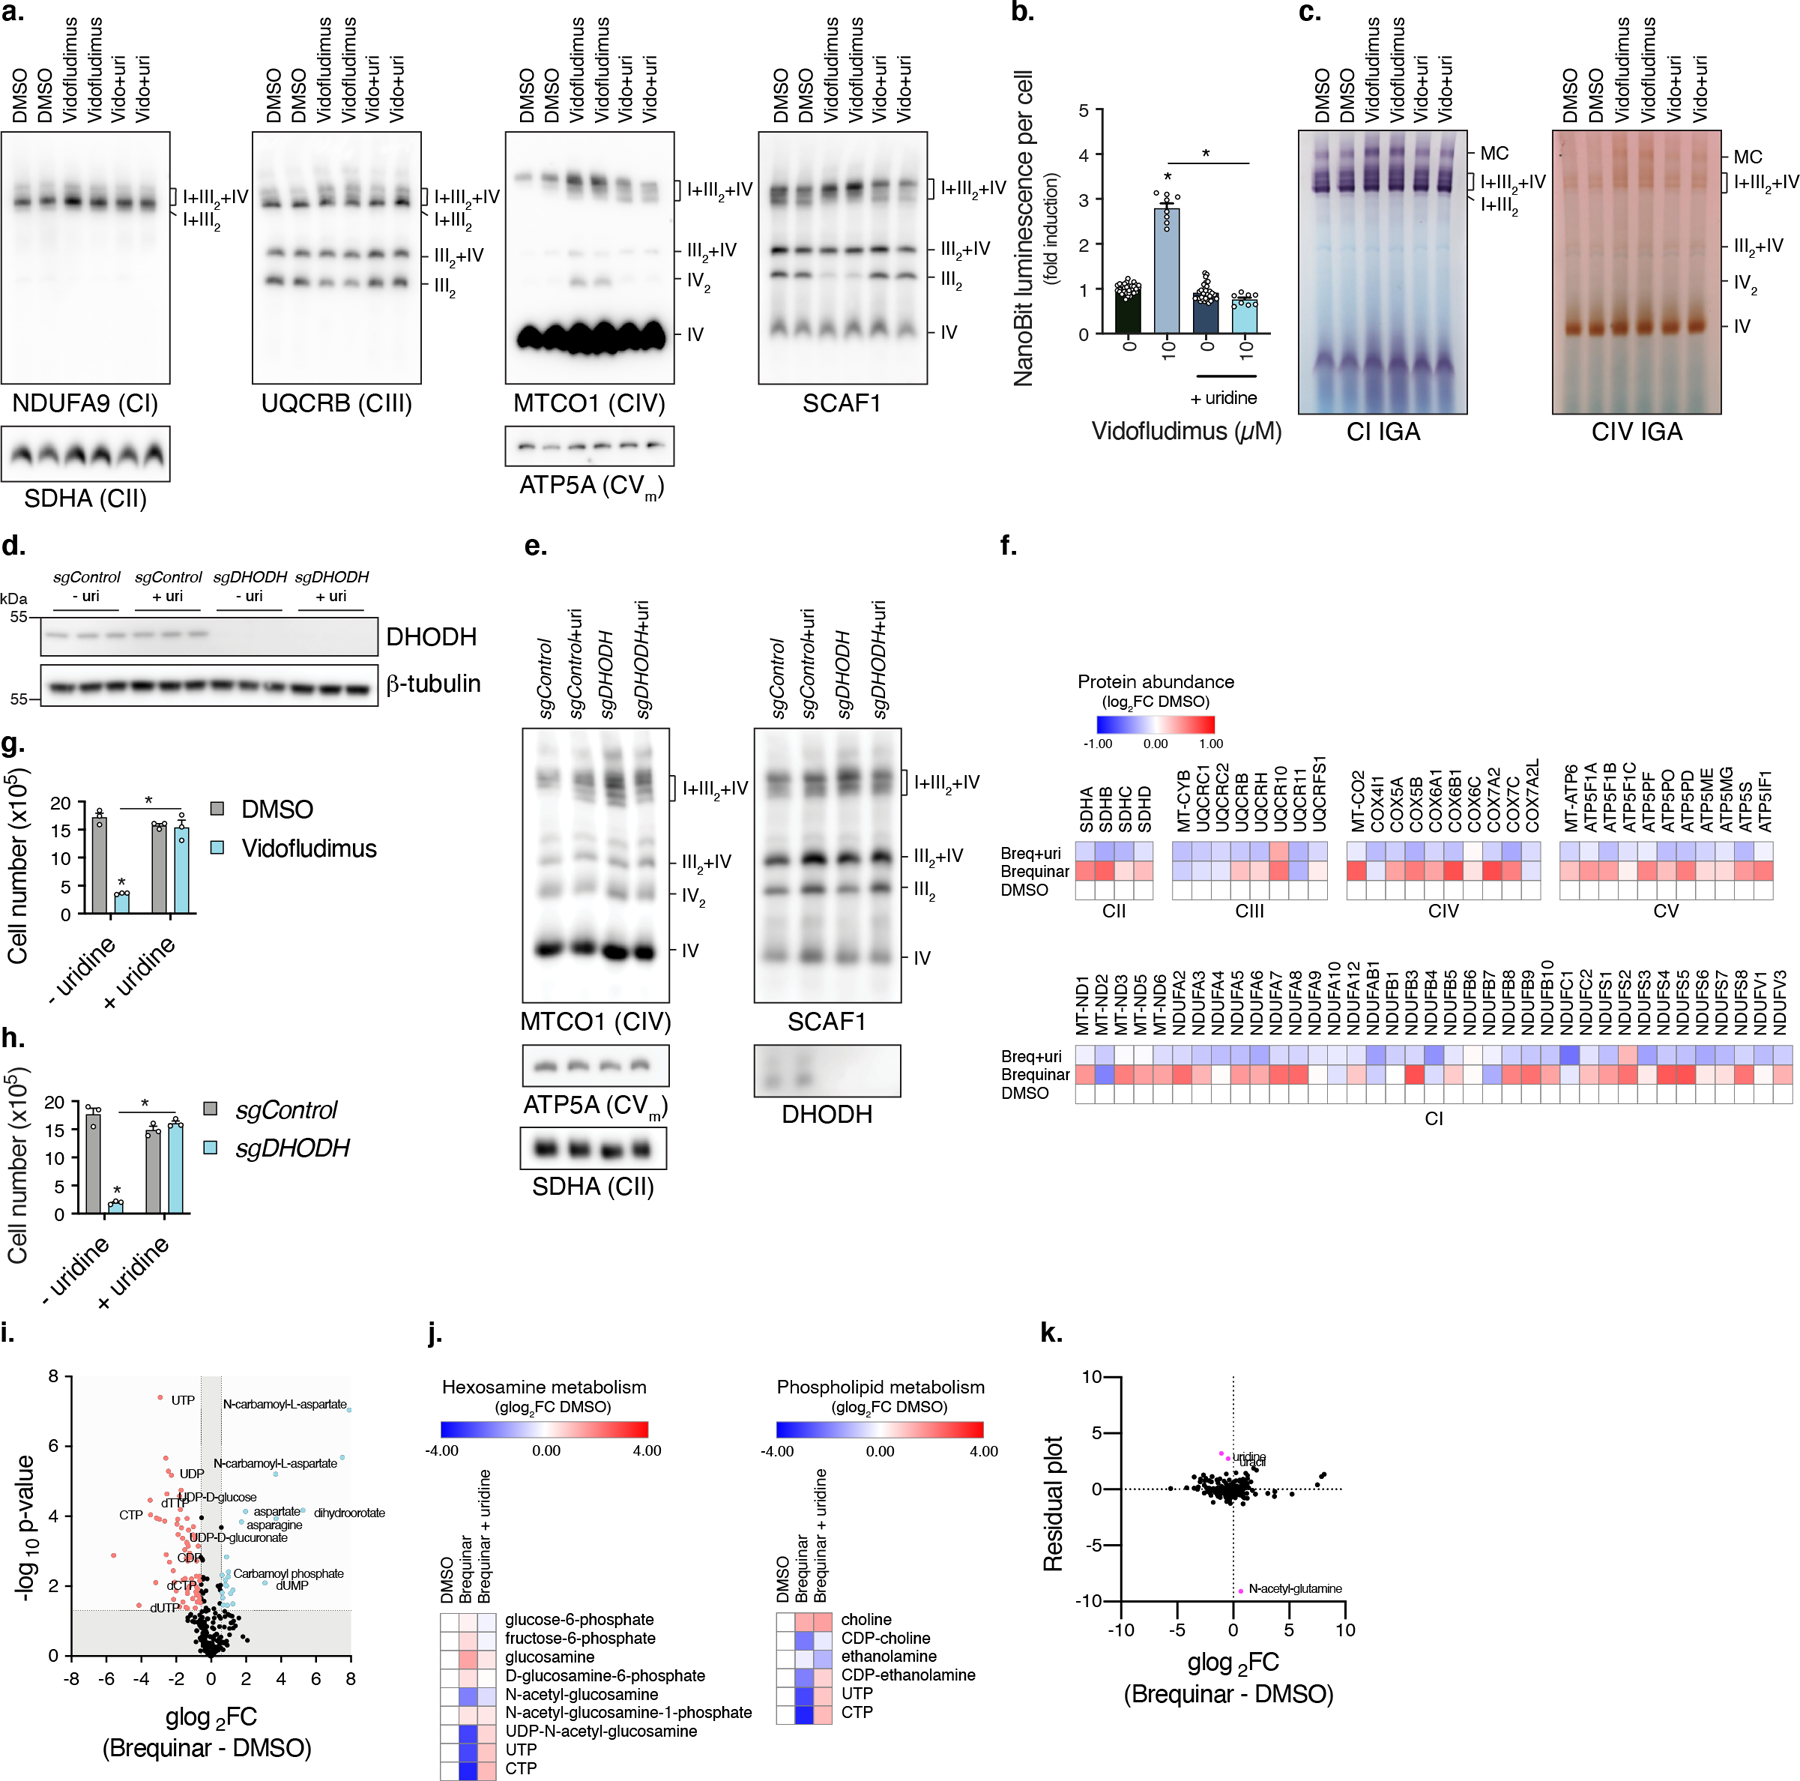
Since pyrimidines inversely correlate with respirasome assembly, we tested if exogenous pyrimidines could rescue SC increases from DHODH inhibition. Uridine, which can be used by the pyrimidine salvage pathway, prevented increases in respirasomes (Fig. 3a-d, Extended Data Fig. 3a,b) and in-gel complex I and IV activities (Fig. 3e, Extended Data Fig. 3c) from Brequinar or Vidofludimus treated cells or DHODH KO cells (Extended Data Fig. 3d,e). SCAF1-associated complex III levels decreased with DHODH inhibition or deletion, concomitant with increased SCAF1-containing respirasomes (Fig. 3a,d, Extended Data Fig. 3a,e). Proteomic studies in Brequinar treated cells also support uridine-dependent respiratory complex stoichiometric remodeling (Extended Data Fig. 3f, Supplementary Data 3). Furthermore, uridine rescued proliferation defects from DHODH inhibition, highlighting the link between pyrimidines, cell growth, and respirasome assembly (Fig. 3f, Extended Data Fig. 3g,h). Metabolomic experiments (Supplementary Data 2) show that along with decreased levels of pyrimidine nucleotides (Extended Data Fig. 3i), DHODH inhibition also decreased UDP-sugars such as UDP-D-glucose, UDP-D-glucuronate, and UDP-N-acetyl-glucosamine, and phospholipid precursors CDP-choline and CDP-ethanolamine (require CTP for synthesis) (Extended Data Fig. 3j). All of these metabolites, among others, were rescued with uridine supplementation, with LFC x LFC scatterplot slope of -0.9324 ± 0.03332 and correlation (R2) of 0.7508 (p<0.0001) (Fig. 3g, Extended Data Fig. 3k). These data suggest that DHODH inhibition promotes respirasome assembly via decreases in metabolites downstream of pyrimidine nucleotides (Fig. 3h).
Fig. 3. DHODH controls respirasome assembly through production of pyrimidine nucleotides.
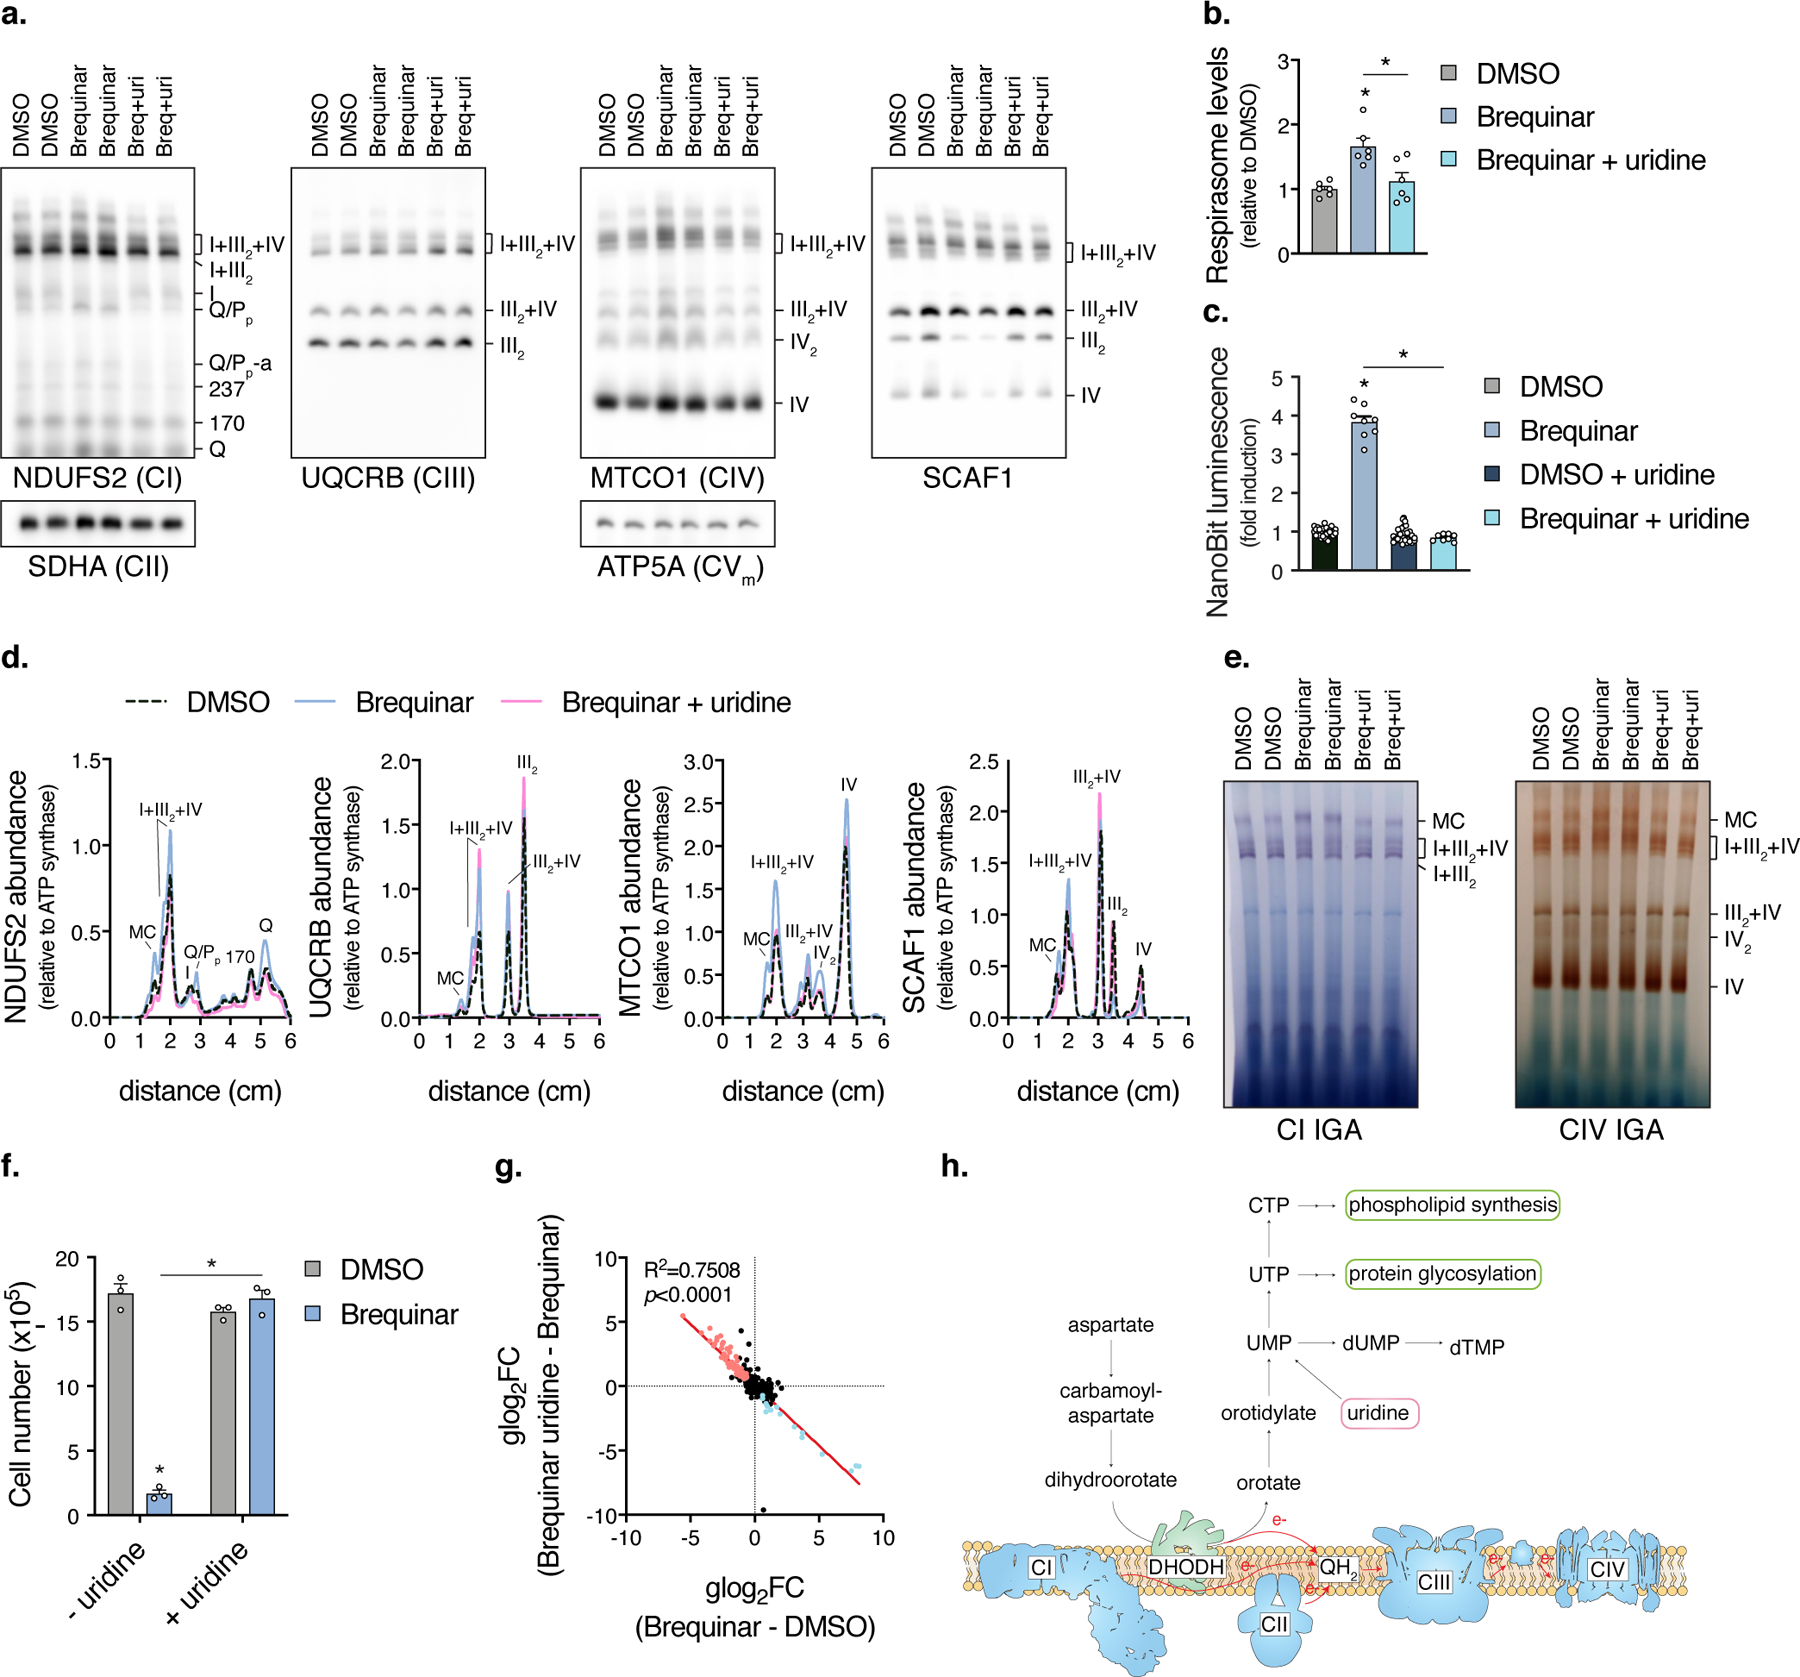
a, BN-PAGE of mitochondrial fractions isolated from cells treated with Brequinar in the presence or absence of uridine (n=6 independent experiments). b, Quantification of respirasome abundance (MTCO1/ATP5A intensity) (n=6 independent experiments, two-sided paired Student’s t-test, * left to right p=0.0034, 0.0079). c, Luminescence of NanoBiT reporter cells treated with Brequinar in the presence or absence of uridine (DMSO, n=32; Brequinar, n=8 biologically independent samples, * q<0.0001). d, Intensity plots of NDUFS2, UQCRB, MTCO1, and SCAF1 from BN-PAGE in A. e, In-gel CI and CIV activities of mitochondrial fractions isolated from Brequinar treated cells (n=2 experiments). f, Number of cells treated with Brequinar for 3 days, initial seed of 1x10⁵ cells (n=3 biologically independent samples, * q<0.0001). g, LFCxLFC dot plot of uridine metabolite normalization. h, Model of DHODH mediated pyrimidine metabolism and connection to the respiratory chain. Respiratory complexes are adapted from 52. Reprinted with permission from AAAS. Unless otherwise indicated, cells were treated with drug for 48 hours, data are presented as mean values +/- s.e.m., Student’s t-test with a two-stage linear step-up procedure of Benjamini, Krieger and Yekutieli, with Q = 5%. Breq (Brequinar) and uri (uridine).
Mitochondrial phospholipids are sensitive to nucleotide levels
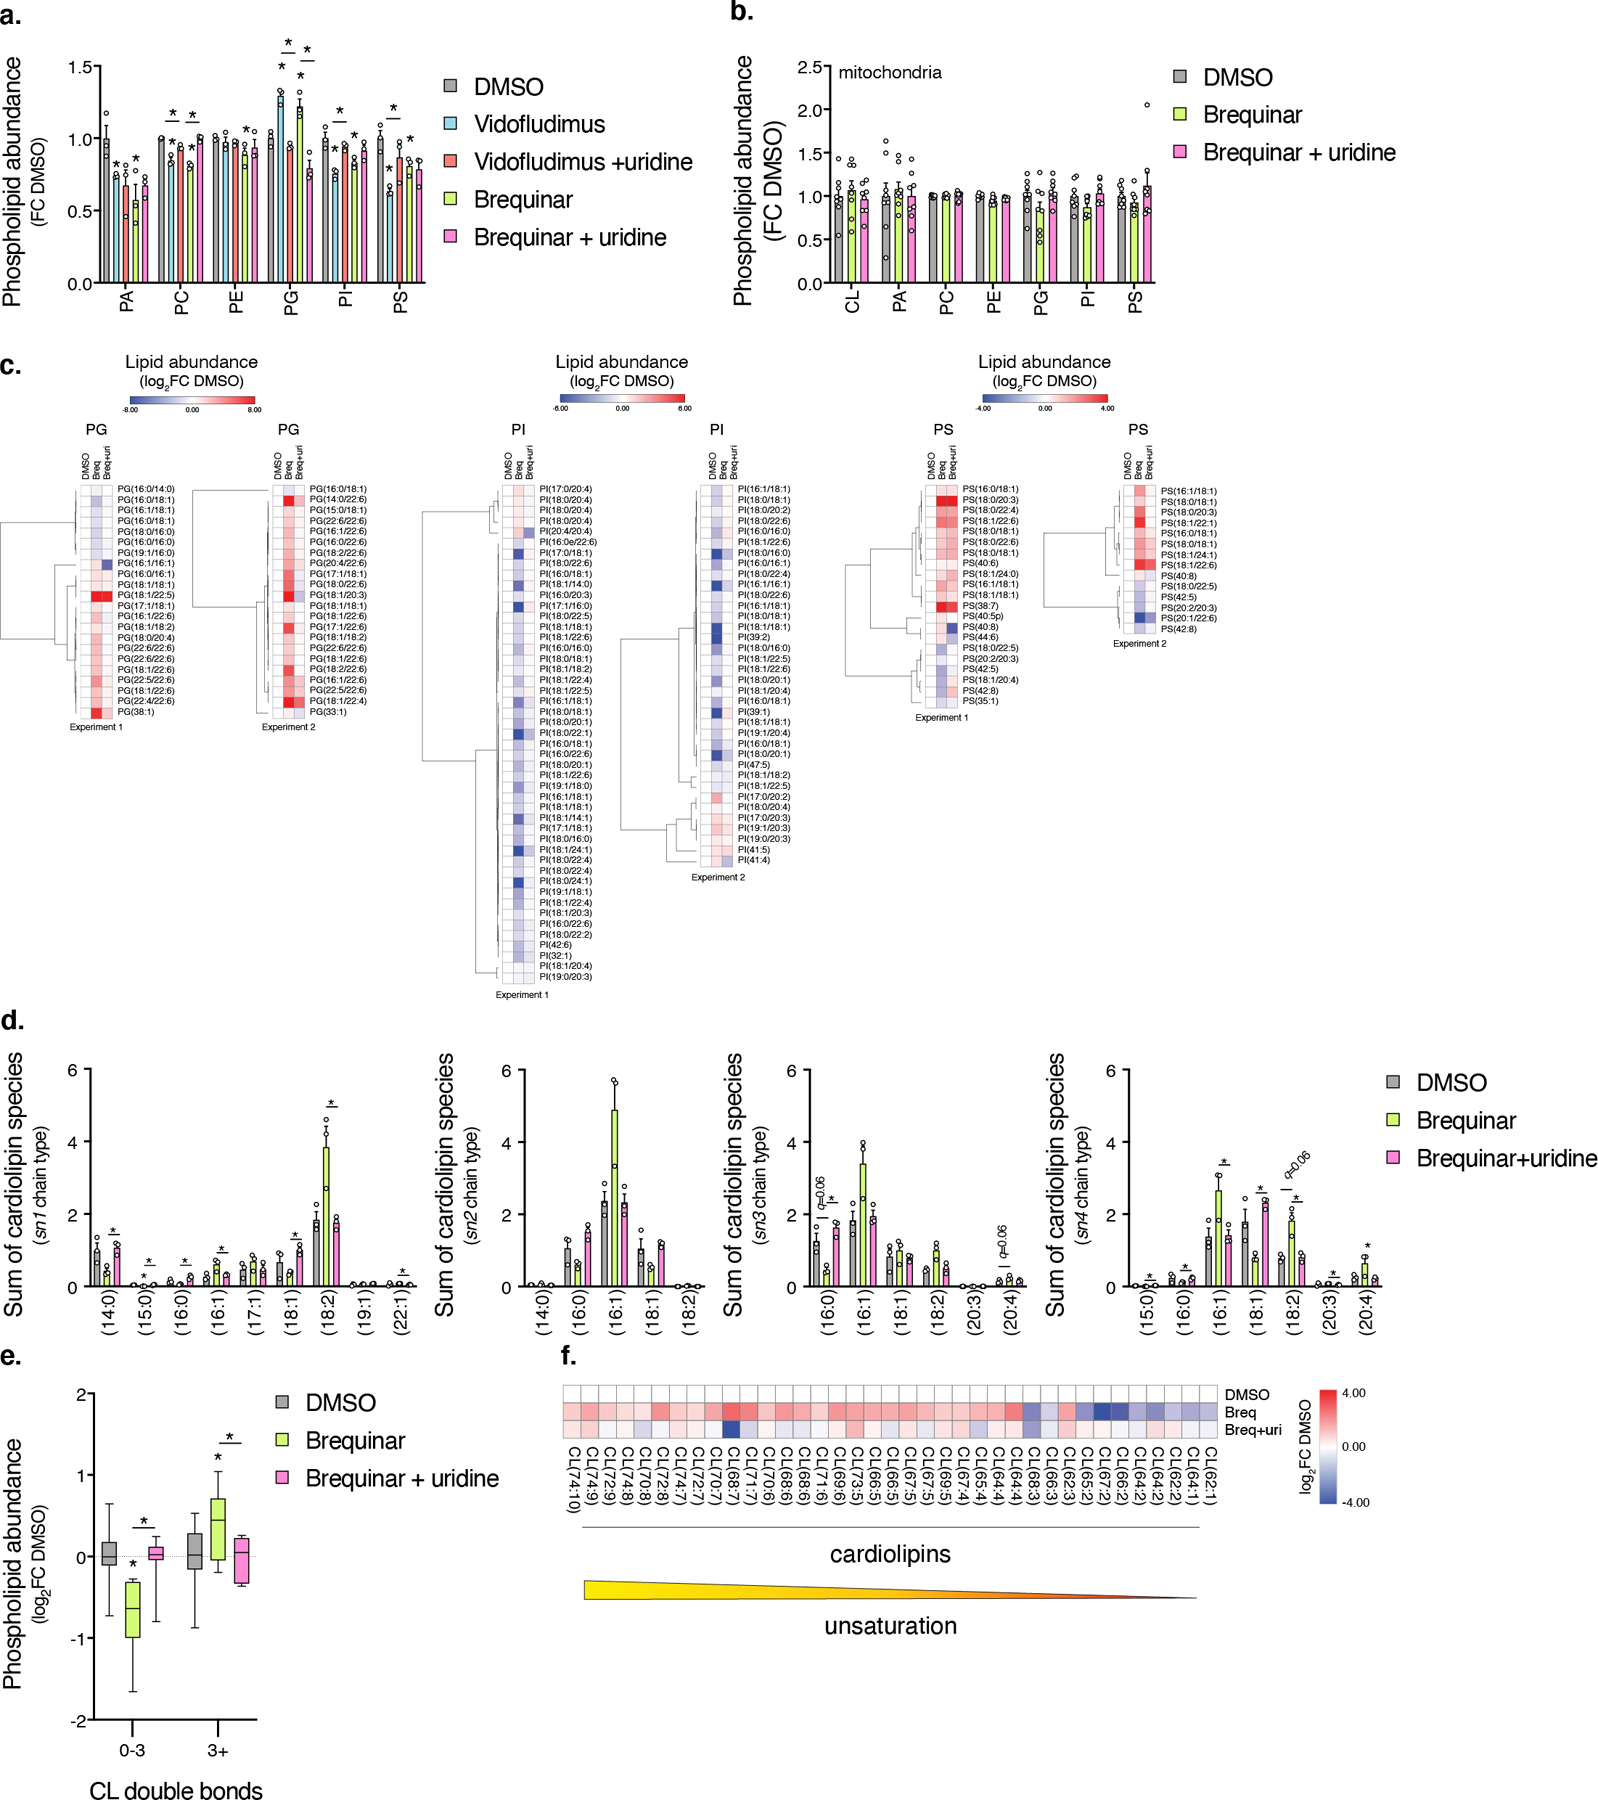
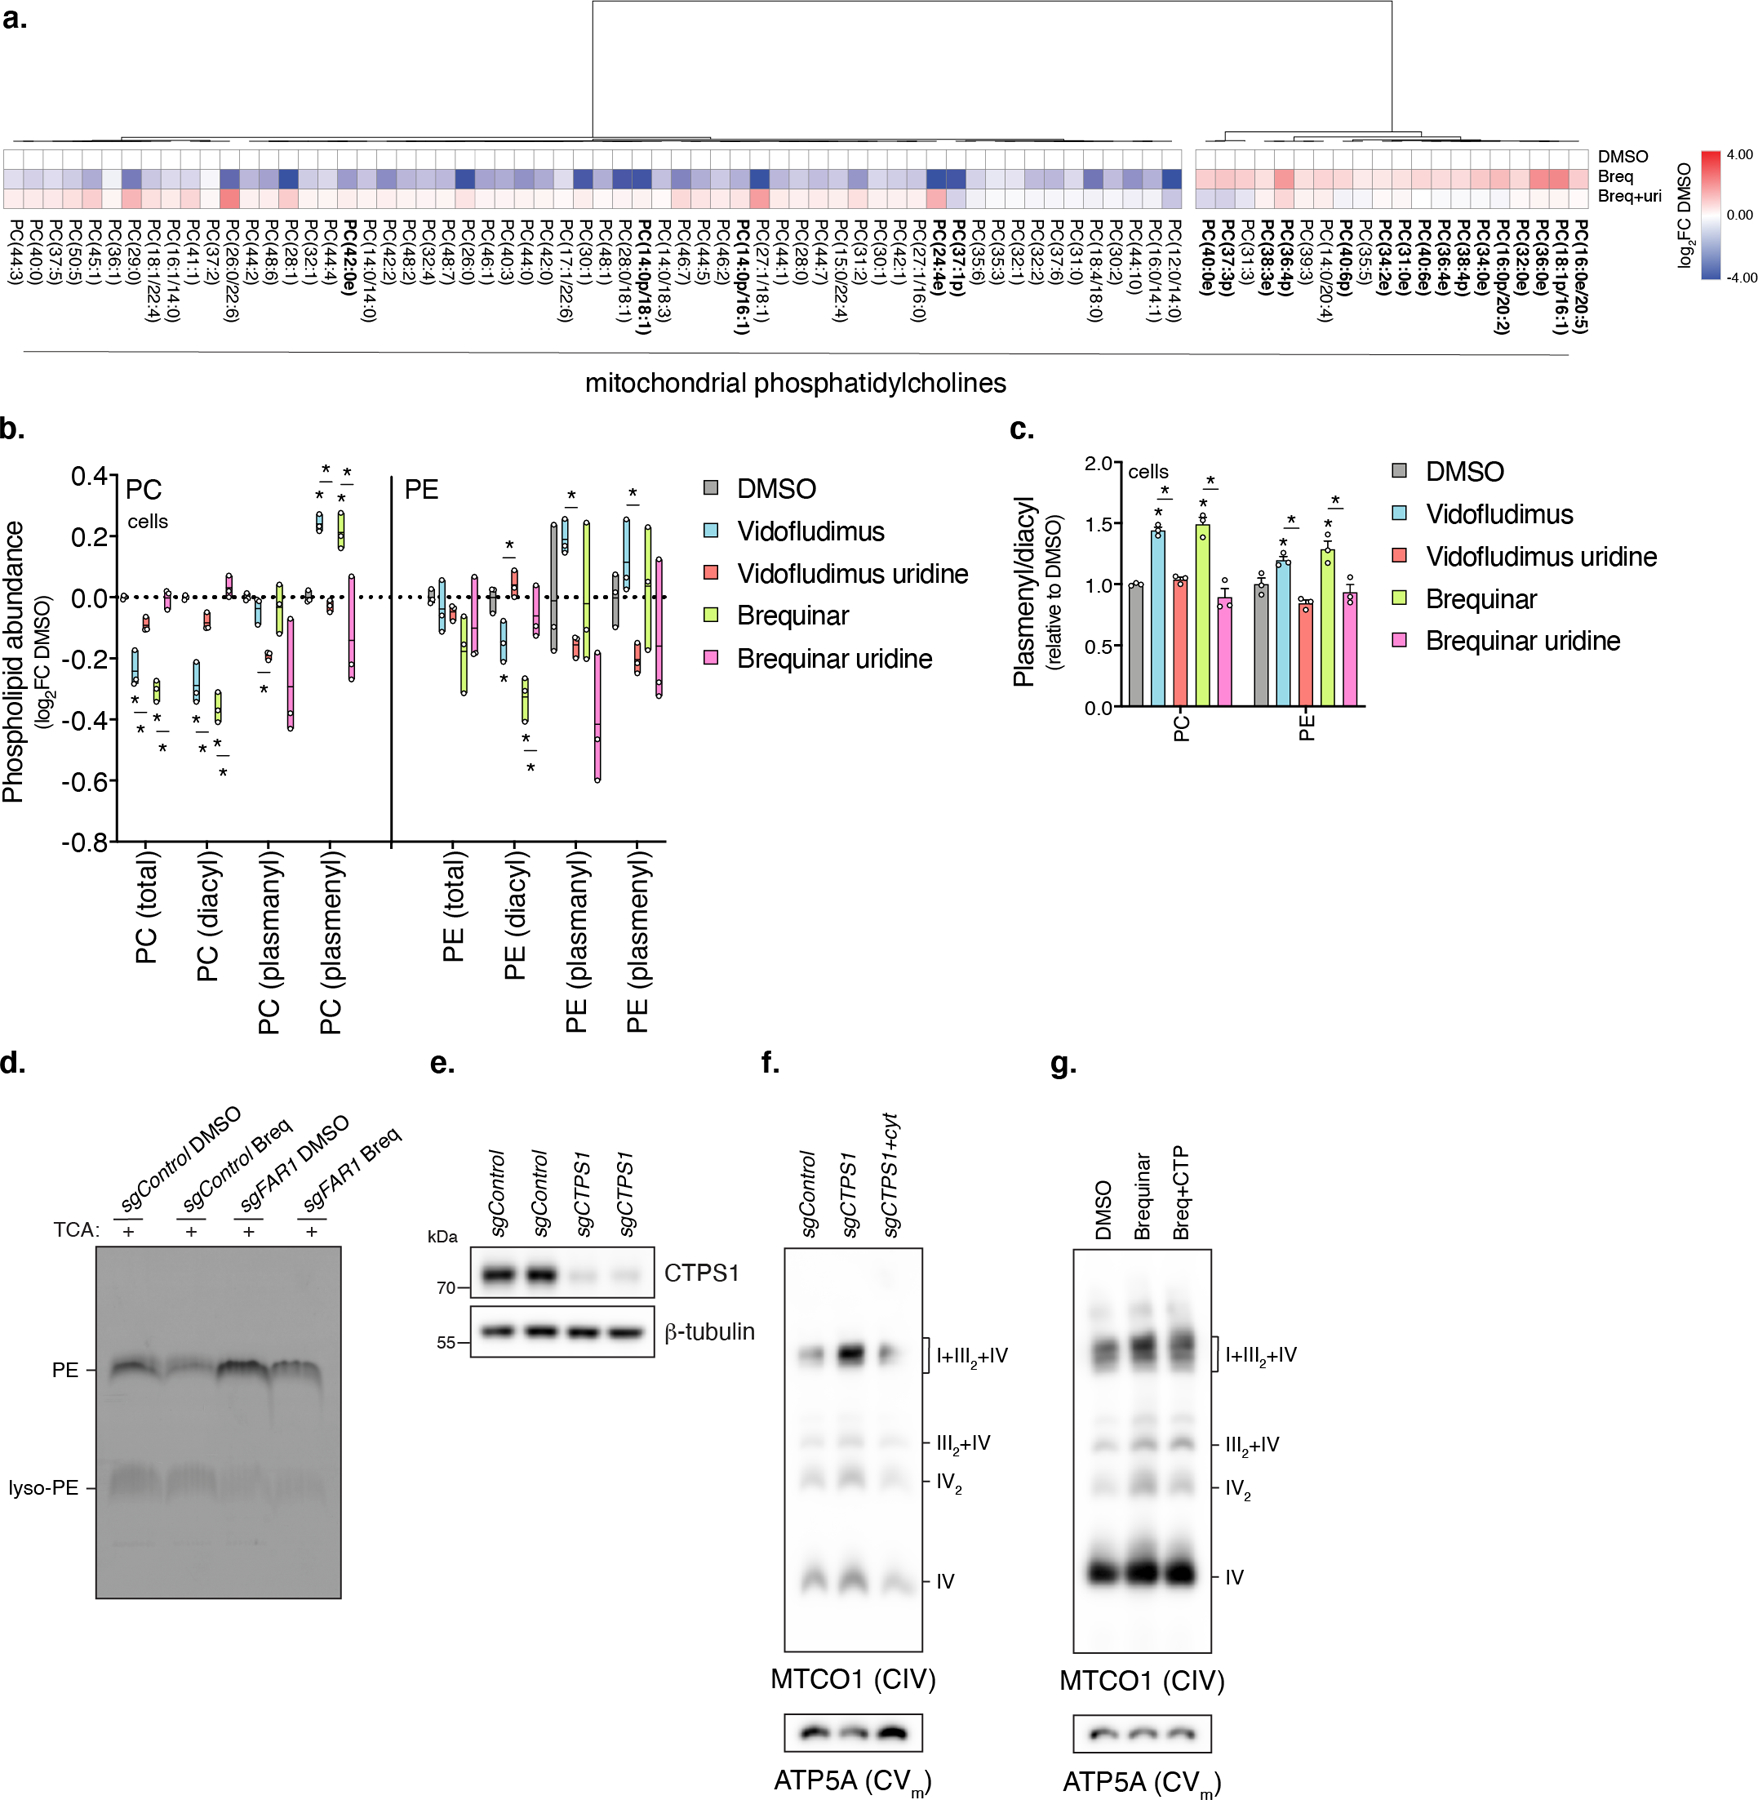
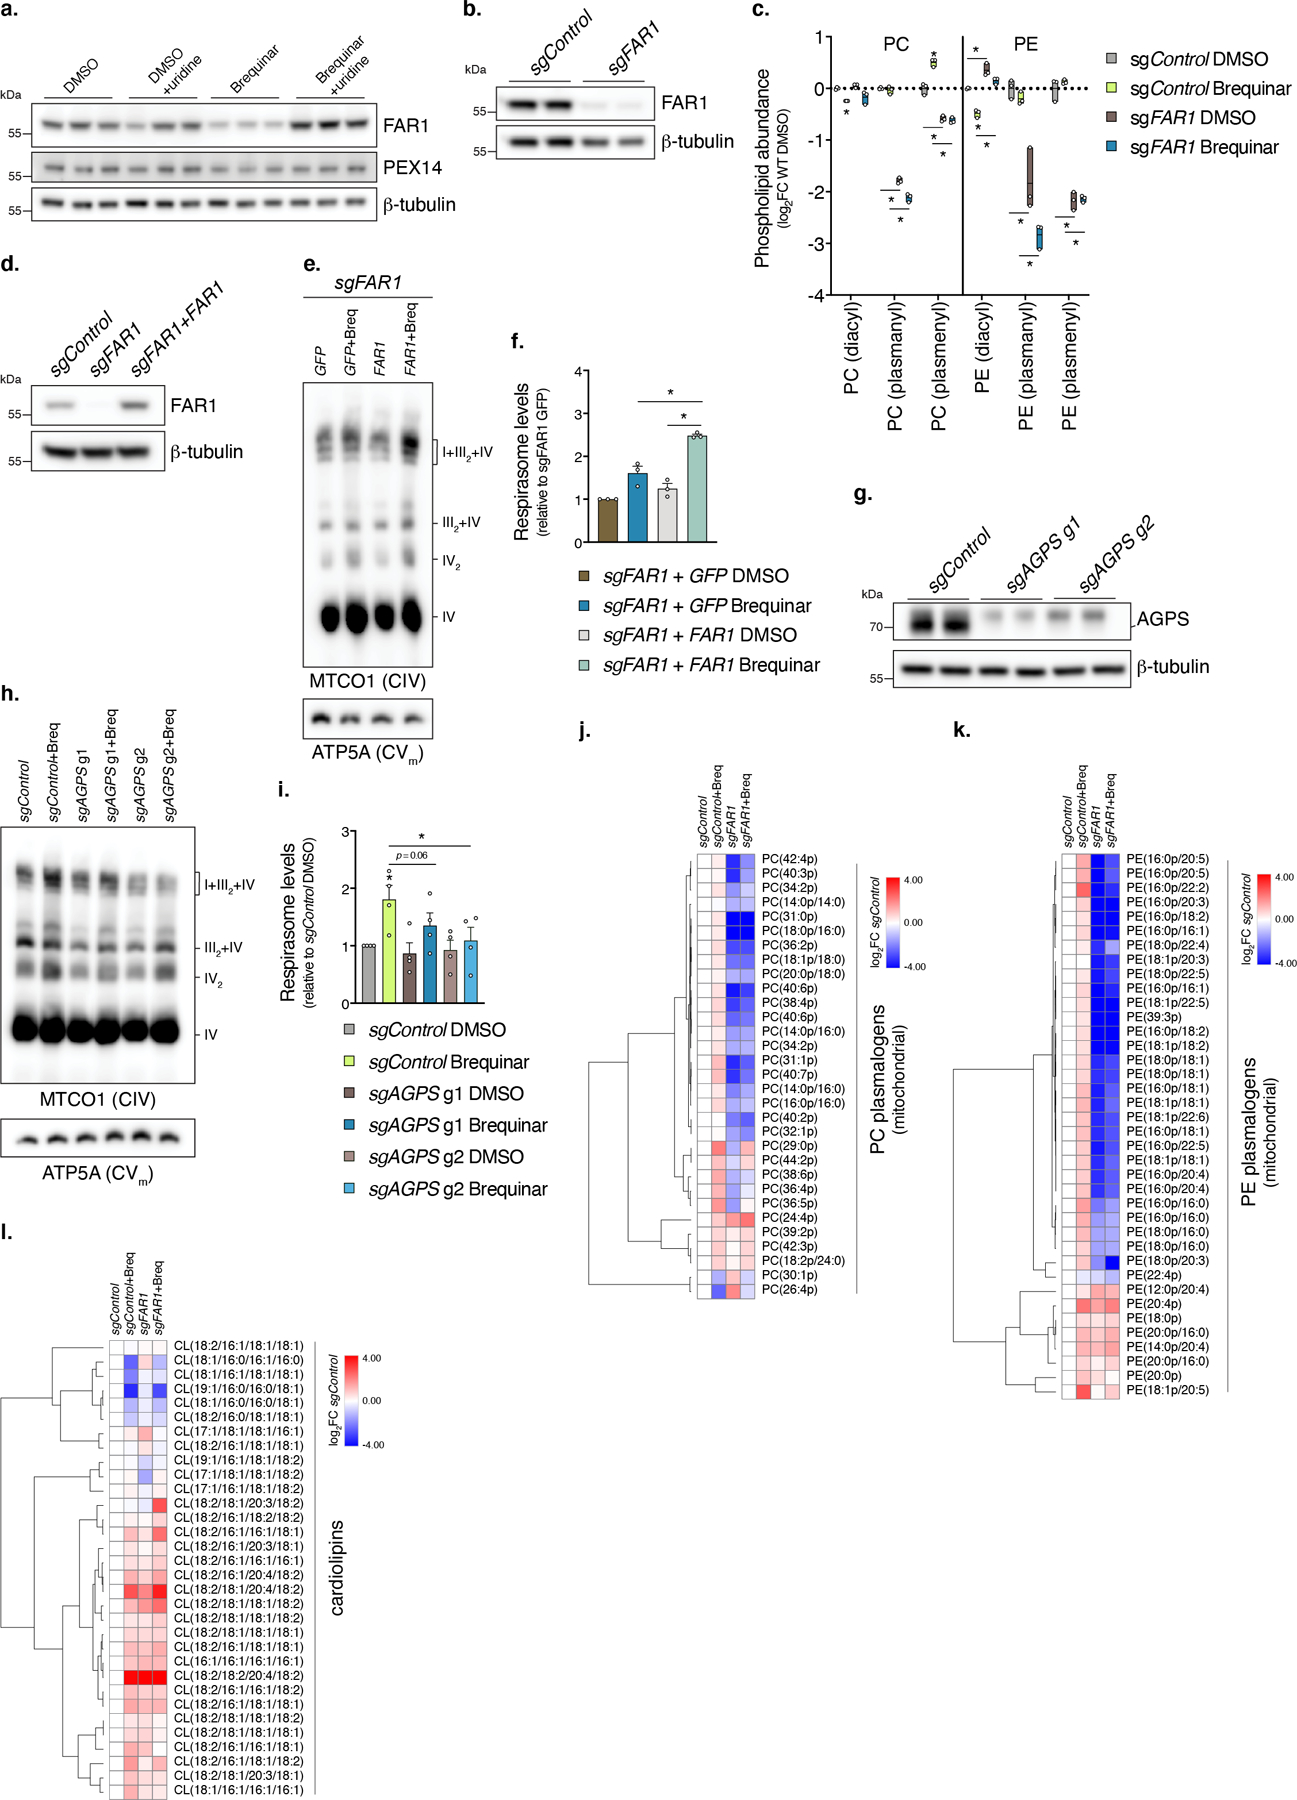
The IMM contains distinct phospholipid compositions that are generated from either ER-derived synthesis of phosphatidic acid (PA), phosphatidylinositol (PI), phosphatidylserine (PS), phosphatidylcholine (PC) or mitochondrial-derived synthesis of PE and CL. Non-bilayer forming phospholipids CL and PE are important for respirasome assembly 25,29,35–37, however, the regulation and particular species composition required are unknown. We analyzed phospholipid levels to determine if cellular depletion of CTP causes differential synthesis through the CDP-DAG (produces PI, phosphatidylglycerol [PG], CL) or Kennedy (produces PC, non-mitochondrial PE, and PS derived from PC/PE) pathways. Using a targeted LC-MS/MS platform 38, we measured phospholipid species within cells treated with Brequinar or Vidofludimus and mitochondria from cells treated with Brequinar, in the presence or absence of uridine (Fig. 4a,b, Supplementary Data 4). Summing classes of phospholipids in cells, we found PC levels reduced and PG levels increased by both DHODH inhibitors and reversed with uridine (Extended Data Fig. 4a). Next, we examined uridine-sensitive phospholipid changes in mitochondria (Extended Data Fig. 4b,c). Brequinar caused a trend towards increased 16:1, 18:2, 20:4 and decreased 14:0, 16:0, 18:1 acyl side chains in CL (Extended Data Fig. 4d), indicating CL remodeling towards more unsaturated or mature CL species (Extended Data Fig. 4e,f). However, the most notable changes were in mitochondrial PC and PE makeup. Brequinar decreased the diacyl and increased the ether lipid subclass of PC and PE in a uridine-dependent manner (Fig. 4c,d, Extended Data Fig. 5a). This phospholipid signature was also present in cellular fractions (Extended Data Fig. 5b,c), indicating a response to maintain total and mitochondrial PC and PE levels with ether lipids when the synthesis of diacyl-PC/PE is compromised as a consequence of CTP depletion. In agreement, 14C-ethanolamine incorporation into ether lipid-PE is increased relative to diacyl-PE in Brequinar treated cells (Extended Data Fig. 5d). Furthermore, specific loss of CTP through CTP Synthase 1 (CTPS1) sgRNA promoted respirasome assembly (Extended Data Fig. 5e,f), while CTP supplementation prevented it in Brequinar treated cells (Extended Data Fig. 5g). These results indicate that DHODH inhibition increases ether lipid subclasses of PC and PE in response to low CTP levels.
Fig. 4. Peroxisomal-derived ether lipids promote respirasome assembly increasing oxygen consumption and cell growth.
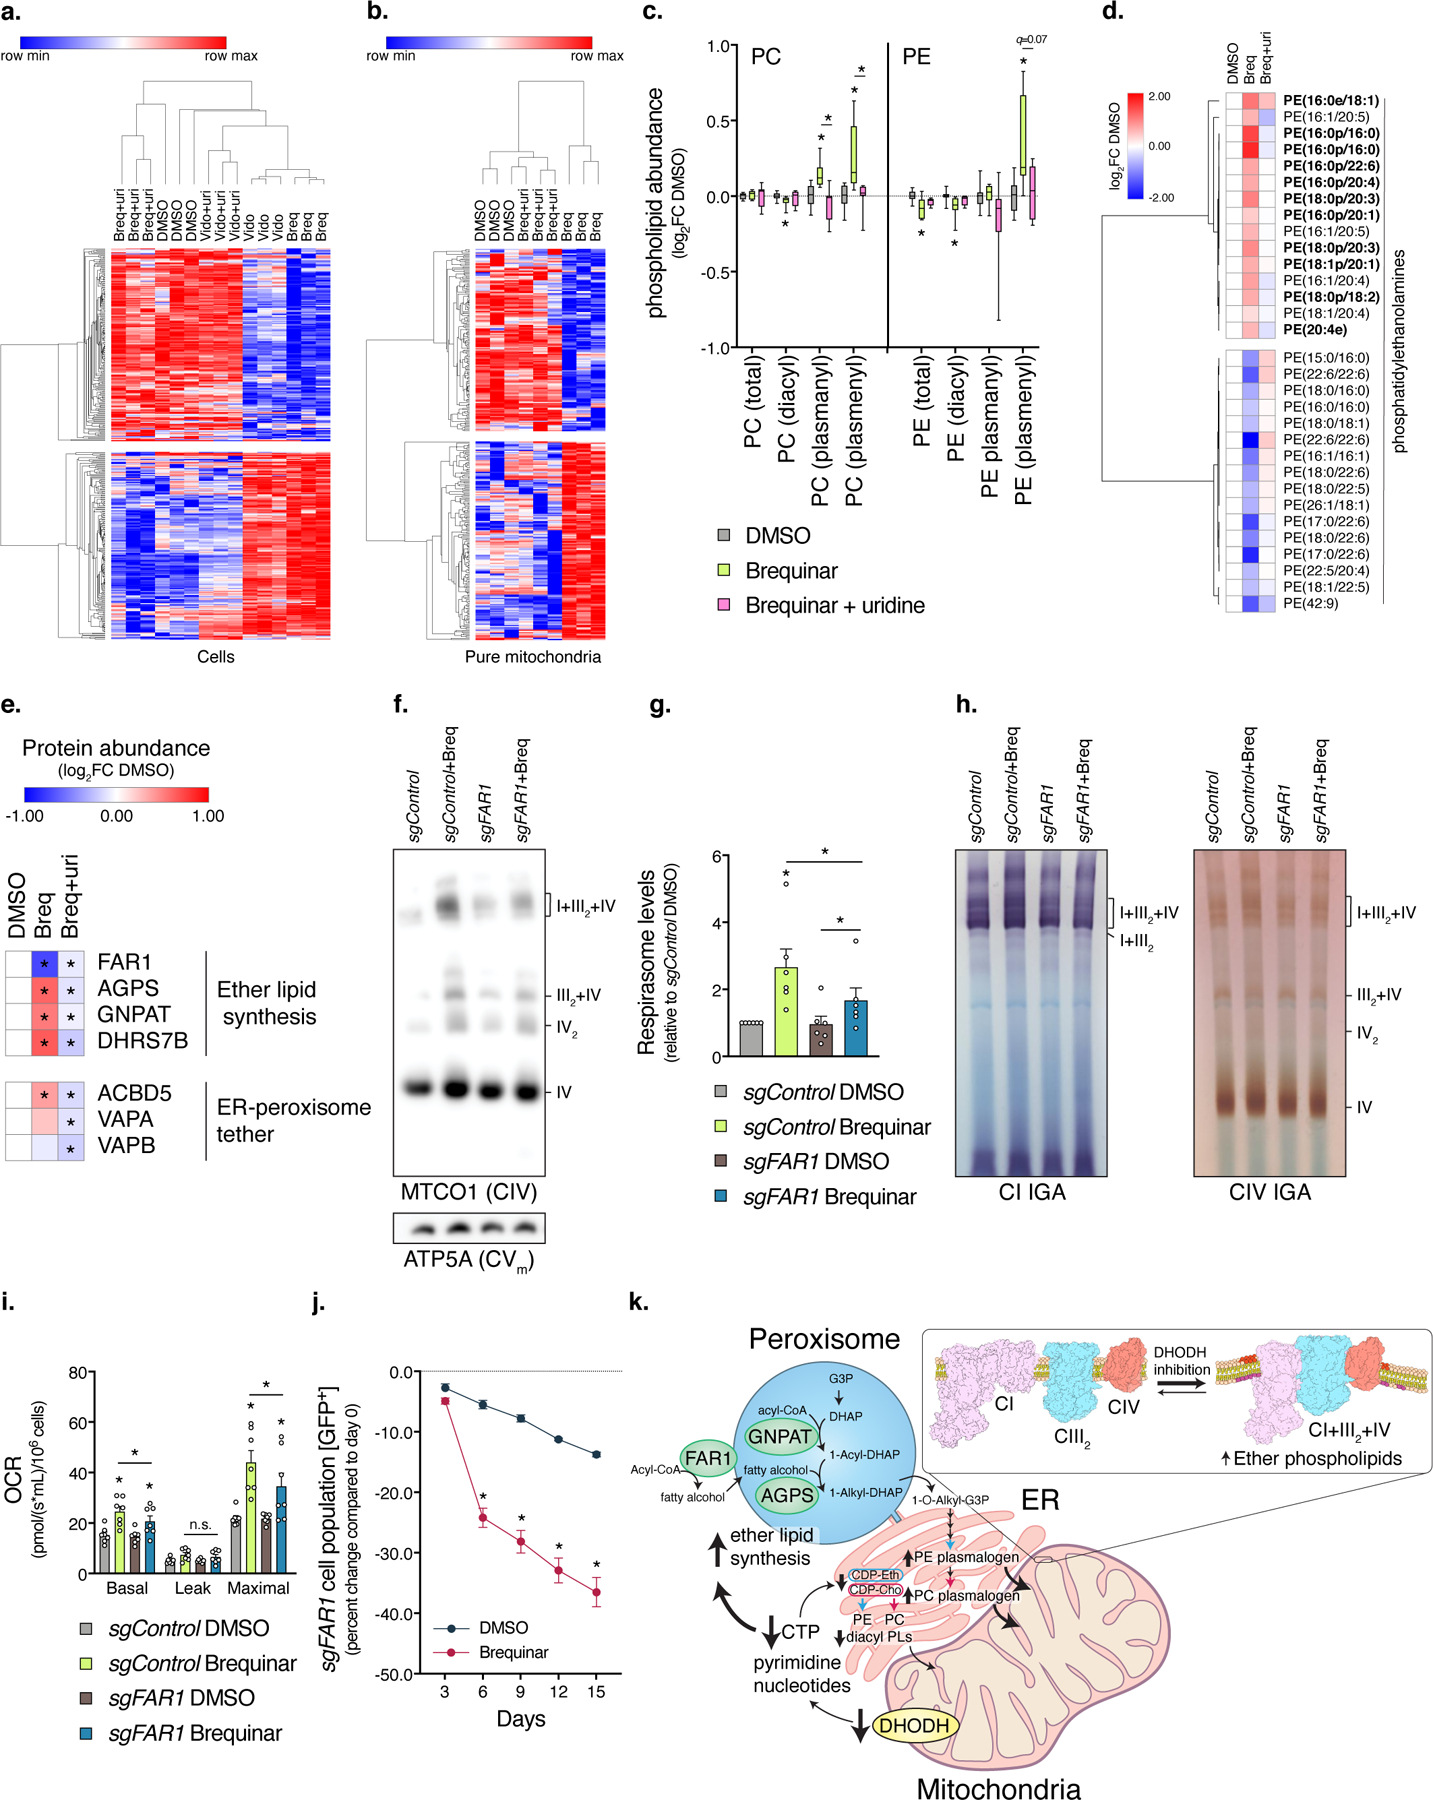
a-b, Heatmaps of lipidomic changes in cells and pure mitochondrial fractions from DHODH inhibitors that are uridine-sensitive (p<0.15, two-sided Student’s t-test). c, Lipidomic analysis of PC and PE subclass abundances in mitochondrial fractions (box and whisker plot, line at median, 5–95% C.I., n=8 biologically independent samples over 2 independent experiments, * left to right q=0.0259, 0.0096, 0.0127, 0.0121, 0.0294, 0.0121, 0.0173, 0.0121). Ether lipid subtypes are denoted plasmanyl and plasmenyl (a.k.a. plasmalogen). d, Heatmap of Brequinar-dependent changes in mitochondrial PE (n=5 biologically independent samples, p<0.05, two-sided Student’s t-test). Bolded are ether lipids. e, Heatmap of protein changes in ether lipid-related enzymes (n=3 biologically independent samples, two-sided Student’s t-test). f, BN-PAGE, g, Quantification of respirasome abundance (n=6 independent experiments, two-sided paired Student’s t-test, * left to right p=0.0277, 0.0025, 0.0124), and h, In-gel activities of mitochondria isolated from sgFAR1 cells treated with Brequinar (n=2 experiments). i, Oxygen consumption rates of sgFAR1 cells treated with Brequinar (n=7 independent experiments, two-sided paired Student’s t-test, * left to right p=0.0010, 0.0207, 0.0083, 0.0022, 0.0221, 0.0350). j, Proliferation enrichment analysis of sgFAR1 cells [GFP+] treated with Brequinar (0.25 µM) (n=9 biologically independent samples over 3 independent experiments, * left to right q=0.0168, <0.0001, <0.0001, <0.0001, <0.0001). k, Model depicting the regulation of mitochondrial phospholipid composition from pyrimidine nucleotides. DHODH inhibition causes CTP depletion, which decreases diacyl phospholipid synthesis at the ER. In response, peroxisomal-derived ether lipids accumulate and are transported to mitochondria. Cells were treated with compound for 48 hours, heatmap row/column groupings are Pearson’s correlations, data are presented as mean values +/- s.e.m., unless otherwise noted Student’s t-test with a two-stage linear step-up procedure of Benjamini, Krieger and Yekutieli, with Q = 5%. Breq (Brequinar) and uri (uridine).
FAR1-derived ether lipids are required for respirasome assembly
Ether lipids are peroxisomal-derived phospholipids with an ether bond at the sn-1 position of the glycerol backbone instead of an ester bond found in diacyl phospholipids altering the biophysical properties of membranes 39,40. FAR1 is the rate limiting enzyme of peroxisomal synthesis of ether lipids, reducing an acyl-CoA to a fatty alcohol that is then used by the enzyme AGPS to generate alkyl-DHAP 39,40. FAR1 protein stability is inversely related to ether lipid abundance 41. In agreement with this (Fig. 4c), FAR1 protein levels were decreased in Brequinar treated cells and normalized with uridine (Fig. 4e, Extended Data Fig. 6a). In addition, several ether lipid synthesis and peroxisomal-ER phospholipid shuttle enzymes accumulate in Brequinar treated cells in a uridine-sensitive manner (Fig. 4e, Supplementary Data 3), consistent with proteomic regulation of synthesis rates. Next, we tested the requirement of ether lipids for respirasome assembly from DHODH inhibition. FAR1 sgRNA cells exhibited decreased levels of PC and PE ether lipids compared to controls (Extended Data Fig. S6b,c, Supplementary Data 5) and blunted the increase in respirasome formation and activity from Brequinar treatment (Fig. 4f-h). CRISPR-resistant FAR1 expression in FAR1 sgRNA cells (Extended Data Fig. 4d, Supplementary Table 1) rescued respirasome levels from DHODH inhibition (Extended Data Fig. 6e,f). Furthermore, AGPS sgRNA cells were also unable to fully induce respirasome levels from DHODH inhibition (Extended Data Fig. 6g-i). To determine if ether lipids are required for respirasome assembly through transacylation reactions with cardiolipin 42, we measured phospholipid species in mitochondria from FAR1 sgRNA cells treated with Brequinar (Extended Data Fig. 6j-l, Supplementary Data 6). Cardiolipin alterations caused by DHODH inhibition did not require ether lipids and were present in ether lipid deficient mitochondria at baseline (Extended Data Fig. 6l). These data show that mitochondrial ether lipids are specifically required for induction of respirasome formation and activity.
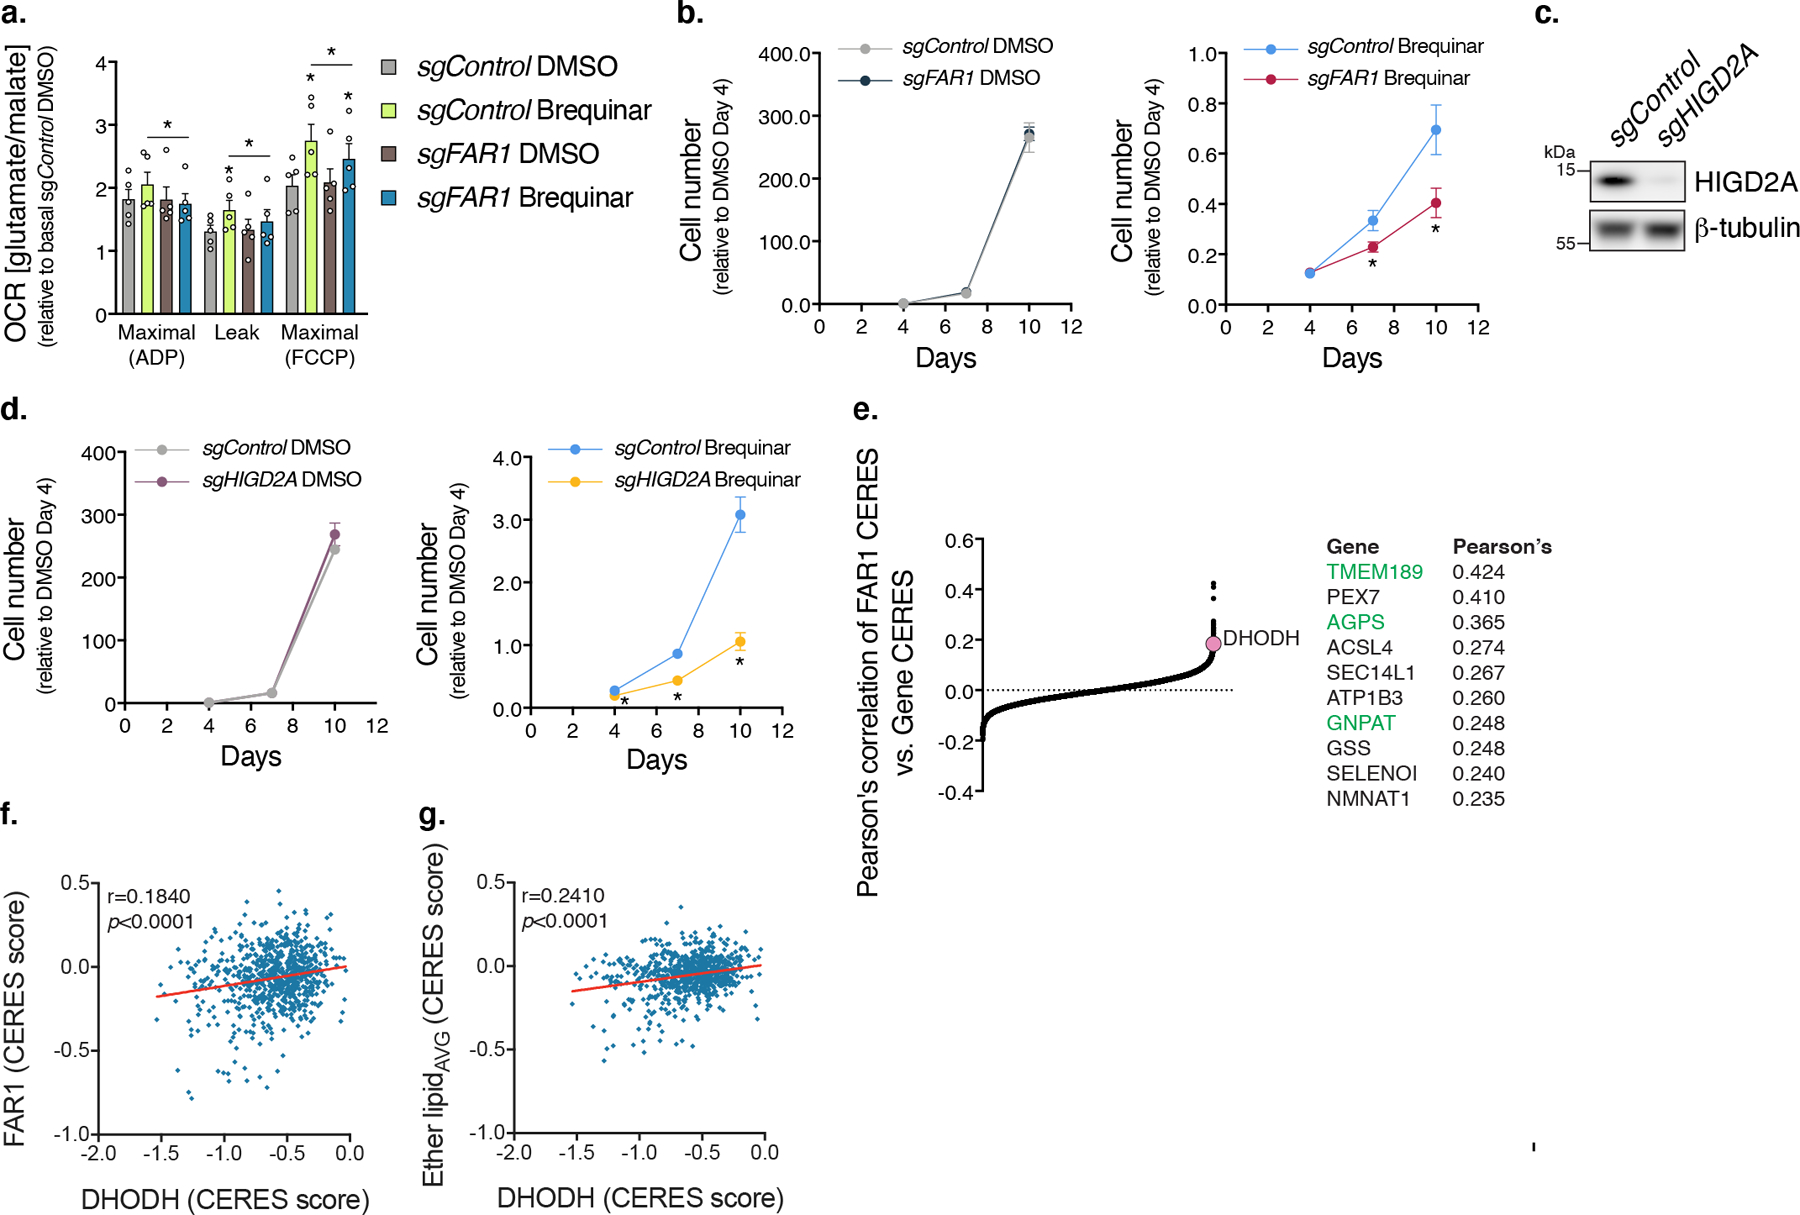
SCs govern proliferation under nucleotide deficiency
The physiological and functional consequence of SCs is not well understood 21,43, but our data indicates SC formation is a compensatory response to reduced nucleotide pools. SC assembly is associated with enhanced respiratory capacity and oxygen consumption rates 11,33. Consistent with these findings, DHODH inhibition increased cellular respiration and mitochondrial complex I-driven respiration, while FAR1 sgRNA partially blunted these effects (Fig. 4i and Extended Data Fig. 7a). Cellular proliferation under pyrimidine deficiency mirrored respiratory capacity, i.e. FAR1 sgRNA cells treated with Brequinar propagated slower than controls (Fig. 4j, Extended Data Fig. 7b). Similarly, loss of complex IV containing SCs with HIGD2A sgRNA caused proliferation defects in the presence of Brequinar (Extended Data Fig. 7c,d). Thus, proliferative capacity under low nucleotide levels requires functional alterations to the mitochondrial respiratory chain and highlights ether lipids as a potential target to sensitize cancer cells to DHODH inhibitors or metabolic conditions associated with nucleotide limitation. Notably, analysis of genetic vulnerabilities co-dependent with FAR1 across cancer cell lines identified other ether lipid synthesis enzymes (TMEM189, AGPS, GNPAT1), peroxisomal genes (PEX7, ACSL4), and DHODH (r=0.1840, p<0.0001) (Extended Data Fig. 7e,f). The correlation between ether lipid synthesis (calculated using mean CERES score of AGPS, FAR1, GNPAT, and TMEM189 for each cell line) and DHODH was even stronger (r=0.2410, p<0.0001) (Extended Data Fig. 7g). From these data, we conclude that respirasome formation and ether lipid synthesis is a compensatory response to low nucleotide levels to increase mitochondrial respiratory capacity and drive cellular proliferation.
Discussion
In these studies, we show that pyrimidine deficiency lowers CTP levels decreasing cellular diacyl-PC and -PE, that in turn augments peroxisomal-derived ether phospholipid synthesis causing respirasome assembly to maintain cell growth (Fig. 4k). This mechanism is evident in multiple cancer cell types, but whether non-differentiated cells behave in a similar manner is unclear. The differential synthesis of these PC and PE subclasses is likely a consequence of regulatory feedback at their initial steps of synthesis occurring at different organelles (Fig. 4k). In part, this relies on the coordinated proteomic regulation of several ether lipid enzymes and trafficking proteins that increase in response to DHODH inhibition. We predict this paired with compromised diacyl phospholipid synthesis through the Kennedy and CDP-DAG pathways under low CTP levels leads to a compensatory accumulation of ether phospholipids. This could be explained by competition at the ER between ether lipid precursor 1–0-alkyl-2-acyl-sn-glycerol and other diacyl glycerols for ethanolamine phosphotransferase (EPT) enzymatic activity 39. Differential affinity of EPT enzymes for particular diacyl glycerol species 44 under low nucleotide conditions and/or a relative buildup of ether lipid precursors could promote EPT activity towards ether lipid synthesis. Interestingly, a similar inverse relationship between ether and diacyl phospholipid abundance has been reported in Barth syndrome cells 45.
There is a marked correlation between mitochondrial SC abundance and phospholipid classes that promote negative curvature in membranes. The depletion of diacyl-PE and compensatory increase in ether lipid-PE with DHODH inhibition would be expected to stimulate negative curvature 45 and potentially SC assembly. Incorporation of ether lipids into membranes increases head group packing, membrane rigidity, and lipid raft domain stability 39,40. Thus, the establishment of lipid microdomains with increased membrane rigidity could promote protein complex interactions between respiratory complexes. However, other aspects of ether lipids aside from membrane properties such as antioxidant or signaling mechanisms could be involved 39,40.
Our studies demonstrate how mitochondrial phospholipid composition shapes functional respiratory complex interactions in response to changes in nucleotide pools. Functionally, increased respirasome assembly elevates oxygen consumption rates to provide cell proliferation advantages when nucleotide pools are limited, either in response to metabolic alterations or drugs targeting nucleotide metabolism. These data are consistent with recent reports that SCs increase respiratory capacity 33,46, efficiency 11–13, and fitness in cells under metabolic stress 12,13,33,47. Along these lines, both SCs and ether lipid synthesis enzymes are independently connected to hypoxia resistance or tumor growth in vivo 47–50, arguing that targeting these processes could complement or synergize with other cancer treatments. In addition, cells that maintain high levels of ether lipids are sensitive to ferroptosis 51, suggesting that compensatory ether lipid accumulation could be an exploited vulnerability for cancers treated with DHODH or other nucleotide synthesis enzymes inhibitors. Thus, our studies have implications for tumor progression and resistance to drug-targeted therapies.
Methods:
Cell culture.
All cell lines were grown in DMEM high glucose (HyClone) supplemented with 10% FBS, 1% P/S, 1 mM pyruvate, and 25 mM HEPES at 37oC with 5% CO2. Where noted, cells were also supplemented with 50 µg/ml uridine. For glucose deprivation experiments, cells were grown in 0 mM glucose DMEM supplemented with 10 mM galactose and the additives mentioned above. In SC induction experiments, galactose media was supplemented with 1 mM glucosamine to maintain cell viability. U2OS/control cybrids were obtained from Rutger Vogel and Jan Smeitink Radbound University Medical Centre, Netherlands. Several CRISPR loss-of function and overexpression cell lines were created for this study. Lentiviral constructs were transfected into 293Ts using PolyFect transfection reagent according to manufacturer’s instructions. Viral supernatants were filtered using a 0.45 µM filter and directly added to cells supplemented with polybrene at 10 µg/ml. Expression constructs were selected in cells using the appropriate antibiotic for a minimum of 7 days before experiments were performed. Sequences for constructs and CRISPR/Cas9 guides cloned into the lentiCRISPR v2 vectors (Addgene, #52961, 98291) are present in Supplementary Table 1. In this study, the following inhibitors were used: Vidofludimus (Thermo Fisher Scientific, 501364571), Brequinar (Sigma Aldrich, SML0113), CB-839 (Cayman Chemical, 22038), Methotrexate (Selleck, S1210), PUGNAc (Sigma Aldrich, A7229), Chloramphenicol (Santa Cruz Biotechnology, sc-227591), Tunicamycin (Sigma Aldrich, T7765), Genistein (Selleck, S1342), Entinostat (Selleck, S1053), OTX015 (Selleck, S7360), and PP-1 (Selleck, S7060).
Protein structure analyses.
Molecular graphics and analyses of respirasome Cryo-EM structures 4–7 were performed with UCSF Chimera 53, developed by the Resource for Biocomputing, Visualization, and Informatics at the University of California, San Francisco, with support from NIH P41-GM103311.
Plasmid construction and cloning.
In order to tag mitochondrial subunits (IDH2, UQCRB, UQCRC1, COX5B, and COX7A2L) with Venus or NanoLuc fragments, gene blocks were designed with gateway recombination cloning overhangs. The split Venus and NanoBiT sequences used in this study were adapted from by Ohashi et al. 32 and Promega, respectively. IDT gBlocks were ligated into pDONR221 using Gateway BP Clonase II and subsequently shuttled into lentiviral expression vectors pLX301 (Addgene, #25895) and pLX304 (Addgene, #25890) using Gateway LR Clonase II according to manufacturer’s instructions. BiFC and NanoBiT construct pairs were sequentially transduced in U2OS cell lines to maximize transduction efficiency of both constructs. For CRISPR cloning, primer sequences were annealed and modified using T4 Polynucleotide Kinase (NEB), diluted, and ligated into lentiCRISPR v2 using Quick Ligase (NEB), following previous protocols 54. For FAR1 overexpression, we used the lentiviral plasmid pLV[Exp]-Bsd-CMV>FAR1 (VB191206–1681rzb, VectorBuilder). Sequences for BiFC/NanoBiT constructs and CRISPR/Cas9 guides cloned into the lentiCRISPR v2 (puromycin, hygromycin selection) vectors are present in Supplementary Table 1.
Fluorescence microscopy.
Cells were seeded into glass coverslip-bottomed wells and incubated at 37oC, 5% CO2 the day before imaging. Images were acquired using a Plan Apo 20x 0.75 NA or a 40X Plan Fluor 1.3 NA objective lens on the inverted Nikon Ti2 fluorescence microscope, NIS-Elements v 5.02 software, a Lumencor Spectra X light engine, and a Hamamatsu Flash 4.0 V2+ sCMOS camera at the Nikon Imaging Center at Harvard Medical School. For Venus imaging, excitation and emission filter sets were Chroma ET500/20x and ET535/30m, respectively. For MitoTracker Deep Red FM (ThermoFisher Scientific) imaging, excitation and emission filter sets were Chroma ET640/30x and Semrock FF01–698/70 respectively.
High-throughput chemical screens.
Cells resuspended in DMEM high glucose (HyClone) supplemented with 10% FBS, 1% P/S, and 1 mM pyruvate were seeded into 384-well plates (Corning, 3765) at a density of 1,000 cells/well in 30 µl. Compounds dissolved in DMSO were pin replicated (33 nl) into 384-well plates containing seeded cells and incubated at 37oC with 5% CO2 for two days. On the day of analysis, 10 µl of Hoescht solution dissolved in PBS was added to each well (5 µg/ml final) and incubated at room temperature for 30 minutes. Hoescht imaging and cell counting was performed using the TTPLabTech Acumen eX3/HCI. Next, 20 µl of NanoGlo solution was added to each well and incubated on a shaker for 10 minutes. A white plate seal (Sigma Aldrich, Z732117) was attached to the bottom of each plate and luminescence was measured twice/well using Perkin Elmer EnVision plate reader. The following libraries were used in this screen: the ICCB-Longwood Mechanism of Action Library (ICCB-L MoA) (880 compounds x 4 concentrations), NIH Library of Integrated Network-based Cellular Signatures (LINCS) 1 - Kinase Inhibitors Library (88 x 4 concentrations), and Cayman Biolipid 1 (831 compounds).
Oxygen consumption measurements.
To measure oxygen consumption in intact cells, 1.0×10⁵ cells were seeded in an XFE-24 Seahorse plate (Seahorse Biosciences, 102340–100) and allowed to adhere 8 hours (same day assay) or 18 hours (overnight) at 37°C with 5% CO2. DMEM media was then removed and cells were washed twice with pre-warmed unbuffered DMEM supplemented with 25 mM glucose, 1 mM sodium pyruvate, and 4 mM glutamine. After washing, 500 µl of identical buffer was added and the cells were then placed in a CO2 free incubator for 1 hour. The Seahorse 24 optical fluorescent analyzer cartridge was prepared by adding 4 μM oligomycin, 4 μM FCCP, and 1.5 μM rotenone/4 μM antimycin A to cartridge ports A, B, and C, respectively. Oxygen consumption rates (pmol/min) were measured for each treatment condition at 37oC using the Seahorse Bioanalyzer instrument with the following protocol: Mix: 1 min, Wait: 3 min, Measure: 3 min. After measurement, cells were washed with PBS and 50 μl RIPA buffer was added to each well to calculate protein concentrations using the BCA assay (Pierce, 23228).
We also performed oxygen consumption measurements in Brequinar treated cells or mitochondria using the Oroboros O2K system. Respiration in cells was measured in DMEM supplemented with 1% P/S, 1 mM pyruvate, 25 mM glucose, 4 mM glutamine, and 25 mM HEPES in technical duplicate for each experiment. Injections were 5 μM oligomycin, 0.5 μM FCCP, and 1 μM rotenone/4 μM antimycin. Mitochondria were isolated in MSHE buffer (210 mM mannitol, 70 mM sucrose, 5 mM HEPES, 1 mM EGTA, 0.5% BSA) and resuspended at 400 μg/2 ml in MAS buffer (220 mM mannitol, 70 mM sucrose, 10 mM KH2PO4, 5 mM MgCl2, 2 mM HEPES, 1 mM EGTA, 0.1% BSA) for oxygen consumption measurements. Injections consisted of 5 mM glutamate/3 mM malate for basal respiration, 1 mM ADP for maximal respiration, 1 μM oligomycin, and 1 μM FCCP for maximal uncoupled respiration. Respiration rates for isolated mitochondria experiments were normalized to citrate synthase activity 55.
Mitochondrial isolations and solubilizations.
Frozen cell pellets were thawed on ice in hypotonic buffer (83 mM sucrose, 10 mM MOPS, 1X cOmplete EDTA-free Protease Inhibitor Cocktail (Roche, 4693159001)) and subsequently homogenized using a dounce homogenizer. After this, osmolarity was normalized using hypertonic sucrose buffer and the resulting solution was centrifuged at 1000xg for 5 minutes. The supernatant was then centrifuged for a second time to remove cell debris. Next, the supernatant containing mitochondria was centrifuged at 9,000xg for 10 minutes. The mitochondrial pellet was resuspended and washed twice in resuspension buffer (320 mM sucrose, 1mM EDTA, 10 mM Tris pH 7.4, 1X protease inhibitor cocktail (Roche, 4693159001)). Protein content of each mitochondrial prep is then quantified. Mitochondria are then divided into 100–200 μg aliquots and flash frozen as pellets. Before running BN-PAGE, mitochondria are solubilized in NativePAGE 4x Sample Buffer (ThermoFisher Scientific, BN2003) at a 6g/g digitonin/protein ratio for 20 minutes on ice. The insoluble portion is then removed by centrifugation for 15 minutes at max speed. The soluble supernatant is then mixed with Coomassie G-250 (ThermoFisher Scientific, BN2004) prior to BN-PAGE.
Western blot analysis.
For SDS-PAGE analysis, cells were harvested in RIPA buffer (10 mM Tris-HCl pH 8.0, 1 mM EDTA, 1% Triton X-100, 0.1% Sodium Deoxycholate, 0.1% SDS, 140 mM NaCl, 1X protease inhibitor cocktail, 1mM PMSF) and protein concentrations were quantified using the BCA assay (Pierce, 23228). BN-PAGE analysis of 6 g/g digitonin/protein solubilized mitochondrial preparations was performed using 3–12% NativePAGE gels (ThermoFisher Scientific, BN1003BOX) according to manufacturer’s instructions. 20 µg of protein was run per well. BN-PAGE buffers included NativePAGE Running Buffer (20X) (ThermoFisher Scientific, BN2001) and NativePAGE Cathode Buffer Additive (20X) (ThermoFisher Scientific, BN2002). After electrophoresis, proteins and/or complexes were transferred to PVDF membranes and sequentially probed with specific antibodies. The following antibodies were used for western blot analysis: anti-SDHA (Abcam, ab14715, 1:3000), anti-ATP Synthase alpha (Life Technologies, 459240, 1:1000), anti-MTCO1 (Abcam, ab14705, 1:3000), anti-NDUFA9 (Abcam, ab14713, 1:1000), anti-NDUFS2 (Abcam, ab192022, 1:2000), anti-UQCRB (Proteintech, 10756–1-AP, 1:1000), anti-COX7A2L/SCAF1 (STJ110597, 1:1000), anti-FAR1 (ThermoFisher Scientific, PA553585, 1:1000), anti-AGPS (Santa Cruz Biotechnology, SC-374201, 1:1000), anti-HIGD2A (Santa Cruz Biotechnology, SC-390505, 1:1000), anti-DHODH (Cell Signaling, 166348, 1:1000), anti-CTPS1 (Cell Signaling, 98287S, 1:1000), anti-PEX14 (Proteintech, 10594–1-AP, 1:1000) and anti-β-Tubulin (Cell Signaling, 2146, 1:5000). Images were acquired with autoradiography film and Amersham AI600/AI680 from GE Healthcare Life Sciences.
In-gel complex activity.
In-gel complex I and IV activity assays were performed on gels subjected to BN-PAGE. Gels were briefly washed in distilled H2O to remove background Coomassie staining. In-gel complex I activity was performed in 2 mM Tris-HCl pH 7.4 supplemented with (i) 0.1 mg/ml NADH (ii) 2.5 mg/ml Nitrotetrazolium Blue chloride, whereas complex IV activity buffer consisted of 10 ml of 50 mM phosphate buffer pH 7.4 supplemented with (i) 5 mg Diaminobenzidine (DAB) (ii) 10 mg cytochrome c. Gels were incubated at room temperature or overnight at 4°C until sufficient signal was acquired.
Metabolomics.
1.0x10⁵ U2OS cells were seeded in each well of a 6-well plate and cultured in glucose medium for 24h. Following propagation for 48 hours, cells (2 wells/replicate) were harvested on dry ice with 0.8 mL pre-chilled 80% HPLC-grade methanol (Fluka Analytical). The cell mixture was incubated for 15 minutes on dry ice prior to centrifugation at 18,000 x g for 10 minutes at 4oC. The supernatant was retained, and the remaining cell pellet was resuspended in 200 μL pre-chilled 80% methanol and centrifuged. Supernatants were combined and lyophilized using a SpeedVac (Thermo Fisher Scientific). Lyophilized samples were resuspended in 20 μL ultrapure water and subjected to metabolomics profiling using the AB/SCIEX 5500 QTRAP triple quadrupole instrument as previously described 56,57. Data analysis was performed using the Metaboanalyst software.
Lipidomic extraction and analysis.
Lipidomics sample preparation was performed as previously described 38. Either 1.0 x 10⁶ cells or 100 μg of pure mitochondria were harvested, resuspended in 200 μL H2O, and mixed with (i) 1.5 mL of HPLC-grade methanol and (ii) 5 mL of methyl tert-butyl ether (MTBE). Samples were agitated at room temperature for 1 hour. Next, 1.25 mL of H2O was added to each glass tube and centrifuged at 1,000xg for 10 minutes to promote phase separation. The upper MTBE phase was collected and dried in a speed vac at 4°C. Dried samples were then resuspended in 30 μL of 1:1 LC/MS grade isopropanol:acetonitrile methanol and subjected to lipidomics analysis using the QExactive Plus Orbitrap (Thermo Fisher Scientific) instrument. Data analysis was performed using the Metaboanalyst software. Briefly, from raw data, identical lipid entries were summed, lipids with >50% missing values were removed from further analysis, missing value estimation (using half of minimum) for lipids with <50% missing were calculated, and data was sum normalized across all lipid species detected for each sample (experiments analyzed independently). For pooled data in figures, data analysis was performed separately for each experiment and relative values for each replicate compared to controls were calculated and used.
Proteomic extraction and analysis.
Proteomics was performed as previously described 33. Briefly, 1x 15 cm plates of semi-confluent U2OS cells were harvested for proteomics after 48 hours of drug treatment. Cell pellets were solubilized in SDS lysis buffer (2.0 % SDS w/v, 250 mM NaCl, PhosStop (Roche) phosphatase inhibitors, EDTA free protease inhibitor cocktail (Promega), and 100 mM HEPES, pH 8.5), reduced with 5 mM TCEP at 60°C for 30 minutes, alkylated with 14 mM iodoacetamide for 45 minutes, and chloroform/methanol precipitated. Samples were then solubilized in 8 M urea dissolved in 50 mM HEPES, pH 8.5 and protein content was quantified. 500 μg of protein/sample was diluted to 4 M urea with digestion buffer (25 mM HEPES pH 8.5) and digested with LysC (Wako) (2 μg/μl) 1:100 for 2 hours. Samples were then diluted to 2M urea and further digested with Lys-C (2 μg/μl) 1:100 and Trypsin (0.5 μg/μl) 1:100 overnight at 37°C. In the morning, samples were diluted to 1M urea, and further digested with Trypsin (0.5 μg/μl) 1:100 for 6 hours at 37°C. Samples were then acidified with 200 μl 25% acetic acid and centrifuged at max speed for 5 minutes, and subjected to C18 solid-phase extraction (SPE) (50 mg, Sep-Pak, Waters). 50 ug of digested peptides were labeled with tandem mass tag (TMT) reagents (Thermo Fisher Scientific), combined into one fraction, acidified with 20 µL of 20 % FA (pH ~2), and subjected to C18 SPE on Sep-Pak cartridges (50 mg). Next, basic pH reversed-phase HPLC, followed by MS analysis was performed as previously described 33.
Phospholipid synthesis assay.
14C-ethanolamine labeling was performed as described previously58. Briefly, cells were grown in the presence or absence of Brequinar (0.5 µM) for 48 hours. Cells were then washed with PBS and incubated in DMEM containing 0.2 μCi/ml of 14C-ethanolamine and dialyzed serum for 4 hours. 200 μg protein of cells per condition were treated with 5% TCA at room temperature for 30 minutes. Lipids were extracted using Bligh and Dyer method, spotted on TLC plates (silica gel 60, Merck), and resolved using chloroform/methanol/acetic acid solution (v/v/v: 65/25/10). 14C-labelled lipids were detected using autoradiography film.
Proliferation experiments.
Standard cell counting experiments were performed by seeding 1x10⁵ cells per well in a 6-well dish and splitting/counting cells using Trypan blue on indicated days. Enrichment analysis was performed by seeding a 50:50 mixture of sgFAR1 GFP (GFP+) and sgFAR1 FAR1 (GFP-) cells at 6x10⁵ cells per 10 cm dish. Cells were propagated/measured for GFP expression every 3 days using a BD FACSCanto II flow cytometer and BD FACSDiva Software. Gating for doublets and presence of GFP was performed identically across each experiment using FCS Express (De Novo Software) (Supplementary Data 7).
Genetic dependency experiments.
For computational studies to identify genetic interactions with ether lipid synthesis genes, we used the DepMap (DepMap, Broad (2020): DepMap 20Q3 Public. Dataset, doi:10.6084/m9.figshare.12931238.v1) and CRISPR datasets 59,60.
Statistical analysis and reproducibility.
All statistics are described in figure legends. In general, Student’s t-tests with two-tails and Bonferroni’s correction were performed for sample comparisons. For data where multiple Student’s t-tests were performed, we used Student’s t-test with a two-stage linear step-up procedure of Benjamini, Krieger and Yekutieli, with Q = 5%. For respirasome abundance and oxygen consumption quantification, we used paired Student’s t-tests with two-tails. Statistical significance is represented by an asterisk corresponding to * p < 0.05 or q < 0.05. GraphPad Prism software was used to generate graphs and perform statistical analyses, Microsoft Excel for Mac was used for analysis of small molecule screen data, metabolomics, and proteomics, Morpheus software from the Broad institute (https://software.broadinstitute.org/morpheus/) was used to generate heatmaps, and Fiji was used to process microscopy data 61.
Reporting Summary.
Further information on research design is available in the Nature Research Reporting Summary linked to this article.
Data availability:
Datasets generated during this current study are included in the published article as supplementary data or as publicly available datasets. Chemical screen data has been deposited in PubChem and proteomic data in PRIDE with accession PXD023882. Any additional data not included in this manuscript is available upon contact with the corresponding author upon request.
Extended Data
Extended Data Fig. 1. A high-throughput chemical screen for respirasome assembly using an in vivo NanoBiT reporter.
a, BiFC SC reporter fluorescence co-localizes with MitoTracker Red. Scale bar, 25 µm (n=1 experiment). b, NanoBiT SC reporter luminescence is proportional to cell number. Cells expressing UQCRB-LgBit and COX5B-SmBit were grown for 24 hours after seeding at different densities (n=3 biologically independent samples). c, Luminescent measurements of NanoBiT reporter cells (n=128 biologically independent samples, * left to right q<0.0001, <0.0001) and d, In-gel Nanoluciferase activity of mitochondria fractions treated with tunicamycin or galactose media for 48 hours (n=3 experiments). e, Mitochondrial respiration of cells expressing NanoBiT reporter (n=5 biologically independent samples). f, Cell proliferation in glucose (n=6 biologically independent samples over 2 independent experiments) or galactose media (n=6 biologically independent samples over 3 independent experiments, * left to right q=0.0214, 0.0292, 0.0278, 0.0013, 0.0214) of NanoBiT reporter cells. g, Overview of high-throughput chemical screen. NanoBiT SC reporter cells are plated in 384-well plates with compound libraries, grown for 48 hours, and measured for luminescence and cell number. Compounds that increased the NanoBiT/cell number ratio were scored positive and a subset were validated by BN-PAGE. h, Luminescent measurements of NanoBiT reporter cells treated with lowest dose effective compound concentration from primary screen, see Table S2 (DMSO, n=60; drug treatments, n=8 biologically independent samples, * q<0.0001). i, BN-PAGE and j, Quantification of respirasome abundance (MTCO1/ATP5A intensity) of mitochondrial fractions isolated from cells treated with Vidofludimus (10 µM), Genistein (10 µM), Entinostat (2 µM), or OTX15 (0.4 µM) for 48 hours (n=4 independent experiments). Data are presented as mean values +/- s.e.m., Student’s t-test with a two-stage linear step-up procedure of Benjamini, Krieger and Yekutieli, with Q = 5%.
Extended Data Fig. 2. Inhibitors of nucleotide synthesis promote respirasome assembly.
BN-PAGE of mitochondrial fractions isolated from U2OS cells treated with MTX (0.1 µM) (n=2 experiments). b, Luminescence of NanoBiT reporter cells treated with MTX (DMSO, n=36; MTX, n=12 biologically independent samples, 100 nM q<0.0001, 50 nM q<0.0001). c, BN-PAGE of mitochondrial fractions isolated from 293T and A375P cells treated with Brequinar (0.5 µM). d-g, Volcano plots of metabolite changes in cells treated with Vidofludimus, Brequinar, CB-839, or Methotrexate. h-k, Proliferation of cells grown in the presence of indicated compound (n=11 biologically independent samples). l, BN-PAGE of mitochondrial fractions isolated from cells treated with 6-MP (25 µM) (n=3 experiments). m-n, Heatmaps of metabolite changes in cells treated with 6-MP (25 µM) (n=4 biologically independent samples). Cells were treated with compound for 48 hours, heatmap row/column groupings are Pearson’s correlations, data are presented as mean values +/- s.e.m., Student’s t-test with a two-stage linear step-up procedure of Benjamini, Krieger and Yekutieli, with Q = 5. 6-MP (6-mercaptopurine), MTX (methotrexate).
Extended Data Fig. 3. DHODH controls mitochondrial respirasome assembly through pyrimidine nucleotides.
a, BN-PAGE of mitochondrial fractions from cells treated with Vidofludimus in the presence or absence of uridine (n=2 experiments). b, Luminescent measurements of NanoBiT reporter cells treated with Vidofludimus in the presence or absence of uridine (DMSO, n=32; Vido, n=16 biologically independent samples, * q<0.0001). c, In-gel CI and CIV activities of mitochondrial fractions isolated from cells treated with Vidofludimus (n=2 experiments). d, Western blot of proteins isolated from sgDHODH cells (n=1 experiment). e, BN-PAGE of mitochondrial fractions from sgDHODH cells in the presence or absence of uridine (n=2 experiments). f, Protein quantification of respiratory chain subunits in cells treated with Brequinar (n=3 biologically independent samples). g, Proliferation measurements of cells treated with Vidofludimus for 3 days, initial seed of 1x10⁵ cells (n=3 biologically independent samples, Vidofludimus q=<0.0001, Vidofludimus + uridine q=0.0004). h, Proliferation measurements of sgDHODH cells in the absence of uridine for 3 days, initial seed of 1x10⁵ cells (n=3 biologically independent samples, sgDHODH q<0.0001, sgDHODH + uridine q<0.0001). i, Volcano plot of metabolite changes in cells treated with Brequinar, relates to Fig. 3g. j, Heatmaps of hexosamine and phospholipid metabolites from cells treated with Brequinar (n=3 biologically independent samples). k, Residual plot of alterations in metabolite levels of Brequinar treated cells with uridine supplementation. Cells were treated with compound for 48 hours unless otherwise noted, data are presented as mean values +/- s.e.m., Student’s t-test with a two-stage linear step-up procedure of Benjamini, Krieger and Yekutieli, with Q = 5%.
Extended Data Fig. 4. Mitochondrial phospholipid composition is altered with DHODH inhibition.
a, Abundances of total PC, PE, PG, and PI in cells are differentially regulated with DHODH inhibition in a uridine-dependent manner (n=3 biologically independent samples, * left to right Vido q=0.0189, 0.0020, 0.0020, 0.0035, 0.0020, Vido + uri [compared to Vido] q=0.0157, 0.0015, 0.0029, 0.0489, Breq q=0.0258, 0.0003, 0.0359, 0.0247, 0.0247, 0.0258, Breq + uri [compared to Breq] q=0.0017, 0.0096). b, Abundances of total phospholipid classes in mitochondrial fractions are not regulated with DHODH inhibition (n=8 biologically independent samples over 2 independent experiments). c, Heatmaps of mitochondrial PG, PI, and PS species in cells treated with Brequinar. Data from experiments 1 (n=3 biologically independent samples) and 2 (n=5 biologically independent samples) are shown. d, Quantification of mitochondrial cardiolipin acyl chain composition (summation) in cells treated with Brequinar. Data from experiment 1 is shown due to better detection of cardiolipin species (n=3 biologically independent samples, Breq sn1 q=0.0195, Breq + uri [compared to Breq] sn1 q=0.0073, 0.0132, 0.0073, 0.0203, 0.0062, 0.0150, 0.0160, sn3 q=0.0078, sn4 q=0.0077, 0.0077, 0.0166, 0.0003, 0.0077, 0.0128, 0.0236). e, Quantification of cardiolipin species with >3 double bonds (box and whisker plot, line at median, 5–95% C.I., n=8 biologically independent samples over 2 experiments, * left to right q=0.0025, 0.0025, 0.0210, 0.0117). f, Heatmap of Brequinar-dependent changes in CL (p<0.15, two-sided Student’s t-test). Data from experiment 1 (n=3 biologically independent samples). In this figure, cells were treated with drug for 48 hours, heatmap row/column groupings are Pearson’s correlations, data are presented as mean values +/- s.e.m., Student’s t-test with a two-stage linear step-up procedure of Benjamini, Krieger and Yekutieli, with Q = 5%.
Extended Data Fig. 5. Ether lipid synthesis is increased relative to diacyl-PLs upon CTP depletion.
a, Heatmap of mitochondrial PC (p<0.10, two-sided Student’s t-test). Data from experiment 2 (n=5 biologically independent samples). Ether lipids are bolded. b, Lipidomic analysis of PC and PE subclass abundances in cells treated with Vidofludimus or Brequinar (min-max box plot, line at mean, n=3 biologically independent samples, * left to right Vido q=0.0041, 0.0041, 0.0016, 0.0476, Vido + uri [compared to Vido] q=0.0025, 0.0023, 0.0019, 0.0002, 0.0025, 0.0005, 0.0025, Breq q=0.0005, 0.0005, 0.0043, 0.0040, Breq + uri [compared to Breq] q=0.0011, 0.0011, 0.0436, 0.0277). c, Quantification of plasmenyl/diacyl PC or PE abundances in cells treated with Vidofludimus or Brequinar (n=3 biologically independent samples, * left to right Vido q=0.0002, 0.0306, Vido + uri [compared to Vido] q= 0.0005 0.0011, Breq q= 0.0018, 0.0286, Breq + uri [compared to Breq] q= 0.0053, 0.0199). d, 14C-ethanolamine incorporation into PE in cells treated with Brequinar (n=2 experiments). Lipid fractions were treated with TCA to cleave the ether vinyl bond, resulting in lyso-PE. e, Western blot of CTPS1 from sgCTPS1 cells (n=1 experiment). f, BN-PAGE of mitochondrial fractions from sgCTPS1 cells in the presence or absence of cytidine (50 µg/ml) (n=3 experiments). g, BN-PAGE of mitochondrial fractions from Brequinar treated cells in the presence or absence of CTP (200 µM) (n=1 experiment). In this figure, cells were treated with drug for 48 hours, heatmap row/column groupings are Pearson’s correlations, data are presented as mean values +/- s.e.m., Student’s t-test with a two-stage linear step-up procedure of Benjamini, Krieger and Yekutieli, with Q = 5%. Breq (Brequinar), uri (uridine), and cyt (cytidine).
Extended Data Fig. 6. Ether lipid synthesis is required for respirasome assembly from DHODH inhibition.
a, Western blot of FAR1 from cells treated with Brequinar in the presence or absence of uridine (n=2 experiments). b, Western blot of FAR1 from sgFAR1 cells (n=2 experiments). c, Lipidomic analysis of PC and PE subclass abundances in mitochondrial fractions isolated from sgFAR1 cells treated with Brequinar (min-max box plot, line at mean, n=3 biologically independent samples, Student’s t-test with a two-stage linear step-up procedure of Benjamini, Krieger and Yekutieli, with Q = 5%, * left to right sgControl DMSO [compared to sgControl Breq] q=0.0003, 0.0034, 0.0007, sgControl DMSO [compared to sgFAR1 DMSO] q=0.0208, <0.0001, 0.0005, 0.0016, 0.0016, 0.0001, sgControl Breq [compared to sgFAR1 Breq] q=<0.0001, <0.0001, <0.0001, <0.0001, <0.0001). d, Western blot of FAR1 from sgFAR1 cells exogenously expressing CRISPR-resistant FAR1 (n=2 experiments). e, BN-PAGE and f, quantification of respirasome abundance (MTCO1/ATP5A intensity) of mitochondria isolated from sgFAR1 + exogenous FAR1 cells treated with Brequinar (n=3 independent experiments, two-sided paired Student’s t-test, * left to right p=0.0460, 0.0142). g, Western blot of AGPS from sgAGPS cells (n=2 experiment). h, BN-PAGE and i, quantification of respirasome abundance of mitochondria isolated from sgAGPS cells treated with Brequinar (n=4 independent experiments, two-sided paired Student’s t-test, * left to right p=0.0445, 0.0005). j-k, Heatmaps of plasmenyl PC and PE (i.e. plasmalogens) and cardiolipin species in sgFAR1 mitochondria (n=4 biologically independent samples). In this figure, cells were treated with Brequinar for 48 hours, heatmap row/column groupings are Pearson’s correlations, data are presented as mean values +/- s.e.m.
Extended Data Fig. 7. Proliferation under low nucleotide conditions requires increased mitochondrial respiratory capacity.
a, CI-dependent respiration of mitochondria isolated from sgFAR1 cells treated with Brequinar (n=5 independent experiments, two-sided paired Student’s t-test, * left to right sgControl DMSO [compared to sgControl Breq] p=0.0496, 0.0070, sgControl Breq [compared to sgFAR1 Breq] p=0.0470, 0.0323, 0.0421, sgFAR1 DMSO [compared to sgFAR1 Breq] q=0.0284). b, Proliferation of sgFAR1 cells treated with Brequinar (0.25 µM) (n=12 biologically independent samples over 4 experiments, * left to right q=0.0153, 0.0153). c, Western blot of HIGD2A from sgHIGD2A cells. d, Proliferation of sgHIGD2A cells treated with Brequinar (0.25 µM) (n=12 biologically independent samples over 4 experiments, * left to right q=0.0006, <0.0001, <0.0001). e, Pearson’s correlations of FAR1 CERES dependency score against other genes. Highlighted in green are ether lipid synthesis genes. f-g, Pearsons’s correlation of CERES dependency scores between DHODH and FAR1 or Ether lipid average (AGPS, FAR1, GNPAT, TMEM189). In this figure, cells were treated with Brequinar for 48 hours unless otherwise noted, data are presented as mean values +/- s.e.m., Student’s t-test with a two-stage linear step-up procedure of Benjamini, Krieger and Yekutieli, with Q = 5%.
Supplementary Material
Supplementary Table 1. DNA sequences of expression constructs and CRISPR guides.
Supplementary Table 2. Small molecule screening data.
Supplementary Figure 1. Gating strategy for flow cytometry
High-throughput small-molecule screen identifies compounds that increase NanoBiT SC reporter
Metabolomic data sets for Vidofludimus, Brequinar, CB-839, Methotrexate.
Proteomic data set for Brequinar treated cells supplemented with uridine.
Lipidomic data set for sgFAR1 mitochondria treated with Brequinar.
Lipidomic data sets for Brequinar treated cells supplemented with uridine.
Lipidomic data set for sgFAR1 cells treated with Brequinar.
Acknowledgments:
We thank members of the Puigserver Laboratory for helpful discussions regarding this project. We would like to also acknowledge the Nikon Imaging Center at Harvard Medical School for assistance with fluorescence microscopy, the ICCB-Longwood Screening Facility at Harvard Medical School for facilitating our screening efforts, John M. Asara and Min Yuan at the Beth Israel Deaconess Medical Center Mass Spectrometry Core for providing metabolomics and non-polar lipidomics profiling data, and Promega for providing us with a Nanoluciferase polyclonal antibody. This work was supported by NIH R01 DK089883–07 NIDDK, R01 DK081418–11 NIDDK, and R01 GM121452 NIGMS to P.P., NIH F32 GM125243–01A1 NIGMS to C.F.B. and NIH F30 DE028206–01A1 NIDR to E.A.P., EMBO postdoctoral fellowship and MDA Development Grant to E.B., Human Frontier Science Program (LT-000033/2019-L) to P.L.M., and American Heart Associate postdoctoral fellowship to C.L.R.
Footnotes
Competing interests: The authors declare no competing interests.
Additional Information: Supplementary Information is available for this paper.
References:
- 1.Mitchell P Coupling of phosphorylation to electron and hydrogen transfer by a chemi-osmotic type of mechanism. Nature 191, 144–148, doi: 10.1038/191144a0 (1961). [DOI] [PubMed] [Google Scholar]
- 2.Schagger H & Pfeiffer K Supercomplexes in the respiratory chains of yeast and mammalian mitochondria. EMBO J 19, 1777–1783, doi: 10.1093/emboj/19.8.1777 (2000). [DOI] [PMC free article] [PubMed] [Google Scholar]
- 3.Schagger H & Pfeiffer K The ratio of oxidative phosphorylation complexes I-V in bovine heart mitochondria and the composition of respiratory chain supercomplexes. J Biol Chem 276, 37861–37867, doi: 10.1074/jbc.M106474200 (2001). [DOI] [PubMed] [Google Scholar]
- 4.Letts JA, Fiedorczuk K & Sazanov LA The architecture of respiratory supercomplexes. Nature 537, 644–648, doi: 10.1038/nature19774 (2016). [DOI] [PubMed] [Google Scholar]
- 5.Gu J et al. The architecture of the mammalian respirasome. Nature 537, 639–643, doi: 10.1038/nature19359 (2016). [DOI] [PubMed] [Google Scholar]
- 6.Sousa JS, Mills DJ, Vonck J & Kuhlbrandt W Functional asymmetry and electron flow in the bovine respirasome. Elife 5, doi: 10.7554/eLife.21290 (2016). [DOI] [PMC free article] [PubMed] [Google Scholar]
- 7.Wu M, Gu J, Guo R, Huang Y & Yang M Structure of Mammalian Respiratory Supercomplex I1III2IV1. Cell 167, 1598–1609 e1510, doi: 10.1016/j.cell.2016.11.012 (2016). [DOI] [PubMed] [Google Scholar]
- 8.Guo R, Zong S, Wu M, Gu J & Yang M Architecture of Human Mitochondrial Respiratory Megacomplex I2III2IV2. Cell 170, 1247–1257 e1212, doi: 10.1016/j.cell.2017.07.050 (2017). [DOI] [PubMed] [Google Scholar]
- 9.Acin-Perez R, Fernandez-Silva P, Peleato ML, Perez-Martos A & Enriquez JA Respiratory active mitochondrial supercomplexes. Mol Cell 32, 529–539, doi: 10.1016/j.molcel.2008.10.021 (2008). [DOI] [PubMed] [Google Scholar]
- 10.Shinzawa-Itoh K et al. Purification of Active Respiratory Supercomplex from Bovine Heart Mitochondria Enables Functional Studies. J Biol Chem 291, 4178–4184, doi: 10.1074/jbc.M115.680553 (2016). [DOI] [PMC free article] [PubMed] [Google Scholar]
- 11.Calvo E et al. Functional role of respiratory supercomplexes in mice: SCAF1 relevance and segmentation of the Qpool. Sci Adv 6, eaba7509, doi: 10.1126/sciadv.aba7509 (2020). [DOI] [PMC free article] [PubMed] [Google Scholar]
- 12.Garcia-Poyatos C et al. Scaf1 promotes respiratory supercomplexes and metabolic efficiency in zebrafish. EMBO Rep 21, e50287, doi: 10.15252/embr.202050287 (2020). [DOI] [PMC free article] [PubMed] [Google Scholar]
- 13.Berndtsson J et al. Respiratory supercomplexes enhance electron transport by decreasing cytochrome c diffusion distance. EMBO Rep, e51015, doi: 10.15252/embr.202051015 (2020). [DOI] [PMC free article] [PubMed] [Google Scholar]
- 14.Chen YC et al. Identification of a protein mediating respiratory supercomplex stability. Cell Metab 15, 348–360, doi: 10.1016/j.cmet.2012.02.006 (2012). [DOI] [PMC free article] [PubMed] [Google Scholar]
- 15.Hatle KM et al. MCJ/DnaJC15, an endogenous mitochondrial repressor of the respiratory chain that controls metabolic alterations. Mol Cell Biol 33, 2302–2314, doi: 10.1128/MCB.00189-13 (2013). [DOI] [PMC free article] [PubMed] [Google Scholar]
- 16.Desmurs M et al. C11orf83, a mitochondrial cardiolipin-binding protein involved in bc1 complex assembly and supercomplex stabilization. Mol Cell Biol 35, 1139–1156, doi: 10.1128/MCB.01047-14 (2015). [DOI] [PMC free article] [PubMed] [Google Scholar]
- 17.Mitsopoulos P et al. Stomatin-like protein 2 is required for in vivo mitochondrial respiratory chain supercomplex formation and optimal cell function. Mol Cell Biol 35, 1838–1847, doi: 10.1128/MCB.00047-15 (2015). [DOI] [PMC free article] [PubMed] [Google Scholar]
- 18.Nagano H et al. p53-inducible DPYSL4 associates with mitochondrial supercomplexes and regulates energy metabolism in adipocytes and cancer cells. Proc Natl Acad Sci U S A 115, 8370–8375, doi: 10.1073/pnas.1804243115 (2018). [DOI] [PMC free article] [PubMed] [Google Scholar]
- 19.Ikeda K, Shiba S, Horie-Inoue K, Shimokata K & Inoue S A stabilizing factor for mitochondrial respiratory supercomplex assembly regulates energy metabolism in muscle. Nat Commun 4, 2147, doi: 10.1038/ncomms3147 (2013). [DOI] [PubMed] [Google Scholar]
- 20.Lapuente-Brun E et al. Supercomplex assembly determines electron flux in the mitochondrial electron transport chain. Science 340, 1567–1570, doi: 10.1126/science.1230381 (2013). [DOI] [PubMed] [Google Scholar]
- 21.Milenkovic D, Blaza JN, Larsson NG & Hirst J The Enigma of the Respiratory Chain Supercomplex. Cell Metab 25, 765–776, doi: 10.1016/j.cmet.2017.03.009 (2017). [DOI] [PubMed] [Google Scholar]
- 22.Cogliati S et al. Mechanism of super-assembly of respiratory complexes III and IV. Nature 539, 579–582, doi: 10.1038/nature20157 (2016). [DOI] [PubMed] [Google Scholar]
- 23.Mourier A, Matic S, Ruzzenente B, Larsson NG & Milenkovic D The respiratory chain supercomplex organization is independent of COX7a2l isoforms. Cell Metab 20, 1069–1075, doi: 10.1016/j.cmet.2014.11.005 (2014). [DOI] [PMC free article] [PubMed] [Google Scholar]
- 24.Perez-Perez R et al. COX7A2L Is a Mitochondrial Complex III Binding Protein that Stabilizes the III2+IV Supercomplex without Affecting Respirasome Formation. Cell Rep 16, 2387–2398, doi: 10.1016/j.celrep.2016.07.081 (2016). [DOI] [PMC free article] [PubMed] [Google Scholar]
- 25.Pfeiffer K et al. Cardiolipin stabilizes respiratory chain supercomplexes. J Biol Chem 278, 52873–52880, doi: 10.1074/jbc.M308366200 (2003). [DOI] [PubMed] [Google Scholar]
- 26.Bottinger L et al. Phosphatidylethanolamine and cardiolipin differentially affect the stability of mitochondrial respiratory chain supercomplexes. J Mol Biol 423, 677–686, doi: 10.1016/j.jmb.2012.09.001 (2012). [DOI] [PMC free article] [PubMed] [Google Scholar]
- 27.Das S et al. ATP citrate lyase improves mitochondrial function in skeletal muscle. Cell Metab 21, 868–876, doi: 10.1016/j.cmet.2015.05.006 (2015). [DOI] [PubMed] [Google Scholar]
- 28.Baker CD, Basu Ball W, Pryce EN & Gohil VM Specific requirements of nonbilayer phospholipids in mitochondrial respiratory chain function and formation. Mol Biol Cell 27, 2161–2171, doi: 10.1091/mbc.E15-12-0865 (2016). [DOI] [PMC free article] [PubMed] [Google Scholar]
- 29.Tasseva G et al. Phosphatidylethanolamine deficiency in Mammalian mitochondria impairs oxidative phosphorylation and alters mitochondrial morphology. J Biol Chem 288, 4158–4173, doi: 10.1074/jbc.M112.434183 (2013). [DOI] [PMC free article] [PubMed] [Google Scholar]
- 30.Basu Ball W, Neff JK & Gohil VM The role of nonbilayer phospholipids in mitochondrial structure and function. FEBS Lett 592, 1273–1290, doi: 10.1002/1873-3468.12887 (2018). [DOI] [PMC free article] [PubMed] [Google Scholar]
- 31.Dixon AS et al. NanoLuc Complementation Reporter Optimized for Accurate Measurement of Protein Interactions in Cells. ACS Chem Biol 11, 400–408, doi: 10.1021/acschembio.5b00753 (2016). [DOI] [PubMed] [Google Scholar]
- 32.Ohashi K, Kiuchi T, Shoji K, Sampei K & Mizuno K Visualization of cofilin-actin and Ras-Raf interactions by bimolecular fluorescence complementation assays using a new pair of split Venus fragments. Biotechniques 52, 45–50, doi: 10.2144/000113777 (2012). [DOI] [PubMed] [Google Scholar]
- 33.Balsa E et al. ER and Nutrient Stress Promote Assembly of Respiratory Chain Supercomplexes through the PERK-eIF2alpha Axis. Mol Cell 74, 877–890 e876, doi: 10.1016/j.molcel.2019.03.031 (2019). [DOI] [PMC free article] [PubMed] [Google Scholar]
- 34.Madak JT, Bankhead A 3rd, Cuthbertson CR, Showalter HD & Neamati N Revisiting the role of dihydroorotate dehydrogenase as a therapeutic target for cancer. Pharmacol Ther 195, 111–131, doi: 10.1016/j.pharmthera.2018.10.012 (2019). [DOI] [PubMed] [Google Scholar]
- 35.Schlame M & Ren M Barth syndrome, a human disorder of cardiolipin metabolism. FEBS Lett 580, 5450–5455, doi: 10.1016/j.febslet.2006.07.022 (2006). [DOI] [PubMed] [Google Scholar]
- 36.McKenzie M, Lazarou M, Thorburn DR & Ryan MT Mitochondrial respiratory chain supercomplexes are destabilized in Barth Syndrome patients. J Mol Biol 361, 462–469, doi: 10.1016/j.jmb.2006.06.057 (2006). [DOI] [PubMed] [Google Scholar]
- 37.Dudek J et al. Cardiolipin deficiency affects respiratory chain function and organization in an induced pluripotent stem cell model of Barth syndrome. Stem Cell Res 11, 806–819, doi: 10.1016/j.scr.2013.05.005 (2013). [DOI] [PubMed] [Google Scholar]
- 38.Breitkopf SB et al. A relative quantitative positive/negative ion switching method for untargeted lipidomics via high resolution LC-MS/MS from any biological source. Metabolomics 13, doi: 10.1007/s11306-016-1157-8 (2017). [DOI] [PMC free article] [PubMed] [Google Scholar]
- 39.Braverman NE & Moser AB Functions of plasmalogen lipids in health and disease. Biochim Biophys Acta 1822, 1442–1452, doi: 10.1016/j.bbadis.2012.05.008 (2012). [DOI] [PubMed] [Google Scholar]
- 40.Dean JM & Lodhi IJ Structural and functional roles of ether lipids. Protein Cell 9, 196–206, doi: 10.1007/s13238-017-0423-5 (2018). [DOI] [PMC free article] [PubMed] [Google Scholar]
- 41.Honsho M, Asaoku S & Fujiki Y Posttranslational regulation of fatty acyl-CoA reductase 1, Far1, controls ether glycerophospholipid synthesis. J Biol Chem 285, 8537–8542, doi: 10.1074/jbc.M109.083311 (2010). [DOI] [PMC free article] [PubMed] [Google Scholar]
- 42.Kimura T et al. Substantial Decrease in Plasmalogen in the Heart Associated with Tafazzin Deficiency. Biochemistry 57, 2162–2175, doi: 10.1021/acs.biochem.8b00042 (2018). [DOI] [PMC free article] [PubMed] [Google Scholar]
- 43.Letts JA & Sazanov LA Clarifying the supercomplex: the higher-order organization of the mitochondrial electron transport chain. Nat Struct Mol Biol 24, 800–808, doi: 10.1038/nsmb.3460 (2017). [DOI] [PubMed] [Google Scholar]
- 44.Horibata Y et al. EPT1 (selenoprotein I) is critical for the neural development and maintenance of plasmalogen in humans. J Lipid Res 59, 1015–1026, doi: 10.1194/jlr.P081620 (2018). [DOI] [PMC free article] [PubMed] [Google Scholar]
- 45.Kimura T et al. Plasmalogen loss caused by remodeling deficiency in mitochondria. Life Science Alliance 2, e201900348, doi: 10.26508/lsa.201900348 (2019). [DOI] [PMC free article] [PubMed] [Google Scholar]
- 46.Greggio C et al. Enhanced Respiratory Chain Supercomplex Formation in Response to Exercise in Human Skeletal Muscle. Cell Metab 25, 301–311, doi: 10.1016/j.cmet.2016.11.004 (2017). [DOI] [PubMed] [Google Scholar]
- 47.Hollinshead KER et al. Respiratory Supercomplexes Promote Mitochondrial Efficiency and Growth in Severely Hypoxic Pancreatic Cancer. Cell Rep 33, 108231, doi: 10.1016/j.celrep.2020.108231 (2020). [DOI] [PMC free article] [PubMed] [Google Scholar]
- 48.Ikeda K et al. Mitochondrial supercomplex assembly promotes breast and endometrial tumorigenesis by metabolic alterations and enhanced hypoxia tolerance. Nat Commun 10, 4108, doi: 10.1038/s41467-019-12124-6 (2019). [DOI] [PMC free article] [PubMed] [Google Scholar]
- 49.Jain IH et al. Genetic Screen for Cell Fitness in High or Low Oxygen Highlights Mitochondrial and Lipid Metabolism. Cell 181, 716–727 e711, doi: 10.1016/j.cell.2020.03.029 (2020). [DOI] [PMC free article] [PubMed] [Google Scholar]
- 50.Benjamin DI et al. Ether lipid generating enzyme AGPS alters the balance of structural and signaling lipids to fuel cancer pathogenicity. Proc Natl Acad Sci U S A 110, 14912–14917, doi: 10.1073/pnas.1310894110 (2013). [DOI] [PMC free article] [PubMed] [Google Scholar]
- 51.Zou Y et al. Plasticity of ether lipids promotes ferroptosis susceptibility and evasion. Nature 585, 603–608, doi: 10.1038/s41586-020-2732-8 (2020). [DOI] [PMC free article] [PubMed] [Google Scholar]
- 52.Rhee H-W et al. Proteomic Mapping of Mitochondria in Living Cells via Spatially Restricted Enzymatic Tagging. Science 339, 1328–1331, doi: 10.1126/science.1230593 (2013). [DOI] [PMC free article] [PubMed] [Google Scholar]
Methods-only references:
- 53.Pettersen EF et al. UCSF Chimera--a visualization system for exploratory research and analysis. J Comput Chem 25, 1605–1612, doi: 10.1002/jcc.20084 (2004). [DOI] [PubMed] [Google Scholar]
- 54.Shalem O et al. Genome-scale CRISPR-Cas9 knockout screening in human cells. Science 343, 84–87, doi: 10.1126/science.1247005 (2014). [DOI] [PMC free article] [PubMed] [Google Scholar]
- 55.Spinazzi M, Casarin A, Pertegato V, Salviati L & Angelini C Assessment of mitochondrial respiratory chain enzymatic activities on tissues and cultured cells. Nat Protoc 7, 1235–1246, doi: 10.1038/nprot.2012.058 (2012). [DOI] [PubMed] [Google Scholar]
- 56.Yuan M, Breitkopf SB, Yang X & Asara JM A positive/negative ion-switching, targeted mass spectrometry-based metabolomics platform for bodily fluids, cells, and fresh and fixed tissue. Nat Protoc 7, 872–881, doi: 10.1038/nprot.2012.024 (2012). [DOI] [PMC free article] [PubMed] [Google Scholar]
- 57.Yuan M et al. Ex vivo and in vivo stable isotope labelling of central carbon metabolism and related pathways with analysis by LC-MS/MS. Nat Protoc 14, 313–330, doi: 10.1038/s41596-018-0102-x (2019). [DOI] [PMC free article] [PubMed] [Google Scholar]
- 58.Honsho M, Yagita Y, Kinoshita N & Fujiki Y Isolation and characterization of mutant animal cell line defective in alkyl-dihydroxyacetonephosphate synthase: localization and transport of plasmalogens to post-Golgi compartments. Biochim Biophys Acta 1783, 1857–1865, doi: 10.1016/j.bbamcr.2008.05.018 (2008). [DOI] [PubMed] [Google Scholar]
- 59.Meyers RM et al. Computational correction of copy number effect improves specificity of CRISPR-Cas9 essentiality screens in cancer cells. Nat Genet 49, 1779–1784, doi: 10.1038/ng.3984 (2017). [DOI] [PMC free article] [PubMed] [Google Scholar]
- 60.Dempster JM et al. Extracting Biological Insights from the Project Achilles Genome-Scale CRISPR Screens in Cancer Cell Lines. bioRxiv, 720243, doi: 10.1101/720243 (2019). [DOI] [Google Scholar]
- 61.Schindelin J et al. Fiji: an open-source platform for biological-image analysis. Nat Methods 9, 676–682, doi: 10.1038/nmeth.2019 (2012). [DOI] [PMC free article] [PubMed] [Google Scholar]
Associated Data
This section collects any data citations, data availability statements, or supplementary materials included in this article.
Supplementary Materials
Supplementary Table 1. DNA sequences of expression constructs and CRISPR guides.
Supplementary Table 2. Small molecule screening data.
Supplementary Figure 1. Gating strategy for flow cytometry
High-throughput small-molecule screen identifies compounds that increase NanoBiT SC reporter
Metabolomic data sets for Vidofludimus, Brequinar, CB-839, Methotrexate.
Proteomic data set for Brequinar treated cells supplemented with uridine.
Lipidomic data set for sgFAR1 mitochondria treated with Brequinar.
Lipidomic data sets for Brequinar treated cells supplemented with uridine.
Lipidomic data set for sgFAR1 cells treated with Brequinar.
Data Availability Statement
Datasets generated during this current study are included in the published article as supplementary data or as publicly available datasets. Chemical screen data has been deposited in PubChem and proteomic data in PRIDE with accession PXD023882. Any additional data not included in this manuscript is available upon contact with the corresponding author upon request.