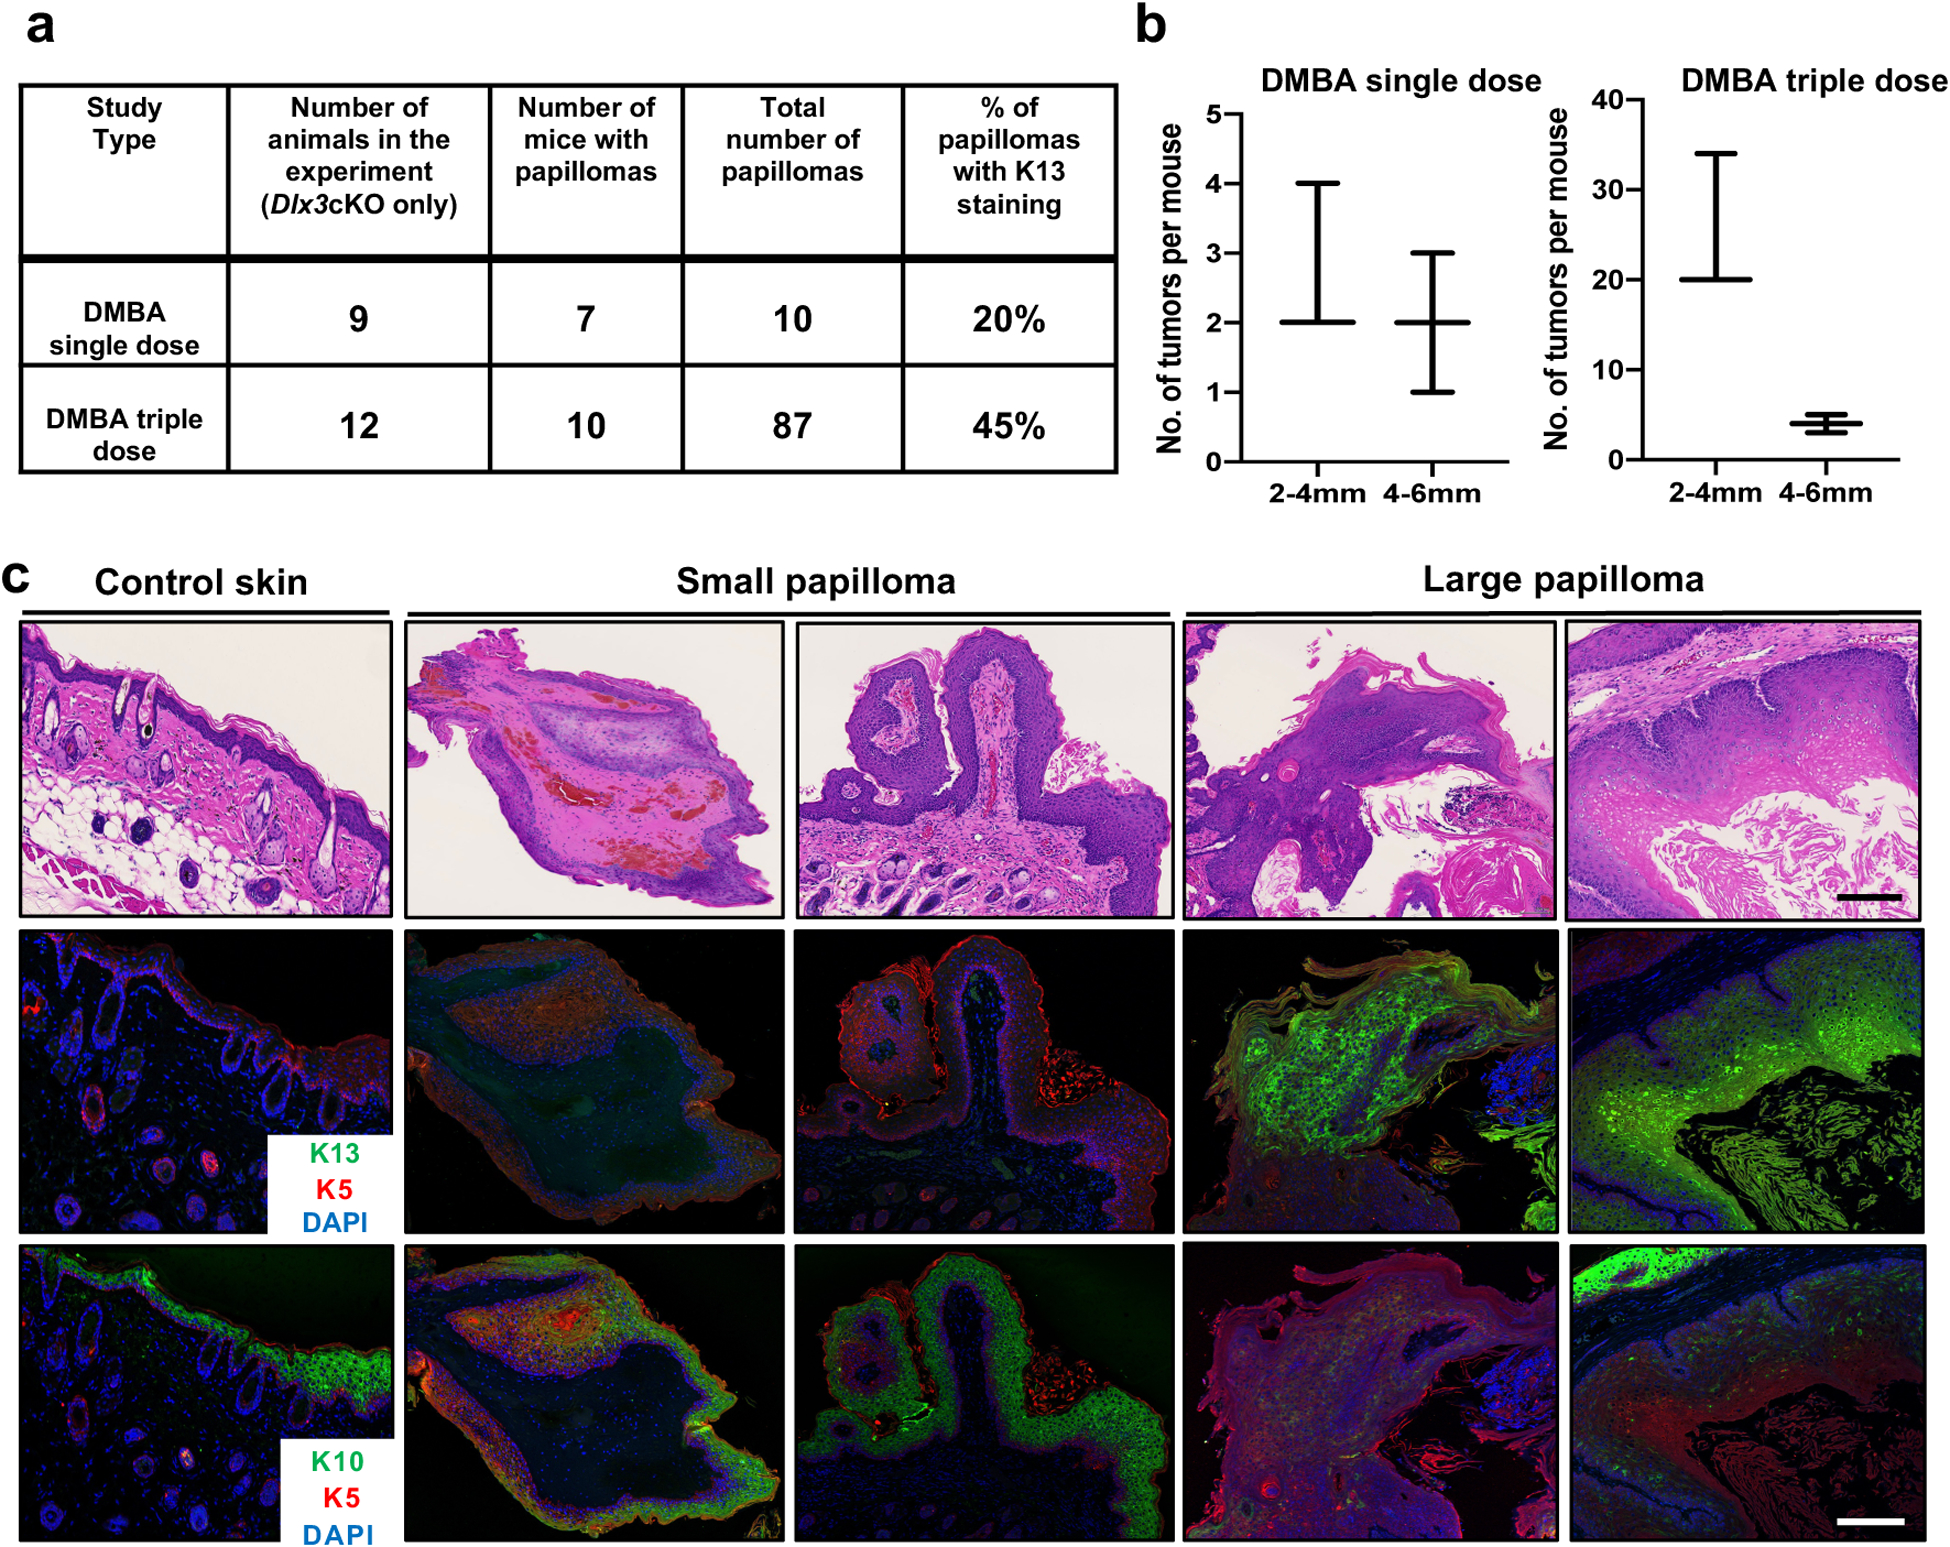
Figure 5. Dlx3 deficiency facilitates conversion of low risk papillomas to high risk papillomas.

(a) Summary of the results. The table shows the total number of papillomas developed and percentage of them with K13 staining. (b) Size distribution of papillomas. The length of a papilloma was used to represent its size. Small papilloma (2–4mm) and Large papilloma (4–6 mm) (c) Representative images of control skin, small papilloma, and large papilloma from Dlx3cKO mice. Dual immunofluorescence staining was performed for K5 (red) and K13 (green). The nuclei were counterstained with DAPI (blue). The same sections were used for hematoxylin and eosin (H&E) staining. K10 staining was performed with other sections from the same biopsies. Scale bars: 100μm.
