Abstract
COVID-19, the disease caused by the novel SARS-CoV-2 coronavirus, originated as an isolated outbreak in the Hubei province of China but soon created a global pandemic and is now a major threat to healthcare systems worldwide. Following the rapid human-to-human transmission of the infection, institutes around the world have made efforts to generate genome sequence data for the virus. With thousands of genome sequences for SARS-CoV-2 now available in the public domain, it is possible to analyze the sequences and gain a deeper understanding of the disease, its origin, and its epidemiology. Phylogenetic analysis is a potentially powerful tool for tracking the transmission pattern of the virus with a view to aiding identification of potential interventions. Toward this goal, we have created a comprehensive protocol for the analysis and phylogenetic clustering of SARS-CoV-2 genomes using Nextstrain, a powerful open-source tool for the real-time interactive visualization of genome sequencing data. Approaches to focus the phylogenetic clustering analysis on a particular region of interest are detailed in this protocol.
Keywords: COVID-19, SARS-CoV-2, Phylogenetic analysis, Genomes, Coronavirus
Background
Severe Acute Respiratory Syndrome- related coronaviruses (SARS-CoV) are one of the largest single-stranded RNA virus families known to date ( Zhu et al., 2020 ). Recently, SARS-CoV-2, a novel strain of coronavirus, has been identified as the causal pathogen for the ongoing Coronavirus disease 2019 (COVID-19) pandemic ( Huang et al., 2020 ). The infectious disease that first originated in Wuhan, China, spread to other nations at an alarmingly rapid pace. With 3,517,345 cases reported globally and a death toll of 243,401 (as of 5th May 2020), the disease continues to be a public health concern and a potential threat to the socio-economic welfare of nations and healthcare systems worldwide (World Health Organization, 2020. Novel Coronavirus (2019-nCoV): situation report, 106).
Owing to the rapid advancement of next-generation sequencing (NGS) technology and analysis methods, sequencing the viral genome has been recognized as a viable tool to aid the diagnosis and treatment of COVID-19 and help to understand the disease epidemiology. As the disease evolves over time, more sequencing data for SARS-CoV-2 genomes is being made available in the public domain. To date, there are over 25,000 publicly available genomes of SARS-CoV-2 from different geographical origins. Phylogenetic principles have previously been successfully utilized to contain and diffuse recent pandemic events such as avian influenza, the Zika virus epidemic, and HIV ( Salemi et al., 2008 ; Babakir- Mina et al., 2009 ; Angeletti et al., 2016 ). With the rapid accumulation of sequencing data, phylogenetic and phylodynamic analysis are potentially powerful tools for studying the evolutionary patterns of rapidly evolving RNA viruses, and therefore help to understand the epidemiology of the outbreak.
Visualizing evolutionary epidemiology can help to provide a deeper understanding of the global diversity of SARS-CoV-2. Nextstrain is an open-source project that aims to provide real-time interactive visualization of rapidly evolving pathogens coupled with additional data such as geographic information ( Hadfield et al., 2018 ). Nextstrain utilizes Augur, a bioinformatics toolkit for the systematic analysis of genome sequences, and Auspice, an interactive web service for the visualization of analysis results. This protocol has been created to aid bioinformaticians in gaining an epidemiological understanding of the SARS-CoV-2 pathogen using the powerful phylogenetic analysis toolkit provided by Nextstrain. The data and parameters used in this protocol are specific to SARS-CoV-2 genomes; however, Nextstrain is a generalized toolkit for the analysis of pathogen phylogenies and can be customized using the appropriate data and parameters suited to the pathogen of interest. All software and datasets used in this protocol are available in the public domain.
Equipment
We explicitly assume that the user has some experience working with shell commands on a Linux-based operating system and has superuser privileges.
-
Computational Requirements
We recommend using a workstation or a server with a 64 bit Linux-based operating system, possessing 8 GB RAM and sufficient hard disk space (at least 250 GB) to store the files used and produced in this analysis. The commands given in this analysis protocol have been validated on Ubuntu (18.04 LTS) Linux Distribution.
Software
-
Required Software
This protocol uses the following tools and Nextstrain software to perform the phylogenetic analysis:
Docker Engine ( https://www.docker.com/ )
Anaconda ( https://www.anaconda.com/ )
Nextstrain ( Hadfield et al., 2018 )
Augur ( Hadfield et al., 2018 )
MAFFT (Katoh and Standley, 2013)
-
IQTREE ( Nguyen et al., 2015 )
All requisite tools and their dependents must be installed before proceeding with the analysis.
-
Datasets
The protocol uses the SARS-CoV-2 genome sequence datasets made available by the Global Initiative on Sharing All Influenza Data (GISAID) (Shu and McCauley, 2017).
The installation steps for all tools used in this protocol and the instructions for downloading the requisite datasets are given in the following section.
Procedure
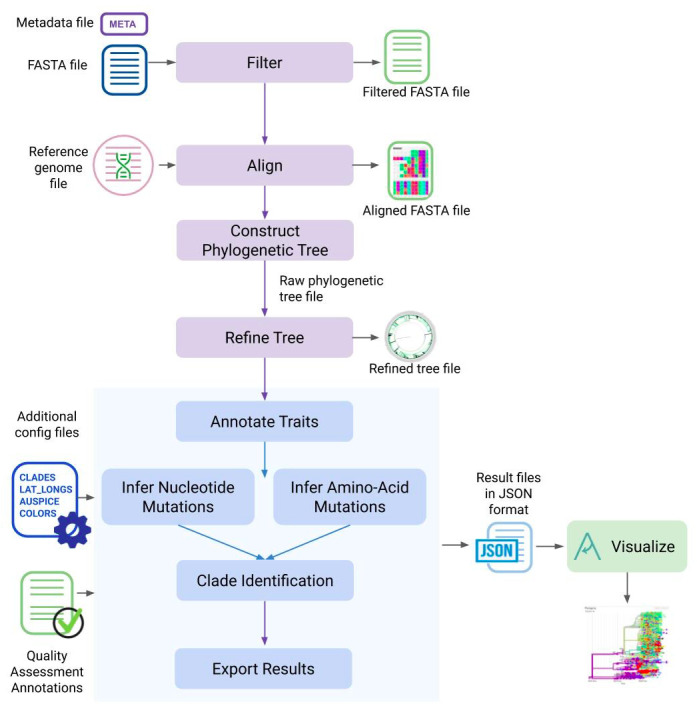
The individual steps involved in this protocol and the Augur modules used in each step are summarized in Figure 1.
Figure 1. The different steps described in this protocol and the Augur modules used in each of the analysis steps.
Downloading and installing requisite software tools and datasets
-
Install Docker Engine
Docker is an open-source technology based on virtualization, which is used for developing and running software applications in the form of containers. The Docker Engine can be installed using the following commands:
sudo apt-get update
sudo apt-get install apt-transport-https ca-certificates curl gnupg-agent software-properties-common
curl -fsSL https://download.docker.com/linux/ubuntu/gpg | sudo apt-key add -
sudo apt-key fingerprint 0EBFCD88
sudo add-apt-repository "deb [arch=amd64] https://download.docker.com/linux/ubuntu $(lsb_release -cs) stable"
sudo apt-get update
sudo apt-get install docker-ce docker-ce-cli containerd.io
To activate and test Docker installation, execute the following commands:
sudo groupadd docker
sudo usermod -aG docker $USER
newgrp docker
docker run hello-world
-
Install Anaconda
Anaconda is an open-source distribution of Python that simplifies the management of Python packages and environments. To install Anaconda, use the following commands:
wget https://repo.anaconda.com/archive/Anaconda3-2020.02-Linux-x86_64.sh
bash Anaconda3-2020.02-Linux-x86_64.sh
Proceed with the installation by following the on-screen instructions. You can find the anaconda3 folder in the directory shown in the installer script. You can activate and test your installation by running the following commands:
source ~/.bashrc
conda list
-
Install Nextstrain-CLI
Nextstrain is available as a Python package and can be installed using pip.
python3 -m pip install nextstrain-cli
To check whether Nextstrain has been successfully installed, use the following command:
nextstrain version
The version number shown in the output should be 1.16.1 or higher.
-
Install Augur
Augur is the toolkit provided by Nextstrain for phylogenetic analysis. Augur is also available as a Python package and can be installed using the following command:
python3 -m pip install nextstrain-augur
-
Install MAFFT
MAFFT (Multiple Alignment using Fast Fourier Transform) is required by Augur to perform multiple-sequence alignments. To download and install this tool, use the following command:
sudo apt-get install mafft
-
Install IQ-TREE
IQ-TREE is an open-source tool for constructing maximum-likelihood trees using phylogenetic data. IQ-TREE is required by Augur for constructing a phylogenetic tree from sequence data. To install IQ-TREE use the following command:
sudo apt-get install iqtree
It is recommended to use IQ-TREE version 1.6.1 (default version installed for Ubuntu 18.04 LTS) or higher.
-
Download the SARS-CoV-2 sequence dataset
The Global Initiative on Sharing All Influenza Data (GISAID) is the most updated public repository of SARS-CoV-2 genome sequences. For this phylogenetic clustering protocol, we downloaded the dataset of ~15,000 complete (as of 1st May 2020) SARS-CoV-2 genome sequences from GISAID. The database can be accessed by registering for a GISAID account. Upon successful activation, the sequence dataset can be downloaded by logging into the GISAID EpiCoVTM database and navigating to the Browse option ( https://www.epicov.org/epi3/frontend ).
To create the metadata file required by Augur, you will also need to download the Acknowledgment Table for all submissions provided by GISAID, which can also be found on the Browse page.
-
Download the SARS-CoV-2 reference genome
Before proceeding with the analysis, you also need to download the reference genome for SARS-CoV-2 from NCBI in GenBank (.gb). For this analysis, we downloaded the genome with the accession number MN908947.3.
-
Preparing input files
To use Nextstrain for phylogenetic analysis and visualization, you need to prepare the following input files (Table 1):
-
sequences.fasta
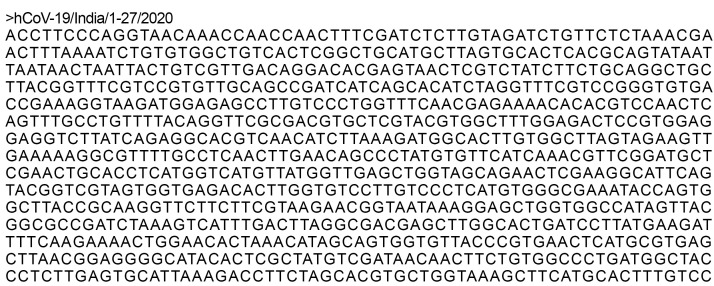
A single FASTA file containing a collection of pathogen sequences to be analyzed. For this analysis, we used the sequence dataset downloaded from GISAID. Each sequence in the FASTA file should have the strain ID of the virus as the sequence header. A sample sequence record for the FASTA file is shown in Figure 2.
-
metadata.tsv
A tab-delimited metadata file that describes the sequences given in the FASTA file. The various fields to be included in the metadata file are as follows:
-
Required fields: Strain, Virus, Date
For each strain ID in the sequences.fasta file, there should be an entry under the strain column in the metadata file.
Additional fields (if using published data): Accession, Authors, URL, Title, Journal, Paper_URL.
To infer ancestral traits, additional information fields such as region, country, state, and city need to be included in the metadata file.
The information for the various fields in the metadata file can be taken from the Acknowledgment Table downloaded from GISAID. A sample metadata spreadsheet is linked here as Supplementary Data 1.
-
-
clades.tsv
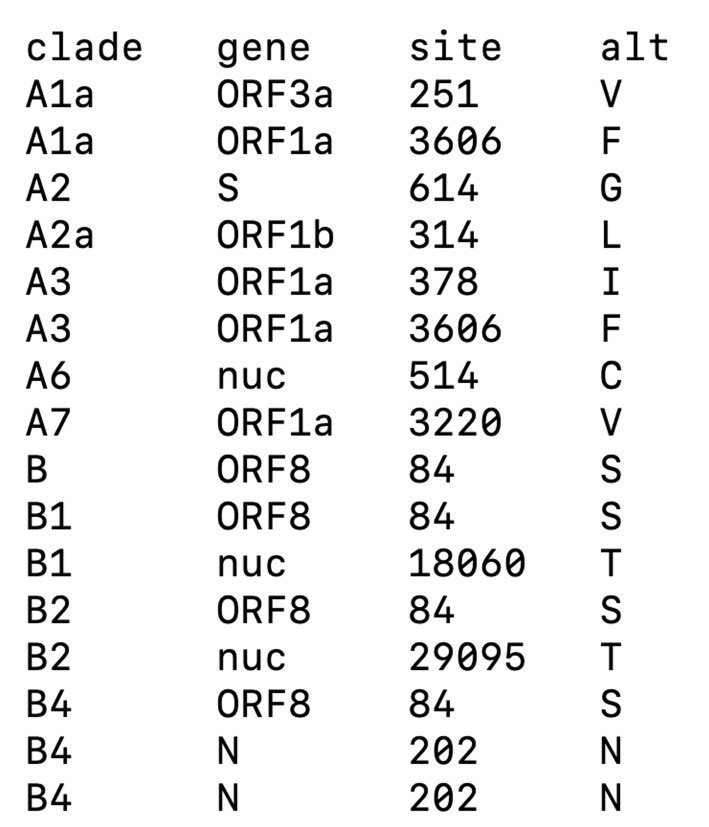
This file is required for the addition of clade labeling to the phylogenetic tree. The file specifies the mutations (amino acid or nucleotide) specific to a particular clade of the virus (Figure 3). The clades.tsv file should contain the following fields:
clade: To describe the name of a clade.
gene: The name of the gene in which the mutation lies (for nucleotide changes, the gene name should be ‘nuc’).
site: The position of the mutation within the genome.
-
alt: The mutated amino acid or nucleotide found at that position.
For this analysis, we used the clades definition for SARS-CoV-2 genomes defined by Nextstrain ( https://github.com/nextstrain/ncov ).
-
auspice_config.json
This file is needed to set various display options for visualization. A sample config file is linked here as Supplementary Data 2.
-
lat_longs.tsv
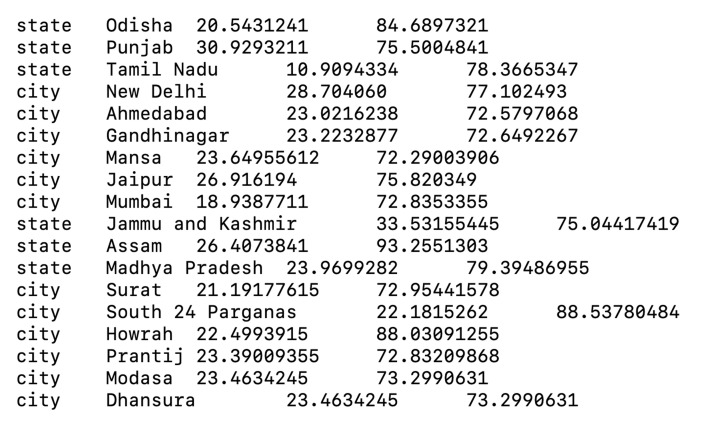
A tab-separated file containing latitudes and longitudes for all regions, countries, states, and cities in the dataset (Figure 4). This file will be used to display geographic traits during visualization.
-
Quality assessment
In this visualization, we would also like to segregate high-quality FASTA sequences in the dataset from low-quality ones. Accordingly, we added an additional field, ‘quality,’ to the metadata file. The following quality metrics define a high-quality sequence:
Percentage identity to the reference genome after pairwise alignment: >99%
Percentage of gaps in the alignment: <1%
Percentage of N (unknown nucleic acid residue) bases in the sequence: <1%
-
No degenerate bases in the sequence
Based on the above criteria, the ‘quality’ metadata field can hold the values, ‘High,’ ‘Low,’ and ‘Not Assessed.’
To visualize the quality assessment, we created an additional configuration file ‘colors.tsv,’ a tab-delimited file containing hex codes for each value of the sequence quality field that you want to represent. In this analysis, high-quality is shown in green, low-quality in red, and unassessed sequences in yellow by specifying the corresponding hex codes for the required colors in the ‘colors.tsv’ file (Figure 5).
-
Table 1. List of input files required to run the different steps in the analysis pipeline.
| File | Description |
|---|---|
| Required Input Files | |
| sequences.fasta | Collection of SARS-CoV-2 sequences to be analyzed in FASTA format |
| metadata.tsv | Tab-delimited text file describing all sequences in the sequences.fasta file |
| clades.tsv | Tab-delimited text file containing clade definitions downloaded from the Nextstrain GitHub repository |
| MN908947.gb | SARS-CoV-2 reference genome in Genbank format |
| Additional Configuration Files | |
| auspice_config.json | Text file in JSON format specifying visualization settings |
| lat_longs.tsv | Tab-delimited text file for displaying geographic traits |
| colors.tsv | Tab-delimited file containing hex colour codes for metadata elements |
| Optional Configuration Files | |
| include_file | Text file containing names of sequences to be included in the analysis regardless of other subsampling criteria |
Figure 2. Sample record for the hCoV-19/India/1-27/2020 SARS-CoV2 strain in the sequences.fasta format.
Figure 3. Summary screenshot of the clades.tsv file provided by Nextstrain for SARS-CoV-2 genomes.
Figure 4. Summary screenshot of the lat_longs.tsv file required by Nextstrain for visualizing geographic traits.
Figure 5. Summary screenshot of the colors.tsv file created for visualizing sequence quality.
Data analysis
Due to legibility and performance constraints, Nextstrain can only handle ~3,000 sequences in a single view. Since we are working with a set of ~15,000 genome sequences, we subsampled our data and analyzed them by focusing on an individual geographic region (i.e., India).
-
Filter sequences
The input sequence set can be filtered based on certain criteria and subsampled using this command. The following command will filter the SARS-CoV2 sequences based on their submission dates and group them by country, year, and month. All sequences dated prior to 2013 or possessing a missing date record will be dropped. The global data will also be subsampled to 100 sequences per country per year per month.
augur filter --sequences <sequences.fasta> --metadata <metadata.tsv> --output <filtered_ncov.fasta> --group-by country year month --sequences-per-group 100 --min-date 2013
To focus on a particular geographic region, the filter command also contains parameters that help to include or exclude certain sequences from the analysis:
--include <include_file> This constraint can be used to include sequences regardless of other subsampling criteria. For this analysis, the include_file will contain the line hCoV-19/Wuhan/WH01/2019, since we will be using this genome as the root in the phylogenetic tree. The names of any other sequences that you want to include in your analysis can be added to this file.
--exclude-where <CONDITION> This constraint will be used for focusing the analysis on a particular region.
To subsample the dataset for a single geographic region, use the following command:
augur filter --sequences <sequences.fasta> --metadata <metadata.tsv> --output <filtered_ncov_india.fasta> --exclude-where country!=India --include <include_file>
-
Alignment to the reference genome
Augur uses MAFFT to perform multiple-sequence alignments. To create an alignment file using Augur use the following command:
augur align --sequences <filtered_ncov.fasta> --reference-sequence <MN908947.gb> --output <aligned_ncov.fasta> --nthreads <2> --remove-reference --fill-gaps
For the geographic region-focused analysis, use the following command:
augur align --sequences <filtered_ncov_india.fasta> --reference-sequence <MN908947.gb> --output <aligned_ncov_india.fasta> --nthreads <2> --remove-reference --fill-gaps
-
Constructing the phylogenetic tree
Augur uses IQTREE as the default software to construct a phylogenetic tree from the multiple-sequence alignment file. The branch lengths in the tree are a measure of nucleotide divergence. The following command will generate a phylogenetic tree in Newick format (.nwk):
augur tree --alignment <aligned_ncov.fasta> --output <raw_tree_ncov.nwk> --nthreads <4>
For the geographic region-focused analysis, use the following command:
augur tree --alignment <aligned_ncov_india.fasta> --output <raw_tree_ncov_india.nwk> --nthreads <4>
-
Refining the phylogenetic tree
The raw tree constructed in the previous step can be further processed by Augur using TreeTime to adjust the branch lengths according to the sampling dates of the sequences. For this analysis, we specified the root of the tree by giving the sequence name hCoV-19/Wuhan/WH01/2019 explicitly with the --root parameter of the refine command. The --clock-rate parameter was used to run the analysis using a fixed evolutionary rate to produce a robust time-resolved phylogeny, and the --clock-filter-iqd parameter filters out genomes that do not follow the evolutionary rate or molecular clock. For SARS-CoV-2 genomes, this rate is fixed at 0.0008 or 8 × 10⁻⁴ substitutions per site per year. To produce a time-resolved tree use the following command:
augur refine --tree <raw_tree_ncov.nwk> --alignment <aligned_ncov.fasta> --metadata <metadata.tsv> --output-tree <refined_ncov_tree.nwk> --output-node-data <branch_lengths_ncov.json> --root hCoV-19/Wuhan/WH01/2019 --timetree --clock-rate 0.0008 --clock-std-dev 0.0004 --coalescent skyline --date-inference marginal --divergence-unit mutations --date-confidence --no-covariance --clock-filter-iqd 4
For the geographic region-focused analysis, use the following command:
augur refine --tree <raw_tree_ncov_india.nwk> --alignment <aligned_ncov_india.fasta> --metadata <metadata.tsv> --output-tree <refined_ncov_tree_india.nwk> --output-node-data <branch_lengths_ncov_india.json> --root hCoV-19/Wuhan/WH01/2019 --timetree --clock-rate 0.0008 --clock-std-dev 0.0004 --coalescent skyline --date-inference marginal --divergence-unit mutations --date-confidence --no-covariance --clock-filter-iqd 4
-
Annotating ancestral traits
Augur can use the time tree to infer the region and country of all internal nodes. The ancestral traits for all nodes can be annotated using the following command:
augur traits --tree <refined_ncov_tree.nwk> --metadata <metadata.tsv> --output <ncov_traits.json> --columns region country --confidence --sampling-bias-correction 2.5
For the geographic region-focused analysis, use the following command:
augur traits --tree <refined_ncov_tree_india.nwk> --metadata <metadata.tsv> --output <ncov_traits_india.json> --columns city --confidence --sampling-bias-correction 2.5
-
Inferring ancestral sequences and nucleotide mutations
The following command will identify the nucleotide mutations of the branches of the tree and infer the ancestral strain of each node:
augur ancestral --tree <refined_ncov_tree.nwk> --alignment <aligned_ncov.fasta> --output-node-data <ncov_nt_muts.json> --inference joint --infer-ambiguous
For the geographic region-focused analysis, use the following command:
augur ancestral --tree <refined_ncov_tree_india.nwk> --alignment <aligned_ncov_india.fasta> --output-node-data <ncov_nt_muts_india.json> --inference joint --infer-ambiguous
-
Inferring amino acid mutations
The following command will identify the amino acid mutations using the reference genome and ancestral sequences:
augur translate --tree <refined_ncov_tree.nwk> --ancestral-sequences <ncov_nt_muts.json> --reference-sequence <MN908947.gb> --output <ncov_aa_muts.json>
For the geographic region-focused analysis, use the following command:
augur translate --tree <refined_ncov_tree_india.nwk> --ancestral-sequences <ncov_nt_muts_india.json> --reference-sequence <MN908947.gb> --output <ncov_aa_muts_india.json>
-
Identifying clades
The following command will label clades within the dataset using the nucleotide and amino acid mutations specified in the clades.tsv file:
augur clades --tree <refined_ncov_tree.nwk> --mutations <ncov_aa_muts.json> <ncov_nt_muts.json> --clades <clades.tsv> --output-node-data <ncov_clades.json>
For the geographical region-focused analysis, use the following command:
augur clades --tree <refined_ncov_tree_india.nwk> --mutations <ncov_aa_muts_india.json> <ncov_nt_muts_india.json> --clades <clades.tsv> --output-node-data <ncov_clades_india.json>
-
Exporting output files for visualization
The following command will export all output files generated in the previous steps of the analysis as a single JSON file to visualize the data using Nextstrain:
augur export v2 --tree <refined_ncov_tree.nwk> --metadata <metadata.tsv> --node-data <branch_lengths_ncov.json> <ncov_aa_muts.json> <ncov_nt_muts.json> <ncov_traits.json> <ncov_clades.json> --auspice-config auspice_config.json --lat-longs lat_longs.tsv --colors colors.tsv --output auspice/COVID_global.json
For the geographic region-focused analysis, use the following command:
augur export v2 --tree <refined_ncov_tree_india.nwk> --metadata <metadata.tsv> --node-data <branch_lengths_ncov_india.json> <ncov_aa_muts_india.json> <ncov_nt_muts_india.json> <ncov_traits_india.json> <ncov_clades_india.json> --auspice-config auspice_config.json --lat-longs lat_longs.tsv --colors colors.tsv --output auspice/COVID_india.json
Viewing the data
To visualize the output, use the following command:
nextstrain view auspice/ --allow-remote-access
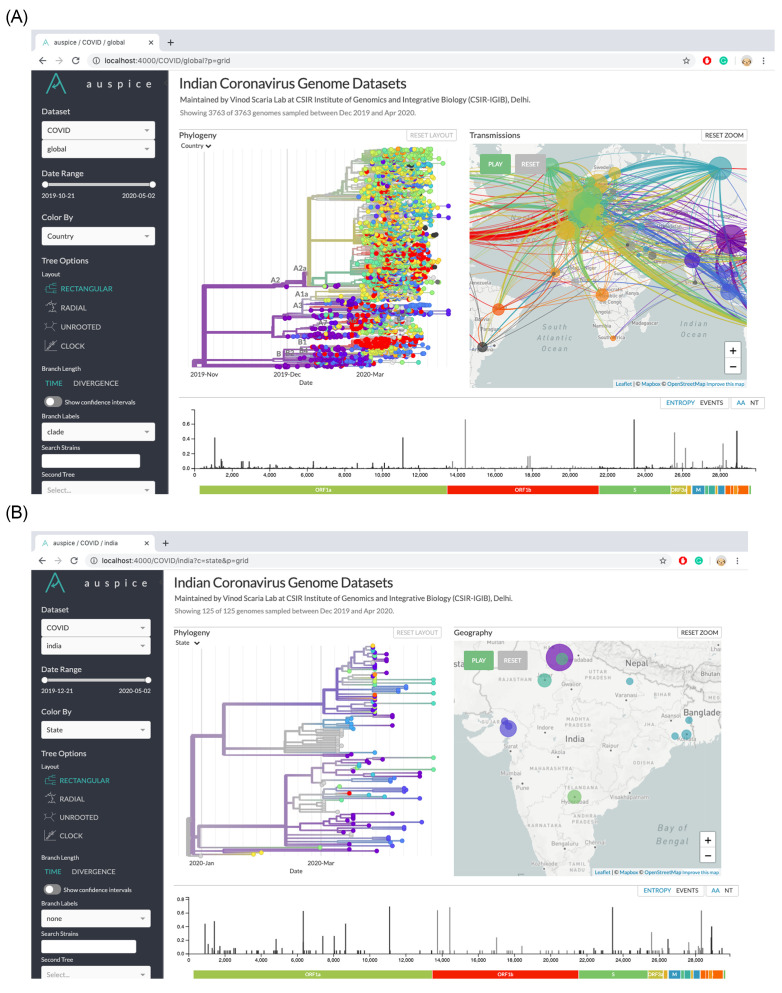
This command will start the Auspice server on port 4000. The output can then be visualized through a browser by navigating to http://127.0.0.1:4000/ or using the IP address of the machine on which the Auspice service is running and navigating to http://IP_ADDRESS_OF_MACHINE:4000/ . The different subsampled datasets can be found under the ‘Dataset’ dropdown menu (Figure 6).
Figure 6. Screenshot of the visualization produced by Nextstrain for the COVID_global and COVID_india datasets.
Note: For the links, the user will need to follow the steps given in the protocol. The hyperlinks correspond to a locally operated server through 'Auspice' (installation and instructions are detailed in the protocol), which helps the user to view the phylogeny on their own system through a browser.
Acknowledgments
This protocol is adapted from the Nextstrain project ( Hadfield et al., 2018 ). The authors acknowledge help from Mukta Poojary and Aastha V to evaluate this protocol. The present work was funded by the Council of Scientific and Industrial Research (CSIR India) through grants given to Vinod Scaria, CSIR-IGIB. BJ acknowledges a GATE Fellowship from the Council of Scientific and Industrial Research. The funders played no role in the preparation of the manuscript or the decision to publish. The authors declare no competing interests.
Citation
Readers should cite both the Bio-protocol article and the original research article where this protocol was used.
Supplementary Data.
References
- 1. Angeletti S., Lo Presti A., Giovanetti M., Grifoni A., Amicosante M., Ciotti M., Alcantara L. J., Cella E. and Ciccozzi M.(2016). Phylogenesys and homology modeling in Zika virus epidemic: food for thought. Pathog Glob Health 110(7-8): 269-274. [DOI] [PMC free article] [PubMed] [Google Scholar]
- 2. Babakir-Mina M., Ciccozzi M., Ciotti M., Marcuccilli F., Balestra E., Dimonte S., Perno C. F. and Aquaro S.(2009). Phylogenetic analysis of the surface proteins of influenza A(H5N1) viruses isolated in Asian and African populations. New Microbiol 32(4): 397-403. [PubMed] [Google Scholar]
- 3. Hadfield J., Megill C., Bell S. M., Huddleston J., Potter B., Callender C., Sagulenko P., Bedford T. and Neher R. A.(2018). Nextstrain: real-time tracking of pathogen evolution. Bioinformatics 34(23): 4121-4123. [DOI] [PMC free article] [PubMed] [Google Scholar]
- 4. Huang C., Wang Y., Li X., Ren L., Zhao J., Hu Y., Zhang L., Fan G., Xu J., Gu X. et al. (2020). Clinical features of patients infected with 2019 novel coronavirus in Wuhan, China. Lancet 395(10223): 497-506. [DOI] [PMC free article] [PubMed] [Google Scholar]
- 5. Katoh K. and Standley D. M.(2013). MAFFT multiple sequence alignment software version 7: improvements in performance and usability. Mol Biol Evol 30(4): 772-780. [DOI] [PMC free article] [PubMed] [Google Scholar]
- 6. Nguyen L. T., Schmidt H. A., von Haeseler A. and Minh B. Q.(2015). IQ-TREE: a fast and effective stochastic algorithm for estimating maximum-likelihood phylogenies. Mol Biol Evol 32(1): 268-274. [DOI] [PMC free article] [PubMed] [Google Scholar]
- 7. Salemi M., de Oliveira T., Ciccozzi M., Rezza G. and Goodenow M. M.(2008). High-resolution molecular epidemiology and evolutionary history of HIV-1 subtypes in Albania. PLoS One 3(1): e1390. [DOI] [PMC free article] [PubMed] [Google Scholar]
- 8. Shu Y. and McCauley J.(2017). GISAID: Global initiative on sharing all influenza data- from vision to reality. Euro Surveill 22(13). [DOI] [PMC free article] [PubMed] [Google Scholar]
- 9. Zhu N., Zhang D., Wang W., Li X., Yang B., Song J., Zhao X., Huang B., Shi W., Lu R., Niu P., Zhan F., Ma X., Wang D., Xu W., Wu G., Gao G. F. and Tan W.(2020). A Novel Coronavirus from Patients with Pneumonia in China, 2019. N Engl J Med 382(8): 727-733. [DOI] [PMC free article] [PubMed] [Google Scholar]
Associated Data
This section collects any data citations, data availability statements, or supplementary materials included in this article.


