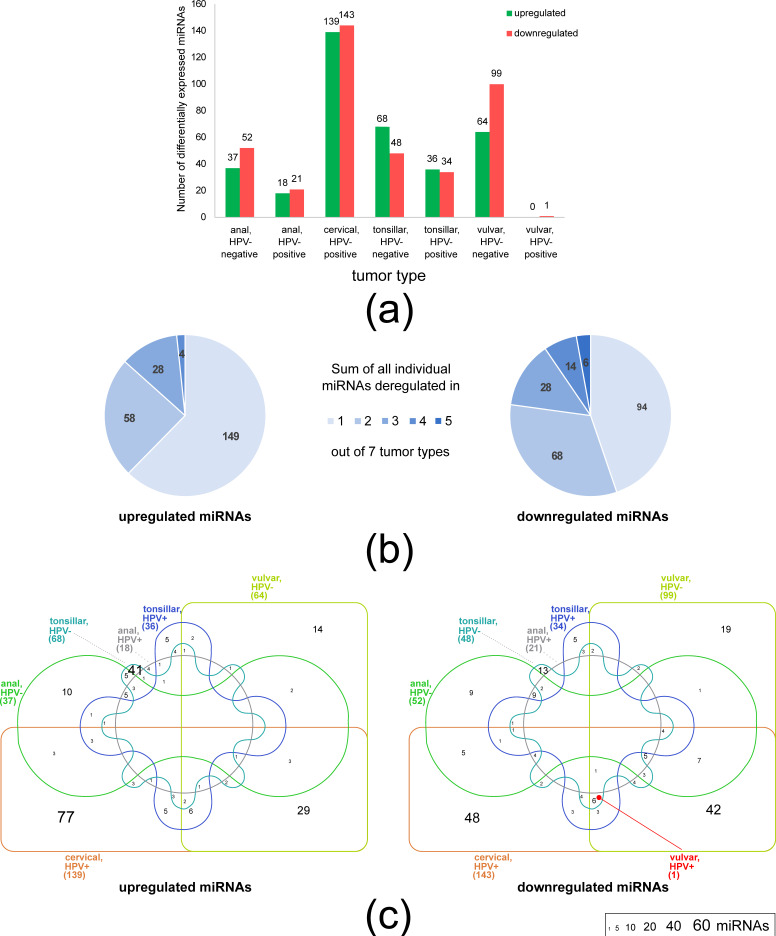
Figure 2.
DE of miRNAs in tumors of different locations and HPV status. (a) Total numbers of differentially expressed miRNAs in each of the seven analyzed tumor types. (b) The miRNAs that exhibited shared deregulation across the seven studied tumor types. The values denote the total numbers of miRNAs which were deregulated specifically in one tumor type and those whose deregulation was common to two, three, four, or five tumor types. No miRNAs were deregulated in more than five tumor types. (c) Venn diagrams depicting the numbers of unique and shared differentially expressed miRNAs among the seven studied tumor types. The font size range is denoted in the legend. Zero values were omitted. The placement of the sole miRNA deregulated in HPV-positive vulvar tumors (MIR451A) is marked with a red dot. DE values were calculated with respect to normal tissues and filtered (FC ≥ 2.0, padj ≤ 0.1; see Materials and Methods). For DE values of individual miRNAs, see Table S3. Venn diagrams were created using InteractiVenn [79].

