

Abstract
Widespread implementation of Adverse Childhood Experiences (ACEs) screening is occurring in the United States (U.S.) in response to policies and practice recommendations. However, limited research has established how these screening efforts impact the healthcare system and ultimately health outcomes. This paper examines the current knowledge base on screening in medical settings. A scoping review of articles reporting on ACEs screening and prevalence in the U.S. was conducted. Of 1,643 unique studies across two decades, twelve articles meeting criteria included 9 on routine screening in medical settings and 3 on population-based surveys. A Monte Carlo simulation model was designed to synthesize evidence, identify key areas of uncertainty, and explore service system implications. Results indicated significant heterogeneity in the proportion of respondents who reported ACEs, with 6% to 64% of patients reporting 1+ ACEs and .01% to 40.7% reporting 4+ ACEs. Gaps in the literature were identified regarding cut-scores for referrals and referral completion rates. Three scenarios, modeled based on these data and past research on behavioral health screenings in pediatric primary care, demonstrated how ACEs screening may differentially impact behavioral healthcare systems. Priorities for future research were highlighted to refine estimates of the likely impact of ACEs screening on healthcare delivery.
Keywords: ACEs screening, implementation, simulation modeling, behavioral healthcare
Editor’s note.
This article is part of a special issue, “Adverse Childhood Experiences (ACEs): Translation to Action,” published in the February–March 2021 issue of American Psychologist. Sharon G. Portwood and Michael J. Lawler served as editors of the special issue, with Michael C. Roberts as advisory editor.
Increasingly, screening for adverse childhood experiences (ACEs) is being recommended within pediatric and adult primary care in the United States (U.S.) to prevent and treat the negative sequelae associated with ACEs (Koita et al., 2018). For example, in the state of California, a recent law provides reimbursement for ACEs screening in the Medicaid population and trainings for pediatric and adult primary care providers (PCPs) are being offered to encourage uptake and use (ACEs Aware, 2020; Underwood, 2020). These implementation efforts are occurring in the context of ongoing debate about the utility of ACEs screening (Barnes et al., 2019; Campbell, 2020; Dube, 2018; Finkelhor, 2018). Proponents argue that screening can lead to earlier detection of patients at risk of mental and physical health challenges, inform relevant referrals and follow-up, encourage supportive relationships with clinicians, prevent ACEs in children, (Bethell, Solloway et al., 2017; Koita et al., 2018), and contain costs by reducing “super spenders” in healthcare systems (Grimes, 2017; Miller et al., 2020). In turn, others have emphasized the challenges of implementing ACEs screening; including the difficulty of referral decisions after positive screens (especially in the absence of current symptoms), inadequate referral sources for behavioral health care and other resources to address adversities and other social determinants of health, and concerns that ACEs screening could be harmful, including increasing stigma or negative expectancies for patients with high ACEs (Barnes et al., 2019; Campbell, 2020; Finkelhor, 2018).
Evidence-Base for ACEs Screening
Large-scale survey studies
Interest in screening for ACEs began with research conducted within the Kaiser Permanente Healthcare System (KP) in collaboration with the Centers for Disease Control and Prevention (CDC), which demonstrated that among adults ACEs are extremely prevalent and associated with lasting health consequences (Felitti et al., 1998). In this study, surveys were sent to members of KP’s large health maintenance organization, with more than 17,000 respondents. Approximately 60% of participants reported at least one of the ten ACEs items related to abuse (i.e., physical, sexual, and emotional), neglect, or household dysfunction (i.e., household mental illness, household substance use, incarcerated household member, parental separation or divorce, or household domestic violence) and 12.5% reported 4+ ACEs. Subsequently, the Behavioral Risk Factor Surveillance System (BRFSS), a nationally representative telephone survey conducted by the CDC, included eight ACEs questions as an optional module for states. In this larger, more demographically diverse sample, reported prevalence of ACEs was shown to be similarly high, with 61.5% reporting 1+ ACE and 16.5% reporting 4+ ACEs (Merrick et al. , 2018). While both of these studies were conducted with adults, the National Survey of Children’s Health (NSCH) provides national prevalence data for children with questions about 9 different ACEs (abuse and neglect categories were not included). The NSCH survey was administered to the caregivers of 50,212 children ages 0-17 years, 46.3% of whom reported their child was exposed to at least one ACE (Bethell, Davis et al., 2017).
ACEs Screening in Medical Settings
Research specific to screening for ACEs has primarily focused on the feasibility and acceptability of implementing routine screening, with a recent scoping review on adult ACEs screening identifying 15 articles (Ford et al., 2019). This review found that research to date has predominately focused on provider and patient perspectives on the acceptability and feasibility of ACEs screening, with no studies reporting on service utilization as a result of screening. The authors conclude that additional research is needed to elucidate the impact of the screening tools used, referrals for positive screening, uptake of referrals, the impact on workload for the healthcare system, and consequences on health outcomes. Notably, this review did not include pediatric populations, which are often targets for ACEs screening. For example, the Healthy Steps program screens infants and their parents for ACEs to inform referrals for intensive behavioral health services (Briggs et al., 2016). Screening in children is preliminary, as ACEs by definition accumulate over time, but it has the potential to prevent additional ACEs and prevent or reduce negative sequelae. In practice, California policy recommends that ACEs screening lead to personalized treatment plans for children and adults, including linkage to resources that promote safe and supportive relationships, regular exercise, good sleep hygiene, and healthy nutrition, as well as mental health treatment if indicated. Thus, these recommendations acknowledge the need for cross-sector collaborations across medical providers, behavioral healthcare, and social services. Yet, there are currently no published estimates of the impact that widespread ACEs screening may have on the availability of these limited resources.
Behavioral Health Screening
Given evidence gaps with respect to ACEs screening, the potential impact on behavioral healthcare delivery can be informed by prior behavioral health screening research. For example, systematic reviews conducted by the U.S. Preventive Services Task Force on screening for problems that include autism and depression provide evidence-based determinations regarding the balance of harms and benefits attributable to screening (Siu, 2016; Siu et al., 2016). Although considered a gold standard, large trials that randomly assign patients to either receive screening or not are seldom available. Therefore, recommendations are typically based on evidence supporting the accuracy of screening questionnaires and the effectiveness of screening at linking patients to available and effective services. Prior screening models suggest that multiple factors directly influence the number of patients who seek and complete referrals, including 1) the number of patients who complete screenings, 2) prevalence, 3) the accuracy of the screening instrument, 4) clinical decisions about when to refer to services, and 5) uptake of referrals (Fryback & Thornbury, 1991; Sheldrick et al., 2015; Sheldrick, Leslie, Hyde, & Mackie, 2019).
ACE-specific research offers evidence about only some of these variables. For example, various demographic, social, and economic factors influence the prevalence of ACEs within a patient population, including age, geographic location (for example, some areas may be more likely to experience community violence), and socioeconomic status (Crouch et al., , 2019; Kuhlman et al. , 2018; Merrick et al., 2018). Furthermore, belonging to a population that faces interpersonal and systemic discrimination, as is true of ethnic and racial minority populations, is associated with greater risk of ACEs (Liu et al., 2019; Merrick et al., 2018).
ACE-specific findings can be supplemented by research on other types of pediatric screening. For example, past research on behavioral health screening offers evidence on rates of referral and referral completion (Gleason et al., 2016; Wissow et al., 2013). Research also suggests that reported prevalence of ACEs in medical screenings is influenced by contextual factors such as willingness to disclose as well as the actual prevalence in the patient population. Disclosure rates may differ based on trust of the provider and how the measure is administered, including whether the measure is completed by a caregiver or their child, where the measure is administered (i.e., waiting room or in private), and whether responses to individual items or only a total summary score (i.e., de-identified) is requested (Nguyen et al., 2019; Purewal et al., 2016). For example, California allows providers to choose if they want to have patients report on individual items or provide a “de-identified score,” with the resource website stating that the, “de-identified format may facilitate higher rates of disclosure and greater patient comfort in pediatric settings” (ACEs Aware, 2020). Finally, screening typically includes the use of a cut-off score to guide referrals to resources, including behavioral health. Under new policy changes, California recommends follow-up and referrals for patients with 4 or more ACEs or 1-3 ACEs and associated symptoms (ACEs Aware, 2020). However, others (Finkelhor, 2018) suggest that mental health treatment is not indicated for those with high ACEs but no symptoms. Given the limited data on how ACEs screening impacts healthcare service, it is important to understand the current state of the science to inform the large-scale implementation efforts that are occurring.
Study Objectives
Historically, screening for a wide range of conditions has been widely implemented despite unresolved debates regarding effectiveness (Siu et al. 2016). Likewise, ACEs screening is being implemented throughout California despite unresolved debates in the research literature (Dube, 2018; Finkelhor, 2018). The overarching objective of this paper is to synthesize what is known about ACEs screening in medical settings and leverage that knowledge to improve care for impacted individuals. First, the methods and results of a scoping review on ACEs screening are presented. The objectives of the scoping review were to (1) compare reported prevalence of ACEs between survey-based population studies and screening procedures and (2) describe procedures and outcomes of ACEs screening in medical settings. Next, methods and results are presented from simulation models of screening and intervention for pediatric behavioral health problems, which were informed by the scoping review. The objectives of the simulation models were to demonstrate (1) the range of potential outcomes that may result from implementation of ACEs screening, (2) the utility of existing data to inform specific decisions necessary for implementation, and (3) evidence gaps that can be addressed to demonstrate effectiveness and promote further systems improvement.
Scoping Literature Review
Method
Search Strategy and Eligibility Criteria
The study followed recommendations for scoping review methodology (Arskey & O’Malley, 2005; Levac & Colqhoun, & O’Brien, 2010). The scope of inquiry was to identify empirical research from January 1998 to April 2019 that reported results of ACEs screening within medical screening. Because the research question focused on how reported prevalence rates based on routine screening in medical practices compared with epidemiological surveys of ACEs within the U.S., we included broad search terms of “Adverse Childhood Experiences” and “Adverse Childhood Events.” We searched PsycINFO and PubMed on April 10, 2019. To be included, studies needed to: 1) report on ACEs screening within medical settings or one of the three large population-based surveys in the U.S. (i.e., KP-CDC, BRFSS, and the NSCH), 2) include self or caregiver report of at least four ACEs, 3) report at least two out of three domains of ACEs (i.e., abuse, household dysfunction, community violence), 4) report prevalence of ACEs, and 5) include at least 100 participants. Results from screening studies were compared to those reported from survey-based research conducted in the U.S. In cases where multiple articles written on each survey study (e.g., KPCDC = 39 articles) reported different sample sizes (and also variations in the prevalence reported), we extracted prevalence rates from the earliest article with the full sample. All searches were entered into Covidence (2019), online software for systematic reviews that tracks duplicates, screening results, and data extraction.
First, abstracts and titles were screened for inclusion criteria. To ensure reliability in screening, four coders double-screened the first 60 articles and met to reach consensus and clarify screening rules. Agreement was 93% based on screening, and consensus was reached on the four articles with disagreements. Then coders screened all titles and abstracts to identify relevant articles. The full-text of remaining articles were reviewed, with specific attention to the methods section, to guarantee that articles met all inclusion criteria. Reviewers met regularly throughout the abstract and full-text review process to discuss any challenges or uncertainties related to study selection. In order to identify other potentially relevant studies, reference lists and works citing the studies meeting eligibility were reviewed following initial screening in January 2020. Three additional articles meeting eligibility criteria were identified.
Data Extraction and Coding Procedures
A codebook with definitions of each construct was created. At least two coders independently reviewed and extracted data from each article. Consensus meetings were held between the coders to determine final codes.
Results
Of 1,643 unique studies that were screened, nine articles met the inclusion criteria for screening in medical settings and three articles were included that reported on prevalence within the KP-CDC, BRFSS, and NSCH samples. The flow of studies from initial search to ultimate inclusion in the final sample is included in Figure 1. Table 1 describes characteristics of the medical screening studies, including the clinics, patients, screeners used, and reported prevalence in each study. Note that only one study reported confidence intervals, so we estimated 95% confidence intervals using a binomial distribution.
Figure 1.
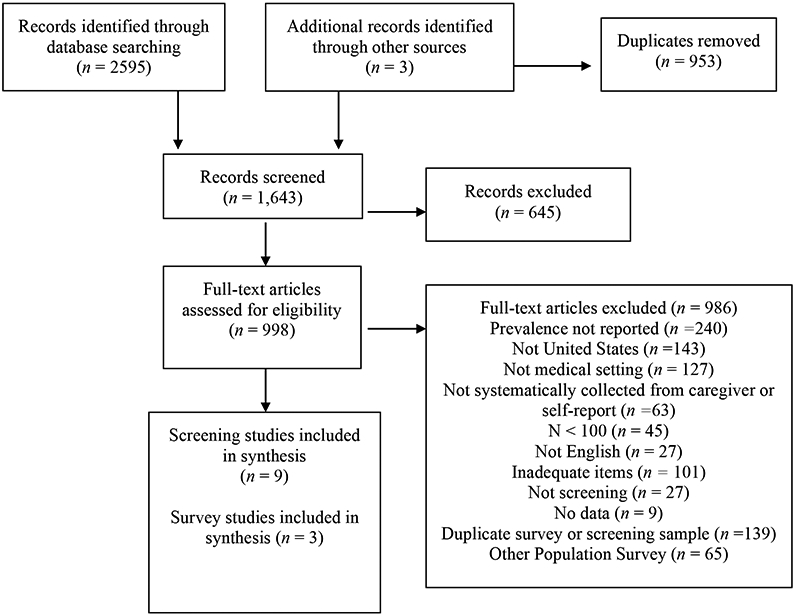
PRISMA Flow Diagram of Literature Search and Selection Process
Table 1.
Medical Screening Study Characteristics and ACEs Prevalence
| Flanagan 2018 | Gillespie 2017 | Glowa 2016 | Kia-Keating 2019 | Koball 2019 | Marcus 2009 | Marie-Mitchell 2019 | Marsicek 2019 | Selvaraj 2019 | ||||
|---|---|---|---|---|---|---|---|---|---|---|---|---|
| Clinic Characteristics | ||||||||||||
| Clinic Type | Prenatal | Pediatrics | Primary Care | Pediatrics | Behavioral Health | STD Clinic | Pediatrics | Pediatrics | Pediatrics | |||
| Primary Insurance | Private | Private | NR | Medicaid | Private/ State/ Uninsured | NR | Medicaid | NR | Medicaid | |||
| Patient Characteristics | ||||||||||||
| N | 355 | 2283 (460*) | 111 | 151 | 2083 | 528 | 549 | 1206 | 2569 (642*) | |||
| Gender (Female) | 100% | NR | 61% | 50.3% (infant) | 68% | NR | 47% | NR | 48% | |||
| Age Group | Adult | Adult | Adult | Child/ Adult | Adult | Adult | Child | Child | Child | |||
| Age Range | 18+ | NR | 19-87 | 3-11 months | NR | NR | 5-11 | NR | 0-17 | |||
| Race/ Ethnicity | ||||||||||||
| White | 41.4% | 52.2% | NR | NR | 95.2% | NR | NR | NR | 7.6% | |||
| Black | 16.3% | 3.1% | NR | NR | NR | NR | NR | NR | 54.9% | |||
| Latinx | 25.9% | 30.5% | NR | 76.8% | NR | NR | 65% | NR | 21.4% | |||
| Asian American | 13.5% | 8.7% | NR | NR | NR | NR | NR | NR | 4.7% | |||
| Other/ Unknown | 2.8% | 20.2% | NR | 23.1% | 3.1% | NR | NR | NR | 11.4% | |||
| Screener Characteristics | ||||||||||||
| Name | BRFSS+ | ACE-10 ACE-14 | ACE-10 | Center for Youth Wellness+ | ACE-10 | Conflicts Tactics Scale+ | Whole Child Assessment | Center for Youth Wellness | ASK Tool | |||
| # of items | 8 | 10 (14+) | 10 | 19 | 10 | 14 | 19 | 17-19 | 13 | |||
| Reporter | Self | Self | Self | CG | Self | Self | CG | CG <12 Self >12 | CG | |||
| Scoring | Total | Item | Total | Total | Total | Total | Item | Item | Total | Item | ||
| Completion | 78% | NR | NR | 87% | 92.1% | 28% | 31.1% | 32.5% | NR | 46.9% | 56% | |
| Prevalence | CG | Infant | AN | CO | ||||||||
| 0 | 54% | 53% | 52% | 38% | NR | 81.4% | 22% | 36.5% | 47.6% | NR | 52%^ | 94.1% |
| 1+ | 46% | 47% | 48% | 62% | NR | 18.6% | 79% | 46.3% | 38.8% | NR | 48%^ | 5.9% |
| 3+ | 18% | NR | NR | NR | 27.8% | 1.3% | NR | NR | NR | 15.5% | 19%^ | 0.2% |
| 4+ | NR | 8% | 11% | 22% | 23.2% | .01% | 40.7% | 17.3% | 13.6% | NR | 12% | NR |
| Follow-Up | ||||||||||||
| Cut-Off | NR | NR | NR | Infant = 1+ CG = 2+ | NR | NR | NR | 4+ | NR | |||
| Response | Resource List Referrals | Resource List | NR | Wellness Navigation Parent Program | Receiving behavioral health | NR | NR | Resource List Referrals | Resource List Referrals | |||
Note.
= Modified version
= patients with demographic information
= estimated based on bar graph, NR = Not reported, AN = Anonymous, CO = Confidential, CG = Caregiver
Characteristics of Medical Settings
ACEs screening was conducted in various settings, including adult primary care, adult integrated behavioral health, prenatal, sexual health, and pediatric clinics. Of the studies that reported on insurance, two identified as primarily serving clients with private insurance, three predominately served clients with Medicaid, and one study had a nearly even representation of individuals with private, state, and no insurance. We noted considerable clinical heterogeneity that may influence results. For example, Kia-Keating et al. (2019) reported implementation of ACEs screening in the context of broader practice change, including increased provision of embedded behavioral health services (i.e., wellness navigation and parenting interventions). In contrast, Marie-Mitchell et al. (2019) reported on implementing ACEs screening without concurrent efforts to change behavioral health care access. Given that prior system dynamics modeling based on systematic reviews of behavioral health screening suggest that accessibility of behavioral health services may influence referral decisions, we note that clinical heterogeneity of this kind may contribute to statistical heterogeneity (Sheldrick et al., 2016).
Patient Samples
The sample sizes ranged from 111 to 2,569 patients screened. Adults were screened in six studies, with two studies screening caregivers at their infant’s well-child visit. Children were screened in a total of four studies, with one study screening infants, one study screening 5 to 11 year olds, and two studies screening all ages. The racial/ethnic diversity of patients was reported in 6 studies, ranging from predominately non-Hispanic White to predominately patients of color.
Screening Measures and Procedures
Different screening measures were used across the studies, ranging from 8 to 19 items in length. The most frequently-used screeners were the 10-item version from Felitti and colleagues’ (1998) original ACEs study for adults, and an extended pediatric version by the Center for Youth Wellness (Purewal et al., 2016), which adds adverse community experiences, including bullying, discrimination, neighborhood violence, or separation from caregivers.
Administration methods varied widely. Self-report was used for screening adults and adolescents and caregiver report was used when screening children under age 12. Scoring methods and thresholds also varied. Five studies had patients report only “de-identified” total scores, whereas three studies had patients report item-by-item responses. After noting that prevalence of ACEs was lower than would be expected based on the state BRFSS, one study switched from item-level to “de-identified” score reporting (Gillespie et al., 2017). Another study by Marcus et al. (2009) investigated differences in reporting when screeners were anonymous (i.e., not linked to any patient information and therefore not shared with the provider) versus confidential (included in a confidential field in the patient’s medical chart).
Screening Outcomes
Screening Completion Proportions.
Among the seven studies that reported relevant data, completion proportions varied widely, ranging from 28% to 92.1% of eligible patients who completed the ACEs screener. Challenges with workflow and patient refusal to complete screenings were identified as reasons for poor completion rates. Facilitators to higher screening rates included providing all staff training, organizational support, and developing workflows regarding administration of the ACEs screener and the follow-up plan.
ACEs Reported Prevalence Rates.
Prevalence of self-reported ACEs was also investigated to identify if patient reports based on medical screenings were consistent with population-based studies. Figure 2 depicts results. Reported prevalence of ACEs varied across studies, ranging from 6% to 64% of patients reporting 1+ ACEs and .01% to 40.7% of patients reporting 4+ ACEs. As expected (given that they had less time in which to be exposed), the proportion of infants and children with reported ACEs was generally smaller than that of adult retrospective reports. This finding includes one study that assessed both infants and adults and found that while 23.2% of parents reported that they themselves had experienced 4 or more ACEs, only 0.01% of parents reported that their infants had 4 or more ACEs (Kia-Keating et al., 2019). Another study of children ages 0-17 found that only 0.2% of parents reported that their children had 3+ ACEs (4+ ACEs were not reported; Selvaraj et al., 2019). Interestingly, somewhat higher prevalence was reported when screening was administered anonymously, meaning that data were never linked to the patient (46.3% reported 1+ ACEs), than when the provider knew the patient’s responses (38.8% reported one or more ACEs; Marcus et al., 2009). The highest prevalence rates of 1+ (79%) and 4+ ACEs (40.7%) were reported when screening happened in the context of a behavioral health clinic (i.e., consultation or referrals to the affiliated outpatient clinic; Koball et al., 2019; not included in Figure 2 as screening did not take place in primary care). The fact that confidence intervals for prevalence estimates in different studies seldom overlapped offers evidence that self-reported prevalence is sensitive to context.
Figure 2.

Proportion of population reporting different numbers of ACEs in population surveys and screening-based studies in primary care settings.
Follow-Up Procedures.
Across studies, limited information was provided on follow-up to positive ACEs screens. Only two studies reported the cut-off for when referrals to services would be made. Six studies reported details regarding their follow-up procedure, which most frequently involved providing individuals with resource lists, including parenting classes, behavioral health services, childcare, and other social services. Four studies referenced making additional referrals to social work, parenting interventions, behavioral health, or psychiatry. ACE-related referrals were made in 2% of well-child visits in one pediatric study (Selvaraj et al., 2019). In another study, which sought to promote resiliency with prevention interventions focused on positive parenting, patients were eligible if the infant had 1+ ACE and/or the caregiver had 2+ ACEs. Of the patients screened, 47% were referred to parenting programs as part of a research study, with 77.5% of patients enrolling in services (Kia-Keating et al., 2019).
Simulation Models
Method
Natural History Model
A natural history model was developed to represent the expected proportion of children who would exceed the recommended threshold of 4+ ACEs at any given age as the primary outcome of interest. Consistent with past evidence demonstrating that ACEs are interrelated and that the presence of one ACE significantly increases the risk of an additional ACE (Dong et al., 2004), a simple simulation model was developed, in which all children are born with a given probability of experiencing an ACE in their first year of life. Thereafter, their chance of having an additional ACE as they age is a function of the number of ACEs they have already accrued (for child i, the probability of an ACE in time t = p * xACEs(i)).
Behavioral Healthcare Delivery Model (hereafter, “delivery model”)
A simulation model was developed to represent the process by which screening leads to delivery of behavioral healthcare services. Originally designed to address the needs of state-level policy-makers working to implement trauma-informed screening, this model simulates demand for treatment that results from screening as well as workforce capacity to provide that treatment (Author). Below, we describe the model’s structure, outcomes, and parameters. To estimate variability in potential outcomes, twenty Monte Carlo simulations were conducted.
Delivery Model Structure.
The delivery model is comprised of several submodels, beginning with two separate screening submodels that determine demand for behavioral health treatment—one for children with the target condition (hereafter, high ACEs), and the other for children without the target condition (hereafter, low ACEs; see Figure 3). Structure is identical across submodels for both high and low ACEs groups, regarding steps in the process (i.e., screening, prevalence, referrals, and referral completion. However, parameters can vary to reflect different experiences of the same process, including the number of children screened each month, the probability of screening positive and of engaging in treatment given a positive score. In turn, a separate workforce submodel simulates the availability of appointments as a function of (a) workforce size (i.e., the number of treatment providers) and (b) provider capacity (i.e., the number of patients a provider can treat per week). The number of treatment providers at any given time is influenced by the “quit rate” (i.e., turnover) and “hiring rate.” Notably, waitlists emerge at the intersection of the screening and workforce submodels whenever demand for appointments exceeds the capacity of the workforce to supply appointments.
Figure 3.
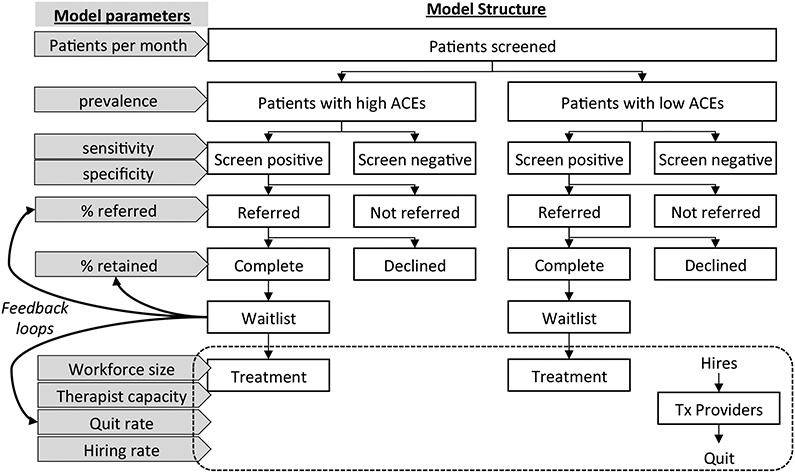
Simulation Model Structure
Delivery Model Outcomes.
The model facilitates estimation of a number of outcomes that are of interest to clinicians and policy-makers, including the proportion of children with and without ACEs who receive treatment (i.e., process sensitivity and false positive rate, respectively), demand for services (i.e., the number of children who are in need of services each month), capacity for services (i.e., the number of children to whom treatment can be successfully delivered each month), and waitlists. Equally important, the model highlights the degree to which estimates are sensitive to prior assumptions, including assumptions about parameters (e.g., prevalence, sensitivity and specificity of the screening questionnaire, and probability of referral conditional on screening result) but also regarding model structure (e.g., whether the model accounts for referrals subsequent to negative screens) and scope (e.g., focus on behavioral healthcare delivery). To facilitate use by a wider audience, the simulation model was executed in Microsoft Excel and is included in Supplemental Materials.
Delivery Model Parameters.
As is common in simulation modeling, our expectation was that available evidence would be insufficient to fully specify the model. We identified direct evidence about ACEs screening to inform model parameters based on prior literature and the scoping review. When direct evidence was unavailable, we sought indirect evidence, for example from prior reviews and professional recommendations for pediatric screening (Gleason et al., 2016; Wissow et al., 2013). When no direct or indirect evidence was available to inform parameter estimates, we calibrated the model to develop credible estimates. For example, lacking evidence on the size and dynamics of the workforce needed to provide follow-up care, we anticipated the need to calibrate a model to achieve equilibrium under various assumptions regarding current practices for screening and referral and subsequent waitlist for services.
The scoping review documented significant evidence gaps. For example, heterogeneity in the proportion of respondents who report ACEs across studies suggests that no one simulation model is likely to offer valid representation of demand across all settings. Moreover, the proportion of respondents who report ACEs is sensitive to how the screener is administered and to the sensitivity and specificity of the questionnaire. Therefore, we used the following strategy with the goal of elucidating delivery system dynamics. First, we generated a baseline model (Scenario A) designed to depict behavioral health screening in a typical healthcare system. Next, we relied on results of the scoping review to develop two alternative scenarios that might plausibly reflect implementation of ACEs screening and compared how these scenarios would impact demand for behavioral healthcare as compared to the baseline scenario.
Scenario A: Baseline.
To estimate parameters for the baseline scenario, we relied on prior literature on pediatric behavioral health screening to choose values consistent with a high-quality screening process. Thus, we assumed an accurate screener (e.g., sensitivity = 80%; specificity = 90%), and we selected a value of 13% to represent the proportion of children who score positive on a typical behavioral screener (Jellinek et al., 1999). Noting that the proportion of respondents who screen positive is a function of sensitivity, specificity, and actual prevalence, we calculated true prevalence based on the assumptions above using the following formula:
Assumptions regarding sensitivity, specificity, and the proportion of patients who screen positive therefore imply a true prevalence of 4%. Moreover, based on a prior systematic review of behavioral health screening (Wissow et al., 2013), we assumed that PCPs referred 80% of children who score positive and 5% who score negative. In the one study of ACEs screening that reported relevant data, 77.5% of patients completed referrals (Kia-Keating et al., 2019). Because this value is generally consistent with a prior systematic review of behavioral health screening (Wissow et al., 2013), we used this estimate across all scenarios. Based on the level of demand implied by the parameters assumed in this baseline scenario, workforce numbers were calibrated to yield persistent waitlists for treatment services averaging 1-2 months, as is typical in many healthcare systems.
Scenarios B & C—Changes in Demand.
Next, we relied on results from the scoping review to systematically alter parameters in the baseline model in ways that could plausibly depict a change resulting from implementation of ACEs screening in different localities. Specifically, we selected certain studies that reported low values (Selvaraj et al., 2019) and high values (Kia-Keating et al., 2019) with respect to the proportion of patients screened, the proportion who screened positive, and the proportion referred for services. Positive screens were determined by the ACEs cut scores used in the studies, and did not include the presence of mental health symptoms as these data were not reported in any studies. The two studies selected therefore inform scenarios that suggest mechanisms by which ACEs screening may increase or decrease demands on the behavioral healthcare delivery system.
Feedback loops.
Consistent with system dynamics research on policy resistance (Sterman, 2006), we also conducted sensitivity analyses to explore the possible effect of feedback loops. Based on prior evidence that longer queues predict higher patient dropout, we simulated effects of long waitlists on referral rates. Based on research associating higher work pressure with burnout and job turnover in behavioral healthcare (Dantas et al., 2018; Johnson et al., 2018; Sherman et al., 2009, we also simulated the possible effect of long waitlists on provider quit rates. Specifically, we ran two additional analyses. For the first analysis (hereafter, “negative feedback”), when average waitlists are above a threshold of 150 days (over twice as high as the average at baseline) for at least 6 months, the probability of referral and the probability of referral completion each decline by 0.1% per month until waitlists fall below the threshold. In the second analysis (hereafter, “positive feedback”), feedback loops from waitlists to referral parameters are still present but they are now weaker (instead of an increment of 0.1% per month, they are now 0.01% per month). In addition, this analysis includes an additional feedback loop. When average waitlists are above a threshold of 150 days for at least 12 months, the quit rate for treatment providers increases by 0.01% per month.
Results
Natural History Model
We calibrated the natural history model to reflect the results of our scoping review. If ACEs accrue with age as the model suggests, positive screens on ACEs questionnaires will be heavily skewed toward older adolescents, with comparatively fewer children screening positive at younger ages. Notably, this finding is consistent with the limited empirical evidence identified in the scoping review. Also, the model suggests that experiencing ACEs at earlier ages places children at higher risk for experiencing more ACEs. For example, a child who experiences one ACE in their first year of life has a 53% chance of experiencing 4 or more ACEs by age 18. If a child experiences two ACEs in the first year of life, the model suggests that the probability of experiencing 4 or more ACEs increases to 91%.
Behavioral Healthcare Delivery Models
Scenario A: Baseline.
Results of each scenario are depicted in Figure 4. Scenario A represents plausible baseline conditions in which behavioral health screening is routine but ACEs screening has not been implemented. Note that supply of treatment (i.e., the number of treatment appointments available in any given month, as indicated by the black line) consistently exceeds demand for treatment (i.e., the number of treatment appointments required for newly referred patients, as indicated by the red line), yet relatively short average waitlists (with occasional spikes in individual simulations) persist throughout the modeling period. Also note that process sensitivity—i.e., the proportion of children with the condition of interest (i.e., a behavioral problem or high ACEs) who ultimately receive treatment is consistently below 50%, even though screening sensitivity is assumed to be 80%. This finding reflects the fact that process sensitivity is influenced not only by screening accuracy, but also by provider and patient factors, including the likelihood of a physician making a referral and a patient contacting the referral source, remaining on the waitlist, and attending an appointment. Finally, note that lighter lines represent outcomes for each of 20 individual model simulations. These lines therefore represent the variation in trajectories that is possible given the probabilistic nature of the model. Each of these trajectories is equally likely given the assumptions of each model scenario.
Figure 4.

Results of Model Scenarios
Scenario B: Potential for Lower Demand.
Compared to our baseline scenario, Selvaraj et al. (2019) reported much lower values for the proportion of patients screened (56%), the proportion who screened positive (0.2%), and the proportion referred for services (2%). These screening and referral rates are substantially lower than would be expected from population-based surveys, especially as these ACEs screenings were conducted in clinics that served urban, low-income, and racially diverse clients. Using these assumptions, Scenario B illustrates impact on behavioral healthcare that might occur in situations where, as the authors state, “self-report questionnaires completed during well child visits may not be an effective strategy for the identification of ACEs in pediatric medical homes” (Selvaraj, 2019, p. 248).
Because 90% specificity is not possible given that 0.2% screen positive, we adjusted the former parameter by re-arranging equation 1:
Note that if prevalence is zero, then this equation reduces to:
For any value of prevalence greater than zero, specificity is lower. Therefore, (1 minus % positive) represents an upper bound for specificity and 99.8% is the lowest possible value in this scenario. To allow for some true positives, we selected a value of 99.9% and assumed sensitivity = 30%, thus resulting in 0.2% screening positive overall.
Assumptions from the Selvaraj et al. study demonstrated how ACEs screening could result in fewer children with high ACEs receiving services if other behavioral health screenings were replaced. With the low screening sensitivity assumed from this study, fewer children would be referred to behavioral health services, leading to almost non-existent waitlists. These data suggest the possibility that a much lower proportion of children with high ACEs receive behavioral health services (i.e., lower process sensitivity), with only 10-20% receiving treatment to address high ACEs.
Scenario C: Potential for Higher Demand.
We based Scenario C, which reflects higher demand for services, on findings from Kia-Keating et al. (2019), including that 92.1% of patients are screened, 23.3% of infants screen positive (cut-score = 1+ ACE for infants), and 47% of patients are referred overall (referrals also based on caregiver ACEs score). However, these parameters led to extremely high estimates of demand for treatment that far exceeded supply. Because Kia-Keating et al (2019) also reported implementation of behavioral health services in the primary care setting that may have increased the efficiency of their overall process, we adjusted model estimates to assume a more moderate increase in demand. Specifically, we assumed that 73% of children were screened and that 19.3% screened positive. Consistent with the baseline values, we assumed that 80% of positive screens were referred as were 5% of negative screens, thereby resulting in a lower referral proportion than was reported by Kia-Keating et al (2019). In addition, we assumed that screener specificity was 99.9% and screener sensitivity was equivalent to baseline (80%).
In this scenario, supply of treatment still exceeds demand for treatment, the gap is no longer as large, thus resulting in waitlists that rapidly increase over the implementation period (Figure 4). As compared to the baseline scenario with regular behavioral health screening, but no ACEs screening, the number of patients with high ACEs referred to treatment increase over time (higher demand), however, because waitlists limit access to treatment, the proportion of patients who receive treatment is lower than baseline.
Sensitivity Analyses—Feedback Loops.
Sensitivity analyses demonstrate how “negative feedback” loops can lower rates of referral and referral completion, thereby regulating demand. Compared to Scenario C, waitlists display an initial rise but then begin to fall as negative feedback loops exert their influence. In contrast, a second set of sensitivity analyses demonstrate how “positive feedback” loops can increase work pressure and risk of burnout among treatment providers, thereby increasing the quit rate. As a result, supply of treatment is lower and more variable as agencies attempt to hire new clinicians, and waitlists rise even faster than in Scenario C. While the strength and timescale of such feedback loops is unknown, their presence is plausible given evidence linking the length of waitlists to the probability of dropout in the case of positive feedback loops, and from evidence demonstrating the system-level factors that can increase work pressure and burnout (Dantas et al., 2018; Johnson et al., 2018). See Figure A in Supplemental Figures for the impact of feedback loops on waitlists.
Discussion
By conducting a scoping review and systems modeling, this study aimed to inform ACEs screening implementation, research, and policy at a critical time during which all three of these areas are growing rapidly. The scoping review demonstrated heterogeneity in ACEs screening processes and outcomes, which will likely impact implementation efforts. This heterogeneity may result from differences in underlying ACEs prevalence, but it may also be related to differences in ACEs screening methodology (e.g., de-identified vs. item scores), which are likely impacted by health literacy and willingness to disclose. In turn, these factors influence sensitivity and specificity. For example, Scenario B and Scenario C demonstrate how screening and referral outcomes from two studies could inform model assumptions. Scenario B, based on screening and referral outcomes reported by Selvaraj et al. (2019), illustrates how referrals for behavioral health services for high ACEs would be limited if the proportion of patients screened and sensitivity of screeners were low. In fact, this could decrease demand for services if ACEs screening was prioritized above other types of behavioral health screening or referral processes. On the other hand, Scenario C, based on the study by Kia-Keating et al. (2019), illustrates the potential for consistent screening to lead to increased demand for behavioral health services, which could lead to waitlists in systems that did not expand appropriate services. Given the lack of a gold standard assessment for life events such as ACEs, attempts to triangulate results of ACEs screening and surveys with other types of data may offer the most pragmatic method to begin to understand the sensitivity and specificity of ACEs questionnaires. For example, Gillespie and Folger (2017) compared rates of reported ACEs to population-level data in the state from the same items used in the BRFSS, and found lower reported prevalence rates of ACEs than expected.
One way to address the lack of consensus about ACEs screening (Dube, 2008; Finkelhor, 2008) may be to identify the types of evidence that are most important to resolve disputes and optimize systems (Sheldrick, Hyde et al., 2019). Advocates for ACEs screening believe that it has the potential to help primary care providers accurately identify patients who may benefit from treatment while increasing trust and understanding between patients and providers (Bethell, Solloway et al., 2017; Dube, 2018). In turn, critics argue that ACEs screening could overwhelm the behavioral healthcare system with referrals (Finkelhor, 2018). Simulation modeling suggests that these perspectives are not necessarily mutually exclusive—indeed, improved accuracy, greater engagement, and increased referrals could all occur simultaneously. If so, benefits realized in one part of a system (e.g., early detection) may lead to challenges in other parts of that system (e.g., long waitlists). In a similar way, if arguments that ACEs screening will lead to a massive reduction in costs at the societal level are true (Miller et al., 2020), then it is likely that the increase in services needed to realize this benefit will lead to shorter term inflation in costs for healthcare (Srivastav, Fairbrother, & Simpson, 2017). A holistic understanding of how various elements function as a system is necessary to ensure benefit on the population level.
Systems modeling can be useful in other ways that may be helpful to decision-makers as they implement ACEs screening. For example, we found that data on screening are consistent with a natural history model of ACEs where risk of additional ACEs is higher among children who have already experienced ACEs and children accrue more ACEs as they age (Dong et al., 2004; Kuhlman et al., 2018). This has implications for secondary prevention efforts. If ACEs screening policy adopts a constant threshold across ages (e.g., 4+ ACEs as recommended under current guidelines in California), then screening is likely to disproportionally affect adolescents as compared to younger children. Setting high cut-points on ACEs levels in early childhood may miss many families who could benefit from intervention. Age-based thresholds may be worthwhile to consider in preventing the accumulation of ACEs and decreasing health risks.
Model results may also serve to broaden the future scenarios considered possible by policy makers. Very simply, implementation of ACEs screening could decrease demand for services if other forms of making referrals are replaced, increase demand for services, or have no effect. Whichever is the case, the possibility of feedback loops should not be discounted. Decades of research in system dynamics document the inability of most human beings to anticipate the effects of feedback loops (Sterman, 2006). For example, a recent National Academies of Sciences, Engineering, and Medicine (2019) report highlights the profound effect of provider burnout on the healthcare system. Therefore, the possibility of increased work pressure resulting in greater burnout and perhaps higher quit rates should be seriously considered. Along these lines, if feedback from waitlists leads to a reduction in the proportion of children who receive and complete referrals, then demand can appear to be stable even if actual need (as indicated by prevalence) is higher. In such cases, approximately the same number of children will receive treatment after ACEs screening as did before ACEs screening. The question then becomes whether these are the same children, or more likely, whether some children who would have received treatment no longer do, and whether other children who would not have received treatment now do. The degree to which ACEs screening influences referral patterns, and the degree to which these changes confer benefit, is a question that deserves further study.
Finally, while the simulation model and the extant evidence on which it is based are insufficient to make reliable predictions, they do suggest possible targets for monitoring the effect of ACEs screening on healthcare delivery and disparities. This may be especially important for populations who are likely to experience greater exposure to ACEs, but have disparities in accessing services. Though there were inadequate data from the scoping review to estimate such differences, our model provides a framework to conceptualize how different groups experience of screening and healthcare delivery may vary. Data on model parameters such as screening completion, the proportion of children who screen positive, and referral rates are often readily available in electronic health records, which can be used to inform models to answer questions about specific populations and localities. Perhaps more important, persistent changes in behavioral health waitlists may signal shifts in the relationship between supply and demand of services needed by children with high levels of ACEs. Heterogeneity in available data suggests that results may not generalize across systems and that monitoring should occur at the local level. Importantly, we cannot discount the role of the provider as the effectiveness of a screening program depends on more than the questionnaire chosen—sound clinical and shared decision-making are also essential to ensure benefit (Sheldrick, Frenette et al., 2019).
Limitations
In that the models were highly sensitive to model assumptions, the limitations of our results are readily apparent. First, model parameters are, at best, broadly plausible in that they are consistent with prior literature. They do not represent valid point estimates for any particular system, which will be influenced by local data on estimated ACEs prevalence and average waitlist times at behavioral health clinics. Second, model structure is inherently reductionist in that parameters are frequently used as proxies for more complicated processes. Thus, clinical decision-making is represented by a single parameter, and families’ decision-making is represented by another parameter. Likewise, the workforce responsible for screening is not represented. More complex models may be needed to address questions in these domains. Third, and most important, is model scope. We focused the model on behavioral healthcare delivery. The limits of this choice may be especially relevant when considering that ACEs screening guidelines recommend a range of responses that extend beyond behavioral health services and include responses to other social determinants of health, such as food and housing (ACEs Aware, 2020). Furthermore, though the model is consistent with the perspective that the benefits of screening are predominantly conferred by referrals to appropriate services, it may not do justice to other potentially valid perspectives, such as the impact on the patient-provider relationship.
Conclusions
Though other outcomes that lie beyond this model’s scope are important to investigate, understanding the impact of ACEs screening on behavioral healthcare delivery is essential to successful implementation and should be carefully considered by researchers, clinicians, and, policy-makers. Indeed, to fully inform ACEs screening policy and research, it is critical to take a systems level perspective. In recent years, recommendations have been made to leverage learning healthcare systems and systems engineering methods (like the model presented here) to understand the impact of practice and policy changes throughout the healthcare system (Whicher et al., 2018). In the spirit of these recommendations, we hope that the results and models we presented will facilitate dialogue and deliberation about how best to ensure the wellbeing of patient populations as the implementation of ACEs screening progresses.
Supplementary Material
Public significance statement:
Significant efforts are being made to screen for and respond to ACEs within primary care settings to help mitigate the individual and public health impact of ACEs. A scoping review and simulation modeling demonstrated the potential impacts of ACEs screening on the supply and demand for behavioral healthcare services.
Acknowledgments
Funding. The time and effort to prepare this manuscript was supported by K01MH110608 awarded to MLB. Additionally, the preparation of this article was supported in part by the Implementation Research Institute (IRI) at the Brown School, Washington University in St. Louis, through an award from the National Institute of Mental Health (R25 MH080916). MLB is a fellow of IRI
Biography


Contributor Information
Miya Barnett, University of California, Santa Barbara, Department of Counseling, Clinical, and School Psychology.
R. Christopher Sheldrick, Boston University School of Public Health.
Sabrina R. Liu, University of California, Santa Barbara, Department of Counseling, Clinical, and School Psychology
Maryam Kia-Keating, University of California, Santa Barbara, Department of Counseling, Clinical, and School Psychology.
Sonya Negriff, Kaiser-Permanente Southern California.
References
* Indicates reference included in scoping review
- Arskey H, & O’Malley L (2005). Scoping studies: towards a methodological framework. International Journal of Social Research Methodology, 8(1), 19–32. [Google Scholar]
- ACEs Aware (2020, February 17). Clinical assessment and treatment planning. https://www.acesaware.org/treat/clinical-assessment-treatment-planning/
- Barnes AJ, Anthony BJ, Karatekin C, Lingras KA, Mercado R, & Thompson LA (2019). Identifying adverse childhood experiences in pediatrics to prevent chronic health conditions. Pediatric Research, 1–11. doi: 10.1038/s41390-019-0613-3 [DOI] [PMC free article] [PubMed] [Google Scholar]
- Bethell CD, Davis MB, Gombojav N, Stumbo S, & Powers K (2017). Issue Brief: Adverse Childhood Experiences among US Children. Child and Adolescent Health Measurement Initiative, Johns Hopkins Bloomberg School of Public Health. [Google Scholar]
- Bethell CD, Solloway MR, Guinosso S, Hassink S, Srivastav A, Ford D, & Simpson LA (2017). Prioritizing possibilities for child and family health: An agenda to address Adverse Childhood Experiences and foster the social and emotional roots of well-being in pediatrics. Academic Pediatrics, 17(7), S36–S50. doi: 10.1016/j.acap.2017.06.002 [DOI] [PubMed] [Google Scholar]
- Briggs RD, Hershberg RS, & Germán M (2016). Healthy steps at Montefiore: Our journey from start up to scale. In Integrated Early Childhood Behavioral Health in Primary Care (pp. 105–116). Springer, Cham. [Google Scholar]
- Campbell TL (2020). Screening for Adverse Childhood Experiences (ACEs) in Primary Care: A Cautionary Note. JAMA, 23(23):2379–2380. doi: 10.1001/jama.2020.4365 [DOI] [PubMed] [Google Scholar]
- Crouch E, Radcliff E, Probst JC, Bennett KJ, & McKinney SH (2019). Rural-urban differences in Adverse Childhood Experiences across a national sample of children. The Journal of Rural Health : Official Journal of the American Rural Health Association and the National Rural Health Care Association, 36(1), 55–64. doi: 10.1111/jrh.12366 [DOI] [PubMed] [Google Scholar]
- Dantas LF, Fleck JL, Cyrino Oliveira FL, & Hamacher S (2018). No-shows in appointment scheduling – a systematic literature review. Health Policy, 122(4). 412–421. [DOI] [PubMed] [Google Scholar]
- Dong M, Anda RF, Felitti VJ, Dube SR, Williamson DF, Thompson TJ, … & Giles WH (2004). The interrelatedness of multiple forms of childhood abuse, neglect, and household dysfunction. Child Abuse & Neglect, 28(7), 771–784. [DOI] [PubMed] [Google Scholar]
- Dube SR (2018). Continuing conversations about adverse childhood experiences (ACEs) screening: A public health perspective. Child Abuse & Neglect, 85, 180–184. [DOI] [PubMed] [Google Scholar]
- Felitti VJ, Anda RF, Nordenberg D, Williamson DF, Spitz AM, Edwards VJ, … Marks JS (1998). Relationship of childhood abuse and household dysfunction to many of the leading causes of death in adults. The Adverse Childhood Experiences (ACE) Study. American Journal of Preventive Medicine, 14(4), 245–258. [DOI] [PubMed] [Google Scholar]
- Finkelhor D (2018). Screening for adverse childhood experiences (ACEs): Cautions and suggestions. Child Abuse & Neglect, 85, 174–179. doi: 10.1016/J.CHIABU.2017.07.016 [DOI] [PubMed] [Google Scholar]
- *.Flanagan T, Alabaster A, McCaw B, Stoller N, Watson C, & Young-Wolff KC (2018). Feasibility and acceptability of screening for adverse childhood experiences in prenatal care. Journal of Women’s Health, 27(7), 903–911. doi: 10.1089/jwh.2017.6649 [DOI] [PMC free article] [PubMed] [Google Scholar]
- Ford K, Hughes K, Hardcastle K, Di Lemma LCG, Davies AR, Edwards S, & Bellis MA (2019). The evidence base for routine enquiry into adverse childhood experiences: A scoping review. Child Abuse & Neglect, 91, 131–146. doi: 10.1016/J.CHIABU.2019.03.007 [DOI] [PubMed] [Google Scholar]
- *.Gillespie RJ, & Folger AT (2017). Feasibility of assessing parental ACEs in pediatric primary care: Implications for practice-based implementation. Journal of Child & Adolescent Trauma, 10(3), 249–256. doi: 10.1007/s40653-017-0138-z [DOI] [Google Scholar]
- Gleason MM, Goldson E, & Yogman MW (2016). Addressing early childhood emotional and behavioral problems. Pediatrics, 138(6), e20163025–e20163025. [DOI] [PubMed] [Google Scholar]
- *.Glowa PT, Olson AL, & Johnson DJ (2016). Screening for adverse childhood experiences in a family medicine setting: a feasibility study. The Journal of the American Board of Family Medicine, 29(3), 303–307. doi: 10.3122/jabfm.2016.03.150310 [DOI] [PubMed] [Google Scholar]
- Grimes KE (2017). Lessons from ACEs: Pay now or pay (more) later. Academic Pediatrics, 17(7). S18–S19. doi: 10.1016/j.acap.2016.12.013 [DOI] [PubMed] [Google Scholar]
- Jellinek MS, Murphy JM, Little M, Pagano ME, Comer DM, & Kelleher KJ (1999). Use of the pediatric symptom checklist to screen for psychosocial problems in pediatric primary care: A national feasibility study. Archives of Pediatrics and Adolescent Medicine, 153(3), 254–260. doi: 10.1001/archpedi.153.3.254 [DOI] [PMC free article] [PubMed] [Google Scholar]
- Johnson J, Hall LH, Berzins K, Baker J, Melling K, & Thompson C (2018). Mental healthcare staff well-being and burnout: A narrative review of trends, causes, implications, and recommendations for future interventions. International Journal of Mental Health Nursing, 27(1), 20–32. doi: 10.1111/inm.12416 [DOI] [PubMed] [Google Scholar]
- *.Kia-Keating M, Barnett ML, Liu SR, Sims GM, & Ruth AB (2019). Trauma-responsive care in a pediatric setting: Feasibility and acceptability of screening for Adverse Childhood Experiences. American Journal of Community Psychology, 64(3–4), 286–297. [DOI] [PMC free article] [PubMed] [Google Scholar]
- *.Koball AM, Rasmussen C, Olson-Dorff D, Klevan J, Ramirez L, & Domoff SE (2019). The relationship between adverse childhood experiences, healthcare utilization, cost of care and medical comorbidities. Child Abuse & Neglect, 90, 120–126. [DOI] [PubMed] [Google Scholar]
- Koita K, Long D, Hessler D, Benson M, Daley K, Bucci M, … Harris NB (2018). Development and implementation of a pediatric adverse childhood experiences (ACEs) and other determinants of health questionnaire in the pediatric medical home: A pilot study. PLoS ONE, 13(12). doi: 10.1371/journal.pone.0208088 [DOI] [PMC free article] [PubMed] [Google Scholar]
- Kuhlman KR, Robles TF, Bower JE, & Carroll JE (2018). Screening for childhood adversity: the what and when of identifying individuals at risk for lifespan health disparities. Journal of Behavioral Medicine, 41(4), 516–527. doi: 10.1007/s10865-018-9921-z [DOI] [PMC free article] [PubMed] [Google Scholar]
- Levac D, Colquhoun H, & O'Brien KK (2010). Scoping studies: advancing the methodology. Implementation science, 5(1), 69. doi: 10.1186/1748-5908-5-69 [DOI] [PMC free article] [PubMed] [Google Scholar]
- Liu SR, Kia-Keating M, Nylund-Gibson K, & Barnett ML (2019). Co-occurring youth profiles of adverse childhood experiences and protective factors: Associations with health, resilience, and racial disparities. American Journal of Community Psychology. [DOI] [PubMed] [Google Scholar]
- *.Marcus JL, Bernstein KT, Philip S, & Klausner JD (2009). Evidence of underreporting of adverse childhood experiences, San Francisco municipal STD clinic, 2007. Sexually transmitted diseases, 36(7), 422–424. doi: 10.1097/OLQ.0b013e31819d72ad [DOI] [PubMed] [Google Scholar]
- *.Marie-Mitchell A, Lee J, Siplon C, Chan F, Riesen S, & Vercio C (2019). Implementation of the Whole Child Assessment to Screen for Adverse Childhood Experiences. Global Pediatric Health, 6, doi: 10.1177/2333794X19862093. [DOI] [PMC free article] [PubMed] [Google Scholar]
- *.Marsicek SM, Morrison JM, Manikonda N, O’Halleran M, Spoehr-Labutta Z, & Brinn M (2019). Implementing standardized screening for adverse childhood experiences in a pediatric resident continuity clinic. Pediatric Quality and Safety, 4(2), e154. [DOI] [PMC free article] [PubMed] [Google Scholar]
- Merrick MT, Ford DC, Ports KA, & Guinn AS (2018). Prevalence of Adverse Childhood Experiences from the 2011-2014 Behavioral Risk Factor Surveillance System in 23 States. JAMA Pediatrics, 172(11), 1038–1044. doi: 10.1001/jamapediatrics.2018.2537 [DOI] [PMC free article] [PubMed] [Google Scholar]
- Miller TR, Waehrer GM, Oh DL, Purewal Boparai S, Ohlsson Walker S, Silverio Marques S, & Burke Harris N (2020). Adult health burden and costs in California during 2013 associated with prior adverse childhood experiences. PLOS ONE, 15(1), e0228019. [DOI] [PMC free article] [PubMed] [Google Scholar]
- National Academies of Sciences, Engineering, and Medicine. 2019. Taking Action Against Clinician Burnout: A Systems Approach to Professional Well-Being. Washington, DC: The National Academies Press. 10.17226/25521. [DOI] [PubMed] [Google Scholar]
- Nguyen M, Heberlein E, Covington-Kolb S, Gerstner A, Gaspard A, & Eichelberger K (2019). Assessing Adverse Childhood Experiences during pregnancy: Evidence toward a best practice. American Journal of Perinatology Reports, 09(01), e54–e59. [DOI] [PMC free article] [PubMed] [Google Scholar]
- Purewal SK, Marques SS, Koita K, & Bucci M (2016). Assessing the integration of the Center for Youth Wellness Adverse Childhood Experiences Questionnaire (CYW ACE-Q) in a pediatric primary care setting. Journal of Adolescent Health, 58(2), S47. [Google Scholar]
- *.Selvaraj K, Ruiz MJ, Aschkenasy J, Chang JD, Heard A, Minier M, … Bayldon BW (2019). Screening for toxic stress risk factors at well-child visits: The addressing social key questions for health study. The Journal of Pediatrics, 205, 244–249.e4. [DOI] [PubMed] [Google Scholar]
- Sheldrick RC, Benneyan JC, Kiss IG, Briggs-Gowan MJ, Copeland W, & Carter AS (2015). Thresholds and accuracy in screening tools for early detection of psychopathology. Journal of Child Psychology and Psychiatry, 56(9), 936–948. [DOI] [PMC free article] [PubMed] [Google Scholar]
- Sheldrick RC, D. J., Hassan R, Chan K, Polk DE, & Benneyan J (2016). A system dynamics model of clinical decision thresholds for the detection of developmental-behavioral disorders. Implementation Science, 11(1), 156. doi: 10.1186/s13012-016-0517-0 [DOI] [PMC free article] [PubMed] [Google Scholar]
- Sheldrick RC, Frenette E, Vera JD, Mackie TI, Martinez-Pedraza F, Hoch N, … Carter AS (2019). What drives detection and diagnosis of Autism Spectrum Disorder? Looking under the hood of a multi-stage screening process in early intervention. Journal of Autism and Developmental Disorders, 49(6), 2304–2319. doi: 10.1007/s10803-019-03913-5 [DOI] [PMC free article] [PubMed] [Google Scholar]
- Sheldrick RC, Hyde J, Leslie LK, & Mackie T (2019). The debate over rational decision making in evidence-based medicine: Implications for evidence-informed policy. Evidence & Policy: A Journal of Research, Debate and Practice. [Google Scholar]
- Sherman ML, Barnum DD, Buhman-Wiggs A, & Nyberg E (2009). Clinical intake of child and adolescent consumers in a rural community mental health center: Does wait-time predict attendance? Community Mental Health Journal, 45(1), 78–84. [DOI] [PubMed] [Google Scholar]
- Siu AL (2016). Screening for autism spectrum disorder in young children US preventive services task force recommendation statement. Journal of the American Medical Association, 315(7), 691–696. doi: 10.1001/jama.2016.0018 [DOI] [PubMed] [Google Scholar]
- Siu AL, Bibbins-Domingo K, Grossman DC, Baumann LC, Davidson KW, Ebell M, … Pignone MP (2016). Screening for depression in adults: US preventive services task force recommendation statement. Journal of the American Medical Association, 315(4), 380–387. doi: 10.1001/jama.2015.18392 [DOI] [PubMed] [Google Scholar]
- Srivastav A, Fairbrother G, & Simpson LA (2017). Addressing adverse childhood experiences through the Affordable Care Act: Promising advances and missed opportunities. Academic Pediatrics, 17(7), S136–S143. doi: 10.1016/j.acap.2017.04.007 [DOI] [PubMed] [Google Scholar]
- Sterman JD (2006). Learning from evidence in a complex world. American Journal of Public Health, 96(30). 505–514 doi: 10.2105/AJPH.2005.066043 [DOI] [PMC free article] [PubMed] [Google Scholar]
- Underwood E (2020, January 29). California has begun screening for early childhood trauma, but critics urge caution. Science. https://www.sciencemag.org/news/2020/01/california-has-begun-screening-early-childhood-trauma-critics-urge-caution
- Whicher D, Rosengren K, Siddiqi S, Simpson L, editors. 2018. The Future of Health Services Research: Advancing Health Systems Research and Practice in the United States. Washington, DC: National Academy of Medicine. [PubMed] [Google Scholar]
- Wissow LS, Brown J, Fothergill KE, Gadomski A, Hacker K, Salmon P, & Zelkowitz R (2013). Universal mental health screening in pediatric primary care: A systematic review. Journal of the American Academy of Child and Adolescent Psychiatry, 52(11), 1134–1147.e23. doi: 10.1016/j.jaac.2013.08.013 [DOI] [PMC free article] [PubMed] [Google Scholar]
Associated Data
This section collects any data citations, data availability statements, or supplementary materials included in this article.