

Abstract
π-Conjugated oligomers functionalized with the popular dicyanorhodanine (RCN) electron acceptor are shown to be susceptible to photo-induced Z/E isomerization. The stereochemistry of two model RCN-functionalized thiophenes is confirmed by single crystal X-ray analysis and 2D NMR, and shown to be the thermodynamically stable Z form. Relative energies, Z/E configurations, and conformational preferences are modelled using density functional theory (DFT). The photophysical properties of the model compounds are explored experimentally and computationally; the Z and E isomers display similar absorption profiles with significant spectral overlap and are inseparable upon irradiation to a photostationary state. The well-behaved photoisomerization process is routinely observable by thin-layer chromatography, UV-vis, and NMR, and the photochemical behavior of the two RCN-functionalized thiophenes is characterized under varying wavelengths of irradiation. Ultraviolet (254 nm) irradiation results in photostationary state compositions of 56/44 and 69/31 Z-isomer/E-isomer for substrates functionalized with one thiophene and two thiophenes, respectively. Ambient laboratory lighting results in excess of 10 percent E-isomer for each species in solution, an important consideration for processing such materials, particularly for organic photovoltaic applications. In addition, a photoswitching experiment is conducted to demonstrate the reversible nature of the photoreaction, where little evidence of fatigue is observed over numerous switching cycles. Overall, this work showcases an approach to characterize the stereochemistry and photochemical behavior of dicyanorhodanine-functionalized thiophenes, widely used components of functional molecules and materials.
Thiophenes functionalized with the popular dicyanorhodanine (RCN) electron acceptor are susceptible to well-behaved Z/E photoisomerization.
Introduction
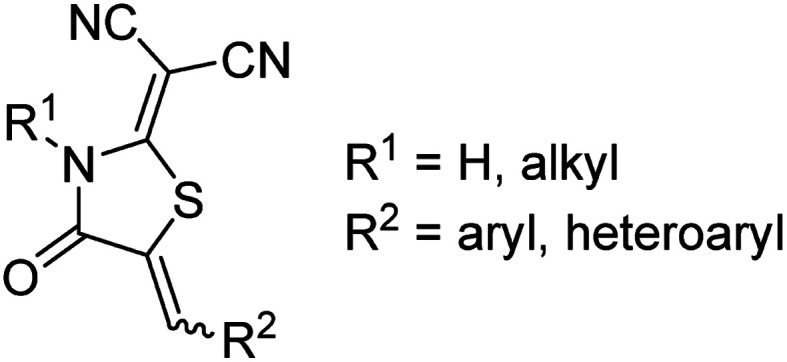
2-(1,1-Dicyanomethylene)rhodanine (Fig. 1), referred to colloquially as dicyanorhodanine (RCN), was introduced as an electron acceptor unit for organic optoelectronic materials in 2011.1 Since then, the RCN acceptor has become a fixture within the organic photovoltaic (OPV) community as it can lead to broadened and red-shifted absorption extending into the near infrared,2,3 enhanced crystallinity,4 and high electron affinities5 when appended to a π-conjugated molecule. Indeed, there have been 100+ publications relying on the dicyanorhodanine acceptor since 2013, speaking to the important role that this structure has played in the development of OPV materials. Early on, RCN was introduced to small molecule dye-sensitized solar cell (DSSC) materials,6–9 including relatively high performers such as indoline-based D–A–π–A systems which have demonstrated power conversion efficiencies (PCEs) as high as 8.53% when using 2,1,3-benzothiadiazole as an internal acceptor.10 More recently, DSSC small molecules relying on a triarylamine donor and RCN acceptor were developed11–13 and have generated PCEs up to 8.98% for an optimized device using a Zn2+ porphyrin co-sensitizer.14 As interest in bulk-heterojunction (BHJ) devices increased, a plethora of small molecule (SM) donor materials relying on RCN appeared.5,15–20 A series of solution-processable SM donors were introduced,2,21–23 each bearing terminal RCN acceptor groups along an oligothiophene backbone of varying repeat units. These systems have been extensively investigated due to the success of the seven-thiophene24–29 and five-thiophene30–37 variants of this system which have achieved PCEs as high as 9.30% for a binary BHJ device blended with PC71BM and 10.30% for a ternary SM solar cell, respectively.38,39 More recently, the evolving research area focusing on SM non-fullerene acceptors (NFAs) has adopted RCN, and numerous examples containing this structure have been reported.40–58 RCN-based NFAs have achieved PCEs beyond the 10% mark,59–63 with some of the highest performers reaching values of 10.78%,64 12.16%,65 and 12.27%.66 The RCN acceptor has also been incorporated into π-conjugated polymer donors, leading to OPV devices with PCEs of 5.30%,67 8.13%,68 and 9.12%.69 Outside of organic photovoltaics, the RCN structure has constituted small molecules used as organic photodetectors,70 organic field-effect transistors,71 and biologically active drug molecules.72–74
Fig. 1. Chemical structure of the dicyanorhodanine (RCN) acceptor unit.
Our recent work (vide infra) employing the RCN acceptor has encouraged us to consider the olefin stereochemistry which conjugates RCN to π-conjugated thiophenes more carefully. The acceptor group is introduced onto the terminus of thiophene oligomers via a Knoevenagel condensation reaction between 2-(1,1-dicyanomethylene)rhodanine and the corresponding π-conjugated carboxaldehyde, typically in the last step of the synthetic sequence.2,11,13,40 The condensation results in the formation of an olefinic C C double bond which has the potential for both Z and E stereochemistry (Fig. 2). While the olefin stereochemistry of alkylmethylidene and arylmethylidene rhodanine (C S) derivatives had been discussed previously,75–77 and the thermodynamically stable Z isomer for aryl- and tetrathiafulvalene-based RCN structures has been confirmed by DFT,1 this stereochemical feature has not been addressed for RCN-functionalized oligothiophenes and is generally ignored in the organic materials literature. To wit, some reports depict RCN-functionalized oligothiophenes as the E isomer,5,13,16,78 while others depict the Z configuration.1,2,22,40 Given that even small structural changes in π-conjugated molecules can have concomitant effects on the efficiency of a photovoltaic device,79–83 and thin film packing/morphology of dye molecules is of critical importance to device efficiency,84–86 ignoring this stereochemical feature may not be justified. It is reasonable to assume that Z and E isomers of RCN-functionalized thiophenes will not adopt the same solid-state packing preferences in thin films.
Fig. 2. Chemical structures of model compounds 1 and 2 shown in the Z configuration (red) and the E configuration (blue).

The susceptibility of rhodanine derivatives to photoisomerization was speculated over 35 years ago in the context of OPVs and has received surprisingly little attention since.87 An exception is the work of Zietz et al. reporting that a DSSC dye containing a double rhodanine acceptor similar to RCN was prone to photoisomerization,88 and other non-radiative deactivation processes,89 which may negatively affect device efficiency. The same authors reported the photoisomerization of the cyanoacrylic acid anchoring group, another popular acceptor unit for DSSC applications.90 To the best of our knowledge, the photoisomerization of dicyanorhodanine (RCN) functionalized π-conjugated oligomers has yet to be studied.
Herein, we report the photoisomerization of two RCN-functionalized thiophenes, 1 and 2 (Fig. 2). We have chosen the simplest RCN-terminated thiophenes as model substrates for this study in an attempt to delineate the fundamental photochemical behaviour as it might apply to any number of larger oligomeric structures. The olefin stereochemistry of 1-Z was assigned with 2D-NMR and X-ray crystallography, and it was determined that both 1 and 2 were obtained from synthesis as the thermodynamically-stable Z configuration. Configurational geometries for Z and E isomers, conformational preferences, and excited state optoelectronic properties were modelled with ground state and excited state DFT calculations. The photochemical behaviour of 1 and 2 was characterized by NMR and UV-vis spectroscopy, and it was found that both molecules are prone to photoisomerization when exposed to ambient (laboratory) irradiation conditions in solution. The observed photochemical behaviour for 1 and 2 is wavelength dependent, and the Z/E photostationary state (PSS) compositions under varying wavelengths of irradiation were determined by 1H NMR spectroscopy. While the photoswitching aspects of such RCN-functionalized thiophenes have not been described prior to this work, we feel the broader impact of the study lies in exposing the photochemical behaviour of RCN to the organic materials community.91
Results and discussion
The discovery that model substrates 1 and 2 were prone to photoisomerization was first made visible by thin layer chromatography (TLC) (Fig. S8, ESI†). Unintentional irradiation of either 1 or 2 as a solution in dichloromethane (DCM) by ambient light exposure resulted in the formation of a new, more polar spot on the TLC plate (E isomer) in addition to the existing spot representative of the pure compound (Z isomer). This phenomenon was initially apparent with a larger oligothiophene from our lab, RCN-3T-Br, suggesting that more advanced synthetic intermediates are susceptible to the photoisomerization process (Fig. S8, ESI†). Although Z and E isomers show different Rf values on silica TLC, we were unable to separate a pure sample of 1-E or 2-E from a silica chromatography column, a challenge acknowledged in previous work on a series of arylmethylidene rhodanine derivatives.77 From the synthetic procedure used for 1 and 2 (Scheme S1, ESI†), the Z isomer was obtained as the only detectable isomer from the Knoevenagel condensation. To confirm the olefin stereochemistry of 1, a single crystal X-ray structure was obtained (Fig. 3). The ORTEP representation of compound 1 shows the monomer in the Z configuration (Fig. 3a), with a unit cell containing four molecules (Fig. 3b). The long-range herringbone packing of 1-Z displays a slip-stack arrangement and a π–π stacking distance of 3.26 Å between each dimer when measuring the distance between defined planes superimposed through each thiophene (Fig. 3c). Compound 1-Z adopts a nearly planar geometry overall, with an S2–C6–C5–C4 dihedral angle of −0.98° about the isomerizable olefin CC double bond. The stereochemistry of 1-Z can be determined in solution as well using simple 2D NMR experiments. IPAP-gHSMBC (chloroform-d) of a 1-Z/1-E mixture obtained via irradiation to a photostationary state (Fig. 4, vide infra), revealed that the three bond heteronuclear coupling (3JC2–H6) between the isomerizable olefin proton and the rhodanine C O carbon is much smaller for the Z isomer (3JC2–H6 = 5.8 Hz, Fig. S4, ESI†) than for the E isomer (3JC2–H6 = 11.4 Hz, Fig. S7, ESI†), agreeing with a literature precedent concerning various oxazolones bearing a core-structure comparable to 1.92 Furthermore, HSQC and HMBC chemical shift assignments for 1-Z (Fig. S2 and S3, ESI†) and 1-E (Fig. S5 and S6, ESI†) reveal that the olefin proton in the Z configuration is more downfield (δ = 8.10 ppm) compared to the same proton in the E isomer (δ = 7.44 ppm). This is attributed to the deshielding cone of the carbonyl, which is in close proximity to the vinyl proton in the Z isomer, but is on the opposite face of the alkene in the E isomer.77 For 2-Z and 2-E, the 1H NMR chemical shifts show a similar trend (Fig. 4b). The vinyl proton of 2-Z resonates more downfield (δ = 8.03 ppm) than 2-E (δ = 7.33 ppm), confirming that 2 was also obtained from synthesis as the Z isomer.
Fig. 3. (a) ORTEP representation showing the monomer of 1-Z. (b) Unit cell containing four molecules of 1-Z. (c) Long range herringbone-type packing of 1-Z in the solid state.

Fig. 4. (a) Stacked 1H NMR spectra (CDCl3) showing pure 1-Z (bottom) and 1-Z/E mixture (top) obtained upon irradiation to a photostationary state using 254 nm light. (b) 1H NMR spectra (CDCl3) showing pure 2-Z (bottom) and 2-Z/E mixture (top) obtained upon irradiation to a photostationary state using 450 nm light.

The photoisomerization of 1 and 2 can be conveniently monitored by 1H NMR (Fig. 4). For compound 1 (Fig. 4a), the aromatic signals characteristic of 1-Z appear to duplicate going from a pure sample (bottom) to a sample irradiated with ultraviolet light (top). The PSS composition was determined by irradiating 1-Z (15 mM, chloroform-d) until no changes in 1H NMR integral ratios were observed, indicating that the PSS was reached. For compound 1, the PSS was composed of 56% Z isomer and 44% E isomer under ultraviolet (λirr = 254 nm) irradiation (Fig. 4a). Interestingly, irradiation with a longer wavelength (λirr = 450 nm) results in a composition of 98/2 1-Z/1-E accompanied by a significant amount of other photoproducts and photodegradation visible in the NMR spectrum, demonstrating a strong wavelength dependence on the observed photochemistry for these species (Fig. S12, ESI†). Ambient light irradiation of 1 results in a mixture of 89% Z isomer and 11% E isomer with no visible photodegradation (Fig. S11, ESI†), an important result to consider when handling these optoelectronic materials under typical laboratory conditions. Monitoring the photoisomerization of 2-Z with 1H NMR yields similar results to compound 1 (Fig. 4b). The assigned signals for 2-Z (bottom) duplicate upon irradiation with 450 nm light (top). A mixture of 51/49 2-Z/2-E was obtained upon irradiation to a photostationary state with 450 nm light. The PSS composition of 2 is wavelength-dependent as well, resulting in a mixture of 69/31 2-Z/2-E ratio under ultraviolet irradiation (Fig. S13, ESI†), and a mixture of 79/21 2-Z/2-E isomer under ambient light exposure (Fig. S14, ESI†). Preliminary evidence suggests that the rate of the thermal back reaction for 1 and 2 is slow in chloroform-d. Allowing a previously irradiated sample to sit in the dark for 48 hours at room temperature yields no measurable change in the position of the PSS based on the 1H NMR integral values for 1 or 2. However, more studies are needed in order to accurately quantify the rate of the thermal E → Z isomerization in the dark. The photophysical properties of 1 and 2 are summarized in Table 1. The UV-vis spectra for 1-Z and 2-Z were measured in chloroform (Fig. 5). The absorption maxima (λmax) for 1-Z and 2-Z lie at 412 nm and 477 nm, respectively, and are attributed to HOMO–LUMO transitions which have previously been classified as π–π* intramolecular charge transfer (ITC) bands for π-conjugated aryl- and tetrathiafulvalene-based structures functionalized with RCN,1 and materials functionalized with similar acceptors such as cyanoacrylic acid, rhodanine, and double rhodanine units.93 The secondary excitations at 294 nm (1-Z) and 330 nm (2-Z) are HOMO−1 to LUMO transitions also of π–π* character, an assignment made by visual inspection of the frontier molecular orbitals (Fig. S20 and S21,† ESI). As pure samples 1-E or 2-E could not be isolated, the UV-vis spectra of 1 and 2 were simulated using time-dependent (TD-DFT) calculations to gain insight into how the olefin stereochemistry of RCN-functionalized compounds influences the optical and electronic properties of the systems (Fig. 6). The excited state calculations were conducted using a range-separated hybrid functional (CAM-B3LYP) and an augmented double zeta basis set (aug-cc-pVDZ) which has proven adequate for similar push–pull systems.94,95 All solubilizing octyl chains were truncated to methyl groups to reduce the computational cost. In general, the simulated UV-vis spectra for 1 and 2 predict that the Z and E isomers display very similar absorption profiles with significant spectral overlap in both primary and secondary absorption bands. For 1-Z, the λmax absorbance lies at 359 nm and the secondary absorbance is at 274 nm. An 11 nm red-shift was observed for 1-E (λmax = 370 nm) compared to 1-Z accompanied by an increase in molar absorptivity from 1-Z (ε = 3.38 × 10⁴ L mol−1 cm−1) to 1-E (ε = 3.69 × 10⁴ L mol−1 cm−1) in the HOMO–LUMO transition. In the UV region, a notable decrease in secondary absorbance was observed for 1-E accompanied by a 6 nm blue-shift. The calculated spectra for compound 2 show similar trends. The absorption maxima are predicted to lie at 425 nm (2-Z) and 433 nm (2-E), accompanied by a 15.2% increase in molar absorptivity from 4.20 × 10⁴ L mol−1 cm−1 to 4.84 × 10⁴ L mol−1 cm−1. In the UV region, a decrease in absorbance of 2-E was observed, along with a 24 nm blue shift in the secondary maxima for 2-E (272 nm) compared to 2-Z (296 nm).
Experimental and calculated photophysical properties of 1 and 2.
| Model compound | λ max a (nm)/εb | λ max c (nm)/εb | PSS (Z/E)@λirr | |||
|---|---|---|---|---|---|---|
| Z | Z | E | 254 nmd | 450 nme | Ambiente | |
| 1 | 412/34 300 | 359/33 800 | 370/36 900 | 56/44 | 98/2f | 89/11 |
| 2 | 477/41 800 | 425/42 000 | 433/48 400 | 69/31 | 51/49 | 79/21 |
UV-vis measured as 20 μM solutions in chloroform in 1 cm quartz cell.
Molar extinction coefficients (ε) reported in L mol−1 cm−1.
Gas-phase time-dependent DFT calculated absorption profiles (CAM-B3LYP/aug-cc-pVDZ).
Photostationary state compositions reported as the average of four separate measurements (standard error: <1%).
Photostationary state compositions reported as a single measurement.
450 nm irradiation resulted in various photoproducts and photodegradation not consistent with Z/E photoisomerization.
Fig. 5. Experimental absorption spectra of 1-Z (black) and 2-Z (red).

Fig. 6. Time dependent DFT-predicted UV-vis spectra of 1-Z (black, solid), 1-E (black, dashed), 2-Z (red, solid) and 2-E (red, dashed) at the CAM-B3LYP/aug-cc-pVDZ level.

To validate the DFT-simulated absorption profile trends, the photoisomerization of 2-Z was monitored experimentally by UV-vis spectroscopy. Upon LED exposure (λirr = 450 nm) of 2-Z in chloroform (20 μM), a continuous change in the original absorption profile was observed until the photostationary state was reached, and no further spectral changes occurred (Fig. 7a). The observed change in the UV-vis spectrum is attributed to Z → E photoisomerization, resulting in a mixture of 2-Z and 2-E at the PSS. The marked UV-vis spectra shows a 5 nm red-shift in absorption maxima going from pure 2-Z (0 s) to the PSS mixture (8 s) upon irradiation, accompanied by a 9.2% increase in absorbance, in excellent agreement with the TD-DFT predicted trends. A decrease in absorbance at the secondary transition (330 nm) was observed, along with an increase in absorbance in the higher energy UV region. The presence of isosbestic points at ca. 460 nm and 300 nm indicate the transition between two major species in solution, although other processes such as photo-oxidation and photo-degradation might result in similar observations.90 In order to exclude these possibilities, and to verify that the observed spectral changes are attributed to photoisomerization, we tested the reversible nature of this reaction. By exposing the PSS mixture of 2 to a longer wavelength of irradiation (λirr = 525 nm), and thus changing excitation to a region where the previous increase in absorbance was observed, a gradual restoration of the original spectral features occurs (Fig. 7b). Switching to a longer wavelength promotes the reverse reaction (E → Z) until a new photostationary state is reached for 2, this time featuring a larger excess of 2-Z as compared to the mixture obtained under 450 nm irradiation. A photoswitching experiment for compound 2 was completed by alternating between a 450 nm irradiation (Z → E) and 525 nm irradiation (E → Z). Interestingly, the system appears highly fatigue resistant, and the photoswitching is facile (Fig. 8). Indeed, even after ten photoswitching cycles there was very little indication of photo-degradation, evidenced by a negligible decrease in maximum absorbance values over numerous cycles. This photo- and thermal stability is encouraging us to consider structural or electronic engineering of RCN derivatives to address the currently large overlap in absorption between the Z and E isomers (especially given the current interest in utilizing photochromic molecules as functioning components of organic materials96–98). Conducting the same photoswitching experiment for compound 1 and 2 under ultraviolet irradiation (λirr = 254 nm), however, resulted in significant photodegradation (Fig. S16 and S17, ESI†), with the difference between NMR and UV-vis irradiation conditions being the medium of the solution container (glass versus quartz).99 This observation was verified by irradiating 1-Z with 254 nm light in a quartz NMR tube, which also resulted in significant photodegradation (Fig. S10, ESI†).
Fig. 7. (a) UV-vis spectra of 2-Z in chloroform upon irradiation with 450 nm light, (b) UV-vis spectra of previously irradiated solution of 2-Z/E (λirr = 450 nm) upon subsequent 525 nm irradiation with green LED light.

Fig. 8. Photoswitching cycles of 2 in chloroform upon alternating the irradiation wavelength from 450 nm and 525 nm light.

The ground-state Z/E configurations and conformational preferences of 1 and 2 were investigated with ground-state DFT calculations at the B3LYP/6-31+G(d) level of theory. Compounds 1 and 2 were modelled in the Z and E isomeric forms, namely, 1-Z, 1-E, 2-Z, and 2-E. In addition, a conformational analysis was completed by modelling the two lowest energy conformations for each structure (Fig. S18, ESI†). The lowest energy conformer (CA) is depicted in Fig. 2 for the Z and E isomers of 1 and 2. The other low energy conformer (CB) represents a 180° rotation about the sigma bond between the thiophene and the isomerizable olefin (C4–C5 bond in Fig. 3, see Fig. S18 in ESI† for more details). For 1 and 2, the Z configurational isomer adopting conformation A has the lowest energy of all species, always less than 1 kcal mol−1 below the other possible conformations (Table S1, ESI†). The same energy trend was observed for the respective E isomers, where compound 1-E in conformation A is 0.56 kcal mol−1 lower in energy than compound 1-E adopting conformation B, and compound 2-E in conformation A is 0.81 kcal mol−1 lower in energy compared to 2-E adopting the second conformation. The energy differences between the configurational isomers (Z and E isomers), however, are much more significant. For 1, the lowest energy conformer in the Z configuration (1-Z, CA) is 3.39 kcal mol−1 more stable than the lowest energy conformer adopting the E configuration (1-E, CA). Likewise, for compound 2, the lowest energy conformer in the Z configuration (2-Z, CA) is predicted to be 3.33 kcal mol−1 more stable than the lowest energy conformer in the E configuration (2-E, CA). A predicted increase in dipole moment was observed going from the Z configuration to the E configuration for 1 and 2. 1-Z is predicted to have a dipole moment of 8.1 D in conformation A compared to the dipole moment of 1-E, which is 8.9 D in conformation A. Similarly, for compound 2, we observe a dipole moment of 8.5 D for 2-Z (CA) and 10.5 D for compound 2 in the E configuration (2-E, CA). The increased dipole moment going from Z to E agrees well with TLC analysis for 1 and 2, wherein irradiation of a pure TLC sample (Z isomer) always results in the formation of a new, more polar spot (E isomer) after irradiation (Fig. S8, ESI†). The DFT evidence concerning relative energies of Z and E isomers is also in agreement with experiment, as both 1 and 2 were isolated from the synthesis as the Z isomer.
Conclusions
Analysis of 1 and 2 has shown that the thermodynamically stable Z isomers are obtained as the only detectable stereoisomers of the Knoevenagel condensation reaction. The Z configurational stereochemistry was confirmed for 1 by 2D NMR and X-ray crystallography. The relative energies regarding configurational Z/E stereochemistry, and the lowest energy conformers in each case, were evaluated for substrates 1 and 2via ground-state DFT calculations. In addition, we have shown that dicyanorhodanine (RCN) functionalized thiophenes are photolabile, and susceptible to Z/E isomerization. The Z/E isomerization of 1 and 2 was monitored by 1H NMR and the photostationary state (PSS) Z/E compositions were quantified under various wavelengths of irradiation for each substrate. The Z/E isomerization of substrate 2 was monitored by UV-vis spectroscopy, which confirmed that the Z and E isomers of compound 2 exhibit strong overlap in the primary and secondary optical absorption bands, a characteristic which was further supported by excited state (TD-DFT) simulations. The reverse photoisomerization (E → Z) of 2 was demonstrated by UV-vis, and the compound displayed little evidence of photodegradation after 10 photoswitching cycles. Next we plan to synthesize a small library of RCN-functionalized oligothiophenes to gain further understanding of the structure–property relationships governing the isomerization. In addition, we plan to quantify thermodynamic and kinetic parameters relevant to the isomerization process in an attempt to better understand these systems.
The photoisomerization of two commonly used acceptor units for DSSC applications have previously been reported in the literature.88–90 We now report the photoisomerization of the popular dicyanorhodanine (RCN) acceptor. While the photoswitching capabilities of this system do not currently rival azobenzenes or stilbenes,100,101 RCN can only now be considered for the engineering of organic soft materials whose properties or functions can be tuned via photochromic switching by external stimuli.98 The photoisomerization is quite relevant to the organic photovoltaic community,91 given the use of RCN in donor materials and non-fullerene acceptor (NFA) materials for bulk-heterojunction (BHJ) solar cell devices. Underway in our laboratory are solid state studies and device characterization to determine the influence of olefin stereochemistry and Z/E photoisomerization on thin film morphology, charge mobility, and solar cell metrics. It is possible that other acceptor units popular within the organic materials literature may be prone to photoisomerization as well, and work in this direction is also ongoing in our laboratory. As a community, we must remain vigilant of the stereochemistry and photochemistry of these useful systems.
Conflicts of interest
There are no conflicts to declare.
Supplementary Material
Acknowledgments
Acknowledgment is made to National Science Foundation for funding support of this research (CHE-1904534). C. T. K wishes to acknowledge the University of Florida (UF) Department of Chemistry for providing the Graduate School Fellowship (GSF) which made this research possible. K. A. A wishes to acknowledge the National Science Foundation and the University of Florida for funding the purchase of X-ray equipment (CHE-1828064). We acknowledge the University of Florida Research Computing for providing computational resources and support that have contributed to the research results reported in this publication (https://www.rc.ufl.edu). The mass spectrometric data were obtained by the UF Department of Chemistry Mass Spectrometry Research and Education Center supported, in part, by the National Institutes of Health (NIH S10OD021758-01A1). We would also like to thank the UF Center for Nuclear Magnetic Resonance Spectroscopy for providing equipment and support that have contributed to these published results.
Electronic supplementary information (ESI) available: Synthesis and structural characterization, 2D NMR characterization, thin-layer chromatography (TLC) characterization, NMR and UV-vis photoisomerization studies, and computational details. CCDC 2022503. For ESI and crystallographic data in CIF or other electronic format see DOI: 10.1039/d0sc04409a
Notes and references
- Insuasty A. Ortiz A. Tigreros A. Solarte E. Insuasty B. Martín N. Dyes Pigm. 2011;88:385–390. doi: 10.1016/j.dyepig.2010.08.011. [DOI] [Google Scholar]
- Kan B. Li M. Zhang Q. Liu F. Wan X. Wang Y. Ni W. Long G. Yang X. Feng H. Zuo Y. Zhang M. Huang F. Cao Y. Russell T. P. Chen Y. J. Am. Chem. Soc. 2015;137:3886–3893. doi: 10.1021/jacs.5b00305. [DOI] [PubMed] [Google Scholar]
- Sandoval-Torrientes R. Calbo J. García-Fresnadillo D. Santos J. Ortí E. Martín N. Org. Chem. Front. 2017;4:1024–1028. doi: 10.1039/C6QO00760K. [DOI] [Google Scholar]
- Privado M. de la Cruz P. Biswas S. Singhal R. Sharma G. D. Langa F. J. Mater. Chem. A. 2018;6:11714–11724. doi: 10.1039/C8TA02633E. [DOI] [Google Scholar]
- Fan Q. Li M. Yang P. Liu Y. Xiao M. Wang X. Tan H. Wang Y. Yang R. Zhu W. Dyes Pigm. 2015;116:13–19. doi: 10.1016/j.dyepig.2015.01.006. [DOI] [Google Scholar]
- Mao J. He N. Ning Z. Zhang Q. Guo F. Chen L. Wu W. Hua J. Tian H. Angew. Chem., Int. Ed. 2012;51:9873–9876. doi: 10.1002/anie.201204948. [DOI] [PubMed] [Google Scholar]
- Jin B. Wu W. Zhang X. Guo F. Zhang Q. Hua J. Chem. Lett. 2013;42:1271–1272. doi: 10.1246/cl.130569. [DOI] [Google Scholar]
- Echeverry C. A. Insuasty A. Herranz M. Á. Ortíz A. Cotta R. Dhas V. Echegoyen L. Insuasty B. Martín N. Dyes Pigm. 2014;107:9–14. doi: 10.1016/j.dyepig.2014.03.010. [DOI] [Google Scholar]
- Arteaga D. Cotta R. Ortiz A. Insuasty B. Martin N. Echegoyen L. Dyes Pigm. 2015;112:127–137. doi: 10.1016/j.dyepig.2014.06.028. [DOI] [Google Scholar]
- Wu Z. Li X. Li J. Hua J. Ågren H. Tian H. Chem.–Asian J. 2014;9:3549–3557. doi: 10.1002/asia.201402608. [DOI] [PubMed] [Google Scholar]
- Ju Z.-M. Jia H.-L. Ju X.-H. Zhou X.-F. Shi Z.-Q. Zheng H.-G. Zhang M.-D. RSC Adv. 2015;5:3720–3727. doi: 10.1039/C4RA13782E. [DOI] [Google Scholar]
- Jia H. Ju X. Zhang M. Ju Z. Zheng H. Phys. Chem. Chem. Phys. 2015;17:16334–16340. doi: 10.1039/C5CP02194D. [DOI] [PubMed] [Google Scholar]
- Zhao D.-X. Bian L.-Y. Luo Y.-X. Zhang M.-D. Cao H. Chen M.-D. Dyes Pigm. 2017;140:278–285. doi: 10.1016/j.dyepig.2017.01.051. [DOI] [Google Scholar]
- Jia H.-L. Zhang M.-D. Ju Z.-M. Zheng H.-G. Ju X.-H. J. Mater. Chem. A. 2015;3:14809–14816. doi: 10.1039/C5TA01857A. [DOI] [Google Scholar]
- Chen K.-W. Huang C.-W. Lin S.-Y. Liu Y.-H. Chatterjee T. Hung W.-Y. Liu S.-W. Wong K.-T. Org. Electron. 2015;26:319–326. doi: 10.1016/j.orgel.2015.07.050. [DOI] [Google Scholar]
- Wang W. Shen P. Dong X. Weng C. Wang G. Bin H. Zhang J. Zhang Z.-G. Li Y. ACS Appl. Mater. Interfaces. 2017;9:4614–4625. doi: 10.1021/acsami.6b14114. [DOI] [PubMed] [Google Scholar]
- Yin X. An Q. Yu J. Xu Z. Deng P. Geng Y. Zhou B. Zhang F. Tang W. Dyes Pigm. 2017;140:512–519. doi: 10.1016/j.dyepig.2016.10.040. [DOI] [Google Scholar]
- Furukawa S. Komiyama H. Aizawa N. Yasuda T. ACS Appl. Mater. Interfaces. 2018;10:42756–42765. doi: 10.1021/acsami.8b17056. [DOI] [PubMed] [Google Scholar]
- Wang W. Zhang G. Guo J. Gu Z. Hao R. Lin Z. Qian Y. Zhu M. Xia H. Peng W. Liu X. Peng Q. Zhu W. ACS Appl. Energy Mater. 2019;2:4730–4736. doi: 10.1021/acsaem.9b00303. [DOI] [Google Scholar]
- Gu Z. Guo J. Hao R. Lin Z. Qian Y. Ma C. Fan Y. Deng X. Zhang G. Peng W. Xia H. Peng Q. Zhu W. Dyes Pigm. 2019;166:515–522. doi: 10.1016/j.dyepig.2019.03.050. [DOI] [Google Scholar]
- Zhang Q. Wang Y. Kan B. Wan X. Liu F. Ni W. Feng H. Russell T. P. Chen Y. Chem. Commun. 2015;51:15268–15271. doi: 10.1039/C5CC06009E. [DOI] [PubMed] [Google Scholar]
- Kan B. Zhang Q. Wan X. Ke X. Wang Y. Feng H. Zhang M. Chen Y. Org. Electron. 2016;38:172–179. doi: 10.1016/j.orgel.2016.08.014. [DOI] [Google Scholar]
- Wang X. Kan B. Kuang Z. Song H. Long G. Guo Q. Chen Y. Xia A. J. Phys. Chem. C. 2018;122:26851–26856. doi: 10.1021/acs.jpcc.8b08537. [DOI] [Google Scholar]
- Long G. Li A. Shi R. Zhou Y.-C. Yang X. Zuo Y. Wu W.-R. Jeng U. S. Wang Y. Wan X. Shen P. Zhang H.-L. Yan T. Chen Y. Adv. Electron. Mater. 2015;1:1500217. doi: 10.1002/aelm.201500217. [DOI] [Google Scholar]
- Long G. Wu B. Yang X. Kan B. Zhou Y.-c. Chen L.-c. Wan X. Zhang H.-l. Sum T. C. Chen Y. ACS Appl. Mater. Interfaces. 2015;7:21245–21253. doi: 10.1021/acsami.5b05317. [DOI] [PubMed] [Google Scholar]
- Zuo Y. Zhang Q. Wan X. Li M. Zhang H. Li C. Chen Y. Org. Electron. 2015;19:98–104. doi: 10.1016/j.orgel.2015.01.035. [DOI] [Google Scholar]
- Peng J. Chen Y. Wu X. Zhang Q. Kan B. Chen X. Chen Y. Huang J. Liang Z. ACS Appl. Mater. Interfaces. 2015;7:13137–13141. doi: 10.1021/acsami.5b03073. [DOI] [PubMed] [Google Scholar]
- Long G. Shi R. Zhou Y. Li A. Kan B. Wu W.-R. Jeng U. S. Xu T. Yan T. Zhang M. Yang X. Ke X. Sun L. Gray-Weale A. Wan X. Zhang H. Li C. Wang Y. Chen Y. J. Phys. Chem. C. 2017;121:5864–5870. doi: 10.1021/acs.jpcc.6b11824. [DOI] [Google Scholar]
- Zhou Y. Long G. Li A. Gray-Weale A. Chen Y. Yan T. J. Mater. Chem. C. 2018;6:3276–3287. doi: 10.1039/C7TC05290A. [DOI] [Google Scholar]
- Min J. Jiao X. Sgobba V. Kan B. Heumüller T. Rechberger S. Spiecker E. Guldi D. M. Wan X. Chen Y. Ade H. Brabec C. J. Nano Energy. 2016;28:241–249. doi: 10.1016/j.nanoen.2016.08.047. [DOI] [Google Scholar]
- Long G. Wu B. Solanki A. Yang X. Kan B. Liu X. Wu D. Xu Z. Wu W.-R. Jeng U. S. Lin J. Li M. Wang Y. Wan X. Sum T. C. Chen Y. Adv. Energy Mater. 2016;6:1600961. doi: 10.1002/aenm.201600961. [DOI] [Google Scholar]
- An Q. Zhang F. Yin X. Sun Q. Zhang M. Zhang J. Tang W. Deng Z. Nano Energy. 2016;30:276–282. doi: 10.1016/j.nanoen.2016.10.021. [DOI] [Google Scholar]
- Liang N. Meng D. Ma Z. Kan B. Meng X. Zheng Z. Jiang W. Li Y. Wan X. Hou J. Ma W. Chen Y. Wang Z. Adv. Energy Mater. 2017;7:1601664. doi: 10.1002/aenm.201601664. [DOI] [Google Scholar]
- Min J. Güldal N. S. Guo J. Fang C. Jiao X. Hu H. Heumüller T. Ade H. Brabec C. J. J. Mater. Chem. A. 2017;5:18101–18110. doi: 10.1039/C7TA04769J. [DOI] [Google Scholar]
- Cheacharoen R. Mateker W. R. Zhang Q. Kan B. Sarkisian D. Liu X. Love J. A. Wan X. Chen Y. Nguyen T.-Q. Bazan G. C. McGehee M. D. Sol. Energy Mater. Sol. Cells. 2017;161:368–376. doi: 10.1016/j.solmat.2016.12.021. [DOI] [Google Scholar]
- Wang Y. Chang M. Kan B. Wan X. Li C. Chen Y. ACS Appl. Energy Mater. 2018;1:2150–2156. doi: 10.1021/acsaem.8b00205. [DOI] [Google Scholar]
- Babics M. Duan T. Balawi A. H. Liang R.-Z. Cruciani F. Carja I.-D. Gottlieb D. McCulloch I. Vandewal K. Laquai F. Beaujuge P. M. ACS Appl. Energy Mater. 2019;2:2717–2722. doi: 10.1021/acsaem.8b02020. [DOI] [Google Scholar]
- Zhang Q. Kan B. Liu F. Long G. Wan X. Chen X. Zuo Y. Ni W. Zhang H. Li M. Hu Z. Huang F. Cao Y. Liang Z. Zhang M. Russell T. P. Chen Y. Nat. Photonics. 2015;9:35–41. doi: 10.1038/nphoton.2014.269. [DOI] [Google Scholar]
- Zhang M. Zhang F. An Q. Sun Q. Wang W. Ma X. Zhang J. Tang W. J. Mater. Chem. A. 2017;5:3589–3598. doi: 10.1039/C7TA00211D. [DOI] [Google Scholar]
- Qiu N. Yang X. Zhang H. Wan X. Li C. Liu F. Zhang H. Russell T. P. Chen Y. Chem. Mater. 2016;28:6770–6778. doi: 10.1021/acs.chemmater.6b03323. [DOI] [Google Scholar]
- Ye P. Chen Y. Wu J. Wu X. Yu S. Xing W. Liu Q. Jia X. Peng A. Huang H. J. Mater. Chem. C. 2017;5:12591–12596. doi: 10.1039/C7TC04669C. [DOI] [Google Scholar]
- Privado M. Cuesta V. de la Cruz P. Keshtov M. L. Sharma G. D. Langa F. J. Mater. Chem. A. 2017;5:14259–14269. doi: 10.1039/C7TA03815A. [DOI] [Google Scholar]
- Suman Gupta V. Bagui A. Singh S. P. Adv. Funct. Mater. 2017;27:1603820. doi: 10.1002/adfm.201603820. [DOI] [Google Scholar]
- Yang Y. Wang J. Xu H. Zhan X. Chen X. ACS Appl. Mater. Interfaces. 2018;10:18984–18992. doi: 10.1021/acsami.8b04541. [DOI] [PubMed] [Google Scholar]
- Xu H. Yang Y. Zhong C. Zhan X. Chen X. J. Mater. Chem. A. 2018;6:6393–6401. doi: 10.1039/C8TA00704G. [DOI] [Google Scholar]
- Qu J. Mu Z. Lai H. Chen H. Liu T. Zhang S. Chen W. He F. ACS Appl. Energy Mater. 2018;1:4724–4730. doi: 10.1021/acsaem.8b00851. [DOI] [Google Scholar]
- Radford C. L. Hendsbee A. D. Abdelsamie M. Randell N. M. Li Y. Toney M. F. Kelly T. L. ACS Appl. Energy Mater. 2018;1:6513–6523. doi: 10.1021/acsaem.8b01433. [DOI] [Google Scholar]
- Liu R. Du Z. Wen S. Wu Y. Zhu D. Yang R. Synth. Met. 2018;235:131–135. doi: 10.1016/j.synthmet.2017.12.005. [DOI] [Google Scholar]
- Xiao B. Tang A. Zhang Q. Li G. Wang X. Zhou E. ACS Appl. Mater. Interfaces. 2018;10:34427–34434. doi: 10.1021/acsami.8b10312. [DOI] [PubMed] [Google Scholar]
- Tang A. Xiao B. Wang Y. Gao F. Tajima K. Bin H. Zhang Z.-G. Li Y. Wei Z. Zhou E. Adv. Funct. Mater. 2018;28:1704507. doi: 10.1002/adfm.201704507. [DOI] [Google Scholar]
- Zhang Q. Xiao B. Du M. Li G. Tang A. Zhou E. J. Mater. Chem. C. 2018;6:10902–10909. doi: 10.1039/C8TC03963A. [DOI] [Google Scholar]
- Wang P. Fan H. Zhu X. Dyes Pigm. 2018;155:179–185. doi: 10.1016/j.dyepig.2018.03.032. [DOI] [Google Scholar]
- Peng W. Zhang G. Shao L. Ma C. Zhang B. Chi W. Peng Q. Zhu W. J. Mater. Chem. A. 2018;6:24267–24276. doi: 10.1039/C8TA09370A. [DOI] [Google Scholar]
- Wang J. Li T. Wang X. Xiao Y. Zhong C. Wang J. Liu K. Lu X. Zhan X. Chen X. ACS Appl. Mater. Interfaces. 2019;11:26005–26016. doi: 10.1021/acsami.9b08007. [DOI] [PubMed] [Google Scholar]
- Suman Siddiqui A. Keshtov M. L. Sharma G. D. Singh S. P. J. Mater. Chem. C. 2019;7:543–552. doi: 10.1039/C8TC05318A. [DOI] [Google Scholar]
- Xie L. Xiao J. Wu L. Zhang W. Ge Z. Tan S. Dyes Pigm. 2019;168:197–204. doi: 10.1016/j.dyepig.2019.04.064. [DOI] [Google Scholar]
- Chen Y. Jiang X. Chen X. Zhou J. Tang A. Geng Y. Guo Q. Zhou E. Macromolecules. 2019;52:8625–8630. doi: 10.1021/acs.macromol.9b01569. [DOI] [Google Scholar]
- Xiao B. Du M. Wang X. Xiao Z. Li G. Tang A. Ding L. Geng Y. Sun X. Zhou E. ACS Appl. Mater. Interfaces. 2020;12:1094–1102. doi: 10.1021/acsami.9b16662. [DOI] [PubMed] [Google Scholar]
- Liu F. Zhou Z. Zhang C. Vergote T. Fan H. Liu F. Zhu X. J. Am. Chem. Soc. 2016;138:15523–15526. doi: 10.1021/jacs.6b08523. [DOI] [PubMed] [Google Scholar]
- Zhang G. Yang G. Yan H. Kim J.-H. Ade H. Wu W. Xu X. Duan Y. Peng Q. Adv. Mater. 2017;29:1606054. doi: 10.1002/adma.201606054. [DOI] [PubMed] [Google Scholar]
- Wu W. Zhang G. Xu X. Wang S. Li Y. Peng Q. Adv. Funct. Mater. 2018;28:1707493. doi: 10.1002/adfm.201707493. [DOI] [Google Scholar]
- Tang A. Song W. Xiao B. Guo J. Min J. Ge Z. Zhang J. Wei Z. Zhou E. Chem. Mater. 2019;31:3941–3947. doi: 10.1021/acs.chemmater.8b05316. [DOI] [Google Scholar]
- Zhang J. Liu F. Chen S. Yang C. Zhu X. Zhu D. Macromol. Rapid Commun. 2019;40:1800393. doi: 10.1002/marc.201800393. [DOI] [PubMed] [Google Scholar]
- Privado M. de la Cruz P. Gupta G. Singhal R. Sharma G. D. Langa F. Sol. Energy. 2020;199:530–537. doi: 10.1016/j.solener.2020.02.057. [DOI] [Google Scholar]
- Jiang W. Yu R. Liu Z. Peng R. Mi D. Hong L. Wei Q. Hou J. Kuang Y. Ge Z. Adv. Mater. 2018;30:1703005. doi: 10.1002/adma.201703005. [DOI] [PubMed] [Google Scholar]
- Xu X. Bi Z. Ma W. Wang Z. Choy W. C. H. Wu W. Zhang G. Li Y. Peng Q. Adv. Mater. 2017;29:1704271. doi: 10.1002/adma.201704271. [DOI] [PubMed] [Google Scholar]
- Liao Z. Wang Y. An Y. Tan Y. Meng X. Wu F. Chen L. Chen Y. Macromol. Rapid Commun. 2018;39:1700706. doi: 10.1002/marc.201700706. [DOI] [PubMed] [Google Scholar]
- Chen D. Yao J. Chen L. Yin J. Lv R. Huang B. Liu S. Zhang Z.-G. Yang C. Chen Y. Li Y. Angew. Chem., Int. Ed. 2018;57:4580–4584. doi: 10.1002/anie.201800035. [DOI] [PubMed] [Google Scholar]
- Liu S. Chen D. Zhou W. Yu Z. Chen L. Liu F. Chen Y. Macromolecules. 2019;52:4359–4369. doi: 10.1021/acs.macromol.9b00411. [DOI] [Google Scholar]
- Miao J. Du M. Fang Y. Zhang F. Nanoscale. 2019;11:16406–16413. doi: 10.1039/C9NR03552D. [DOI] [PubMed] [Google Scholar]
- Kim M. J. Lee Y. W. Lee Y. Woo H. Y. Ho Cho J. J. Mater. Chem. C. 2018;6:5698–5706. doi: 10.1039/C8TC01547C. [DOI] [Google Scholar]
- Insuasty B. Insuasty A. Tigreros A. Quiroga J. Abonia R. Nogueras M. Cobo J. Derita M. Zacchino S. J. Heterocycl. Chem. 2011;48:347–350. doi: 10.1002/jhet.565. [DOI] [Google Scholar]
- Abdul-kader Saleh N. El-abd Saltani H. Abbas Al-Issa F. Gomaa Melad A.-S. J. Chin. Chem. Soc. 2013;60:1234–1240. doi: 10.1002/jccs.201300048. [DOI] [Google Scholar]
- Abdul-Kader Saleh N. El-Abd Saltani H. Abbas Al-Issa F. Abul-kasem Errabie A. Gomaa Melad A.-S. J. Chin. Chem. Soc. 2013;60:1353–1358. doi: 10.1002/jccs.201300048. [DOI] [Google Scholar]
- Ohishi Y. Mukai T. Nagahara M. Yajima M. Kajikawa N. Miyahara K. Takano T. Chem. Pharm. Bull. 1990;38:1911–1919. doi: 10.1248/cpb.38.1911. [DOI] [PubMed] [Google Scholar]
- Whitesitt C. A. Simon R. L. Reel J. K. Sigmund S. K. Phillips M. L. Kevin Shadle J. Heinz L. J. Koppel G. A. Hunden D. C. Lifer S. L. Berry D. Ray J. Little S. P. Xiadong L. Marshall W. S. Panetta J. A. Bioorg. Med. Chem. Lett. 1996;6:2157–2162. doi: 10.1016/0960-894X(96)00393-9. [DOI] [Google Scholar]
- Sing W. T. Lee C. L. Yeo S. L. Lim S. P. Sim M. M. Bioorg. Med. Chem. Lett. 2001;11:91–94. doi: 10.1016/S0960-894X(00)00610-7. [DOI] [PubMed] [Google Scholar]
- Suman Bagui A. Garg A. Tyagi B. Gupta V. Singh S. P. Chem. Commun. 2018;54:4001–4004. doi: 10.1039/C7CC08440D. [DOI] [PubMed] [Google Scholar]
- Yang Y. Zhang Z.-G. Bin H. Chen S. Gao L. Xue L. Yang C. Li Y. J. Am. Chem. Soc. 2016;138:15011–15018. doi: 10.1021/jacs.6b09110. [DOI] [PubMed] [Google Scholar]
- Wang J. Zhang J. Xiao Y. Xiao T. Zhu R. Yan C. Fu Y. Lu G. Lu X. Marder S. R. Zhan X. J. Am. Chem. Soc. 2018;140:9140–9147. doi: 10.1021/jacs.8b04027. [DOI] [PubMed] [Google Scholar]
- Mahmood A. Tang A. Wang X. Zhou E. Phys. Chem. Chem. Phys. 2019;21:2128–2139. doi: 10.1039/C8CP05763J. [DOI] [PubMed] [Google Scholar]
- Zerdan R. B. Shewmon N. T. Zhu Y. Mudrick J. P. Chesney K. J. Xue J. Castellano R. K. Adv. Funct. Mater. 2014;24:5993–6004. doi: 10.1002/adfm.201401030. [DOI] [Google Scholar]
- Mikie T. Saeki A. Yamazaki Y. Ikuma N. Kokubo K. Seki S. ACS Appl. Mater. Interfaces. 2015;7:8915–8922. doi: 10.1021/acsami.5b01818. [DOI] [PubMed] [Google Scholar]
- Liu H. Liu Z.-X. Wang S. Huang J. Ju H. Chen Q. Yu J. Chen H. Li C.-Z. Adv. Energy Mater. 2019;9:1900887. doi: 10.1002/aenm.201900887. [DOI] [Google Scholar]
- Ghosh T. Nagasawa S. Raveendran N. Darshan V. Saeki A. Nair V. C. Chem.–Asian J. 2019;14:963–967. doi: 10.1002/asia.201900024. [DOI] [PubMed] [Google Scholar]
- Fitzner R. Elschner C. Weil M. Uhrich C. Körner C. Riede M. Leo K. Pfeiffer M. Reinold E. Mena-Osteritz E. Bäuerle P. Adv. Mater. 2012;24:675–680. doi: 10.1002/adma.201104439. [DOI] [PubMed] [Google Scholar]
- Morel D. L. Stogryn E. L. Ghosh A. K. Feng T. Purwin P. E. Shaw R. F. Fishman C. Bird G. R. Piechowski A. P. J. Phys. Chem. 1984;88:923–933. doi: 10.1021/j150649a019. [DOI] [Google Scholar]
- El-Zohry A. Orthaber A. Zietz B. J. Phys. Chem. C. 2012;116:26144–26153. doi: 10.1021/jp306636w. [DOI] [PMC free article] [PubMed] [Google Scholar]
- El-Zohry A. M. Zietz B. J. Phys. Chem. C. 2013;117:6544–6553. doi: 10.1021/jp400782g. [DOI] [Google Scholar]
- Zietz B. Gabrielsson E. Johansson V. El-Zohry A. M. Sun L. Kloo L. Phys. Chem. Chem. Phys. 2014;16:2251–2255. doi: 10.1039/C3CP54048K. [DOI] [PubMed] [Google Scholar]
- Liu H. Li Z. a. Zhao D. Sci. China Mater. 2019;62:1574–1596. doi: 10.1007/s40843-019-9465-4. [DOI] [Google Scholar]
- Norton Matos M. R. P. Gois P. M. P. Mata M. L. E. N. Cabrita E. J. Afonso C. A. M. Synth. Commun. 2003;33:1285–1299. doi: 10.1081/SCC-120018688. [DOI] [Google Scholar]
- Le Bahers T. Pauporté T. Scalmani G. Adamo C. Ciofini I. Phys. Chem. Chem. Phys. 2009;11:11276–11284. doi: 10.1039/B914626A. [DOI] [PubMed] [Google Scholar]
- Jacquemin D. Planchat A. Adamo C. Mennucci B. J. Chem. Theory Comput. 2012;8:2359–2372. doi: 10.1021/ct300326f. [DOI] [PubMed] [Google Scholar]
- Ali A. Rafiq M. I. Zhang Z. Cao J. Geng R. Zhou B. Tang W. Phys. Chem. Chem. Phys. 2020;22:7864–7874. doi: 10.1039/D0CP00060D. [DOI] [PubMed] [Google Scholar]
- Hou L. Zhang X. Cotella G. F. Carnicella G. Herder M. Schmidt B. M. Pätzel M. Hecht S. Cacialli F. Samorì P. Nat. Nanotechnol. 2019;14:347–353. doi: 10.1038/s41565-019-0370-9. [DOI] [PubMed] [Google Scholar]
- Guo X. Zhou J. Siegler M. A. Bragg A. E. Katz H. E. Angew. Chem., Int. Ed. 2015;54:4782–4786. doi: 10.1002/anie.201410945. [DOI] [PubMed] [Google Scholar]
- Boelke J. Hecht S. Adv. Opt. Mater. 2019;7:1900404. doi: 10.1002/adom.201900404. [DOI] [Google Scholar]
- The different photochemical behavior is due to the different UV cutoff ranges of quartz and glass
- Bandara H. M. D. Burdette S. C. Chem. Soc. Rev. 2012;41:1809–1825. doi: 10.1039/C1CS15179G. [DOI] [PubMed] [Google Scholar]
- Bao J. Weber P. M. J. Am. Chem. Soc. 2011;133:4164–4167. doi: 10.1021/ja108598w. [DOI] [PubMed] [Google Scholar]
Associated Data
This section collects any data citations, data availability statements, or supplementary materials included in this article.